


Abstract
Photovoltaic installations are becoming an increasingly popular source of electricity around the world. The decision on where and how to install the modules and their location is made at the stage of building the installation and is crucial for obtaining the most beneficial effects of its operation. The choice of installation location and its geometry directly influence the following aspects, which determine maximum efficiency and thus economic benefits: solar irradiance, working cell temperature, shading, dust and soiling. Factors that have an unfavorable impact on the efficiency of a photovoltaic installation can be divided into those that should be taken into account at the design stage, such as the correct orientation and angle of inclination of the modules, and those that will play an important role during the use of the system: contamination of the front surface of the modules. This article discusses the impact of these factors and their importance for the proper operation of a photovoltaic installation.
1. Introduction
Photovoltaic (PV) systems represent an environmentally friendly alternative to conventional power sources. These systems, which convert solar energy into electricity, are aligned with sustainable development strategies through continuous technological advancement and significant cost reductions.
Last year, 2024 saw a milestone of nearly 600 GW of global cumulative installed solar PV capacity, a 33% increase compared to the previous year. Solar energy accounted for 81% of all new renewable energy capacity added globally. It took almost 70 years to reach the first terawatt, but just two more years to double it [1].
The number of photovoltaic installations worldwide is steadily growing due to the rising price of electricity generated from burning fossil fuels and the simultaneous decline in the production costs of photovoltaic modules and other components of photovoltaic systems. To fully utilize the potential of designed and operated installations, it is necessary to consider the conditions related to the system’s location, chosen configuration, and regular maintenance.
The efficiency of a photovoltaic system depends on factors, some of which are beyond the control of the module owner, while others allow for conscious action to better utilize the system’s potential and increase the amount of energy produced, thus improving both the environmental impact and the economy.
The selection of photovoltaic modules is the first stage of PV system design. At this stage, the module manufacturing technology is decided, and thus the losses associated with this choice.
The primary factors limiting photovoltaic conversion efficiency, related to the selection of the type of photovoltaic modules, include:
- spectral factor [2],
- the mismatch between the emission characteristics of solar radiation and the absorption characteristics of the photovoltaic cell,
- the type of material from which the photovoltaic cell is made and the band gap value,
- the spectral sensitivity of the photovoltaic cell,
- the thickness of the outer layer outside the p-n region [3],
- losses resulting from a low fill factor of the current-voltage characteristic,
- losses caused by series and parallel shunt resistance [4],
- temperature coefficients of efficiency and output power.
Reducing each of these factors has significant economic significance due to the possibility of obtaining greater power from the same active cell surface area at the same incident radiation intensity by increasing photovoltaic conversion efficiency. The above-mentioned factors should be analyzed during the investor’s module selection process.
The next design stage involves deciding on the location and method of installing the modules, as well as their positioning. This is made during the construction phase and is crucial for achieving the most beneficial results.
In the next stage, system operation, the user must ensure that the modules are free from shadows and contamination, which can significantly reduce the amount of electricity generated.
Factors influencing the energy efficiency of photovoltaic modules depending on the location and conditions related to it are as follows:
- type of covering material,
- orientation and tilt angle of the module,
- type of installation (stationary or track-up),
- location (proximity to industrial plants, highways, etc.),
- operating temperature of the photovoltaic cells,
- shading,
- deposition of contaminants on the front surface of the photovoltaic module.
Some of these above-mentioned aspects will be discussed in this article.
This article highlights important aspects of photovoltaic system efficiency that should be considered by photovoltaic system designers and investors. It presents a review of the literature and summarizes the author’s extensive experience in this field.
2. The Intensity of Solar Radiation Incident on an Absorbing Plane
The intensity of solar radiation incident on a plane located on the Earth’s surface depends on the Sun’s position on the celestial sphere and the optical properties of the atmosphere. The Sun’s position is described by spherical coordinates: azimuth and solar altitude. To describe the relationships and identify optimal solutions, it is necessary to understand the phenomenon responsible for variable surface insolation. Every day, the Sun traces circles on the celestial sphere, traveling from east to west. The apparent motion of the Sun is caused by the rotation of the Earth about its axis, changes the angle at which the direct component of light will strike the Earth. The exact shape of the Sun’s trajectory varies depending on the day of the year and the location of observation. The Earth orbits the Sun in an elliptical orbit with semi-major axes of 1.4968 × 10⁸ km and 1.4966 × 10⁸ km. The Sun is at one of the foci of this ellipse.
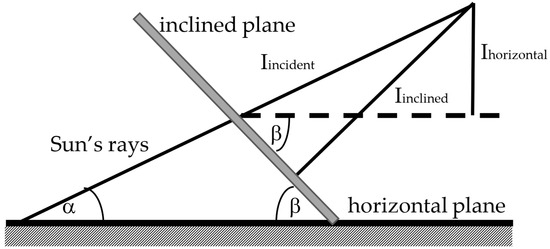
The amount of solar radiation incident on a tilted surface is a component of the incident solar radiation that is perpendicular to the surface (Iinclined).
In solar radiation data sets, sunlight is often specified as the component normal to a horizontal surface (Ihorizontal).
where α is the angle between the Sun’s rays and the horizontal plane, and β is the angle between the inclined surface and the horizontal plane (Figure 1).
Figure 1.
Incident, horizontal and inclined surface irradiation.
There are many mathematical models for calculating the intensity of solar radiation incident on a surface at a specific location and angle of inclination. Given their complexity, the solar radiation density can be estimated based on three analytical models: the Hottel and Woertz model (the simplest), the isotropic diffusion model of Liu and Jordan, and the HDKR (Hay–Davies–Klucker–Reindel) model.
The Hottel and Woertz model [5] treats the sky as a uniform source of diffuse radiation. The intensity of diffuse radiation Id, incident from the sky (in this algorithm, irradiance reflected from the ground is not included) on a tilted surface can therefore be determined based on the diffuse horizontal radiation intensity DHI and the surface inclination angle:
where
- β—surface inclination angle in degrees from 0° to 180°,
- DHI—radiation intensity incident on the horizontal surface [W/m2].
The Liu–Jordan isotropic diffuse radiation model, most commonly used in the literature, ensures relatively good convergence of calculation results with measurement results, especially for climatic conditions characterized by a high share of diffuse radiation in the total (areas with frequent cloud cover) [6]. In the isotropic Liu–Jordan model [7], solar radiation incident on an inclined surface consists of direct, diffuse, and reflected radiation. Assuming that the reflection of the diffuse radiation beam incident on the ground is isotropic, for the diffuse radiation reflection coefficient ρ (albedo) of the surroundings, the total solar radiation on a plane inclined at an angle β is:
where
- Ib, Id—direct and diffuse components of solar radiation intensity for the horizontal plane,
- Ig—component of the intensity of solar radiation reflected from the ground,
- Rb—correction factor for direct radiation.
The Hay and Davies [8] diffuse model divides the diffuse sky radiation into iso-tropic and circumsolar components. The anisotropy index A is defined as the ratio of direct normal irradiance to extraterrestrial radiation. Then total solar radiation on a plane inclined at an angle β:
In the Reindel model [9], a horizon brightening coefficient was added to the isotropic component of diffuse and circumsolar radiation. Direct and reflected radiation were defined as proposed by Liu and Jordan, and the anisotropy index A was introduced as proposed by Hay and Davies. A horizon brightening coefficient was also introduced :
If we include the beam and all the components of diffuse radiation, such as isotropic, circumsolar, and horizontal brightening, in the solar irradiance equation, a new correlation is created called the HDKR model. It is essentially a combination of the Hay–Davies and Klucker–Reindel models. The radiation incident on an inclined surface is defined as [10]:
Subsequent models were developed based on available databases and additionally took into account hourly, daily, and monthly distributions, as well as environmental factors [11,12,13,14,15].
Analysis of the Sun’s motion across the sky should provide clear guidance on selecting the optimal angle of inclination of the radiation-absorbing plane for a stationary installation.
Air transparency has a significant impact on the amount of solar radiation reaching the Earth’s surface. Air transparency decreases with the greater absorption of solar radiation by the atmosphere, which is influenced by the amount of solid and liquid particles in the air. The air transparency coefficient fluctuates throughout the day depending on meteorological conditions. The long-term average at sea level is 0.72–0.82. It is higher in winter than in summer and increases with latitude and altitude [16]. The air transparency coefficient is influenced by: geographic location, time of day and year, winds, and precipitation. The lowest values are observed in the morning due to persistent fog and pollutant accumulation, particularly in low-lying areas. During the day, wind speed typically increases in the afternoon, which improves air transparency. However, another unfavorable factor occurs: rising temperature, which increases evaporation intensity (similarly lower values of 0.45–0.7 are observed in summer). Strong convective movements occur, moving water vapor upward, where it condenses. The emerging clouds strongly scatter light. Clouds, which are collections of water droplets or crystals formed by the condensation of water vapor in the air, limit and scatter solar radiation reaching the Earth’s surface in the form of diffuse, rather than direct, radiation. Actinometric stations measure diffuse solar and sky radiation, direct solar radiation, total solar radiation, reflected radiation, and the albedo of the active surface [17].
In clear weather, blue light dominates the diffuse radiation spectrum over red (giving it its characteristic blue color), which is crucial for the generation of charge carriers in the semiconductor material. Therefore, in areas with a high percentage of diffuse light throughout the year, it may be advantageous to choose thin-film modules, which utilize diffuse radiation better than crystalline silicon modules [18]. In winter, air transparency can be further reduced by suspended dust and smoke particles [19].
In subtropical regions, the lowest air transparency coefficient values are observed. As in winter, the most transparent air mass is Arctic air, containing the least dust and water vapor [20].
However, it is important to remember that a designer or investor planning a photovoltaic installation in a given location has no influence on air transparency, and this factor occurs regardless of the design assumptions.
The intensity of total radiation of a plane inclined at a certain angle is significantly influenced by radiation reflected from the ground surface. Depending on the soil properties, the concept of albedo is introduced. Albedo (whiteness) is the ratio of reflected radiation to incident radiation; it is a parameter defining the reflectivity of a given surface (Table 1).
Table 1.
Albedo values for various materials [21].
Since the application of the presented models in design practice is difficult, it is worth using the available PVGIS tool to determine the amount of radiation reaching a given location.
The Interactive Photovoltaic Geographic Information System (PVGIS) [22] allows for determining monthly sums of radiation energy falling on a specific plane and the optimal angle of inclination of the plane absorbing solar radiation, as well as the generated electricity for a selected geographical location, determined by selecting a point on a geographical map or providing geographical coordinates.
3. Orientation and Tilt Angle of the Module
Due to the changing position of the Sun in the sky, the module’s orientation relative to the direction of sunlight changes throughout the day and throughout the year. Stationary systems (stationary relative to the Sun) should be positioned at an optimal angle and face south. The optimal angle is the module tilt angle at which its surface receives the most solar radiation energy at a given time. The optimal tilt angle depends on the location (latitude) and can be defined for a month, quarter, season (spring, summer, autumn, winter), or half-year (summer and winter) [23]. In a tracking system, a mechanical system, using two variables characterizing the Sun’s position, aligns the modules so that solar rays fall perpendicularly on their surfaces [24]. Control of the module position can be based on an astronomical (temporal) algorithm or on a sensor signal detecting the brightest point in the sky.
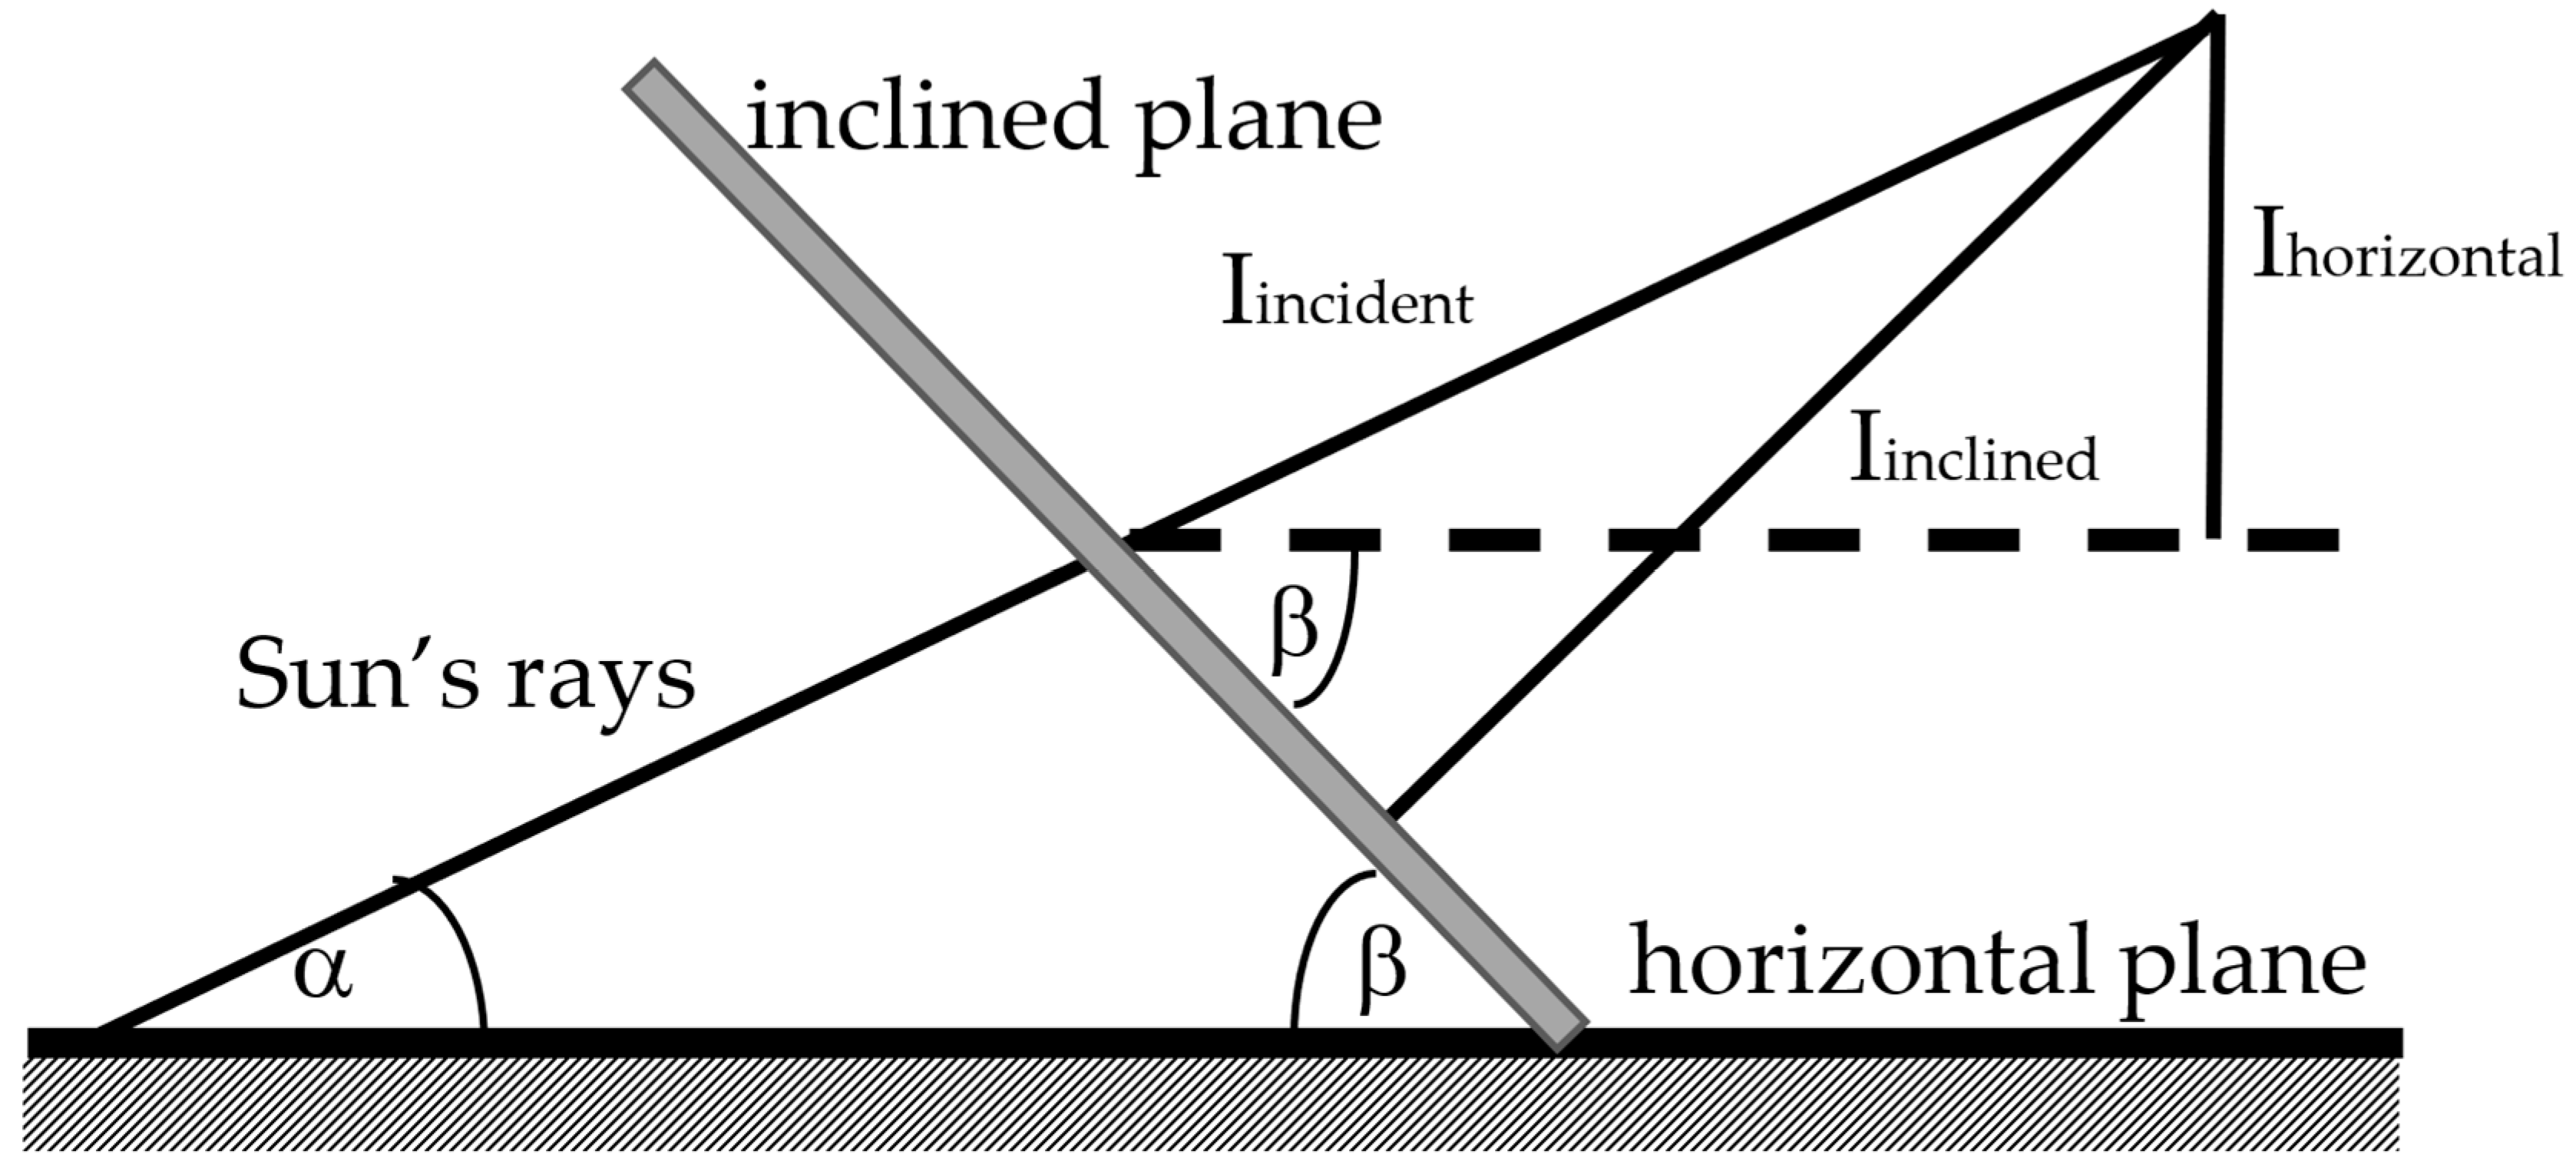
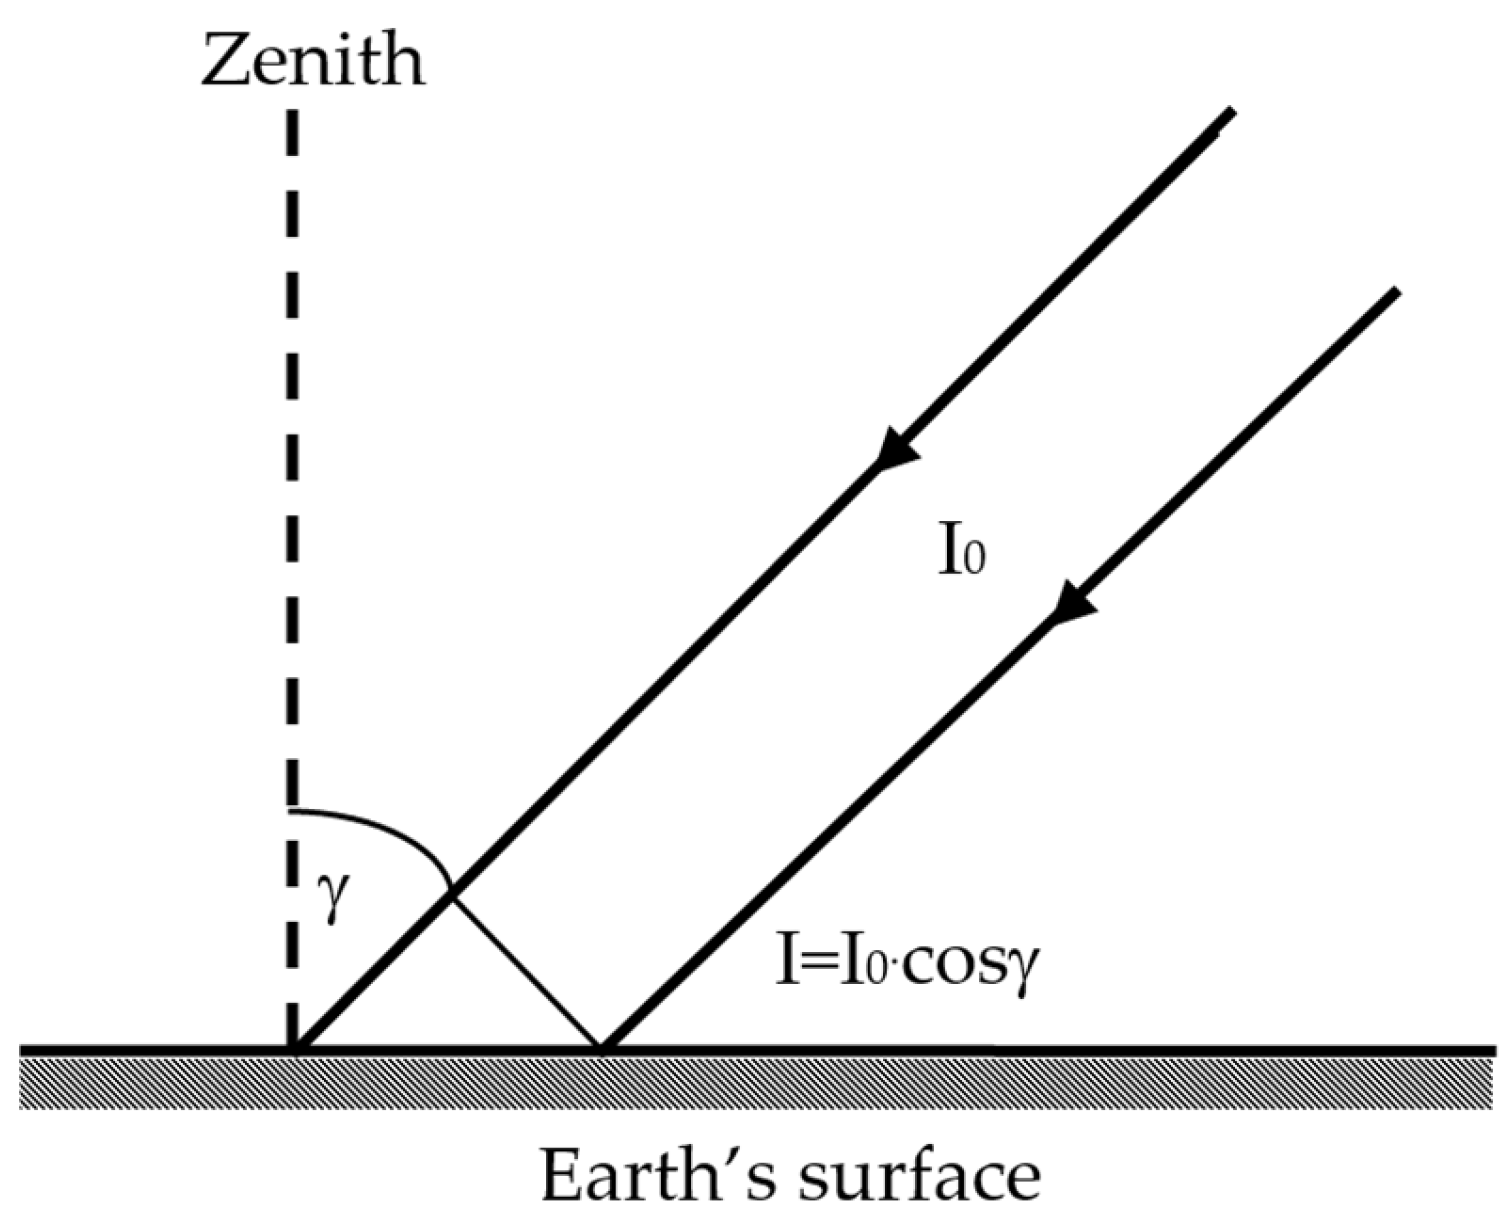
The amount of energy reaching a lit surface depends strictly on the angle of incidence of the rays (the angle γ between the normal to the surface and the direction of the radiation beam, Figure 2). This rule is called Lambert’s law. Therefore, an absorber receives the most energy if its surface is perpendicular to the Sun’s rays.
Figure 2.
Illustration of Lambert’s cosine law (γ is the angle between the Sun’s rays and the zenith).
However, because the angle of sunlight on a surface depends on the time of day and season, it should be oriented toward the sun during the phase of maximum radiation.
Photovoltaic modules can be installed as building-integrated or freestanding installations.
When designing, it is important to consider the impact of the module tilt angle on the annual totals of radiation energy incident on the absorbing surface. If we consider a structure with walls at different tilt angles, each of these surfaces will be illuminated by light with a different radiation intensity.
For example, walls facing south and tilted at the optimal angle (surfaces receiving perpendicular radiation) will receive the highest total radiation energy (100%), while vertical walls facing south will receive 70% of the energy [25].
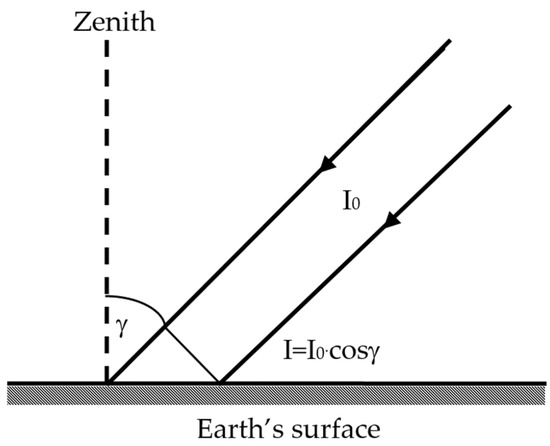
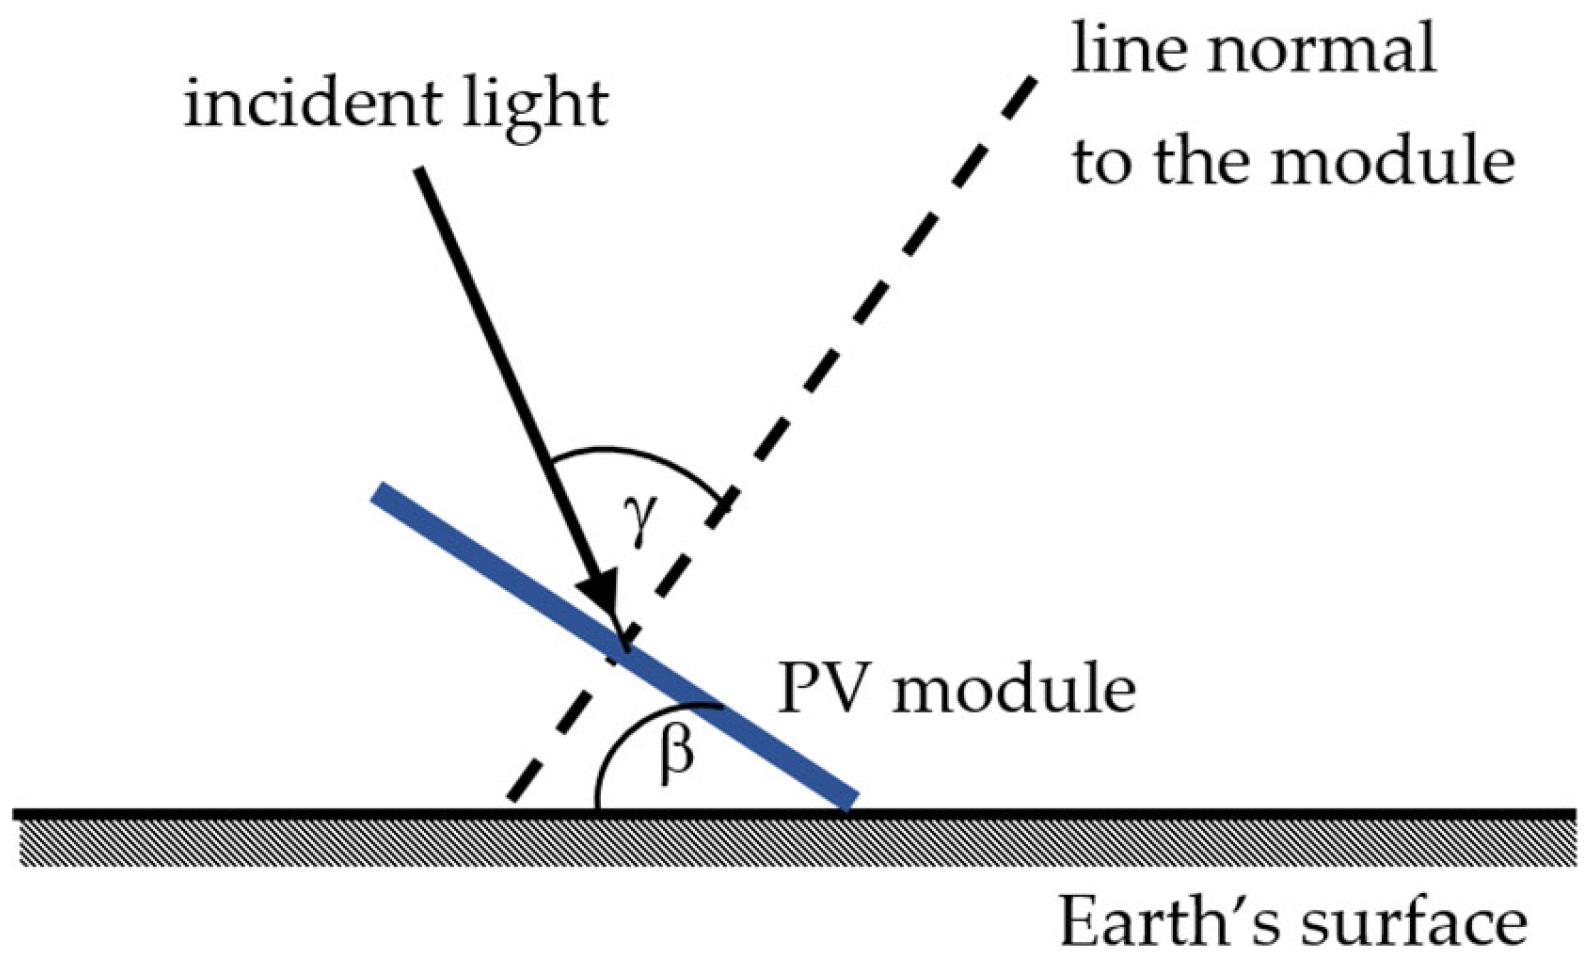
If the photovoltaic module is inclined to the horizontal surface at a constant angle β, then the determination of the angle of incidence of solar rays γ consists in determining the angle between the direction of incident radiation and the line perpendicular to the module surface (Figure 3). The effective irradiance on the surface is reduced by cos(γ):
Figure 3.
Determination of the angle of incidence of radiation on the surface of a photovoltaic module.
There are many published recommended values for the optimal angle for different latitudes. These are given for individual months, seasons, half-years, or as a year-round value.
Much valuable information about solar radiation potential can be obtained using the PVGIS [22].
Table 2 presents a summary of the optimal tilt angles of PV modules for different geographical latitudes.
Table 2.
The optimum tilt angles for different locations (on the base of [26]).
The literature also describes methods for calculating the optimal surface inclination angle. The simplest method involves determining the optimal angle for the summer period by subtracting 15° from the latitude, and for the winter period by adding 15° to the latitude. Another method provides more accurate results, which involves multiplying the latitude by 0.9 and subtracting 23.5° for the summer period, and multiplying the latitude by 0.9 and adding 29° for the winter period (for the other periods, 2.5° is subtracted from the latitude) [27,28].
If we imagine a building with walls at different angles, each of these surfaces will be illuminated by light with different radiation intensity: walls facing south and those inclined at the optimal angle (surfaces receiving perpendicular radiation) will receive the most radiation, and any deviation from this position will result in a decrease in the obtained power.
In photovoltaic installations, two types of photovoltaic systems are used: stationary and tracking. In a stationary configuration, the modules remain in their position and should face south and be tilted at the optimal angle appropriate for the location, ensuring maximum solar exposure.
Sun tracking systems—trackers—are used to increase the amount of solar radiation absorbed. The benefits of using this solution are significant: increase in energy output of between 20% and 50% or even more [29].
Dual-axis systems installed in Central Europe receive approximately 30% more incident solar energy annually, compared to approximately 20% for single-axis systems [30]. However, using these systems is associated with increased costs due to maintenance requirements and energy consumption. Tracking systems are rarely used also because space is often limited: modules are often mounted on the roof or façade of a building, and tracking installations require spacing between modules to avoid mutual shading. Therefore, they can be a viable option for ground-mounted modules.
4. Shading
Shading is a significant problem, significantly limiting the amount of energy generated by a photovoltaic system, limiting profits, and extending the payback period. During the design phase, it is essential to identify potential sources of shading; these can include neighboring buildings, chimneys, and trees. This analysis should be performed for different times of day and year. In the case of a string of cells (cells connected in series in a string), a bypass diode is used to switch off the shaded components to prevent overheating.
Photovoltaic modules operate efficiently only in uniform lighting conditions and are very sensitive to any type of shading. When part of the module is shaded, the cells that are not receiving the radiation are reverse-biased and act as a load, not a generator.
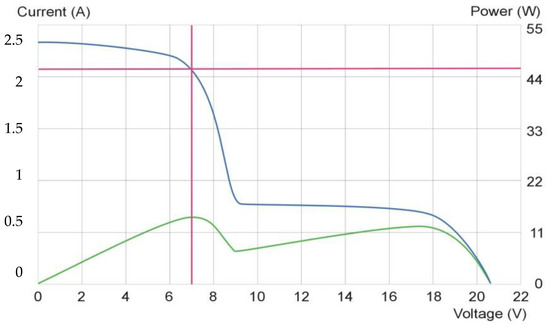
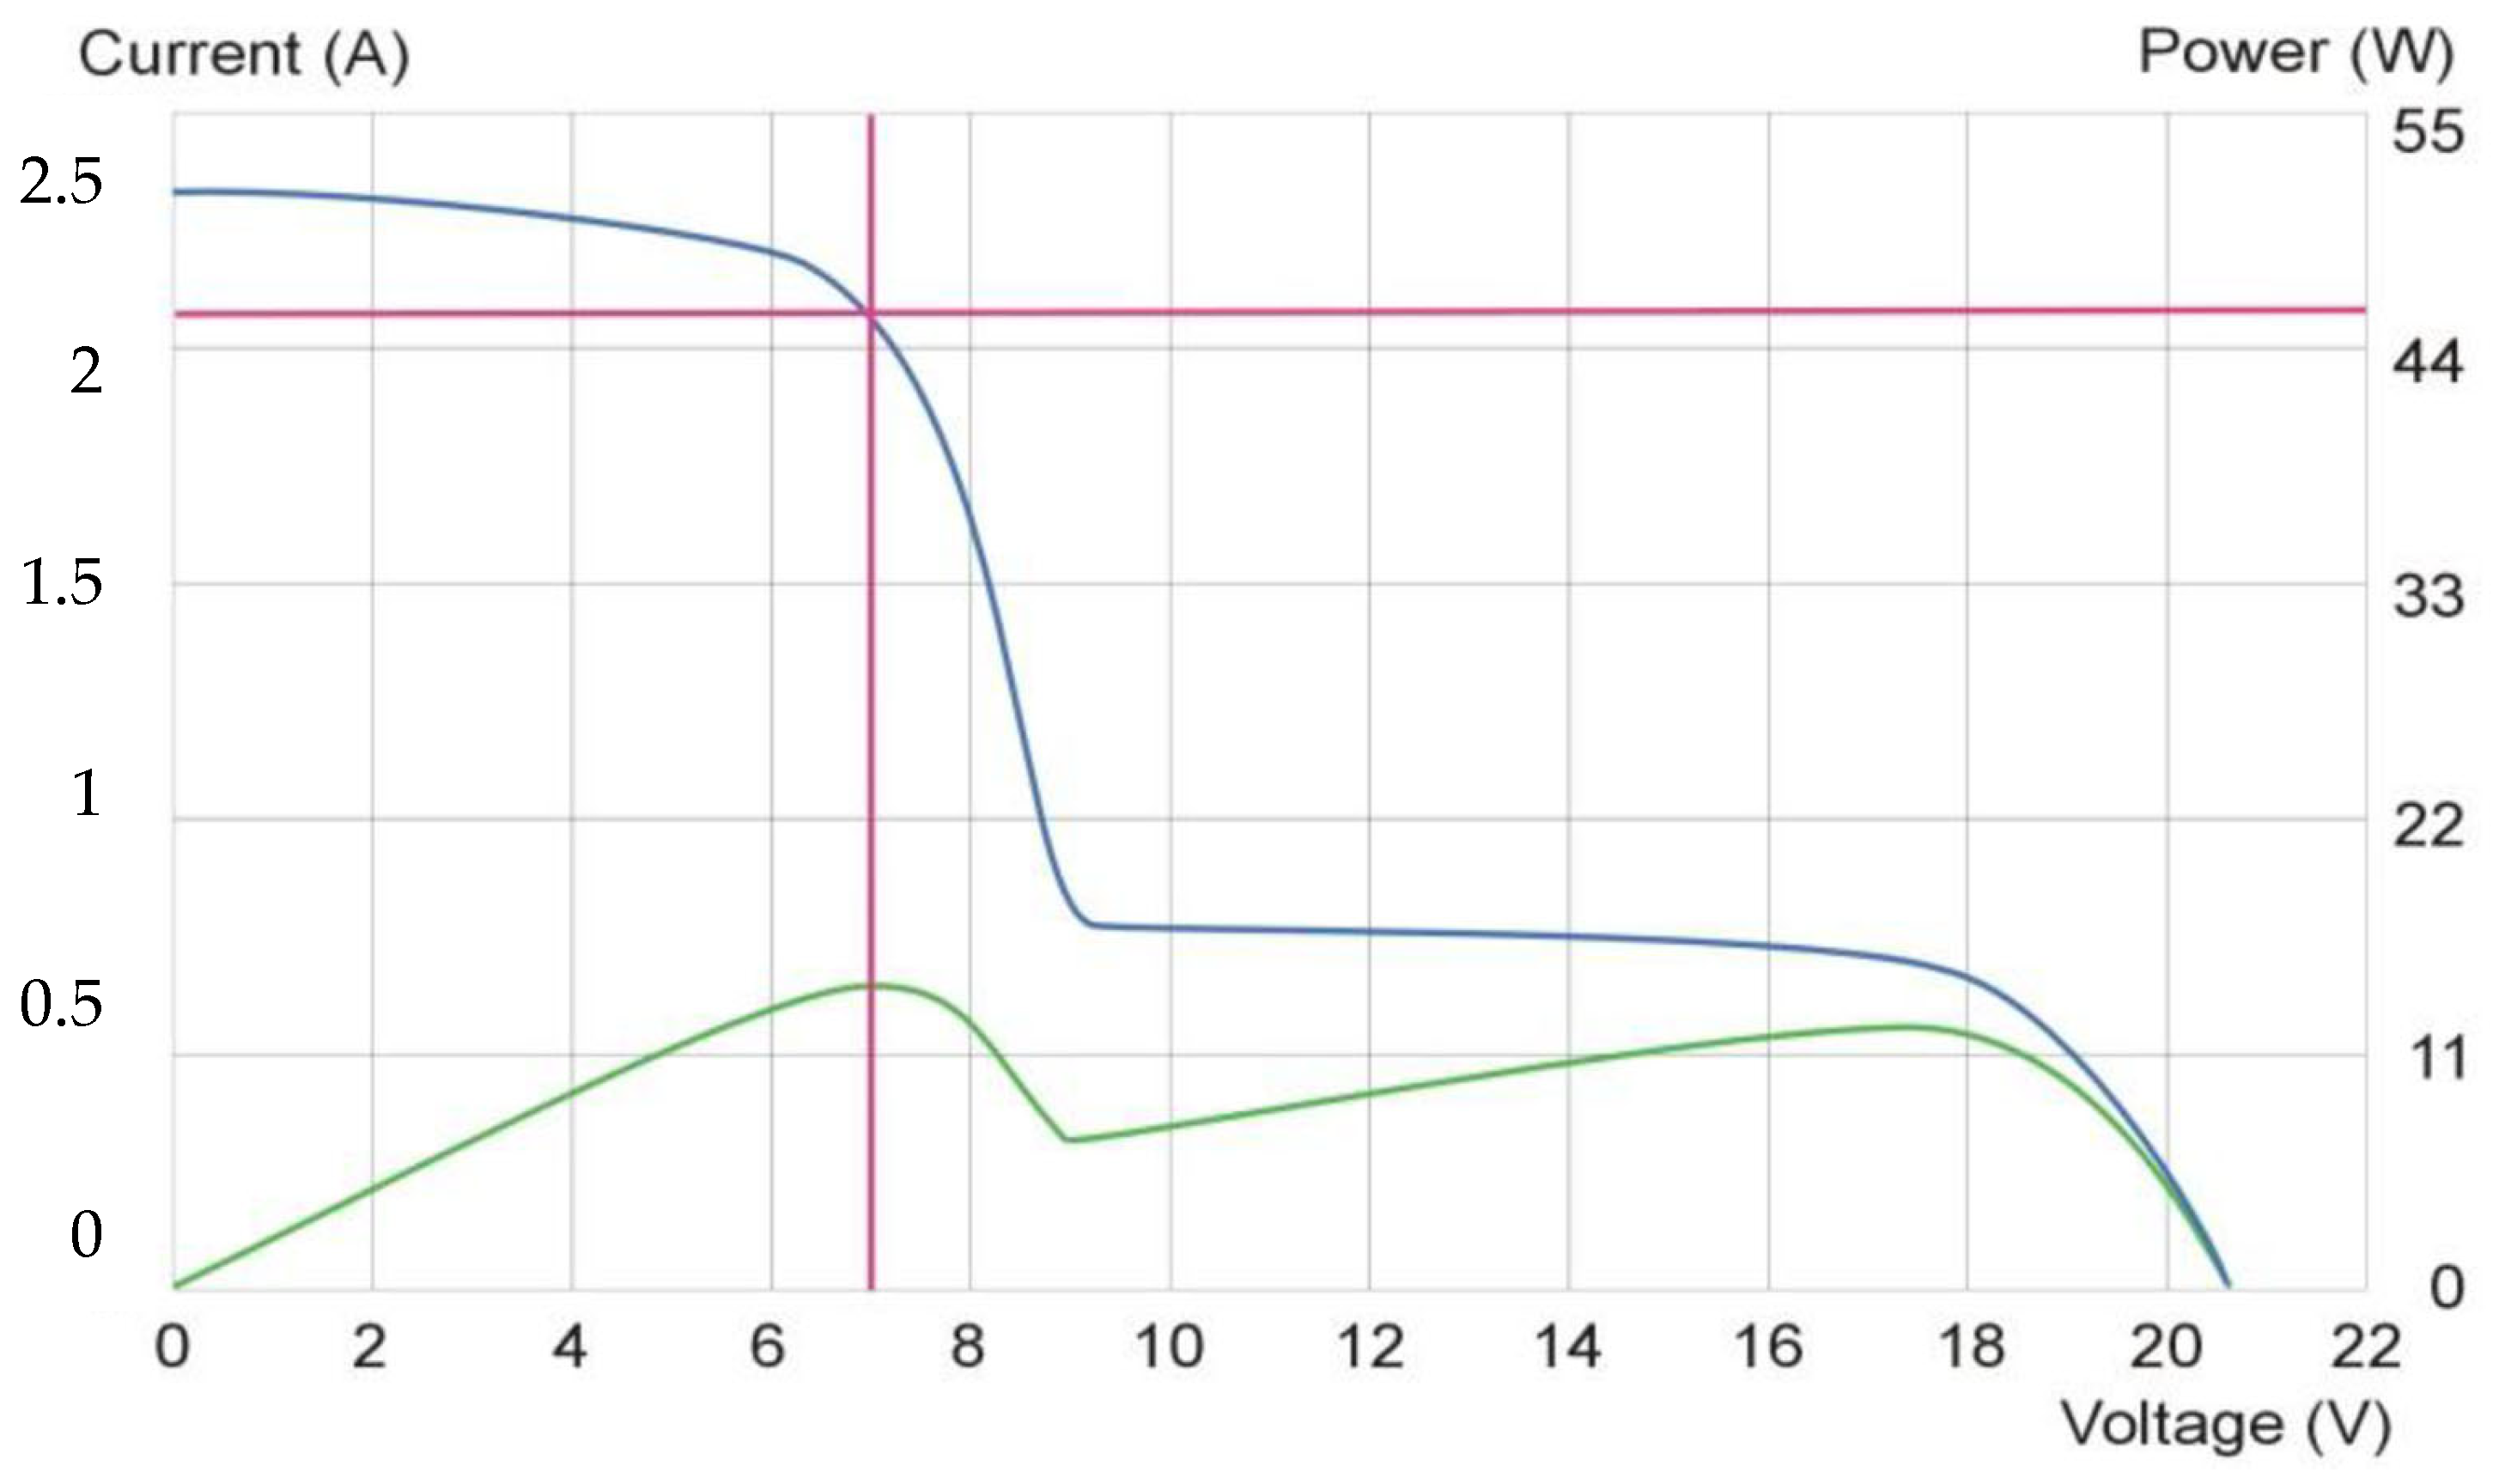
Soft shade sources such as tree branches, chimneys, and neighboring buildings (which cause partial shading by scattering light) significantly reduce the amount of light involved in the photogeneration of free charges. Sources of total shading located on the module surface, such as leaves, snow, and bird droppings, prevent light from reaching the photovoltaic cells. For example, consider a house with modules installed on two sections of the roof: one section receives full sun, and the other section receives full sun most of the time but is shaded for part of the year or late in the evening. If modules are placed in these two sections and on the same string, the partially shaded modules will not only lose their power generation capacity due to shading but will also reduce the output of the fully sunlit modules. To illustrate, if shading covers just 2% of the module’s surface area (for example, ¾ of the surface area of one cell in a 36-cell module), the maximum power is reduced by 70%. When a module is partially shaded, the temperature of the shaded cell can increase to such a degree that it is damaged, creating a hot spot. This phenomenon is caused by the previously mentioned reverse polarity of the shaded cell—current flows in the opposite direction through the unlit cell. Partial shading of a module or the entire system, caused by natural conditions such as clouds, trees, chimneys, neighboring buildings, or snow, results in two local peaks on the power curve instead of a single peak (Figure 4).
Figure 4.
I-U characteristics of the partly shaded modules, with an override of ½ (blue line) and 1 (green line) cell [31].
When designing a photovoltaic installation, it is necessary to conduct a year-round analysis of possible shading related to the terrain topology and exclude module locations where solar radiation could be obstructed by shadows from trees, buildings, or chimneys.
5. Module Surface Contamination and Photovoltaic Cell Efficiency
Photovoltaic modules are exposed to daily atmospheric factors, including the accumulation of contaminants. Even after a short period of use, the naturally accumulating layer of contaminants causes a decrease in the efficiency of converting solar radiation into electricity. Energy losses during the day due to pollution range from 2.8 to 50% depending on the degree of contamination [32].
The degree of reduction in the transmittance of the front cover of the module, which can reach even more than 60%, is closely related to the angle of inclination of the module: the greater the angle of inclination, the slower the contaminants accumulate on the surface of the module [33].
Despite the claims of photovoltaic module manufacturers that their products are self-cleaning under the influence of atmospheric conditions, based on research conducted in various climatic conditions by various research teams worldwide, it can be clearly stated that only regular self-cleaning of the front surface of modules can prevent the decline in efficiency of these devices caused by the accumulation of contaminants on their surfaces. The accumulation of contaminants on the surface of a photovoltaic (PV) installation leads to a decrease in the transmittance coefficient of the outer glass layer, which results in a reduction in the amount of solar radiation reaching the photovoltaic cells [34].
The first stage of contaminant deposition is accumulation, responsible for the linear reduction in transparency, while the second stage is the agglomeration of molecules and the settling of certain particles on top of the existing contaminant layer.
A review of articles devoted to the contamination of photovoltaic module surfaces, including the influence of climatic conditions (temperature, humidity) and radiation intensity as one of the main factors influencing the efficiency of the systems, was presented by Costa et al. [35]. The authors point to the growing importance of solving module contamination problems in solar energy-rich areas, such as regions of North Africa, the Middle East, India, desert areas of China, Australia and the United States, where high concentrations of suspended particulate matter in the air, intense dust storms and limited water availability are observed.
Losses in the achieved parameters depend mainly on the dust deposition density, which depends on various factors.
Accumulation of dust with a density of 20 g/m2 on the surface of a photovoltaic module reduces the short circuit current, open circuit voltage, and efficiency by 15–21%, 2–6%, and 15–35%, respectively [36].
Meral et al. [37] report that the average annual reduction factor is 93%, which means a 7% power loss.
The experimental results conducted by Saidan et al. [38] show that in desert areas dust significantly reduces the maximum current from 6.9% to 16.4% depending on the exposure time of photovoltaic panels in a dusty environment (i.e., from one day to one month).
Studies conducted during the rainy season in Indonesia [39] showed that just two weeks of dust accumulation caused a 10.8% decrease in the output power of a photovoltaic installation with an average relative humidity of 52.24%. This means that meteorological conditions typical of areas with high air pollution, during the rainy season and with significant cloud cover can cause a significant reduction in the efficiency of photovoltaic installations.
Contaminants collected on PV modules installed in Gdansk, Poland, that had not been manually cleaned for two years, were examined. Such a long period of non-cleaning causes contaminants to condense and adhere increasingly strongly to the module surface through natural processes. At a constant module tilt angle of 37°, the modules were exposed to dust deposition on the surface and limited removal of contaminants by precipitation and wind. A 0.8 μm thick layer of dirt caused an efficiency loss of approximately 3%, which is approximately 20% of the efficiency of an uncontaminated module [40]. A significantly better situation will occur if the module is regularly cleaned: the layer of deposited dust will be less dense and easier to remove by rain and wind, and there will be periods when the module is clean or only slightly contaminated.
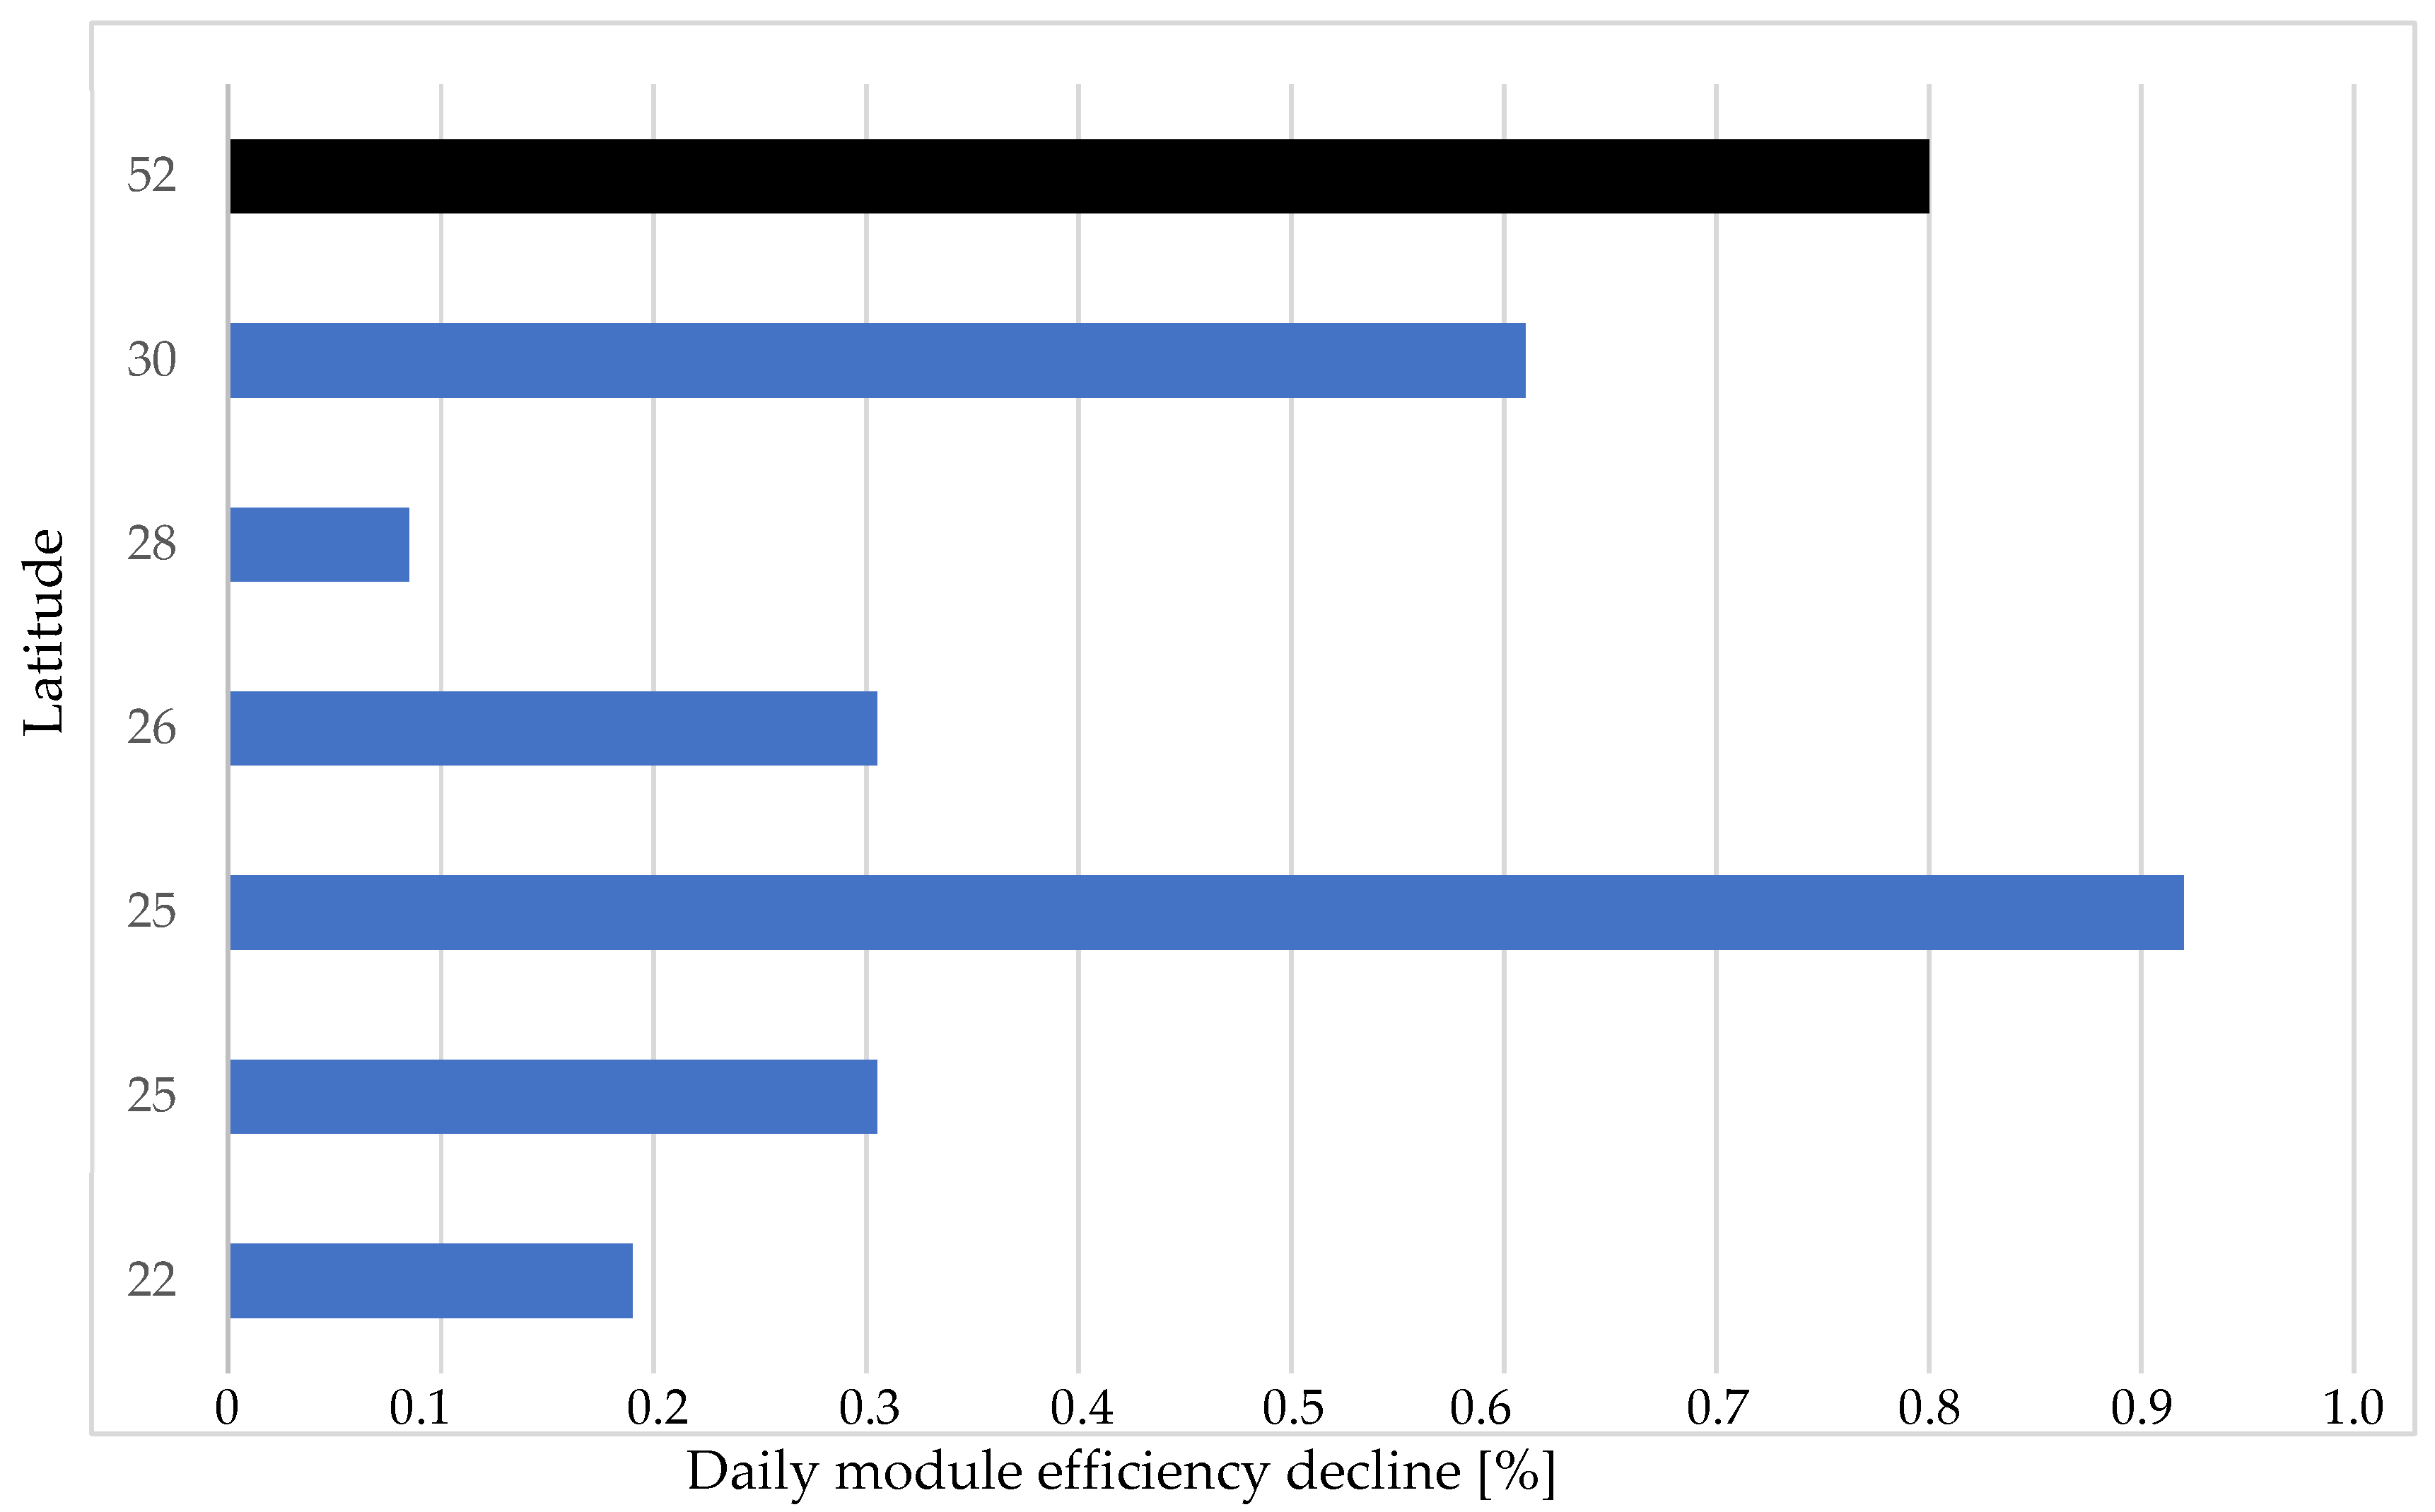
The daily decline in PV module efficiency measured in the center of Gdansk in northern Poland was compared with the results of measurements conducted by other researchers in various locations around the world (Figure 5). The obtained value of 0.8% is relatively high compared to others; the lowest value was obtained in studies conducted in Spain. The results obtained by various researchers indicate the need for clean module surfaces. A recommendation was developed [31], according to which, for example, Poland falls into Group II of the three groups, for which cleaning is recommended weekly or once every two weeks. This classification takes into account climate, latitude, annual rainfall, and air temperature. According to the results of long-term studies conducted in various locations around the globe, regular cleaning can increase the efficiency of PV installations by 9–26% compared to the efficiency of uncleaned modules [41].
One proposed way to reduce the impact of sediment on PV module performance is to coat their surface with an additional layer that hinders the adhesion of molecules. During a study of hydrophobic coatings available on the market, it was observed that all of them cause a decrease in the light intensity penetrating through the glass surface compared to a plate without any hydrophobic coating. Therefore, developing a suitable coating that is highly transparent is extremely important. Contaminants deposited on the surface of a photovoltaic module reduce the amount of radiation reaching the cells and participating in photovoltaic conversion. The impact of the sediment layer on solar module performance is significant: the sediment reduces the short circuit current, and therefore the power generated by the photovoltaic module and its efficiency [42].
Modules exposed to airborne pollutants and precipitation for extended periods exhibit uneven surface contamination.
Figure 5.
Maximum daily efficiency loss of a PV module at different latitudes. Data presented in order of increasing latitude are: Hong Kong, China; Abu Dhabi, United Arab Emirates; Riyadh, Saudi Arabia; Dhahran, Saudi Arabia; Gran Canaria, Spain; Arava Valley, Israel (on the base of: [43] (blue bars)) and Gdansk, Poland [44] (black bar).
5.1. Morphology and Composition of Contaminants
Contaminants can have various origins: airborne dust from the soil, wind-borne particles from fertilizers, pollutants emitted from chimneys, particles from abrasive brake linings, etc. Dust does not accumulate immediately but over time, ranging from 0.01% per day to 0.5% per day in dusty areas.
This means that, depending on the location, modules must be periodically washed to prevent excessive accumulation of pollutants. The greatest amount of settling dust accumulates on the module surface within the first month. This is due to both measurements of the decrease in permeability of the front cover and the mass of accumulated pollutants [45,46].
Several elements affect the amount of pollutant gathered on the surface of a solar device, mainly its localization, which is irreversibly linked to factors such as annual rainfall, occasional snow coverage, or, in a dry climate, increased blow of dust during sandstorms and higher concentration of soil particles in desert areas [35].
Gupta [47] presented the results of studies on natural contamination of PV modules conducted worldwide over various time periods, from several days to several years. The studies were conducted both in natural conditions and in the laboratory. Module efficiency declines of approximately 1% per month were observed for measurements taken in various locations in the USA, 9.33% per month in a dry climate, and 6.5% for measurements taken in Europe. A 15-year study by Ta et al. [48] in the Gansu region of northwestern China compared the amount of sediment on the front plate of PV modules in loess areas, where the sediment density was approximately 25.17 g/m2, and near the Gobi Desert, where more sediment was observed: the density of deposited dust was 36.48 g/m2.
According to an industry study describing losses in photovoltaic systems, the Performance Parameters document published by NREL (National Renewable Energy Laboratory) [49], a 5% loss in system efficiency due to contaminant accumulation can generally be assumed, but the practical range of losses, from 2% to 25%, is very wide. Because annual efficiency loss values are subject to rainfall-related error, it is more reasonable to analyze the daily cycle of contaminant deposition between heavy rains. Studies show an average daily efficiency loss of 0.05% due to contamination. An analysis of module efficiency loss due to contamination for various locations was conducted by M.H. Naeem [50]. Based on his own measurements, he determined a daily module efficiency loss of 0.061%/day, while an analysis of published data from 186 systems yielded a result of 0.051%/day. However, in areas with intensive agricultural activity, this rate is 0.36% per day, as opposed to 0.01% per day in desert areas devoid of agricultural, construction, or industrial activity. Additionally, large bird populations can cause losses of up to 0.5% per day, and sandstorms in locations such as India have reduced module efficiency by as much as 1.5%. The amount of dust accumulated is strongly dependent on the module’s surface angle—a linear decrease in glass transparency is observed as a function of surface angle. Depending on the location of the solar installation, the composition and gradation of dust vary significantly [51]. These differences influence the degree of reduction in photovoltaic module efficiency. Numerous scientific articles have published the results of studies on the composition and gradation of dust grains from various regions of the world. The composition of dust depends on its location, the presence of desert and urban areas, particularly industrial or expressway roads. In large cities, surface pollution results from the coexistence of liquid, solid, and gaseous particles in the air from various sources. Airborne heavy metal particles and organic compounds originate primarily from road transport. Sulfur, cadmium, and antimony particles are found along highways and are the result of abrasion from car brakes. In arid climates, in desert or semi-arid areas, however, the main source of dust is soil. Sediments contain location-specific pollutants, for example, airborne particles from coal-fired power plants or from emissions related to road transport in urban areas. Similarly, rural areas experience specific pollutants from fertilizer use and crop cultivation. Small particles have a more adverse effect on the performance of photovoltaic modules compared to larger particles. The size of dust grains deposited on the surface of photovoltaic modules is correlated with the distance from which the wind carried the pollutants: the smallest particles can reach from distant areas, while larger ones can reach from further away.
Bird droppings have a significant negative impact on module performance, acting as a source of particulate matter. Rain is often insufficient to remove them, requiring manual cleaning. Unlike dust particles, bird droppings affect only one or a few cells, completely blocking localized solar radiation.
5.2. Cleaning Photovoltaic Modules
Rain is an ally in removing contaminants, but depending on weather conditions and location, rainfall may often be insufficient, requiring manual or mechanical cleaning. Care should be taken to avoid uneven contamination, such as bird droppings. Care should also be taken when cleaning the modules to avoid damaging them. Photovoltaic modules should be cleaned with plain demineralized water and a mild detergent recommended by the manufacturer. Do not use high-pressure water, brushes, or any solvents, abrasives, or harsh detergents.
For large installations, robotic cleaning systems can be used, but many require the system design to accommodate the movement of such a cleaning system. Cleaning can occur at specific intervals or based on an assessment of the condition of the modules, and the impact of contamination is measured using instruments that trigger the cleaning.
The extent of contamination and the resulting cleaning regimen depends on the local contamination sources. Most users limit cleaning and rely on rain to keep the modules clean. Heavy rain provides satisfactory cleaning results, while light rains clean much less effectively and can even increase contamination if dust adheres to the water droplets. However, under special conditions, cleaning should be performed on a scheduled basis, depending on the source and nature of the contamination.
Sources of contamination that may indicate the need for preventative measures and the development of a dedicated cleaning schedule include locations with:
- agricultural dust (cleaning should be planned after plowing),
- construction dust (after construction is completed),
- pollen (cleaning should be planned after the end of the pollen season),
- bird populations (additionally, open spaces between modules where birds can build nests should be limited),
- diesel soot (present in high concentrations in cities, near highways or bus depots),
- industrial sources (manufacturing plants).
In cases of uniform soiling, a local, site-specific cost–benefit analysis should be conducted to determine whether routine cleaning of the modules is justified. The frequency may be seasonal, depending on local rainfall and dust conditions. Several parameters influence the optimal cleaning schedule:
- Cleaning cost—typically a fixed fee for the contracted cleaning crew, plus the cost of labor and materials for each cleaning; for example, estimated economic losses per PV cleaning system in Middle East, Asia and Australia regions have costed from 0.0011 to 22.43 US $/m2 [32].
- The rate at which dust accumulates on the modules—expressed as efficiency loss in %/day, %/month, or %/year.
- Site efficiency factor—the more efficient the installation, the greater the benefit from cleaning. The lower the efficiency, the greater the area of the modules that must be cleaned to achieve the same benefit.
- Value of energy supplied to the grid—the higher the energy value, the more cost-effective module cleaning is.
5.2.1. Natural and Passive Methods of Cleaning Modules
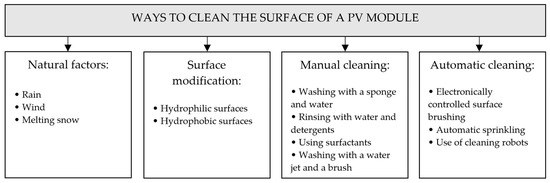
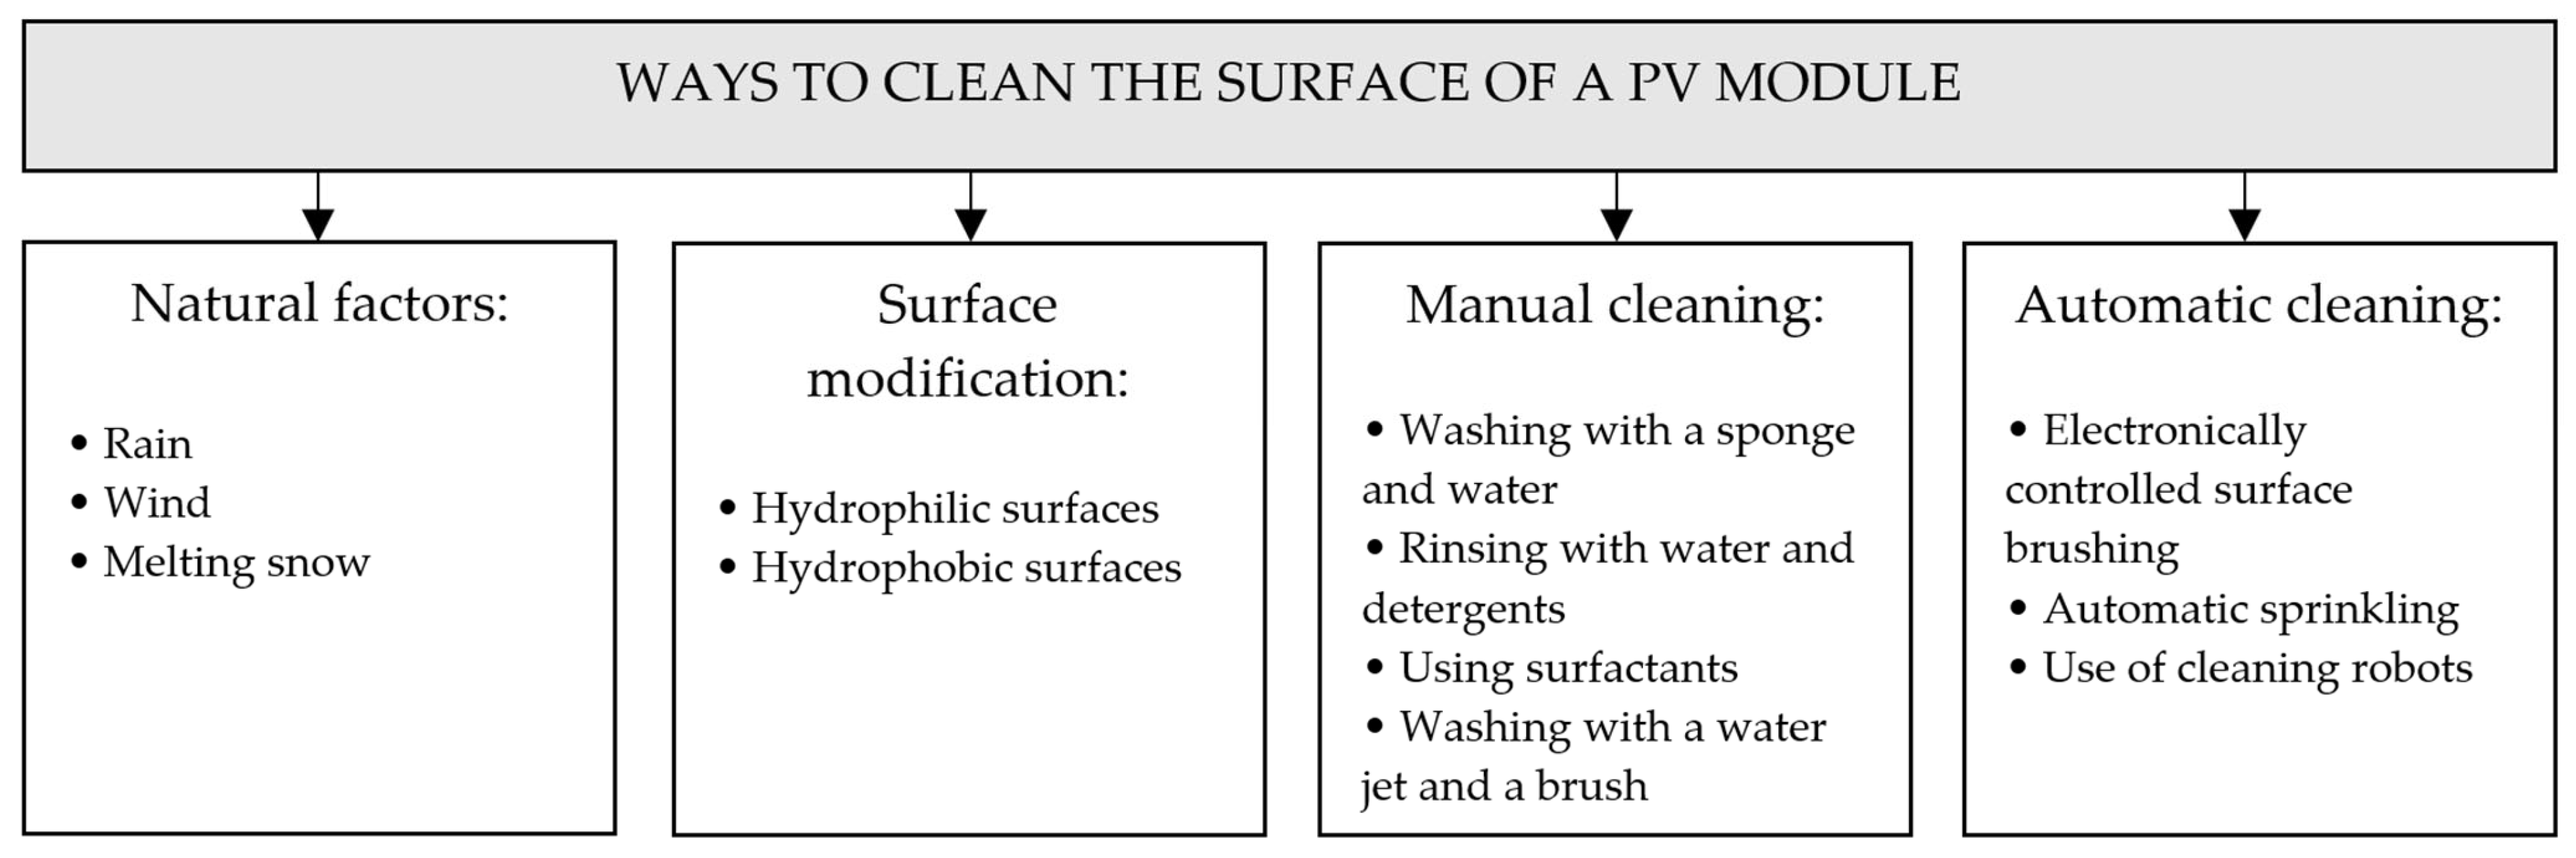
Natural methods of cleaning module surfaces exposed to weather include rainfall, snowmelt, wind, and gravity (Figure 6).
Figure 6.
Various methods of cleaning the surface of photovoltaic modules.
Of the factors mentioned above, rain washing is the most effective. However, if rainfall is not heavy, water collects airborne dust particles, creating sticky mud stains on the module’s surface.
A significant factor determining the amount of contaminants that settle and remain on the module’s surface is its angle of inclination relative to the horizontal plane. This angle determines the gravitational force component, which causes larger dust particles to fall off the module or accumulate in the lower sections. The impact of module inclination and the extent to which increasing the inclination angle can improve the cleaning process are also determined by the surface density of contaminants, expressed in [g/m2], and the size distribution of the deposited particles. The effectiveness of module surface cleaning by rainfall and wind also depends on the module’s angle of inclination and orientation relative to the wind direction. Wind removes deposited dust particles, and its effect can be more effective at large module inclination angles. The course of this phenomenon is also influenced by the particle size and structure of the dusty surface: a thin layer of deposited pollutants cannot be effectively removed by wind, even at high speeds. Jiang et al. [52] measured wind speeds sufficient to remove dust particles with diameters ranging from 0.1 to 100 µm: they ranged from 0.23 to 57.56 m/s and from 0.82 to 2219.8 m/s, respectively.
An experiment conducted in Egypt confirmed that the surface density of small-diameter particles (<1 mm) was higher for modules with a higher tilt angle, while coarser dust particles (average diameter 3 μm) settled in larger quantities on modules with a low tilt angle [53].
Passive cleaning methods for photovoltaic modules include modifications to the front cover of the module and the use of anti-pollution coatings to minimize dust adhesion.
5.2.2. Snow Removal
Accumulation of snow on the surface of a photovoltaic module can reduce its average annual performance by up to 16%. During system design, the required clearance between the bottom edge of the lowest row of modules and the ground or roof is determined to avoid wind-blown drifts and to allow snow to slide off. Snow typically slides off installations with steep inclinations (over 30°), causing it to accumulate unfavorably on the lower portion of the modules.
Snow removal is generally not recommended because it can easily damage the modules. However, it is sometimes necessary to reduce the snow load on the roof or remove ice dams. Experience has shown that snow rarely damages photovoltaic modules and supports. If necessary, snow removal should be performed with a turbofan rather than a shovel or mechanical means.
6. Temperature-Induced Efficiency Losses
Energy losses occurring during the photovoltaic energy conversion process in a power plant average 26.8% per year, which is due to many factors. It can be stated that the major fraction of losses is related to the temperature increase in the silicon solar cells.
An increase in temperature causes a decrease in PV conversion efficiency, a decrease in electrical output power and other physical parameters. This effect reduces the photovoltaic conversion efficiency of all types of solar cells except organic cells and amorphous silicon cells (a-Si:H).
With photovoltaic module temperatures reported to operate between 22 and 70 °C, a power output drop of 23% can be expected [54].
Efficiency changes as a function of temperature can be quantified by the coefficient of relative temperature changes in efficiency:
For small temperature changes near 300 K:
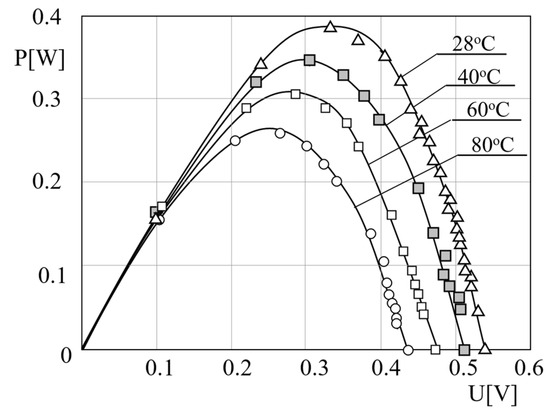
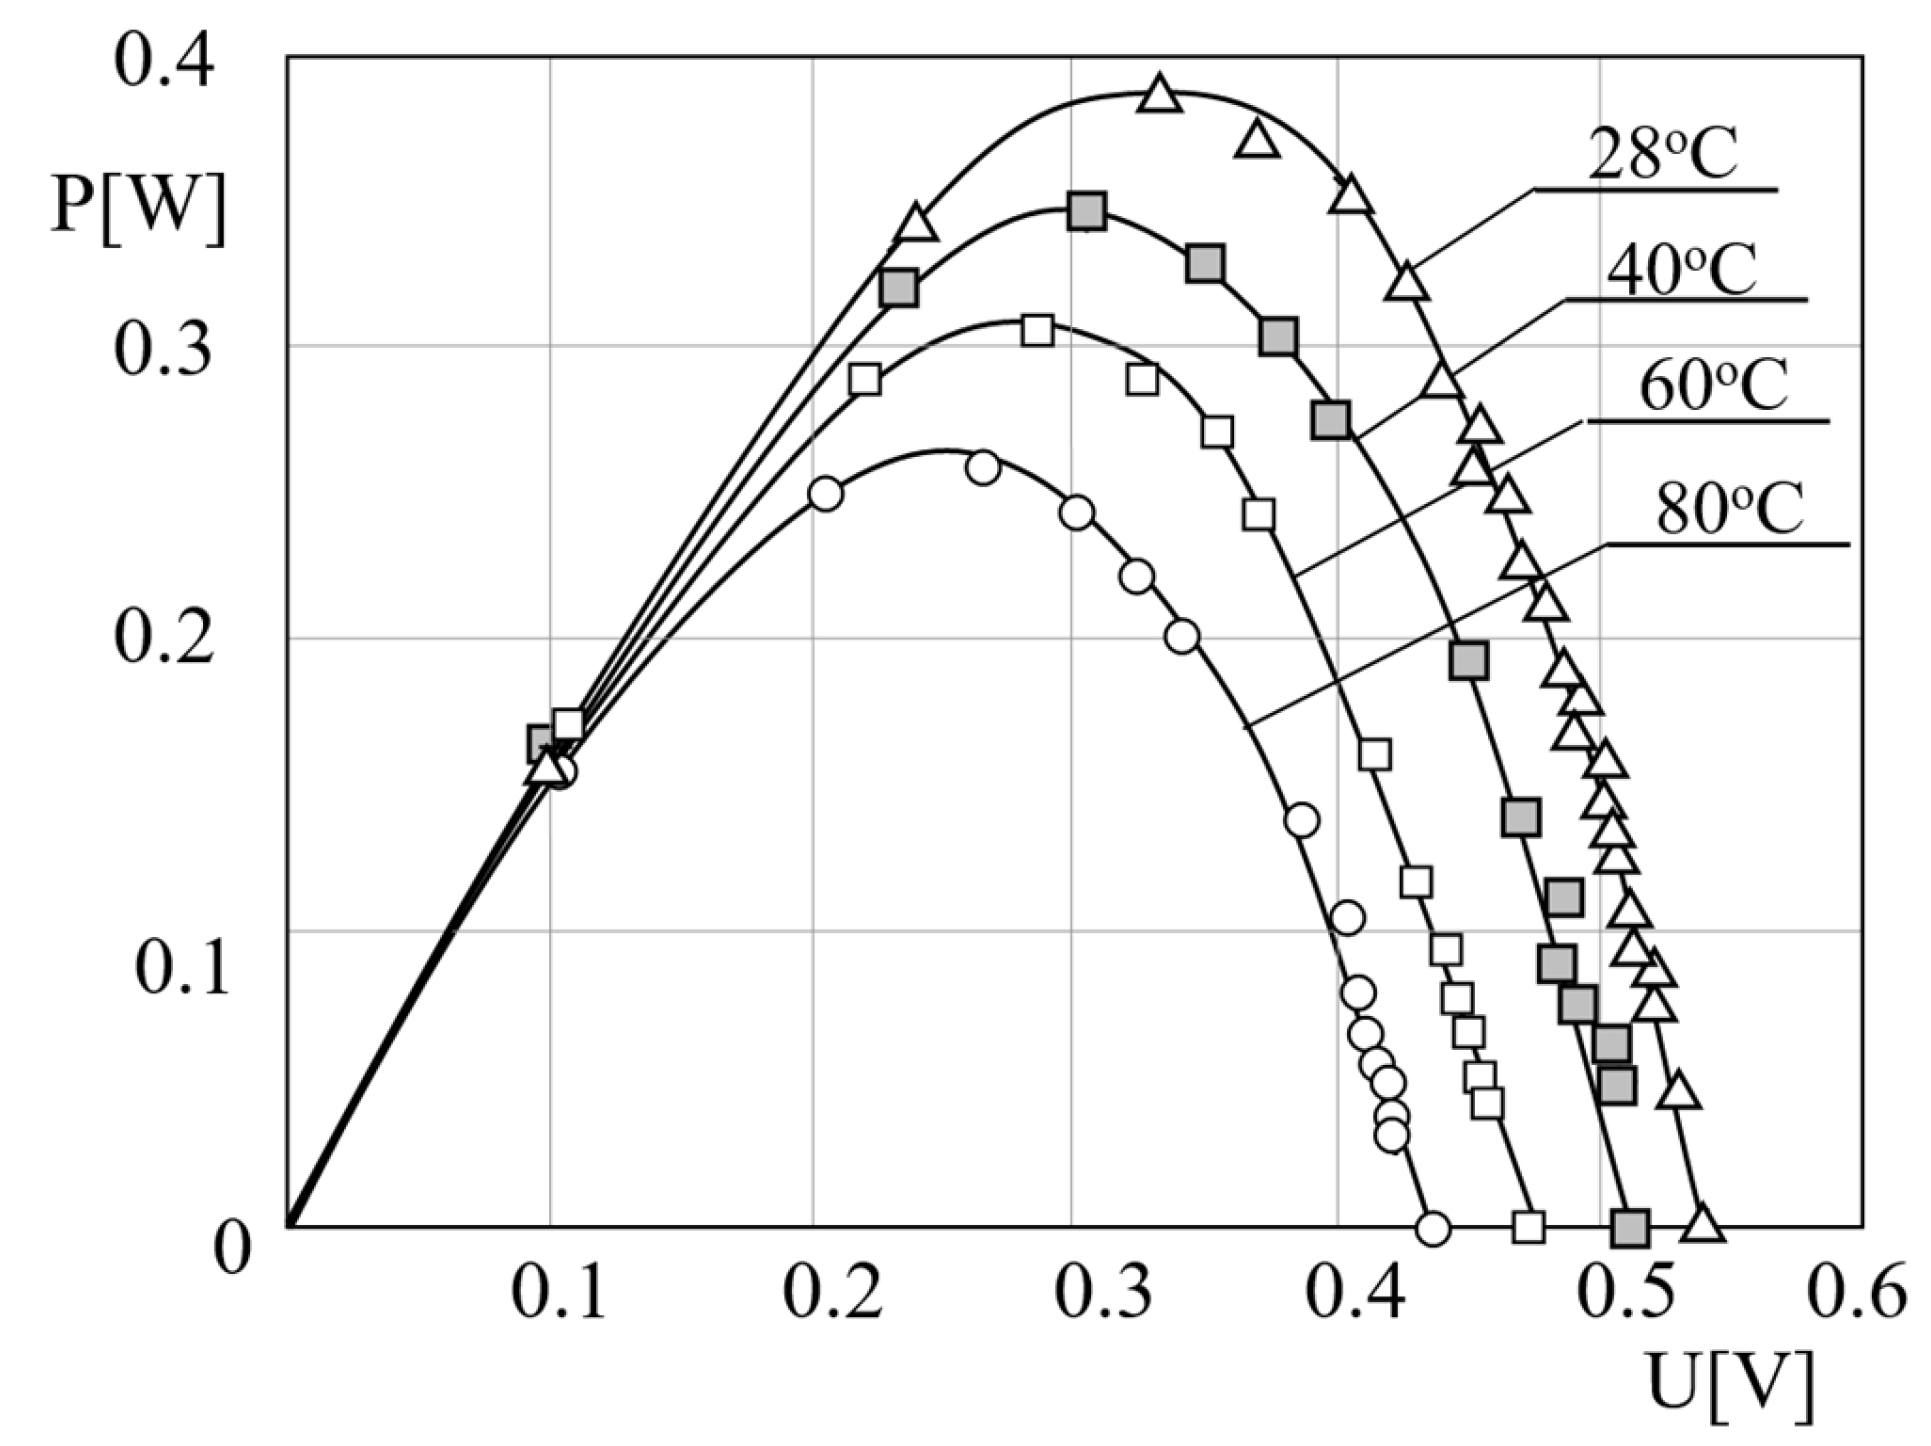
A decrease in the output power (−0.65%/K) (Figure 7), of the fill-factor (−0.2%/K) and of the conversion efficiency (−0.08%/K) of the PV module with the temperature increase has been observed [55].
Figure 7.
Output power versus voltage of a single-crystalline silicon solar cell at various temperatures: 28 °C, 40 °C, 60 °C, 80 °C [55].
Due to the significant temperature dependence of the conversion efficiency of the silicon module, its cooling is beneficial as it results in the removal of the total thermal energy from absorption of those photons that are not involved in the generation of electron-hole pairs, indirect and direct pair recombination and Joule’s heat of the photoelectric current.
The obtained results provide practical advice for designers and users of photovoltaic installations, clearly indicating that it is beneficial to reduce the operating temperature of photovoltaic cells by cooling them. An effective way to counteract this unfavorable phenomenon is to remove thermal energy, which reduces their temperature and, consequently, increases the output power. It is worth considering the use of hybrid systems in which photovoltaic cell modules are cooled by water or air, and the heat carried by the cooling medium can be used in heating or air conditioning of buildings.
7. Conclusions
The factors that sometimes significantly limit the performance of a photovoltaic system are presented and analyzed: the intensity of solar radiation incident on an absorbing plane, the orientation and tilt angle of the module, shading, contaminants, dust, and snow. These factors depend heavily not only on the proper installation design but also on the location it is located in. The designer and owner of the system should take all of these factors into account, including proper module positioning and responding to any limitations during module use, for example, by implementing cleaning of the front surface of the modules or pruning nearby trees.
While the first mentioned factors—the intensity of solar radiation incident on an absorbing plane, the orientation and tilt angle of the module—can be optimized at the design and assembly stage of the installation and do not constitute a topic for consideration for the user, the remaining operational issues—shading, contaminants, dust, and snow—should be constantly in the area of interest of the investor, who can minimize their impact in most cases to zero.
Each of the factors discussed in this article is equally important, which is why designers and users of photovoltaic systems took them all into account simultaneously.
Proper selection of the orientation, tilt angle of photovoltaic modules, and their location away from shading-causing landscape features should be made at the design stage. Additionally, ensuring that the designer provides adequate ventilation for the modules will limit the adverse impact of cell temperature increases during operation.
If the designer takes all these conditions into account, the user will only have to ensure the absence of contamination in the form of dust and other deposits, as well as snow.
Funding
This research received no external funding.
Data Availability Statement
No new data were created or analyzed in this study.
Conflicts of Interest
The author declares no conflicts of interest.
References
- Hemetsberger, W.; Dunlop, S.; Schmela, M. Welcome to the Global Market Outlook for Solar Power 2025–2029; SolarPower Europe: Brussels, Belgium, 2025; Available online: https://www.solarpowereurope.org/insights/outlooks/global-market-outlook-for-solar-power-2025-2029/detail (accessed on 6 October 2025).
- Kim, C.K.; Kim, H.-G.; Kang, Y.-H.; Oh, M. Comprehensive Analysis of Spectral Mismatch Factor for Solar Cells Based on In Situ Observation of Aerosol Optical Depth Spectra and Solar Spectral Irradiance in Korea. Int. J. Energy Res. 2023, 2023, 2617427. [Google Scholar] [CrossRef] [Scilit]
- Soga, T. Chapter 1—Fundamentals of Solar Cell. In Nanostructured Materials for Solar Energy Conversion; Elsevier: Amsterdam, The Netherlands, 2006; pp. 3–43. [Google Scholar] [CrossRef] [Scilit]
- Heredia-Rios, M.J.; Hernandez-Martine, L.; Linares-Aranda, M.; Moreno-Moreno, M.; Méndez, J.F. Analysis of Losses Associated with Series Resistance (Rs) in Simple-Structured c-Si Solar Cells. Energies 2024, 17, 1520. [Google Scholar] [CrossRef] [Scilit]
- Hottel, H.C.; Woertz, B.B. Evaluation of flat-plate solar heat collector. Trans. Am. Soc. Mech. Eng. 1942, 64, 91. [Google Scholar] [CrossRef] [Scilit]
- Abderraouf, B.; Lakhdar, M.; Abdelkader, B.; Madjeda, R. Experimental and Estimated study of global inclined solar radiation through LIU & JORDAN model applied in OUAD-NECHOU area. In Proceedings of the Algerian Conference on Mechanics and Solar Energy (ACMSE-2023), Ouargla, Algeria, 7–8 June 2023. [Google Scholar] [CrossRef]
- Liu, B.; Jordan, R. The interrelationship and characteristic distribution of direct, diffuse and total solar radiation. Sol. Energy 1960, 4, 1–19. [Google Scholar] [CrossRef] [Scilit]
- Hay, J.E.; Davies, J.A. Calculations of the Solar Radiation Incident on an Inclined Surface. In Proceedings of the First Canadian Solar Radiation Data Workshop, Toronto, ON, Canada, 17–19 April 1978; Ministry of Supply and Services: Gatineau, QC, Canada, 1980. [Google Scholar]
- Reindl, D.T.; Beckman, W.A.; Duffie, J.A. Diffuse fraction correlations. Sol. Energy 1990, 45, 1–7. [Google Scholar] [CrossRef] [Scilit]
- Shukla, K.N.; Saroj, R.; Sudhakar, K. Comparative study of isotropic and anisotropic sky models to estimate solar radiation incident on tilted surface: A case study for Bhopal, India. Energy Rep. 2015, 1, 96–103. [Google Scholar] [CrossRef] [Scilit]
- Erbs, D.G.; Klein, S.A.; Duffie, J.A. Estimation of the diffuse radiation fraction for hourly, daily and monthly-average global radiation. Sol. Energy 1982, 28, 293–302. [Google Scholar] [CrossRef] [Scilit]
- Iqbal, M. Prediction of hourly diffuse solar radiation from measured hourly global radiation on a horizontal surface. Sol. Energy 1980, 24, 491–503. [Google Scholar] [CrossRef] [Scilit]
- Skartveit, A.; Olseth, J.A. A model for the diffuse fraction of hourly global radiation. Sol. Energy 1987, 38, 271–274. [Google Scholar] [CrossRef] [Scilit]
- Garrison, J.D. Astudy of the division of global irradiance into direct diffuse irradiance at thirty-three, U.S. sites. Sol. Energy 1985, 35, 341–351. [Google Scholar] [CrossRef] [Scilit]
- Perez, R.R.; Ineichen, P.; Maxwell, E.L.; Seals, R.D.; Zelenka, A. Dynamic global-to-direct irradiance conversion models. In Proceedings of the ISES Solar World Congress, Denver, CO, USA, 19–23 August 1991; pp. 951–956. Available online: https://archive-ouverte.unige.ch/unige:38583 (accessed on 6 October 2025).
- Ohvril, H.; Okulov, O.; Teral, H.; Teral, K. The atmospheric integral transparency coefficient and the Forbes effect. Sol. Energy 1999, 66, 305–317. [Google Scholar] [CrossRef] [Scilit]
- Rapti, A.S. Atmospheric transparency, atmospheric turbidity and climatic parameters. Sol. Energy 2000, 69, 99–111. [Google Scholar] [CrossRef] [Scilit]
- Kiseleva, E.A.; Popel, O.; Tarasenko, A. Thin-Film And Crystalline Photovoltaic Modules—Outdoor Performance And Economic Estimation. IOP Conf. Ser. Earth Environ. Sci. 2018, 168, 012020. [Google Scholar] [CrossRef] [Scilit]
- Al-Sharafi, A.; Ahmadullah, A.B.; Hassan, G.; Al-Qahtani, H.; Abubakar, A.A.; Yilbas, B.S. Influence of environmental dust accumulation on the performance and economics of solar energy systems: A comprehensive review. Clean. Energy Syst. 2024, 8, 100125. [Google Scholar] [CrossRef] [Scilit]
- Soliman, H.A.; Saleh, I.H.; Shalaby, E.; Ghatass, Z.; Shatat, A.R.; Elsafi, M.; Abdel-Gawad, E.H. Assessment of heavy metals in total suspended particles and deposited dust in different areas in Assiut city, Egypt. Sci. Rep. 2025, 15, 32574. [Google Scholar] [CrossRef] [Scilit]
- Jackson, F. Planning & Installing Photovoltaic Systems; Earthscan: London, UK, 2008. [Google Scholar]
- Photovoltaic Geographical Information System. Available online: https://re.jrc.ec.europa.eu/pvg_tools/en/ (accessed on 1 October 2025).
- Teyabeen, A.A.; Mohamed, F. Estimation of the Optimum Tilt Angle of Solar PV Panels to Maximize Incident Solar Radiation in Libya. Energies 2024, 17, 5891. [Google Scholar] [CrossRef] [Scilit]
- Sharma, M.K.; Kumar, D.; Dhundhara, S.; Gaur, D.; Verma, Y.P. Optimal Tilt Angle Determination for PV Panels Using Real Time Data Acquisition. Glob. Challenges 2020, 4, 1900109. [Google Scholar] [CrossRef] [Scilit]
- Solar Angle Calculator. Available online: http://www.solarelectricityhandbook.com/solar-angle-calculator.html (accessed on 6 October 2025).
- Yunus Khan, T.M.; Manzoore Elahi, M.; Kanchan, M.; Afzal, A.; Banapurmath, N.R.; Akram, N.; Mane, S.D.; Shahapurkar, K. Optimum location and influence of tilt angle on performance of solar PV panels. J. Therm. Anal. Calorim. 2019, 141, 511–532. [Google Scholar] [CrossRef] [Scilit]
- Mahmoud, M.; Nabhan, I. Determination of optimum tilt angle of single and multi-rows of photovoltaic arrays for selected sites in Jordan. Sol. Wind. Technol. 1990, 7, 739–745. [Google Scholar] [CrossRef] [Scilit]
- Yorukoglu, M.; Celik, A.N. A critical review on the estimation of daily global solar radiation from sunshine duration. Energy Convers. Manag. 2006, 47, 2441–2450. [Google Scholar] [CrossRef] [Scilit]
- Yang, X.; Zou, T.; Xu, Y.; Chen, F.; Luo, H.; Li, R. Research dynamics and applications of tracking technology and devices in solar energy utilization system. Sustain. Energy Technol. Assess. 2025, 75, 104256. [Google Scholar] [CrossRef] [Scilit]
- Klugmann-Radziemska, E. Photovoltaic-Installation Performance in Central Europe on the Example of Poland. J. Sol. Energy Res. Updates 2014, 1, 3–11. [Google Scholar] [CrossRef] [Scilit]
- Grzesiak, W.; Mackow, P.; Maj, T.; Polak, A.; Klugmann-Radziemska, E.; Zawora, S.; Drabczyk, K.; Gulkowski, S.; Grzesiak, P. Innovative system for energy collection and management integrated within a photovoltaic module. Sol. Energy 2016, 132, 442–452. [Google Scholar] [CrossRef] [Scilit]
- Said, S.Z.; Islam, S.Z.; Zahurul, S.; Radzi, N.H.; Wekesa, C.W.; Altimania, M.; Uddin, J. Dust impact on solar PV performance: A critical review of optimal cleaning techniques for yield enhancement across varied environmental conditions. Energy Rep. 2024, 12, 1121–1141. [Google Scholar] [CrossRef] [Scilit]
- Rudnicka, M.; Klugmann-Radziemska, E. The issue of shading photovoltaic installation caused by dust accumulation on the glass surface. Ecol. Chem. Eng. S 2021, 28, 173–182. [Google Scholar] [CrossRef] [Scilit]
- Klugmann-Radziemska, E.; Rudnicka, M. The Analysis of Working Parameters Decrease in Photovoltaic Modules as a Result of Dust Deposition. Energies 2020, 13, 4138. [Google Scholar] [CrossRef] [Scilit]
- Costa, S.C.S.; Diniz, A.S.; Kazmerski, L.L. Dust and soiling issues and impacts relating to solar energy systems: Literature review update for 2012–2015. Renew. Sustain. Energy Rev. 2016, 63, 33–61. [Google Scholar] [CrossRef] [Scilit]
- Zaihidee, F.M.; Mekhilef, S.; Seyedmahmoudian, M.; Horan, B. Dust as an unalterable deteriorative factor affecting PV panel’s efficiency: Why and how. Renew. Sustain. Energy Rev. 2016, 65, 1267–1278. [Google Scholar] [CrossRef] [Scilit]
- Meral, M.E.; Dincer, F. A review of the factors affecting operation and efficiency of photovoltaic based electricity generation systems. Renew. Sustain. Energy Rev. 2011, 15, 2176–2184. [Google Scholar] [CrossRef] [Scilit]
- Saidan, M.; Albaali, A.G.; Alasis, E.; Kaldellis, J.K. Experimental study on the effect of dust deposition on solar photovoltaic panels in desert environment. Renew. Energy 2016, 92, 499–505. [Google Scholar] [CrossRef] [Scilit]
- Ramli, M.A.M.; Prasetyono, E.; Wicaksana, R.W.; Windarko, N.A.; Sedraoui, K.; Al-Turki, Y.A. On the investigation of photovoltaic output power reduction due to dust accumulation and weather conditions. Renew. Energy 2016, 99, 836–844. [Google Scholar] [CrossRef] [Scilit]
- Klugmann-Radziemska, E. Degradation of electrical performance of a crystalline photovoltaic module due to dust deposition in northern Poland. Renew. Energy 2015, 78, 418–426. [Google Scholar] [CrossRef] [Scilit]
- Tylim, A. The Importance of a PV System Washing Program; Renewable Energy World: Peterborough, NH, USA, 2013; p. 11. [Google Scholar]
- Mani, M.; Pillai, R. Impact of dust on solar photovoltaic (PV) performance: Research status, challenges and recommendations. Renew. Sustain. Energy Rev. 2010, 14, 3124–3131. [Google Scholar] [CrossRef] [Scilit]
- Sayyah, A.; Horenstein, M.N.; Mazumder, M.K. Energy yield loss caused by dust deposition on photovoltaic panels. Sol. Energy 2014, 107, 576–604. [Google Scholar] [CrossRef] [Scilit]
- Klugmann-Radziemska, E.; Rudnicka, M. Decrease in Photovoltaic Module Efficiency Due to Deposition of Pollutants. IEEE J. Photovolt. 2020, 10, 1772–1779. [Google Scholar] [CrossRef] [Scilit]
- Garg, H.P. Effect of dirt on transparent covers in flat plate solar energy collectors. Sol. Energy 1974, 15, 299–302. [Google Scholar] [CrossRef] [Scilit]
- Hassan, A.H.; Rahoma, U.A.; Elminir, H.K.; Fathy, A.M. Effect of airborne dust concentration on the performance of PV modules. J. Astron. Soc. Egypt 2005, 13, 24–38. [Google Scholar]
- Gupta, V. Impact of Dust Deposition on Solar Photovoltaic Panel in Desert Region: Review. Int. J. Electron. Electr. Comput. Syst. 2017, 6, 1. [Google Scholar]
- Ta, W.; Xiao, H.; Qu, J.; Xiao, Z.; Yang, G.; Wang, T.; Zhang, X. Measurements of dust deposition in Gansu Province, China, 1986–2000. Geomorphology 2004, 57, 41. [Google Scholar] [CrossRef] [Scilit]
- Walker, H.A. Best Practices for Operation and Maintenance of Photovoltaic and Energy Storage Systems, 3rd ed.; NREL/TP-7A40-66056; National Renewable Energy Laboratory: Golden, CO, USA, 2018. Available online: https://www.nrel.gov/docs/fy19osti/66056.pdf (accessed on 6 October 2025).
- Naeem, M.H. Soiling of Photovoltaic Modules: Modelling and Validation of Location-Specific Cleaning Frequency Optimization; Arizona State University: Tempe, AZ, USA, 2014. [Google Scholar]
- Sarver, T.; Al-Qaraghuli, A.; Kazmerski, L.L. A comprehensive review of the impact of dust on the use of solar energy: History, investigations, results, literature, and mitigation approaches. Renew. Sustain. Energy Rev. 2013, 22, 698. [Google Scholar] [CrossRef] [Scilit]
- Jiang, Y.; Lu, L.; Ferro, A.R.; Ahmadi, G. Analyzing wind cleaning process on the accumulated dust on solar photovoltaic (PV) modules on flat surfaces. Sol. Energy 2018, 159, 1031–1036. [Google Scholar] [CrossRef] [Scilit]
- Hegazy, A.A. Effect of dust accumulation on solar transmittance through glass covers of plate-type collectors. Renew. Energy 2001, 22, 525–540. [Google Scholar] [CrossRef] [Scilit]
- Radziemska, E.; Klugmann, E. Thermally affected parameters of the current–voltage characteristics of silicon photocell. Energy Convers. Manag. 2002, 43, 1889–1900. [Google Scholar] [CrossRef] [Scilit]
- Radziemska, E. The effect of temperature on the power drop in crystalline silicon solar cells. Renew. Energy 2003, 28, 1–12. [Google Scholar] [CrossRef] [Scilit]
Disclaimer/Publisher’s Note: The statements, opinions and data contained in all publications are solely those of the individual author(s) and contributor(s) and not of MDPI and/or the editor(s). MDPI and/or the editor(s) disclaim responsibility for any injury to people or property resulting from any ideas, methods, instructions or products referred to in the content. |
© 2026 by the author. Licensee MDPI, Basel, Switzerland. This article is an open access article distributed under the terms and conditions of the Creative Commons Attribution (CC BY) license.