Abstract
Reliability of medium-voltage (MV) cable systems, for distribution to industrial and renewable plants, is becoming an issue for various reasons, among which are increased global aging, unconventional voltage waveforms, and insufficient commissioning tests. The major component undergoing premature failures is splices, and most of those failures can be associated with flaws in installation, commissioning and, in general, workmanship. One of the topics of an ongoing Department of Energy (DOE) Advanced Research Projects Agency-Energy (ARPA-E) project, GOPHURRS, is, indeed, to increase splice reliability through simpler design and installation procedures, which can minimize assembly and aging risks. This paper deals with design and testing techniques, which can allow scaling up to MV, a type of splice design and assembly that has been successful in low-voltage (LV) applications. A new design paradigm, the three-leg approach, is applied for the first time to LV splices to evaluate their operation likelihood and reliability up to 30 kV nominal voltage, allowing intrinsic life to reach the specified target (e.g., 30 years at a failure probability of 5%) and preventing extrinsic aging, namely, partial discharge occurrence. Design principles and validation, including accelerated aging and forensic observations, are presented and discussed.
1. Introduction
A running ARPA E project (Grid Overhaul with Proactive, High-Speed Undergrounding for Reliability, Resilience, and Security, GOPHURRS) is dealing with MV cable system reliability [1]. A critical component for cable system is accessories, specifically splices (joints) and terminations. Splice mis-assembly during cable lay down is, indeed, one of the major MV cable-system premature failure sources, mostly due to the need for expert workmanship and the relative complexity of cable jointing (or terminating) operation [2]. It has been discussed in several international meetings/conferences/papers, e.g., [3,4,5,6], that joint (splice) failure is the major cause of electrical breakdown of MV and HV cables, which has to do with the complexity of assembly and the difficulty of developing appropriate commissioning tests.
Often, improperly assembled splices display partial discharge inception voltage (PDIV) lower than nominal voltage already at cable commissioning, while other times partial discharges can appear at some time during operation due to electrothermal and mechanical aging [7,8,9,10]. This can cause accelerated extrinsic aging and failure [11,12,13,14,15]. Unfortunately, most commissioning specifications do not require, for MV cables, partial discharge tests; thus, the risk that improperly assembled splices or terminations can cause cable failure well before design life is, in MV, reasonably high. This causes direct and indirect extra costs, reduced ROI, fines, safety, and environmental concerns.
A possible answer to such fundamental reliability issues is to investigate innovative MV splice designs that make splice assembly easier, thus reducing risks related to improper workmanship [16]. An intriguing idea is to develop an innovative design stemming from a successful and simple splice type for LV cables and to modify it for MV application, with a target of 30 kV nominal voltage. Major steps are accounting for electrical field distribution in the whole joint, which can assure a typical MV cable system intrinsic life (e.g., 30 years at a failure probability of 5%), but also absence of partial discharges, thus of extrinsic aging, at nominal voltage (PD-free design).
This paper focuses on the application of the recently proposed three-leg approach [17,18,19], to infer the MV splice design based on a successful LV product. The so-called “three-leg approach” can be exploited for the estimation of bulk, surface, or interface PDIV of an insulation system. This approach is also valid for both AC and DC systems. The electrical field simulation of the LV splice (described in Section 2) is presented in Section 3, which is the 1st leg. In Section 4, the discharge inception field model is applied in the volumes where the electric field distribution peak is higher, and the discharge risk at internal and external air gaps is estimated in order to calculate the PDIV, 2nd leg. In parallel, electrical insulating materials have been characterized in terms of electric strength and life endurance (voltage endurance coefficient), so that failure probability (due to intrinsic aging) could be calculated for a specified life of 30 years, which relates to insulation thickness: Section 5. PDIV measurements under AC voltage, 60 Hz, are performed to validate the values calculated from the model (3rd leg), Section 6. Notably, while the three-leg approach has already been thoroughly described and applied successfully on different types of insulation systems, this is the first time it is used for splice reliability evaluation and the upgrade to higher voltage and power of polymeric cable splices.
Subsequently, accelerated aging tests were performed on LV splices to enable a forensic investigation of potential PD and failure roots when increasing nominal voltage. This framework makes available an innovative tool to re-design a splice for any level of MV application, considering both intrinsic aging (insulation layer thickness) and risk of PD (PD-free design at nominal voltage), as described in section VII.
2. Splice Structure
The structure of the reference cable splice, successfully developed and used for LV applications, is depicted in the 3D cross-section of Figure 1. The splice is composed of a splice body (housing), compression bushing, inner and outer rings, Cross-linked Polyethylene (XLPE) insulation, conductor and Melni’s Dual Helix Spiral Contact (spring) connecting two conductor parts. This structure makes easy assembling the splice in the field, minimizing man operation time and mistake risks.
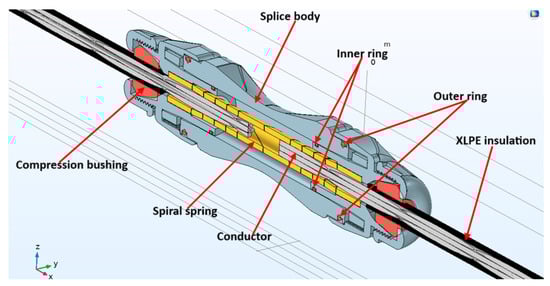
Figure 1.
Schematic of an LV cable splice design in 3D cross-section indicating the components of the splice. Splice body is highlighted in gray color, inner ring, outer rings, and compression bushing are shown in red color. The conductor is highlighted in white color, while the XLPE insulation is shown in black color.
3. Electric Field Simulation for the Test Cell and Cable Splice Arrangement (Leg 1 of the Three-Leg Approach)
Electric field simulation was performed on the reference cable splice using COMSOL Multiphysics 6.3, at an applied voltage of 1 kV AC RMS, 60 Hz, using a configuration that fits the experimental setup for modeling validation (3rd leg, see later). The LV cable splice was positioned inside a plastic container (made from High Density Polyethylene, HDPE) filled with salted water. The dimensions of the container are 25 × 25 × 20 inches. Additionally, a ground electrode was submerged in salted water to establish a ground connection. Figure 2 shows the schematic of an LV cable splice design in 2D cross-section alongside the ground electrode placed in a salted-water plastic container. Table 1 reports LV cable splice components, material and relative permittivity used in the simulations. The salt water was considered a perfect conducting medium.
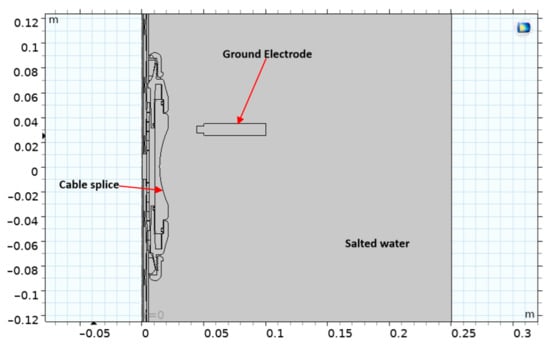
Figure 2.
Schematic of an LV cable splice design in 2D cross-section alongside the ground electrode placed in a salt-water plastic container (validation test cell).

Table 1.
Materials, Dimensions, and Relative Permittivity Values used in Simulations (GF30 is 30% Fiber Glass Insulating Material).
Figure 3 displays the electric field distribution in the air gap between the spring helix and the splice body, and around the silicone rubber ring, simulated at 1 kV AC. It can be observed that the electric field is more concentrated at the sharp border of the helix than at the ring. Figure 3b,c show that the peak electric field (Ep) at the helix border is 0.62 kV/mm, while, at the rubber ring, it is 0.24 kV/mm. Since the peak electric field at the helix is higher than at the rubber ring, this might indicate that PD will more likely incept at the helix border than at the ring (at the PDIV).
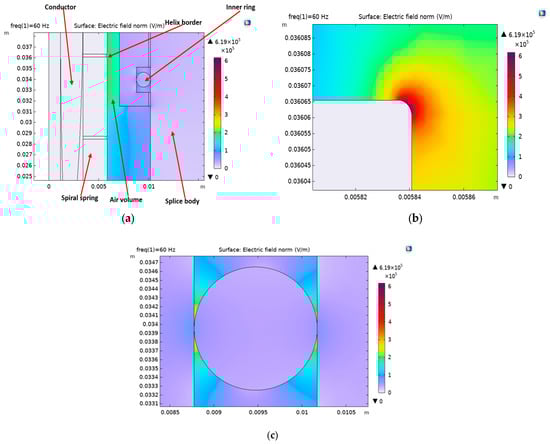
Figure 3.
Electric field simulation in the reference LV splice 1 kV AC: (a) Picture showing electric field distribution at the spring helix border and around the inner ring. (b) Zoomed view showing electric field concentration at the helix border (edge), Ep = 0.62 kV/mm. (c) Zoomed view showing electric field concentration due to the air gap around the inner ring, Ep = 0.24 kV/mm.
4. Modeling of the PD-Inception Field and Voltage, PDIE and PDIV (Leg 2 of the Three-Leg Approach)
The modeled value of AC PDIE and PDIV were calculated through the recently developed generalized PD inception field model, using parameter values that hold for internal air-gap discharges [19]:
where PDIE or is the partial discharge inception field, is the critical reduced field, and are parameters related to the physics of the ionization process, is a scale factor that takes into account the field gradient in the volume/surface where the electric field is maximum, and p is pressure. For internal discharges, = 1 and is the height of the volume of the air gap consisting of the distance between the spring helix border (edge) and the splice body. Here, the volume discharges can be promoted by the orthogonal field developed across the air gap between the spring helix (considered the HV electrode) and grounded splice body (which are identified as internal discharges). Being the height of the air gap, h = 1.2 mm, the calculated inception field at standard atmospheric pressure (SAP) is Ei = 4.5 kV/mm.
The PDIV at the helix sharp border is estimated as follows [18]:
where is the peak value of simulated orthogonal field at voltage Ep value at the helix sharp border is calculated, from (1), as 0.6 kV/mm at 1 kV AC and the corresponding PDIV is estimated, from (2), as 7.9 kV.
Additionally, to further investigate the weakest points that can incept PD in the insulation system of the cable splice, PDIV values at both the inner and outer silicone rubber ring were calculated. Due to the low concentration of electric fields at these locations, the estimated PDIV values are much higher than the nominal voltage. Indeed, the peak electric fields at the inner and outer rings are Ep = 0.24 kV/mm and Ep = 0.1 kV/mm, respectively, while their corresponding estimated PDIV values are 53 kV and 117 kV. This indicates that PD activity within the cable splice would be more likely incepted at the spring helix border due to a high electric field caused by a sharp helix edge surrounded by air. It should be noted that the PD-inception field values around the rings were calculated using an air gap height of h = 35 µm.
5. Design Field and Insulation Thickness Calculation (Leg 2 of the Three-Leg Approach)
Electrical insulating materials planned to be used in LV/ MV cable splices were characterized in terms of their electric strength and design electric field, ED. For calculating the latter, a life endurance model (for intrinsic aging) was used, so that ED could be estimated for a specified design life, LD, of 30 years, at any chosen failure probability, and a reference voltage of 400 V (close to nominal voltage). The relationship between the design field and nominal voltage provides the thickness of each insulation sub-system. The focus in the following is on GF30, which is the reference insulating material used in many parts of the LV/MV cable splice (such as on the splice outer housing, splice compression cap, and ratcheting end cap).
5.1. Electrical Insulation Intrinsic Life Models
Electrical life modeling plays a pivotal role in insulation system design and reliability. Life models are used to forecast the design electric field (stress) at a requested life and failure probability. Electrical insulation performance is related to breakdown strength (BS), which (under uniform field) is the ratio of breakdown voltage to the insulation thickness, and to life-line characteristics, mainly the voltage endurance coefficient, i.e., in the inverse power model [20,21,22], which is the most-often-used electrothermal intrinsic life model:
ER, tR is a life-line reference point (for example, electric strength, ES0, being tR = t0, the time to failure for ER = ES0), n is the voltage endurance coefficient, is the reference power supply frequency and f is the test frequency or modulation frequency in the case of a pulse width modulation (PWM) supply. In general, to accelerate life test, f > f0. Since, in our case, the supply frequency is the same as the test frequency, .
Model parameters are a function of temperature; thus, their value can change depending on service operation (load). In order to generalize model (3) to fit a probabilistic approach able to associate a failure percentile with life and design field, the Weibull distribution of failure times, , can be used [20,21].
where and scale and shape parameter, respectively. While is related to data dispersion (standard deviation), α is the failure time at probability of 63.2%.
Therefore, model (3) can replace in Equation (4), thus achieving a generalized electrothermal probabilistic life model that can be linearized in a log-log coordinate system. It can provide an estimate of ED at failure probability F(LD) = P from
Being
Often, a value of ≈ 1 can be taken (failure time dispersion is generally high), as also indicated in [20,21,23].
It should be noted that Equation (5) holds for AC and DC (referring to peak voltage), as well as when insulation is subjected to PD, but in the latter case has, generally, lower value than for intrinsic aging. Knowing (ER, tR) = (ES0, t0), obtained, e.g., from breakdown tests, and , estimated through accelerated life test, and fixing design life (e.g., 30 years at failure probability of 5%, which is a typical value for MV cable reliability), the design field value can be obtained. Since breakdown strength (BS) tests are generally carried out at increasing, and not constant voltage, the resulting failure time, , is not coincident with tR = t0 of Equations (3) and (5), which corresponds to failure time at constant electric stress/voltage. An expression correlating tS0 and t0 is given by the following expression [24]:
Based on the experimental results obtained, rising voltage with a rate of 10 kV/min, which causes breakdown in a few minutes, which is a typical type in breakdown strength tests [23], and the cell with cylindrical electrodes of Figure 4 (with flat specimens as test object, immersed in insulation oil), the mean value of breakdown voltage, BV, was 21 kV, corresponding to an electric field strength of 30.8 kV/mm (under the assumption of uniform field at the breakdown location and mean insulation thickness 0.68 mm).
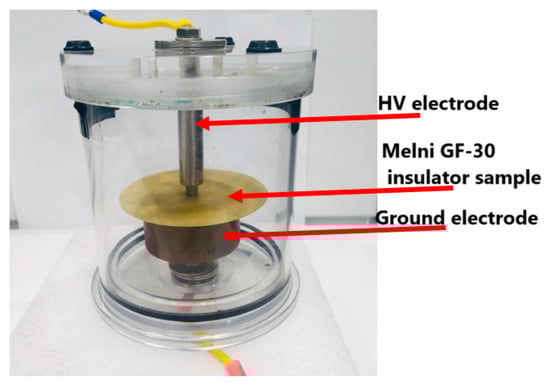
Figure 4.
Test cell used for breakdown strength and accelerated life testing. Flat specimen and cylindrical electrodes. HV electrode has a diameter of 6.3 mm and curvature radius of 0.8 mm.
Accelerated life tests at 0.9 and 0.75 BV were carried out by using the cell of Figure 4, to have a rough estimation (in short times) of the voltage endurance coefficient, n, of Equation (3), which is inversely proportional to the life-line slope linearized by Equation (5). Figure 5 shows the experimental points (including ES0, t0, Equation (7)), at a failure probability of 63.2%, and the regression (life) line obtained by the model Equation (5) for the tested GF30 specimens. The estimated values of n and ED are ≈15 and 9.5 kV/mm, respectively. By using model (5), the design field at a failure probability of 5% is calculated as 7.8 kV/mm.
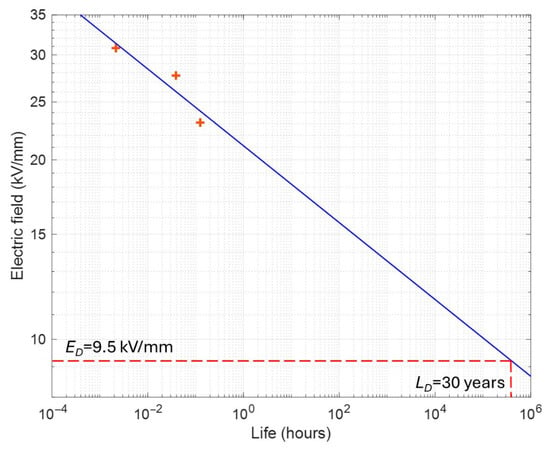
Figure 5.
Experimental points at probability of 63.2% and relevant lifeline. The voltage endurance coefficient, n, is ≈ 15. The design field for GF30 with a life of 30 years at a failure probability of 63.2% is ED = 9.5 kV/mm, which becomes 7.8 kV/mm at a failure probability of 5%.
Notably, the estimated design field is based on the assumption of the validity of model (1), with the parameters estimated by breakdown strength and accelerated life test, in the whole test and extrapolation range. Hence, caution should be taken to use the above estimated value for cable splice design without carrying out longer accelerated life tests.
5.2. Insulation Thickness Estimation
Knowing ED and varying the nominal voltage, the insulation thickness (d) of the GF30 insulation used, e.g., in the cable splice housing, can be estimated. For example, if the nominal voltage VN = 10 kV, the design field ED = 7.8 kV/mm, and, when the field is almost uniform (which might not always be the case), d can be calculated as follows:
thus, d = 1.3 mm. On the contrary, when the nominal voltage is 400 V, the insulation thickness could become as low as d = 0.05 mm. If the field is divergent, Equation (8) does not strictly hold, and a conservative calculation reference could be made to the maximum field. Very often, reference is made to the mean field; thus, in practice, referring to Equation (5) even when the field is divergent can be a common practice.
6. PDIV Measurements Under AC Voltage for Validation of Results Predicted (Leg 3 of the Three-Leg Approach)
To validate the estimated PDIV value derived from leg 2, experimental PDIV measurements were performed under AC voltage, 60 Hz (leg 3).
6.1. Test Arrangement
The mean voltage at which PD incepts is referred to as PDIV. According to IS/IEC 60270:2000 [25], AC PDIV corresponds to the applied voltage at which repetitive partial discharges are first observed in the test object, when the applied voltage gradually increased from a lower value at which no partial discharges are observed. The PDIV study was carried out by placing splice specimens in a water-salt-based test cell as in Figure 2 and Figure 6. The splice inner conductor acts as the high-voltage electrode, while a cylindrical aluminum electrode immersed in the test cell is connected to ground. As indicated in Figure 6, the PD test arrangement is composed of a high-voltage coupling capacitor acting as a PD coupler. A voltage divider provides the synchronization signal for the PD measurement unit, which allows PD pulses to be related to the applied AC voltage supply in terms of phase-resolved partial discharge (PRPD) pattern. A high-frequency current transformer (HFCT) is used as a PD sensor. It is clamped around the ground lead, i.e., in series with the test cell, so that all PD current pulses emerging from the test cell can pass through the HFCT sensor. The HFCT is eventually connected to the PD detector system.
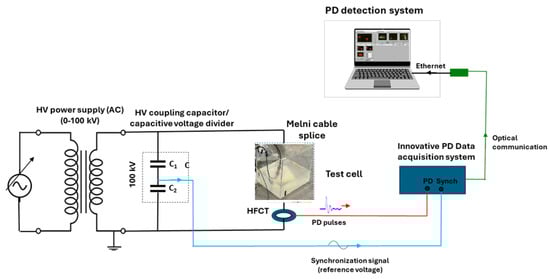
Figure 6.
Electrical layout of experimental setup for PD testing on LV cable splice submerged into a salt-water container.
6.2. PD Measurement Results and Analysis
To acquire and analyze the PD activity, an innovative, fully automatic PD detector was used. PD measurements were processed by algorithms that are structured according to the SRI (Separation, Recognition, Identification) logic. Separation of PD from noise is accomplished by procedures that cluster acquired signals by signal processing using principal component analysis (PCA) [26]. Recognition of whether a separated cluster consists of PD or noise is based on signal processing and statistical tests performed on signal characteristics, recognizing those related to noise or PD. Separation and Recognition allow sub-patterns to be obtained from the general acquisition patterns, which contain PD (sometimes due to different types of sources) and noise, separately. PD sub-patterns are the basis for enabling the Identification of the type of source generating PD, a fundamental tool for diagnostics and condition assessment of electrical power equipment. Various markers are considered by a fuzzy-logic-based approach [26,27], according to which PD can be primarily identified as belonging to three categories, i.e., the internal, surface, and/or corona discharges.
Prior to carrying out PDIV tests on cable splices, the experimental setup of Figure 6 was tested and ensured that it was PD-free. The PDIV was estimated as the mean value of at least five measurements carried out according to the IEC 60270 standard. The test voltage gradually increased (at a step of 100 V) until PD signals were observed steadily.
Figure 7 displays an example of the PRPD patterns for the LV cable splice sample obtained at 1.1 times PDIV. As can be seen, identification likelihood (the output of the fuzzy logic algorithm) is 90% internal, which points out that, as expected, PD might occur in the air volume adjacent to the spring helix. The mean value of the experimental PDIV (from five repeated measurements) was 8 kV (±0.4 kV at probability 95%), which is quite close to the theoretical (estimated) PDIV value of 7.8 kV, calculated using the model at leg 2 and referring to the air gap at spring helix border. The good match between calculated and experimental PDIV values validates the estimated PDIV, and, in general, supports the validity of the three-leg approach for PD-free design of MV splices.
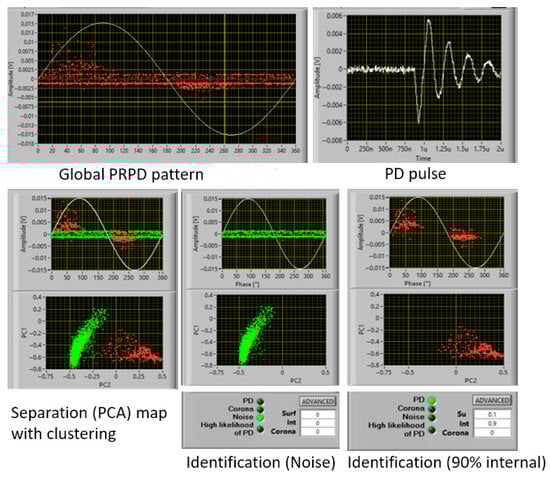
Figure 7.
Screenshot of PD measurement software for a cable splice, at 1.1 PDIV showing the global Phase-resolved PD (PRPD) pattern, PD pulse, Separation (PCA) map with clustering, Recognition of noise and PD, and Identification of the type of PD (likelihood of 10% surface and 90% internal discharges).
7. Accelerated Aging till Breakdown of LV Cable Splice, Design and Forensic Considerations
The further validation step was to perform accelerated aging tests of the LV splice specimen till breakdown (at room temperature and standard atmospheric pressure) in order to show how and where a prolonged PD activity on a cable splice can degrade the insulation surface and cause the splice failure. In this experiment, the test arrangement for PD measurements, as in Figure 6, was used by gradually increasing the applied voltage above the PDIV level in steps of 2 kV/min. The advantage of this approach is the capability to trigger and steadily grow PD till breakdown, which can be achieved in relatively short times. Keeping constant voltage and increasing temperature would not possibly promote PD, and, in any case, their growth and breakdown time would be unpredictable. Thus, this procedure would be useless for modeling validation and forensic investigation. The test voltages used in the experiment of breakdown test under PD aging were 8 kV, 12 kV, 14 kV, 15 kV, and 16 kV. It should be noted that each test voltage was kept constant for 2 h where PD activity was measured after every 30 min till splice breakdown. The total aging-based breakdown time for this LV cable splice sample lasted for 13 h, when the breakdown occurred at 16 kV after 1 h of voltage application. The purpose of applying the voltage to the sample for a longer duration was to let PD evolve and cause degradation marks, which can be forensically examined after failure. Figure 8 highlights breakdown phenomenology, which is indicated by the tracks (paths) in the form of channels created on the insulation of the cable splice body.
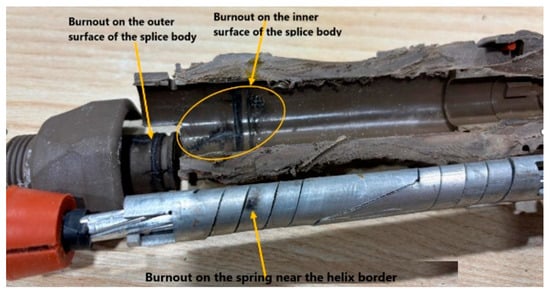
Figure 8.
Breakdown traces on the cable splice sample after accelerated aging test where burnouts are shown on some splice components, such as on the inner and outer surface of the splice body, and on the surface of the helical spiral aluminum spring (helix border). They constitute an indication of PD activity location and development inside the cable splice.
Forensic investigation on failed LV splice specimens was carried out by opening them to pinpoint the probable source of PD activity and breakdown occurrence inside the cable splice. We found out clear breakdown tracks (indicated by burnout blackish spots) inside the splice, which is indicated by the tracks (paths) in the form of channels created on the insulation of the cable splice body. The effect of a long duration of PD activity inside the cable splice is evidenced by the burning (burnout spots) that occur, e.g., on the outer surface and inner surface of the splice body due to a high electric field in air gaps between the splice body and the helix border of the spiral spring. This confirms that PD activity within the cable splice was incepted at the spring helix border due to a high electric field caused by a sharp helix edge surrounded by air. Thus, the three-leg approach is further validated to be a promising tool that can be used in insulation system design.
As an example of the enhanced design support provided by the approach developed here, Figure 9 shows the impact of spring helix curvature radius on electrical field profile and, therefore, the consequent action to be taken for a reliable design. As can be seen, increasing the curvature radius from 0.5 µm to 10 µm, the maximum field is decreasing; thus, PDIV increases. Above a 5 µm curvature radius, the field and PDIV display reduced variation. This can be seen as an optimization procedure to spot out the convenient curvature radius, which is critical for system reliability.
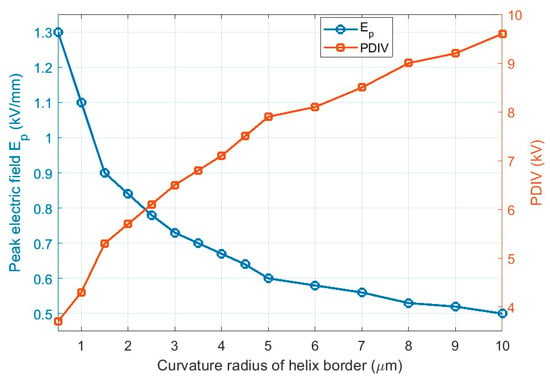
Figure 9.
Impact of spring helix curvature radius on electrical field profile and PDIV.
8. Conclusions
To scale up an LV insulation system design to MV, the main issues are reaching specified life at a given failure probability (reliability), which is associated with intrinsic insulation aging (electrothermal stress), and achieving PD-free operating conditions at a certain nominal voltage. The application of the three-leg approach allows both objectives to be reached. Specifically, the estimated PDIV of LV splice obtained from leg 2 is validated by the experimental PDIV (leg 3), lying within the 95% confidence interval of the mean experimental PDIV of 8 kV. While this is applied to the type of innovative splice here considered, it can be speculated that such an approach holds, in general, to elevate the nominal operating voltage of any type of insulation system. Work is ongoing to test various configurations of MV splices designed on this basis, by varying design parameters, in order to strengthen the validation of the proposed innovative design procedure.
Author Contributions
Conceptualization, G.C.M.; methodology, G.C.M.; software, J.P.U. and S.B.M.; validation, G.C.M., J.P.U., S.B.M., C.W. and M.M.; formal analysis, G.C.M., J.P.U. and S.B.M.; investigation, G.C.M., J.P.U. and S.B.M.; resources, G.C.M., C.W. and M.M.; data curation, J.P.U. and S.B.M.; writing—original draft preparation, G.C.M., J.P.U. and S.B.M.; writing—review and editing, G.C.M., J.P.U. and S.B.M.; visualization, J.P.U. and S.B.M.; supervision, G.C.M.; project administration, G.C.M., C.W. and M.M.; funding acquisition, G.C.M., C.W. and M.M. All authors have read and agreed to the published version of the manuscript.
Funding
This research was supported by the U.S. Department of Energy (DOE) under grant number DE-FOA-0003047.
Data Availability Statement
The original contributions presented in this study are included in the article. Further inquiries can be directed to the corresponding author.
Conflicts of Interest
Authors Cameron Williams and Mark Melni were employed by the Melni Technologies, Melni LLC. The remaining authors declare that the research was conducted in the absence of any commercial or financial relationships that could be construed as a potential conflict of interest.
Abbreviations
The following abbreviations are used in this manuscript:
| LV | Low Voltage |
| MV | Medium Voltage |
| HV | High Voltage |
| PD | Partial Discharge |
| PDIV | Partial Discharge Inception Voltage |
| PDIE | Partial Discharge Inception Field |
| SAP | Standard Atmospheric Pressure |
| XLPE | Cross-Linked Polyethylene |
| HFCT | High-Frequency Current Transformer |
| BV | Breakdown Voltage |
| BS | Breakdown Strength |
References
- The Advanced Research Projects Agency-Energy (ARPA-E). Available online: https://arpa-e.energy.gov/programs-and-initiatives/view-all-programs/gophurrs (accessed on 1 July 2024).
- Jahromi, A.N.; Pattabi, P.K.; Lo, S.; Densley, J. Approaches to the forensic failure investigation of medium voltage polymeric cables. In Proceedings of the IEEE Electrical Insulation Conference (EIC), Knoxville, TN, USA, 22 June–3 July 2020; pp. 85–89. [Google Scholar]
- Pompili, M.; Calcara, L.; Sangiovanni, S. MV Underground Power Cable Joints Premature Failures. In Proceedings of the AEIT International Annual Conference (AEIT), Catania, Italy, 23–25 September 2020; pp. 1–4. [Google Scholar]
- Mingotti, A.; Babaei, F.; Tinarelli, R.; Peretto, L. Medium-Voltage AC Cable Joints: A Review of Testing Methods, Standards, and Emerging Trends. Sensors 2025, 25, 3843. [Google Scholar] [CrossRef] [PubMed]
- Emdadi, K.; Gandomkar, M.; Aranizadeh, A.; Vahidi, B.; Mirmozaffari, M. Overview of Monitoring, Diagnostics, Aging Analysis, and Maintenance Strategies in High-Voltage AC/DC XLPE Cable Systems. Sensors 2025, 25, 7096. [Google Scholar] [CrossRef] [PubMed]
- Yang, F.; Liu, K.; Cheng, P.; Wang, S.; Wang, X.; Gao, B.; Fang, Y.; Xia, R.; Ullah, I. The coupling fields characteristics of cable joints and application in the evaluation of crimping process defects. Energies 2016, 9, 932. [Google Scholar] [CrossRef]
- Mesino, E.G.; Caicedo, J.; Mamani, M.; Quete, D.R.; Piamba, A.C.; Gomez, D.G.; Mayor, G.A.; Erazo, J.C.; Lopez, W.M.; Jay, E.; et al. Condition Assessment of Medium Voltage Assets: A Review. Adv. Sci. Technol. Eng. Syst. J. 2023, 8, 35–54. [Google Scholar] [CrossRef]
- IEC 60505; Evaluation and Qualification of Electrical Insulation Systems. 4th ed. IEC: Geneva, Switzerland, 2011.
- IEC 60034-27-1; Rotating Electrical Machines. Off-Line Partial Discharge Measurements on the Winding Insulation. IEC: Geneva, Switzerland, 2019.
- Densley, J. Review of international standards and practices for medium voltage power cable diagnostics. In Proceedings of the IEEE International Conference on Solid Dielectrics, Winchester, UK, 8–13 July 2007; pp. 711–716. [Google Scholar]
- IEEE Std 1434-2014; IEEE Guide for the Measurement of Partial Discharges in AC Electric Machinery. Institute of Electrical and Electronics Engineers: New York, NY, USA, 2014.
- Kreuger, F.H. Partial Discharge Detection in High-Voltage Equipment; Butterworth-Heinemann: London, UK, 1990. [Google Scholar]
- Dissado, L.A.; Fothergill, J.C. Electrical Degradation and Breakdown in Polymer; Peter Peregrinus Press: London, UK, 1992. [Google Scholar]
- Morshuis, P.H. Degradation of solid dielectrics due to internal partial discharge: Some thoughts on progress made and where to go now. IEEE Trans. Dielectr. Electr. Insul. 2005, 12, 905–913. [Google Scholar] [CrossRef]
- Hu, X.; Yang, S.; Du, Q.; Chen, X.; Tang, F. Radio-Frequency Detection of Partial Discharge in Power Cable Joints. IEEE Trans. Power Deliv. 2024, 39, 317–324. [Google Scholar] [CrossRef]
- Dang, C.; Côté, J. Performance and Diagnosis of Aluminum Connectors Tested Inside MV Cable Splices. IEEE Trans. Compon. Packag. Manuf. Technol. 2018, 8, 2098–2106. [Google Scholar] [CrossRef]
- Cambareri, P.; Montanari, G.C. Derivation of a Surface Discharge Model for the Design of the Surface Components of Insulation Systems used in Industrial Electronics Environments. IEEE J. Emerg. Sel. Top. Ind. Electron. 2022, 4, 698–706. [Google Scholar] [CrossRef]
- Montanari, G.C.; Nath, D.; Cambareri, P. A new approach to the design of surface subsystems of polymeric insulators for HV and MV apparatus under AC voltage. High Volt. 2023, 8, 651–658. [Google Scholar] [CrossRef]
- Montanari, G.C.; Cambareri, P. PD-Free Design of Insulation Systems: An Application to Laminated Busbars. Appl. Sci. 2024, 14, 10171. [Google Scholar] [CrossRef]
- Montanari, G.C.; Bononi, S.F.; Albertini, M.; Siripurapu, S.; Seri, P. The Dimensional Approach in the Design and Qualification Tests of AC and DC HV Cables: The Occhini Approach Revisited. IEEE Trans. Power Deliv. 2020, 35, 2119–2126. [Google Scholar] [CrossRef]
- Montanari, G.C.; Cacciari, M. A probabilistic insulation life model for combined thermal-electrical stresses. IEEE Trans. Elect. Insul. 1985, EI-20, 519–522. [Google Scholar] [CrossRef]
- Myneni, S.B.; Montanari, G.C. Accelerated aging tests to evaluate partial discharge endurance of insulating materials for HV electric aircraft assets. In Proceedings of the AIAA Aviation Forum and ASCEND co-located Conference, Las Vegas, NV, USA, 9 July–2 August 2024. [Google Scholar]
- IEEE Std 930-2005; IEEE Guide for the Statistical Analysis of Electrical Insulation Breakdown Data. Institute of Electrical and Electronics Engineers: New York, NY, USA, 2005.
- Montanari, G.C.; Mazzanti, G.; Simoni, L. Progress in electrothermal life modeling of electrical insulation during the last decades. IEEE Trans. Dielectr. Electr. Insul. 2002, 9, 730–745. [Google Scholar] [CrossRef]
- IEC 60270; High-Voltage Test Techniques—Partial Discharge Measurements. 3rd ed. International Electrotechnical Commission: Geneva, Switzerland, 2015.
- Seri, P.; Ghosh, R.; Montanari, G.C. An unsupervised approach to partial discharge monitoring in rotating machines: Detection to diagnosis with reduced need of expert support. IEEE Trans. Energy Conv. 2021, 36, 2485–2492. [Google Scholar] [CrossRef]
- Contin, A.; Cavallini, A.; Montanari, G.C.; Pasini, G.; Puletti, F. Digital detection and fuzzy classification of partial discharge signal. IEEE Trans. Dielectr. Electr. Insul. 2002, 9, 335–348. [Google Scholar] [CrossRef]


Disclaimer/Publisher’s Note: The statements, opinions and data contained in all publications are solely those of the individual author(s) and contributor(s) and not of MDPI and/or the editor(s). MDPI and/or the editor(s) disclaim responsibility for any injury to people or property resulting from any ideas, methods, instructions or products referred to in the content. |
© 2026 by the authors. Licensee MDPI, Basel, Switzerland. This article is an open access article distributed under the terms and conditions of the Creative Commons Attribution (CC BY) license.