Article

Integrated Triple-Diode Modeling and Hydrogen Turbine Power for Green Hydrogen Production

by
Abdullah Alrasheedi
1,*,
Mousa Marzband
2 and
Abdullah Abusorrah
2
1
Department of Electrical and Computer Engineering, Faculty of Engineering, King Abdulaziz University, Jeddah 21589, Saudi Arabia
2
Center of Research Excellence in Renewable Energy and Power Systems, Department of Electrical and Computer Engineering, King Abdulaziz University, Jeddah 21589, Saudi Arabia
*
Author to whom correspondence should be addressed.
Energies 2026, 19(2), 435; https://doi.org/10.3390/en19020435
Submission received: 23 December 2025 / Revised: 8 January 2026 / Accepted: 12 January 2026 / Published: 15 January 2026
(This article belongs to the Special Issue Advances in Hydrogen Production in Renewable Energy Systems)

Abstract

The study establishes a comprehensive mathematical modeling framework for solar-driven hydrogen production by integrating a triple-diode photovoltaic (PV) model, an alkaline electrolyzer, and a hydrogen turbine (H2T), subsequently using hybrid power utilization to optimize hydrogen output. The Triple-Diode Model (TDM) accurately reproduces the electrical performance of a 144-cell photovoltaic module under standard test conditions (STC), enabling precise calculations of hourly maximum power point outputs based on real-world conditions of global horizontal irradiance and ambient temperature. The photovoltaic system produced 1.07 MWh during the summer months (May to September 2025), which was sent straight to the alkaline electrolyzer. The electrolyzer, using Specific Energy Consumption (SEC)-based formulations and Faraday’s law, produced 22.6 kg of green hydrogen and used around 203 L of water. The generated hydrogen was later utilized to power a hydrogen turbine (H2T), producing 414.6 kWh, which was then integrated with photovoltaic power to create a hybrid renewable energy source. This hybrid design increased hydrogen production to 31.4 kg, indicating a substantial improvement in renewable hydrogen output. All photovoltaic, electrolyzer, and turbine models were integrated into a cohesive MATLAB R2024b framework, allowing for an exhaustive depiction of system dynamics. The findings validate that the amalgamation of H2T with photovoltaic-driven electrolysis may significantly improve both renewable energy and hydrogen production. This research aligns with Saudi Vision 2030 and global clean-energy initiatives, including the Paris Agreement, to tackle climate change and its negative impacts. An integrated green hydrogen system, informed by this study’s findings, could significantly improve energy sustainability, strengthen production reliability, and augment hydrogen output, fully aligning with economical, technical, and environmental objectives.

1. Introduction

Saudi Vision 2030 aspires to combat climate change by boosting power production from renewable energy sources, which will pose difficulties for Saudi power infrastructure and require a balance of supply and demand. As renewable energy becomes more prevalent, the significance of adaptable low-carbon technology will grow. The government aims to achieve net-zero emissions by 2060 and reduce dependency on fossil fuels by decarbonizing the transportation, industrial, and energy sectors [1]. NEOM underscores the worldwide transition to renewable-energy urban centers and the need for sophisticated solutions to address the intermittency of solar and wind resources. The analysis underscores that extensive hydrogen production, storage, and hydrogen-fueled electrical generation are crucial for NEOM to establish a dependable, low-carbon, and entirely renewable energy system. The introduction identifies hydrogen as the crucial facilitator for achieving NEOM’s long-term sustainability and energy security objectives [2].
To mitigate carbon dioxide (CO2) emissions from energy production, hydrogen has attracted considerable interest as a viable alternative, yielding solely water vapor as a byproduct. The worldwide interest in hydrogen is now on the rise, with several nations implementing laws and measures to enhance its production and use. Gas turbines are essential for fulfilling global energy requirements, offering efficient and adaptable options for electricity production and industrial use [3]. Gas turbines are crucial for meeting global energy demands, providing efficient and flexible power generation options. There is a growing focus on hydrogen as a key energy carrier for decarbonizing difficult sectors and enhancing the flexibility of systems reliant on variable renewable energy. The model indicates that electrolyzers, when paired with renewable energy output and hydrogen storage, can produce hydrogen. This suggests that utilizing hydrogen in gas turbines could facilitate time-shifting in power production, particularly as the share of variable renewable energy increases [4].
Hydrogen turbines (H2T) enhance power system flexibility and renewable energy integration by pairing wind or solar energy with hydrogen production. This method utilizes surplus renewable energy while generating clean fuel for turbines, minimizing energy restriction and improving grid stability. Wind-to-hydrogen systems can act as controllable loads, supporting DC connection stability. Hydrogen-fueled turbines offer reliable power management and bolster voltage and frequency stability, particularly under weak grid conditions or low-voltage ride-through events [5]. Incorporating hydrogen into natural gas infrastructure, via co-firing in gas turbine combined-cycle (GTCC) plants, is an efficient way to reduce emissions with little capital expenditure. This technology promotes hydrogen utilization in a variety of applications, including gas-to-liquid processes and fuel cells; therefore, it assists in the shift to cleaner energy. Advances in hydrogen combustion technology, particularly in turbines with high hydrogen concentration, suggest that this approach is a viable option for considerable carbon reductions while preserving reliability and efficiency [6].
Green hydrogen refers to hydrogen produced by methods that harness renewable energy sources [7]. Technologies for green hydrogen generation are essential for decarbonizing hard-to-abate industries, particularly in Saudi Arabia’s petrochemical sector. Hydrogen is seen as a cost-effective long-term energy storage solution, potentially aiding the integration of intermittent renewable energy. Its anticipated role is crucial for establishing a sustainable energy framework [1]. Numerous water electrolysis systems are available, varying mainly by the type of electrolyte used. The three main types include alkaline electrolyzers (AEL), proton exchange membrane cells (PEM), and solid oxide electrolysis cells (SOEC). AEL and PEM typically operate at near ambient temperatures (up to 90 °C), while SOECs function at higher temperatures (700 to 950 °C). Electrolytic-grade hydrogen is utilized as a cooling medium in energy sectors and is increasingly sought for energy storage from renewable sources, smart-grid flexibility, and hydrogen vehicle refueling stations [8]. Alongside hydrogen-based storage, advanced thermal energy storage (TES) technologies have arisen as crucial facilitators for extensive renewable energy integration. Modern thermal energy storage methods encompass sensible heat storage utilizing molten salts, phase change materials (PCMs) that leverage latent heat phenomena, and thermochemical energy storage systems that provide elevated energy density and prolonged storage duration. Recent studies emphasize the significance of hybrid TES configurations in enhancing system flexibility, minimizing renewable curtailment, and facilitating sector coupling among power, heat, and hydrogen systems. While TES primarily focuses on thermal energy management, its integration with hydrogen and power systems is increasingly acknowledged as a synergistic approach to augmenting overall energy system resilience and sustainability [9]. An alkaline water electrolyzer is included in the system for hydrogen generation. Alkaline electrolyzers use an alkaline electrolyte solution, such as potassium hydroxide, to facilitate the transport of hydroxide ions between the anode and cathode. Although alkaline electrolyzers have extended cold-start durations, they provide more economical solutions and superior stack longevity compared to other electrolyzer technologies [10].
An accurate depiction of photovoltaic (PV) performance necessitates comprehensive modeling of semiconductor physics and nonlinear current–voltage (I–V) characteristics, influenced by factors such as irradiance, temperature, and internal recombination. While single-diode and double-diode models are common, their oversimplifications limit precision in specific conditions. The triple-diode model (TDM) enhances electrical representation by incorporating three diode branches, addressing issues like diffusion, depletion-region recombination, and leakage effects. This model aligns I–V curves across various conditions and improves physical realism and parameter identifiability, making it particularly relevant for high-efficiency PV modules and advanced technologies, despite its computational complexity. The TDM is increasingly recognized for accurate parameter extraction and performance forecasting in PV modeling systems [11,12,13].
Hydrogen production (H2P) can enhance system adaptability and decarbonization. This study examines renewable-driven hydrogen routes, focusing on energy conversion and system efficiency, using a triple-diode model (TDM) for accurate PV performance representation. Unlike prior research, it integrates a PV-electrolyzer-(H2) turbine hybrid architecture and reintroduces (H2T) power into the electrolysis process, creating a closed-loop system that improves (H2P) without extra renewable capacity. This innovative modeling and feedback mechanism provide a comprehensive evaluation of solar-driven (H2) systems [14].
This work provides an integrated and scientific contribution to renewable energy modeling by addressing the full framework from PV-power modeling to H2P production based on hybrid power. This multi-phase integration of PV modeling, H2 generation, H2 storage, and hydrogen-to-power conversion provides a cohesive approach that has not been investigated with this degree of time fidelity and scientific specificity:
SC1: A sophisticated photovoltaic characterization framework is developed using the Triple-Diode Model (TDM), facilitating precise estimates of PV characteristics across diverse irradiance and temperature circumstances. This improves the accuracy of I–V curve reconstruction and P mpp prediction relative to other methods.
SC2: The study establishes a comprehensive hydrogen production model that correlates PV-generated energy with Specific Energy Consumption (SEC) and Faraday-based electrochemical equations, enabling precise measurement of hydrogen outputs on an hourly, daily, and monthly basis.
SC3: The study contains a full H2T framework that translates H2 mass transfer into energy using real turbine efficiencies and H2’s lower heating value (LHV), allowing for a detailed examination of green H2 utilization techniques.
SC4: The study presents an innovative hybrid ( P PV P H 2 ) power framework, wherein H2 generated from excess PV-power production is stored and subsequently transformed into dispatchable turbine power, thus establishing a cohesive approach to evaluating system-level efficiency, energy equilibrium, and long-term utilization of renewable energy within a Saudi environment.
H2-based power conversion is being increasingly investigated for system integration, focusing on both H2P and its recoverable energy contribution to power systems within efficiency limits. Key losses occur during electrical-to-chemical conversion in electrolysis, storage, conditioning, and chemical-to-electrical conversion in turbines, limiting overall round-trip performance. Research on H2-fueled gas turbines and co-firing in GTCC architectures indicates that energy-recovery measures, like combined-cycle utilization and operational flexibility, enhance H2’s dispatchable resource value. This study quantifies H2-to-power recovery using an LHV-based turbine and assesses a hybrid feedback scheme to improve electrolysis and H2P under realistic conditions.
The proposed TDM–AEL–H2T system significantly diverges from traditional power-to-H2-to-power (P2H2P) frameworks due to three essential architectural and modeling differences, in addition to model coupling. The PV subsystem is modeled using a physics-based TDM, allowing for the precise characterisation of diffusion, depletion-region recombination, and leakage/grain-boundary losses often overlooked in SDM- and DDM-based PV–electrolysis analyses. Secondly, the system undergoes assessment by high-resolution hourly simulations over an extended summer duration, effectively capturing intraday, diurnal, and seasonal fluctuations in irradiance and temperature that are sometimes oversimplified in steady-state or daily evaluations. Crucially, in contrast to traditional open-chain P2H2P configurations, the proposed design has a closed-loop hybrid topology that recovers power from H2 turbines (H2T) using stored H2, which is then reintegrated with PV electricity to facilitate electrolysis. This power-recycling mechanism allows the direct measurement of energy recovery, hybridization benefits, and enhancements in H2 generation without requiring further PV capacity, offering a coherent and comprehensive assessment of solar-driven H2 processes.
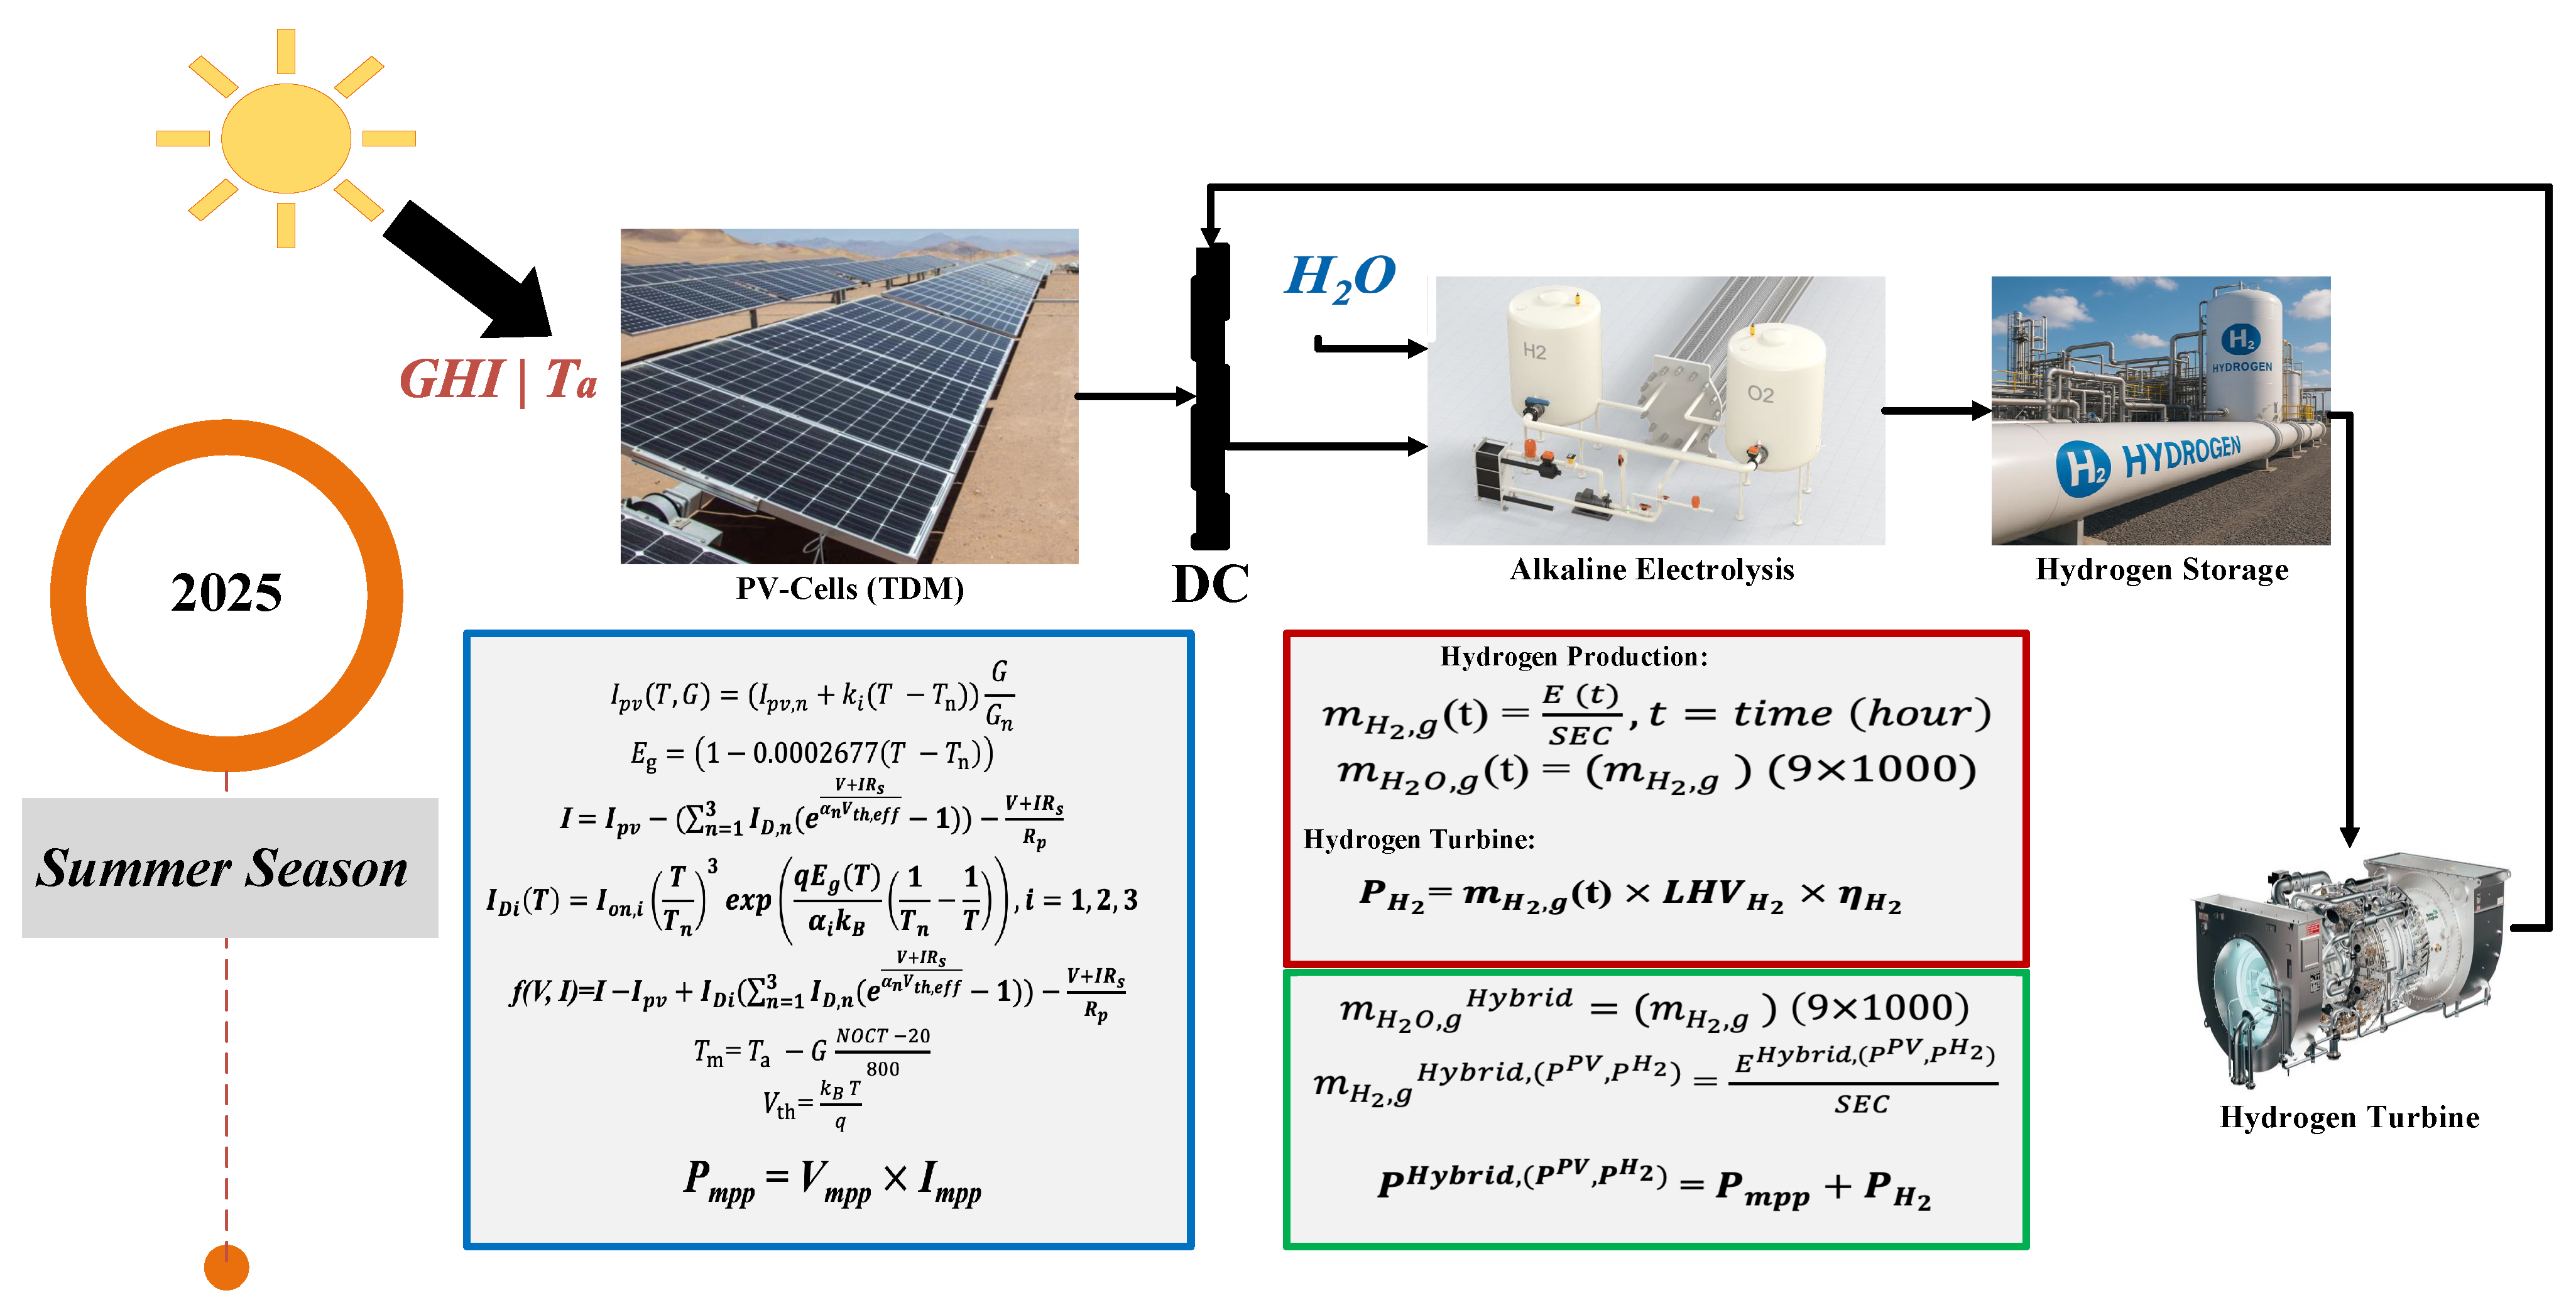
This research is divided into two main sections. The first section is allocated to examining the mathematical techniques for modeling solar energy output and correlating it with H2 production equations based on specific consumption and Faraday’s law. This section addresses the use of hydrogen as a feedstock in turbines for power generation and its repurposing as a hybrid energy source with solar energy to enhance H2P. The second section delineates the modeling study findings and conclusions on renewable energy modeling using triple-diode modeling, the hourly and daily H2 consumption during the summer months (May–September) for 2025, and the use of PV-generated H2 as a feedstock in turbines for H2 power generation. This discussion ultimately addresses the provision of hybrid energy ( P PV P H 2 ) to the electrolysis process to augment H2 generation as shown in Figure 1. Table 1 highlights previous research that combined PV modeling with electrolyzers to obtain H2 findings and used H2 to generate power via turbine.

2. Materials and Methods

This section elucidates the methodology that combines data-driven research, sophisticated PV modeling, and hydrogen energy conversion to provide a thorough assessment of green H2 production from solar energy sources. The research is conducted at the PV module level (610 W, 144 cells), and the suggested methodology is linearly scalable to bigger PV strings or plants. During the first phase, high-resolution hourly datasets of global horizontal irradiance (GHI) and ambient temperature were acquired for the Shuaiba solar power project in Jeddah, Western Region, Saudi Arabia. This extensive PV solar power facility employs highly efficient bifacial modules and uniaxial tracking systems, designed to produce 2660 MW of clean energy. The data were refined to guarantee uniformity and representativeness of regional climatic conditions. The atmospheric inputs were utilized in a three-phase PV model that precisely characterizes the nonlinear current–voltage (I–V) and power–voltage (P–V) characteristics of the PV module under fluctuating irradiance and temperature conditions, facilitating an accurate estimation of the maximum power point ( P m p p ) throughout the summer season.
In the subsequent phase, the solar energy output was transformed into hydrogen using an electrolysis model that included specific energy consumption (SEC) or Faraday law while considering actual conversion efficiencies and system losses. The generated hydrogen was utilized in a H2T model to assess its power-generating capacity, using hydrogen’s low calorific value and the turbine’s efficiency to ascertain the recoverable electrical energy. Algorithm 1 presents pseudo, which is an overview of the distinct phases, which are elaborated upon in the next subsections. This cohesive, systematic paradigm connects the unpredictability of solar energy resources, photovoltaic energy conversion, hydrogen generation, and energy recovery, offering a thorough foundation for assessing energy-technological performance.
Algorithm 1 Pseudocode for TDM → H2 → turbine → hybrid power
  • Input:  G H I ( t ) and T a ( t )
  • Parameters:
  •     PV Power (TDM): I p v , I D 1 , I D 2 , I D 3 , R s , R p , n 0 , α 1 , α 2 , α 3 , β V O C , N s , E g , NOCT
  •     Electrolyzer (Alkaline): E 0 , K, N E L , A c e l l , η E L , M H 2 , SEC value or Faraday constant (F)
  •     H2T: η turbine , L H V H 2
  • for Time step (t) do
  •       Step 1: Triple-Diode PV model (TDM)
  •       Compute Equations (1)–(7)
  •       Solve Equations (8)–(12)
  •       Generate I–V and P–V curves
  •       Extract V mpp , I mpp , P mpp , and FF
  •       Obtain PV power output P P V ( t )
  •       Step 2: Hydrogen production model (electrolyzer)
  •       Input P P V ( t )
  •       if SEC-based method is selected then
  •             Compute H2P using Equation (13)
  •       else
  •             Compute H2P using Equations (14)–(17)
  •       end if
  •       Compute H2 mass flow rate m ˙ H 2 ( t )
  •       Compute water consumption m H 2 O ( t ) using Equation (18)
  •       Step 3: H2T turbine (H2T) model
  •     Input m ˙ H 2 ( t )
  •       Compute using Equation (19)
  •       Obtain P H 2 ( t )
  •       Step 4: Hybrid P P V + P H 2 integration
  •        P hybrid ( t ) = P P V ( t ) + P H 2 ( t )
  •       Compute hybrid H2P by using Equations (20)–(22)
  • end for
  • Output: P–V and I–V curves; H2P; water consumption; H2T; hybrid H2P.

2.1. Data Description

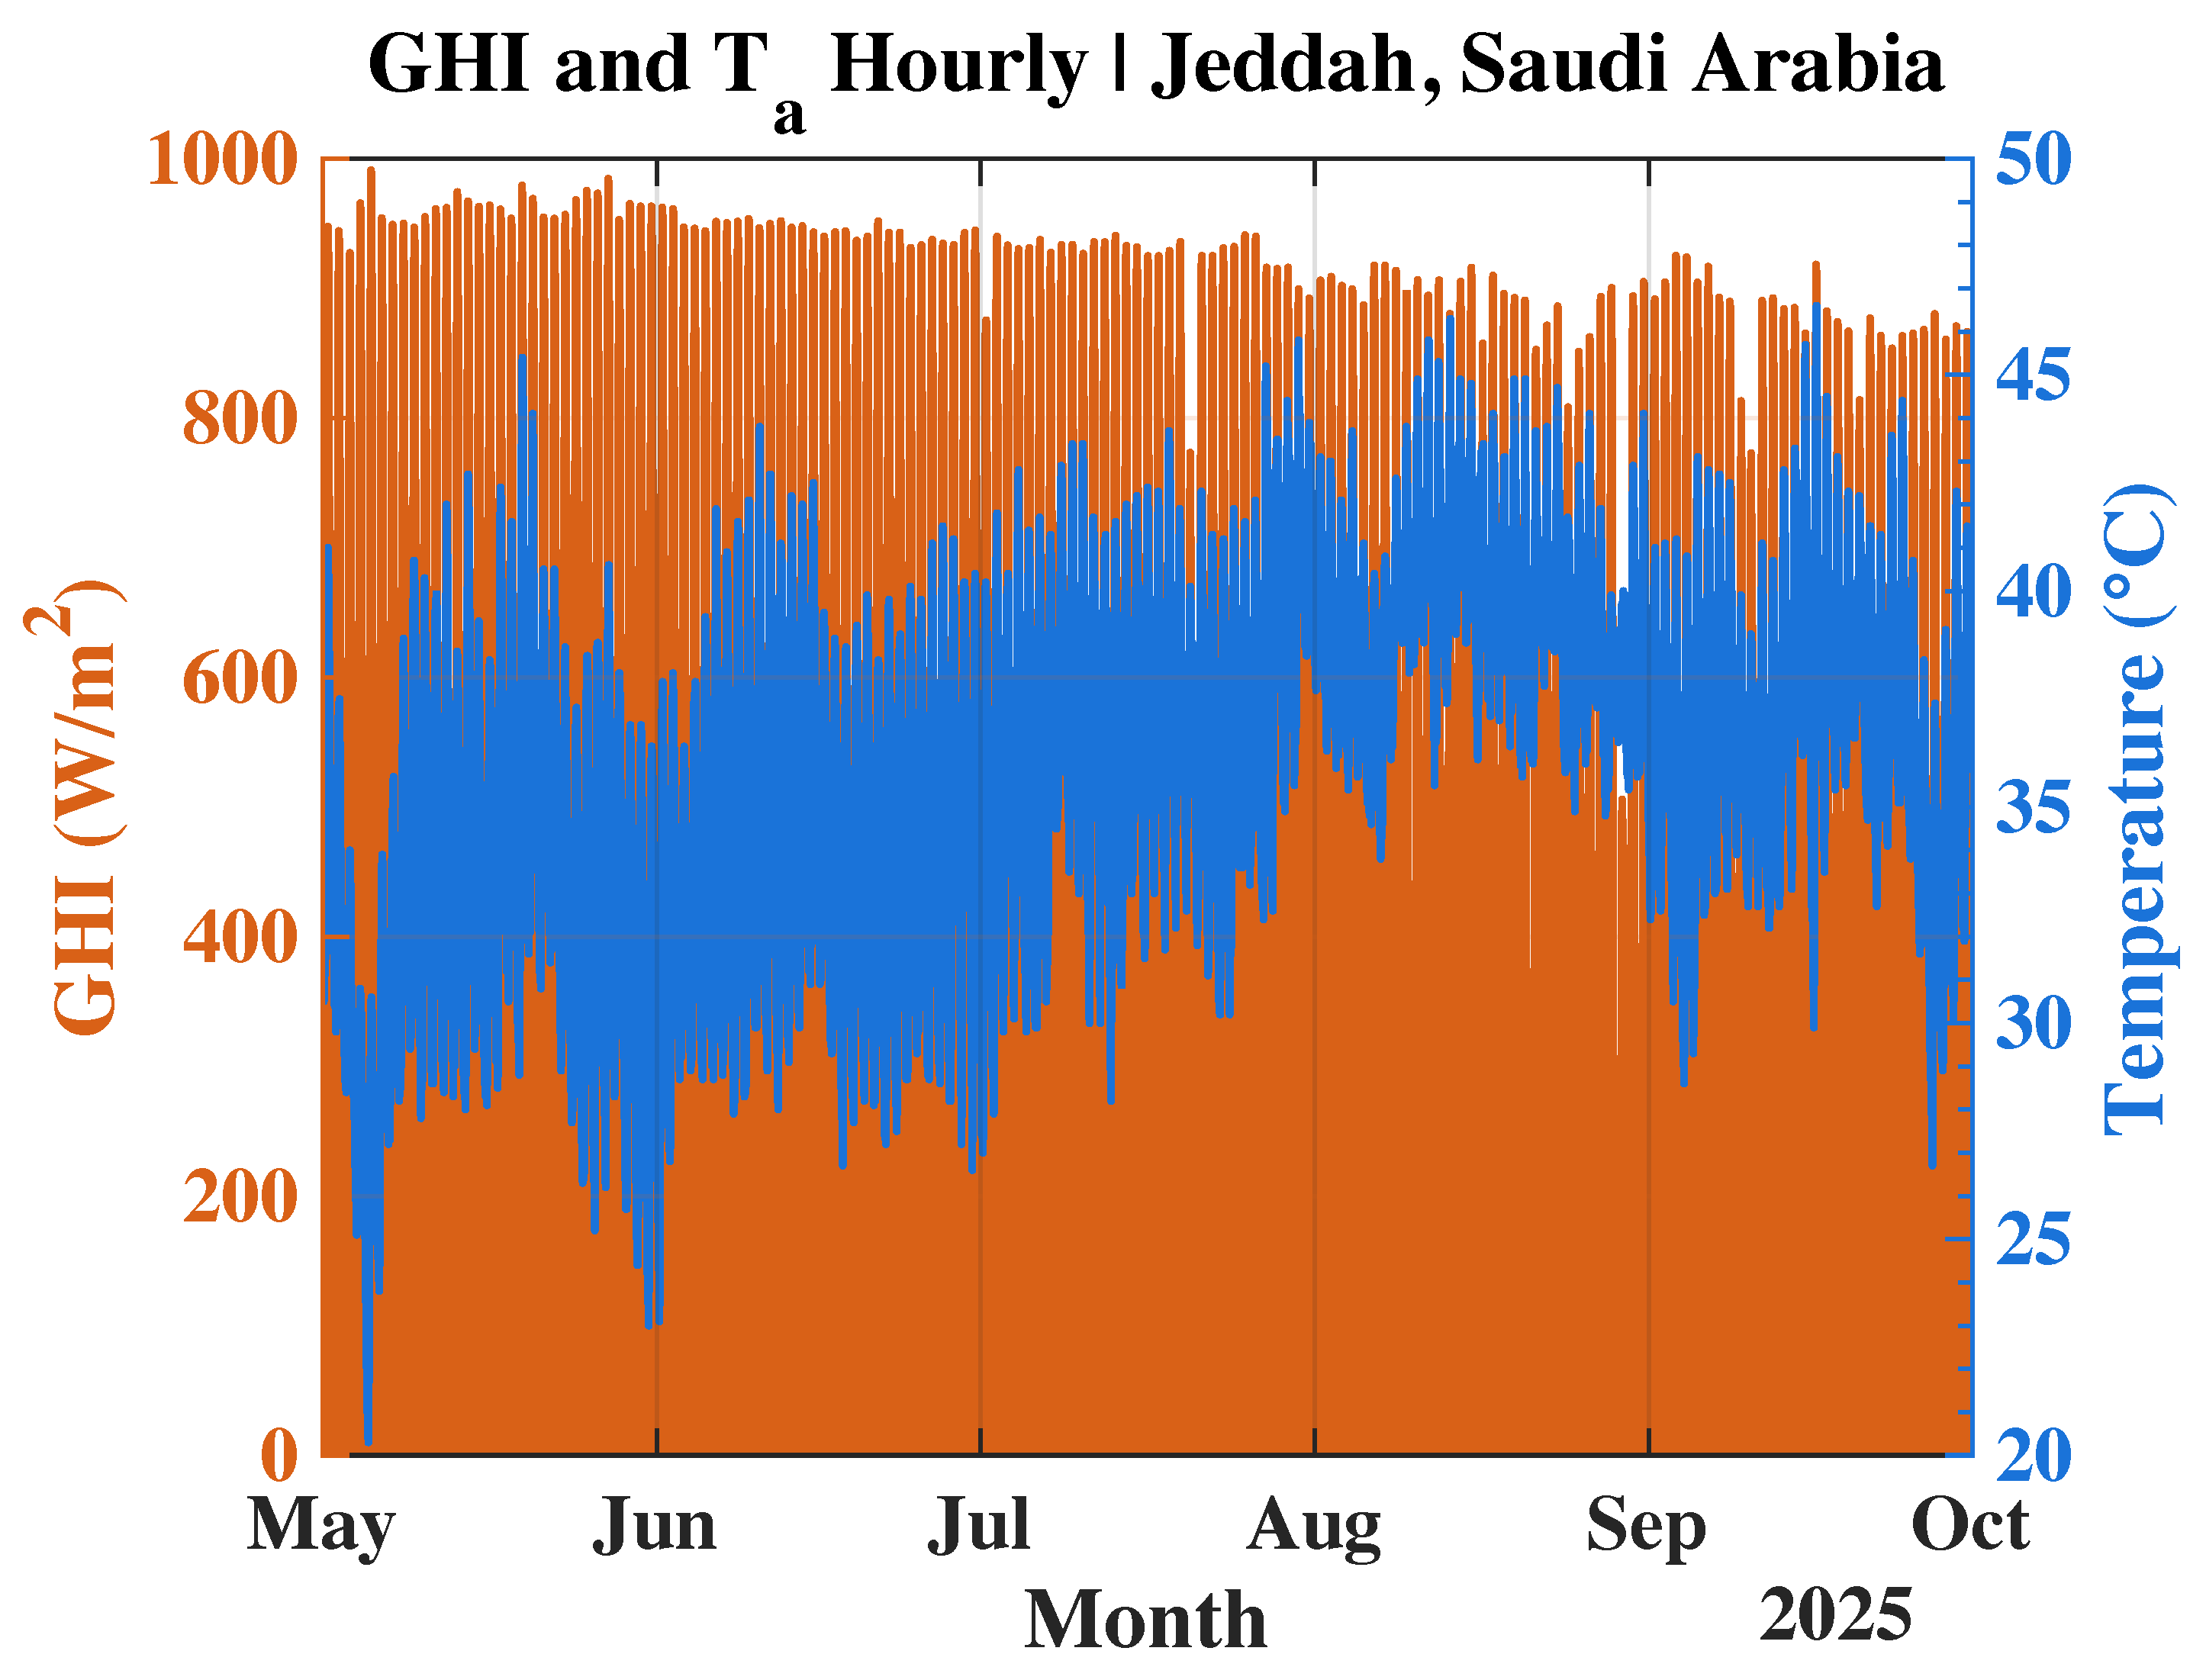
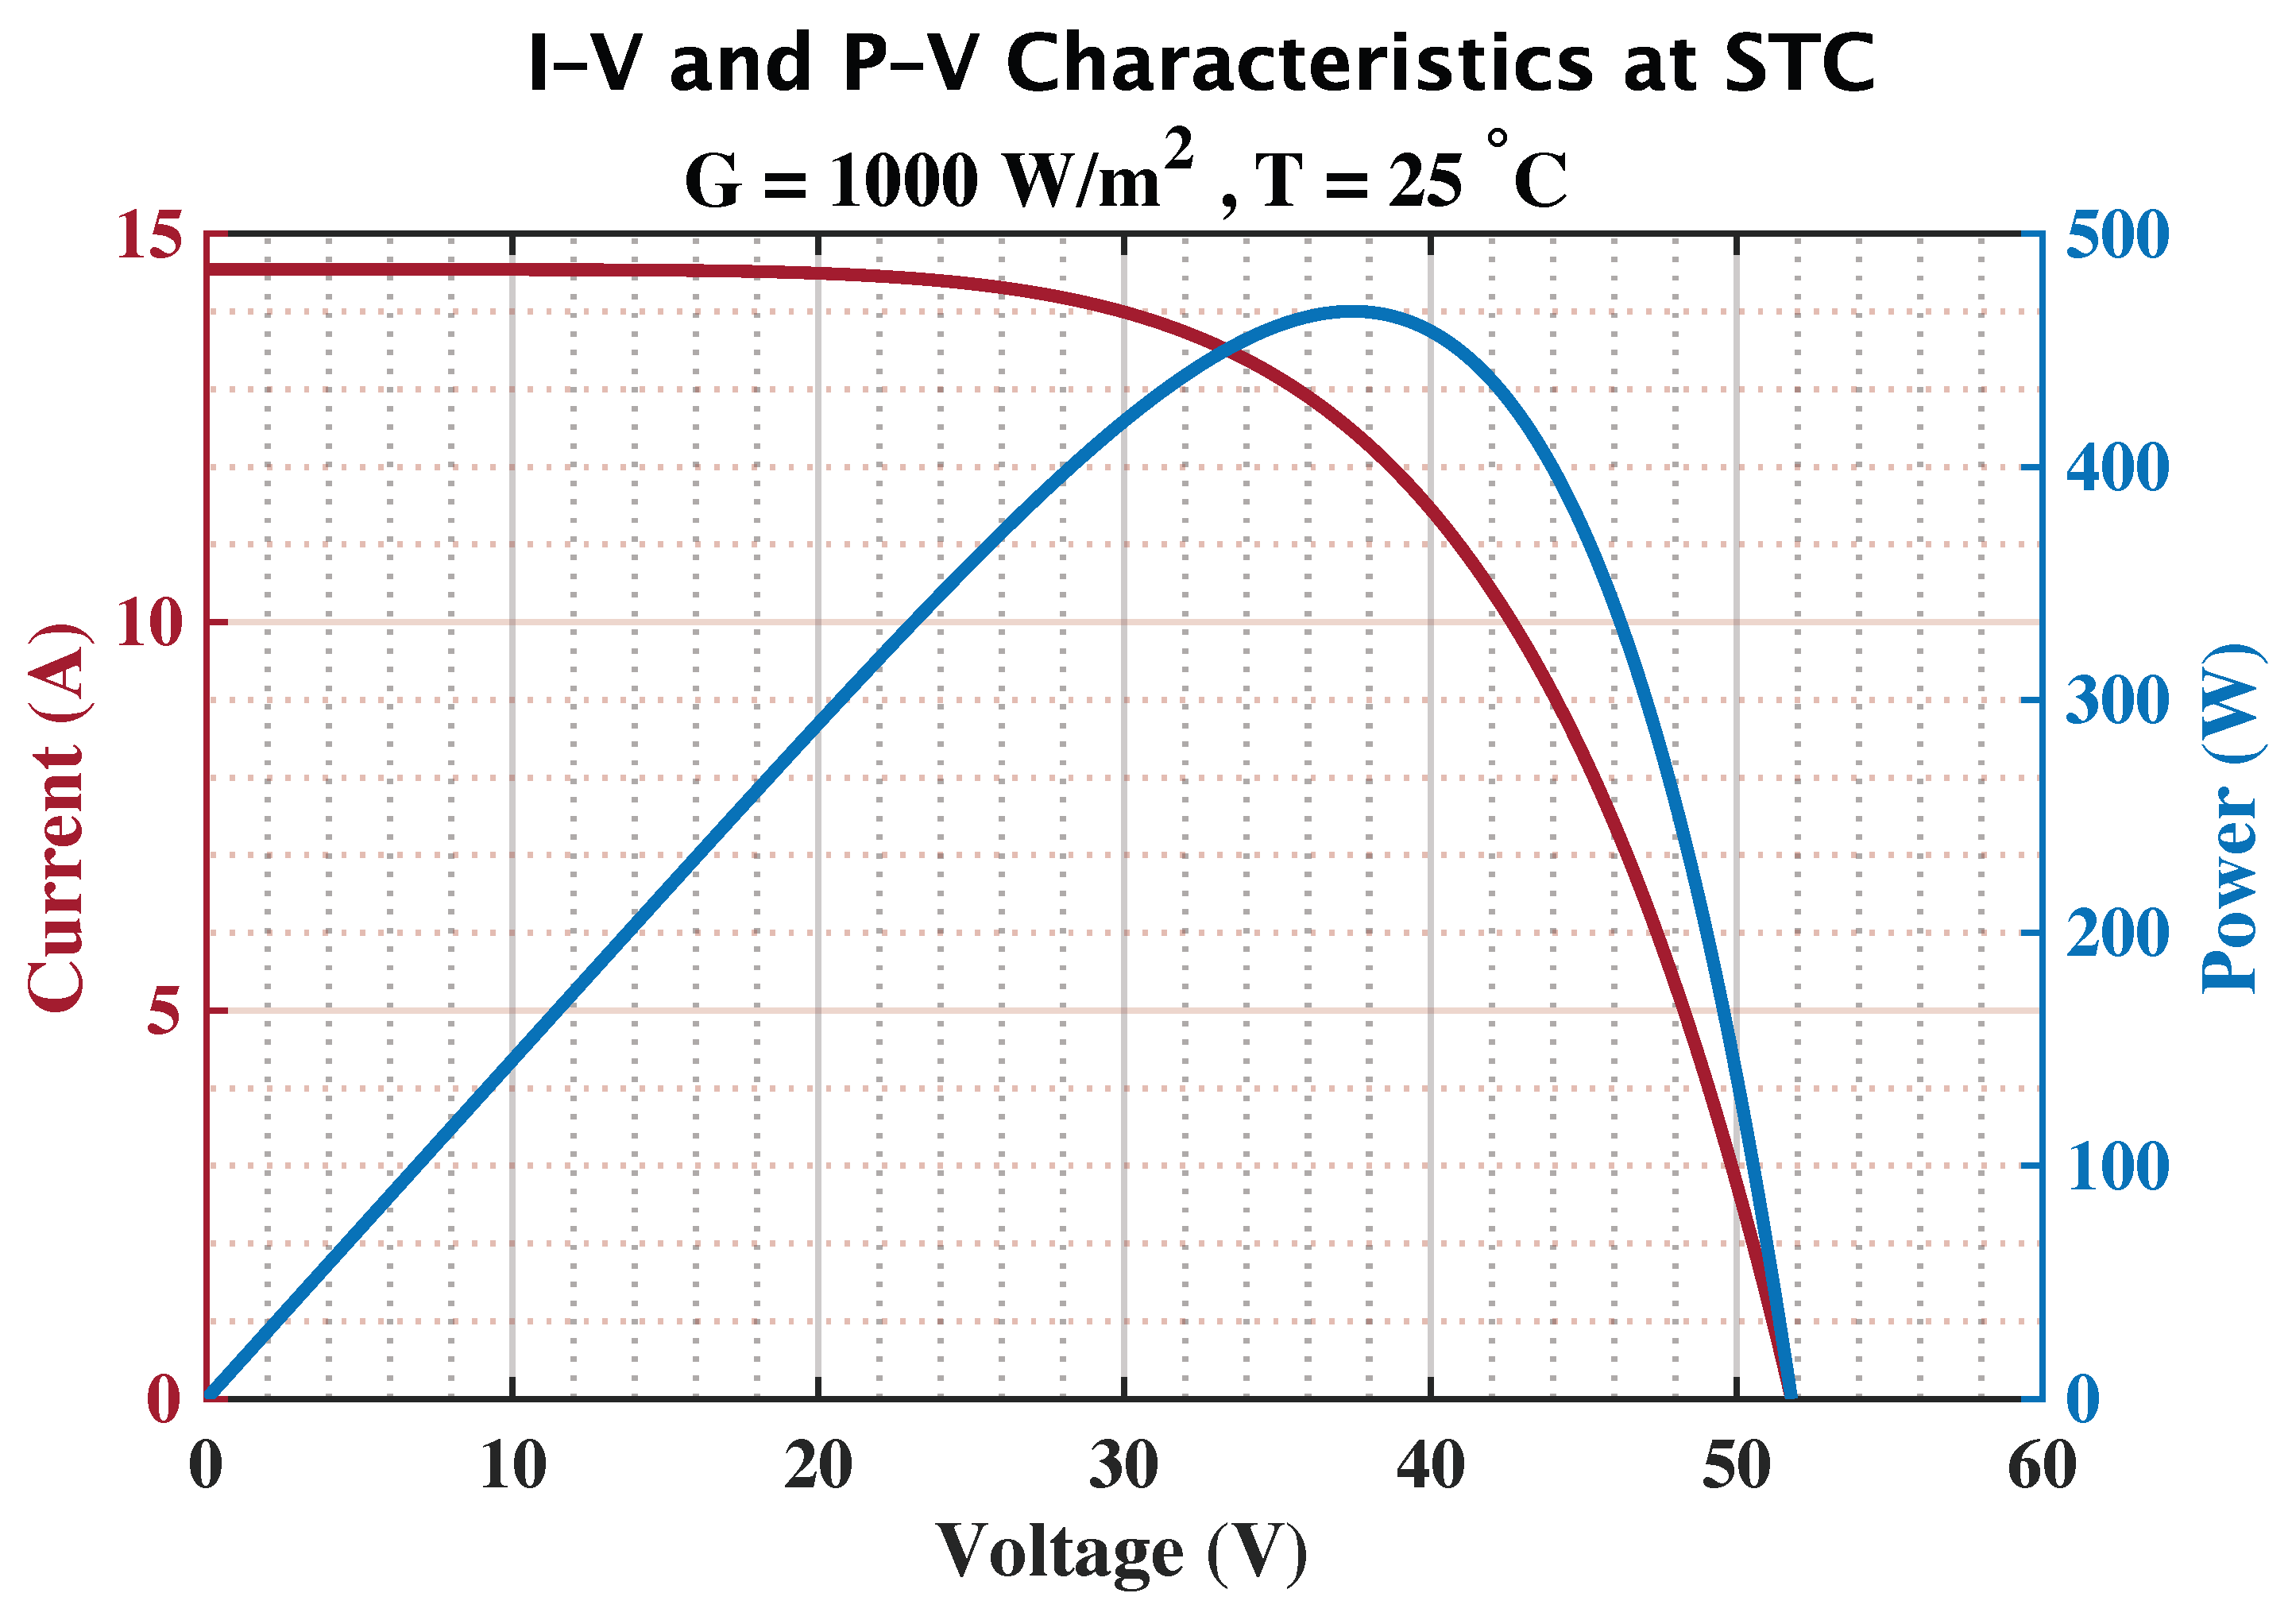
The dataset had two elements: global horizontal irradiation (GHI) and ambient temperature (Ta). The data was sourced from the National Center for Meteorology database and the Open-Meteo partners (Free Weather API). The measurement station in western Saudi Arabia, Shuaibah, is situated at about 20.68° North latitude and 39.52° East longitude, as seen in Figure 2. Table 2 demonstrates datasheet under standard test conditions (STC), the CS6.1-72TB-610 module [18] produces 610 W at 44.4 V and 13.74 A; moreover, contingent upon rear-side irradiation, its effective power may rise to around 732 W, indicating a bifacial gain of almost 20%. Figure 3 Evaluation of the triple-diode model under standard test conditions by comparing the modeled and manufacturer datasheet current–voltage characteristics ( G = 1000 W / m 2 , T cell = 25   ° C ) [18]. The datasheet’s critical operational parameters ( I sc , V oc , and MPP: V mp I mp ) are emphasized to measure point-specific variations. Table 3 depicts an advanced and efficient alkaline water electrolysis system intended for large-scale hydrogen production. The modular design facilitates many applications, ranging from small units generating 50 Nm3/h to large industrial operations producing over 19,000 Nm3/h, approximately equal to 42 tons of H2 daily [19].

2.2. Triple-Diode Model (TDM)

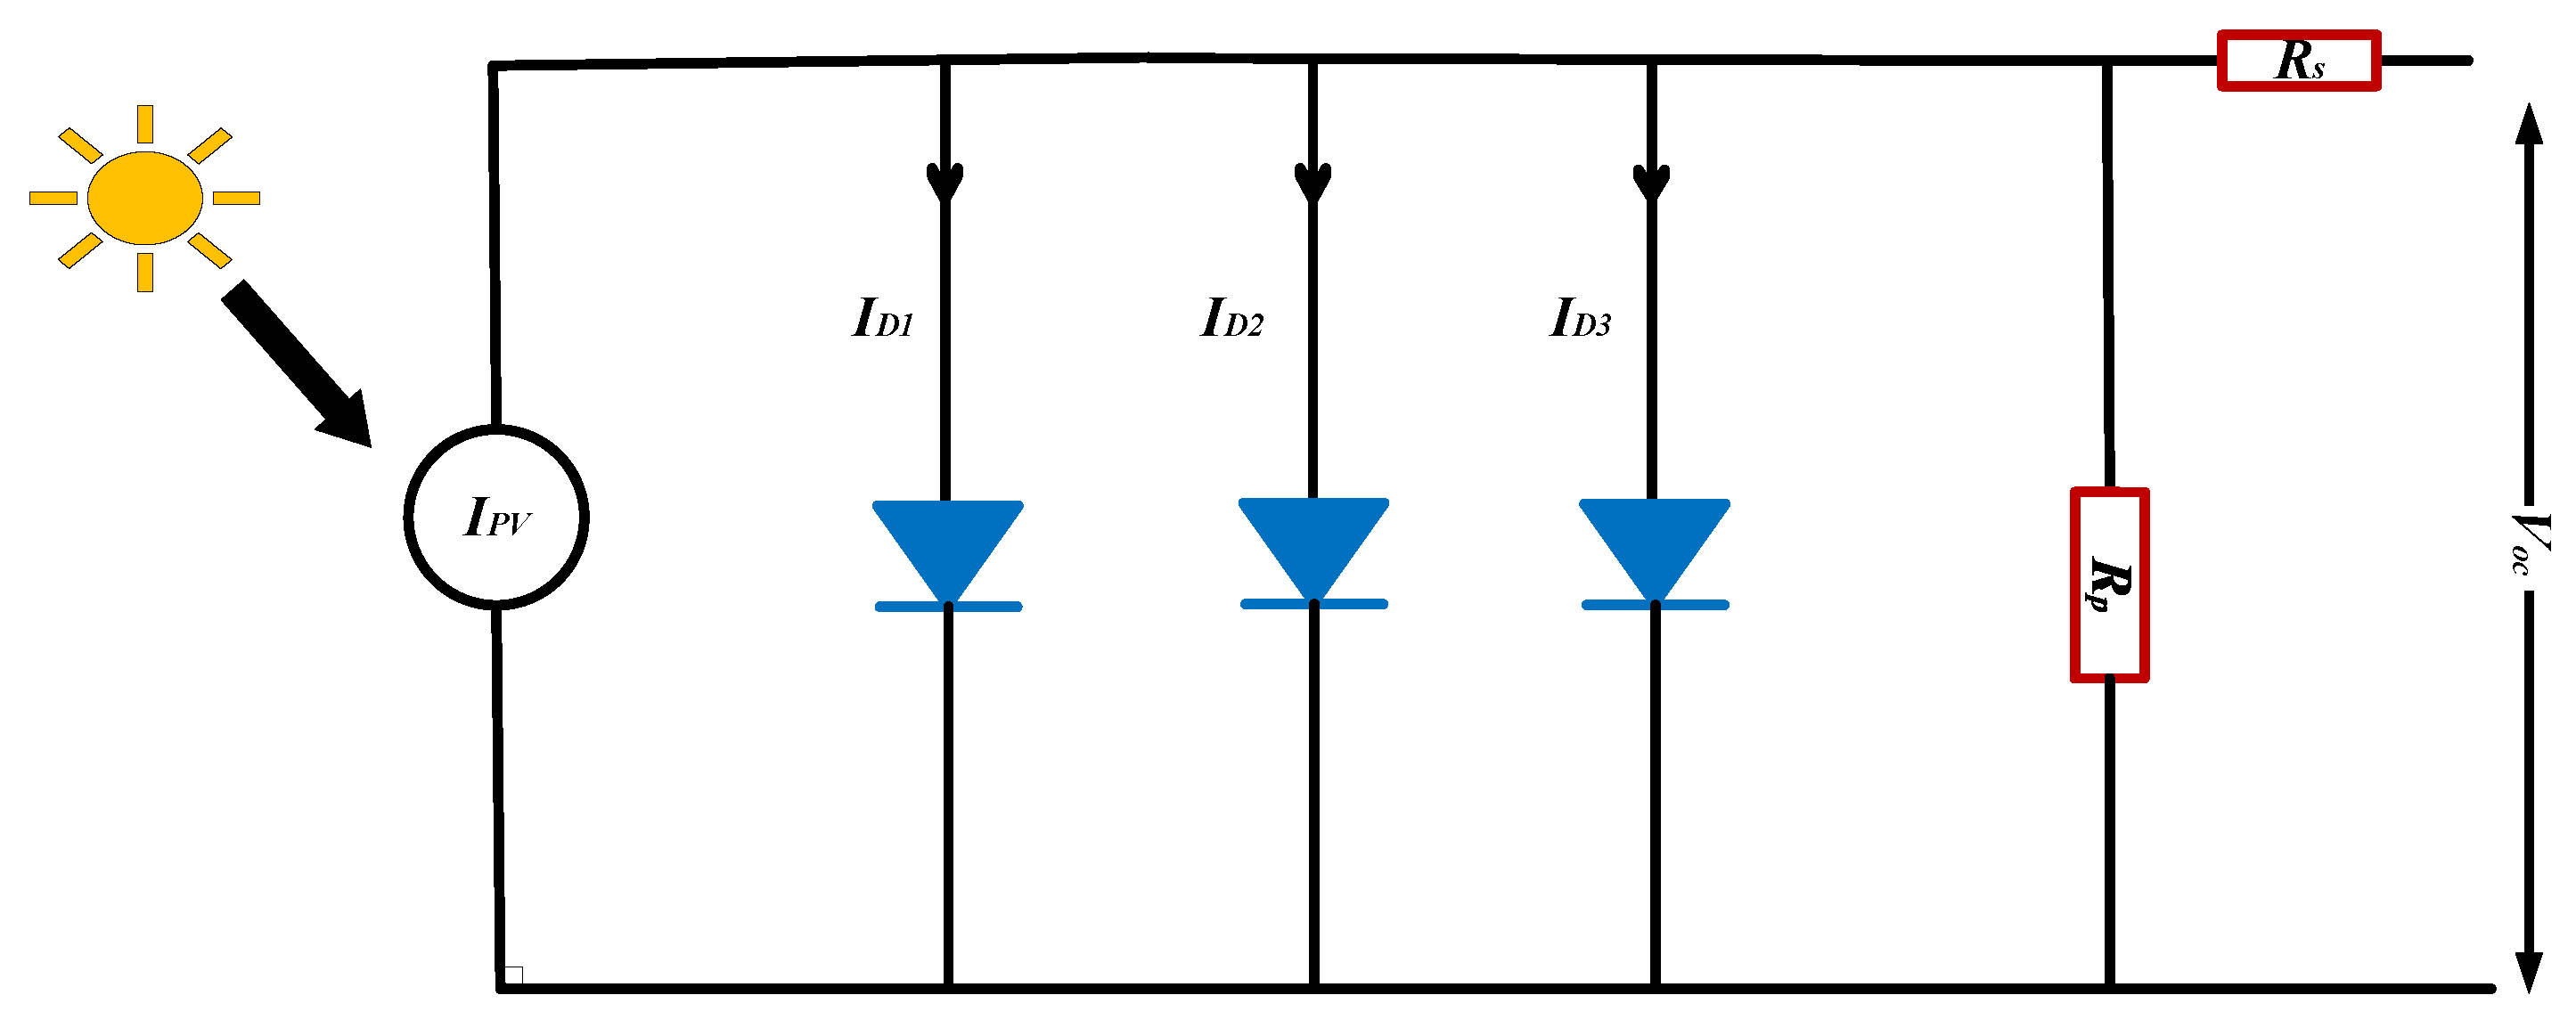
The triple-diode model (TDM) demonstrated superior performance compared to the standard single diode model (SDM) and double diode models (DDM) by accurately simulating the intricate non-linearity of photovoltaic cells. Furthermore, the TDM is considered an effective model for predicting the physical performance of diverse PV modules, accounting for the effects of grain boundaries and elevated leakage current in the materials of PV solar modules. This method use a three-diode model to represent the photovoltaic cell. Figure 4 illustrates the three-diode model and the currents in the three diodes are I D 1 , I D 2 , and I D 3 . I D 1 denotes the current associated with diffusion and recombination in the emitter and bulk areas of the p–n junction. I D 2 represents the recombination current inside the depletion area. I D 3 denotes the influence of grain boundaries and recombination current inside the depletion area. The series resistance ( R s ) denotes the resistance of the semiconductor material to the current and in the neutral regions of the solar cell. The parallel resistance ( R p ) signifies the leakage current at the solar cell’s surface. The current of a TDM is mathematically expressed as follows [20,21,22,23]:
T m [ C ] = T a + G NOCT 20 800
V t h = k B T q , V t h , eff i = α i V t h
R s = R s 0 ( constant )
R p = R p , n G n max ( G , 10 6 ) R p , n G n G
I p v ( T , G ) = I p v , n + k i ( T m T n ) G G n
E g = E g , n 1 0.0002677 ( T m T n ) [ eV ]
I D i ( T ) = I o n , i T m T n 3 exp q E g α i k B 1 T n 1 T m , i = 1 , 2 , 3
I = I p v I D 1 ( e V + I R s α 1 V t h , eff 1 ) I D 2 e V + I R s α 2 V t h , eff 1 I D 3 e V + I R s α 3 V t h , eff 1 V + I R s R p
V o c ( guess ) = V o c 0 1 2.6 × 10 3 ( T m T n ) + ( N s α 1 ) V t h ln max ( G , 10 6 ) G n
f ( V , I ) = I I p v + I D 1 e V + I R s V t h , eff 1 1 + I D 2 e V + I R s V t h , eff 2 1 + I D 3 e V + I R s V t h , eff 3 1 + V + I R s R p
P m p p = max k ( V k I k ) , ( V m p p , I m p p ) correspond to P m p p
F F = P m p p V o c I s c , V o c I s c > 0 0 , otherwise
where I p v ( T , G ) represents photocurrent as a function of temperature and irradiance, I D i ( T ) denotes reverse saturation current for each diode, E g indicates bandgap energy as a function of temperature, R p ( G ) refers to shunt resistance as a function of irradiance, V t h is thermal voltage per cell, T m is module temperature (NOCT model), V t h , eff i standa for effective thermal voltage, V o c ( guess ) is initial guess for open-circuit voltage, P m p p represents power and maximum power point (mpp), and FF is Fill Factor. f ( V , I ) is the Newton–Raphson method is used to solve the (I–V) implicit function. The TDM parameters were obtained from a synthesis of manufacturer datasheet values [18] and literature-reported diode and recombination coefficients. The nonlinear I–V equations were resolved using the Newton–Raphson technique, with a convergence tolerance of 10 6 . Although the TDM demands more computing resources than SDM and DDM owing to its elevated parameter count, the additional runtime is minimal for hourly and seasonal simulations and is justified by the enhanced loss representation.
The nine parameters of the TDM were determined by a hybrid process that integrates datasheet-based initialization, analytical semiconductor relationships, and numerical refinement. The initial values of photocurrent, open-circuit voltage, and short-circuit current were derived from the manufacturer’s datasheet under normal test settings. The diode saturation currents and ideality factors were initialized using relevant ranges from the literature and then refined through a Newton–Raphson iterative method to ensure convergence and precise reconstruction of the I–V characteristics under different irradiance and temperature conditions [18].
Prior comparative analyses indicate that the TDM markedly diminishes fitting errors in I–V and P–V characteristics compared to the single-diode model (SDM) and double-diode model (DDM), with reported reductions in root mean square error (RMSE) ranging from 30–50% relative to SDM and 15–25% relative to DDM, especially under low-irradiance and high-temperature conditions. The improved precision validates the use of TDM as a dependable electrical basis for downstream H2P modeling [11,13,21].

2.3. Hydrogen Production (H2P) and Hydrogen Turbine (H2T)

Most water electrolysis devices produce H2 and oxygen (O2) from water at reduced working temperatures. The primary methods of water electrolysis for H2 production are alkaline electrolysis (AEL), proton exchange membrane electrolysis (PEM), solid oxide electrolysis (SOE), and polymer anion exchange membrane (AEM) electrolysis. The current study will address devices for alkaline (AEL) electrolysis to generate H2, using nickel and cobalt oxides for the anode and cathode, respectively. Potassium hydroxide (KOH) at 30–40% serves as the electrolyte, enabling reactions at the electrodes that produce H2 and O2. A permeable diaphragm divides the electrodes, facilitating the passage of hydroxyl ions (OH). The electrolyzers function at temperatures ranging from 65 to 100 °C, with a conversion efficiency of 60 to 80% with a cell voltage between 1.8 and 2.4 V. They operate well at low temperatures without the need for catalysts; nevertheless, the corrosion of electrodes in the alkaline solution presents a considerable barrier. The Specific Energy Consumption (SEC) methodology was used to quantify H2 generation Equation (13), which shows how much H2 is made for every unit of electrical energy used. The alkaline electrolyzer is assumed to operate at a fixed nominal efficiency ( η EL ) and a constant specific energy consumption (SEC), as commonly adopted in system-level techno-energetic studies. While the input electrical power varies dynamically with PV production, efficiency variations due to load-dependent polarization losses are neglected to preserve model transparency and to focus on PV modeling accuracy. Electrolysis typically requires around 9 kg of deionized water as fuel for the generation of each kilogram of H2, and the mathematical calculation of H2 power using the H2T is as follows:
m H 2 , g = E W h SEC W h / g
V cell ( J ) = J + 2 K ( J R + E 0 ) + J 2 + 4 K E 0 J 2 K
U stack = V cell ( J ) · N E L
I stack = J · A cell
m ˙ H 2 = η E L · M H 2 · I stack 2 F · 3600
m H 2 O , g = m H 2 , g × 9.0 × 1000
P H 2 [ W ] = m H 2 , g ( t ) × L H V H 2 × η turbine
where hydrogen mass flow rate is m H 2 , g ( t ) in g/h, the lower heating value of hydrogen ( L H V H 2 ) is 120 MJ/kg ≈ 33.33 Wh/g, and the turbine efficiency ( η turbine ) is 55%. Table 4 illustrates the main operational aspects of Alkaline electrolysis [24,25]. E 0 denotes the reversible cell potential, R is the area-specific resistance, K stand for an empirical constant describing electrode kinetics, N E L stand for the number of cells connected in series, A c e l l is the active cell area, η E L is the electrolyzer efficiency, and M H 2 is the molar mass of H2. the second method is to calculate H2 production from the applied current is used by Faraday’s law Equation (17). The formulation incorporates Faraday’s constant (F = 96,485 C/mol) and the molar mass of H2 ( M H 2 = 2.016 g/mol) to express output in molar or mass flow rates. Under standard conditions, the molar flow is converted to volumetric units using the ideal gas molar volume of 22.414 L/mol. This approach provides a fundamental first-order estimate but neglects the complex polarization and loss mechanisms shown in advanced cell models [26,27]. The value of 9 kg H 2 O / kg H 2 denotes the stoichiometric minimum water requirement for the electrolysis reaction. This value excludes supplementary plant-level water usage, including purification losses, blowdown, cooling, or auxiliary system requirements, which are significantly influenced by electrolyzer design and site-specific operational conditions.
H2 turbines are favored over proton exchange membrane fuel cells (PEMFCs) due to their compatibility with large-scale, dispatchable power generation and established grid infrastructure. Although PEMFCs can achieve higher electrical efficiency at the stack level, their large-scale deployment is constrained by high capital costs, limited unit capacity, complex balance-of-plant requirements, and sensitivity to H2 purity. In contrast, H2 turbines—particularly those adapted from conventional natural-gas turbines—offer high power ratings, fast ramping capability, and straightforward integration into existing power systems, making them well suited for grid support and long-duration energy storage. Recent technological advancements further indicate that H2 turbines can operate under both co-firing and 100% H2 modes, providing a scalable and practical pathway for decarbonizing power generation. H2T models as a steady-state energy conversion unit, whereby the recoverable electrical power is calculated directly from the H2 mass flow rate, its lower heating value, and a constant turbine efficiency. This formulation provides an idealized upper-bound estimate of H2-to-power conversion, disregarding transient and operational restrictions. In practical gas-turbine operation, part-load conditions, start-up and shut-down events, auxiliary power consumption, and combustion-related constraints generally diminish the effective electrical efficiency by approximately 5–15% compared to nominal steady-state values, contingent upon the operating point and system configuration. Comparable efficiency penalties have been shown for H2-fueled and H2-co-fired gas turbines under actual dispatch scenarios in the literature. Thus, the electrical energy retrieved from H2 in practical systems would be inferior to the steady-state values shown here, and the current findings should be regarded as a theoretical performance standard rather than a comprehensive operational prediction bound by dispatch.
The hydrogen turbine (H2T) is utilized not as a substitute for fuel cells but as a complementary and systemically advantageous technology for large-scale, dispatchable power generation from green H2. Fuel cells have superior electrochemical efficiency at the component level; nevertheless, they are often limited to low- and medium-power applications, incur elevated capital costs per kilowatt, and are susceptible to H2 purity and load variations. Conversely, H2 turbines function at the megawatt level, provide rapid ramping and grid-support functionalities, and interface effortlessly with current gas-turbine and combined-cycle systems. In the proposed PV–electrolysis framework, the H2T facilitates efficient temporal shifting of excess photovoltaic energy by converting stored H2 into dispatchable electricity during periods of low irradiance, thereby improving system reliability and strengthening the hybrid power feedback mechanism that boosts overall H2P. Thus, the H2T is exceptionally appropriate for the extensive, grid-centric hybrid PV–H2 framework examined in this study.

2.4. Proposed Model (Hybrid Power)

The suggested hybrid topology combines PV production with H2-based energy utilization to improve system flexibility and maintain steady power output under varying operating circumstances. Within this context, the total hybrid power is characterized as the aggregate of the PV maximum power point and the generated H2-based power, enabling the system to alleviate photovoltaic intermittency and provide an alternative energy supply. The associated hybrid electrical energy is used to calculate the hourly H2P using the Specific Energy Consumption (SEC) or Faraday’s law, which measures the electrical energy needed to produce H2. The produced H2 may be used in a H2T, with the turbine’s power output calculated by multiplying the hydrogen mass flow by the lower heating value and the turbine’s efficiency. These combined formulations provide a complete hybrid PV–H2 power model that quantifies hydrogen generation, water consumption, and energy used, facilitating a thorough evaluation of the integrated system’s performance. The below mathematical equations depict the hydrogen cycle generated from the hybrid energy of solar power and the output of H2T.
P Hybrid , ( P V , P H 2 ) = P m p p + P H 2
m H 2 Hybrid = E Hybrid , ( P V , P H 2 ) SEC W h / g
m H 2 O Hybrid = m H 2 Hybrid × 9.0 × 1000
The hybrid PV–H2 turbine concept is neither an energy-recycling nor a self-sustaining system. The hydrogen turbine does not return the initial solar energy input; rather, it converts only a portion of the chemical energy contained in hydrogen into electrical power, which is limited by thermodynamic losses caused by electrolyzer efficiency, hydrogen’s lower heating value ( LHV = 33.33 kWh / kg ), and turbine conversion efficiency. The round-trip efficiency of the PV → H2 → power pathway is less than one, which aligns with the first and second laws of thermodynamics. The result indicates energy conservation and irreversible entropy creation. This study emphasizes time-resolved modeling of energy and hydrogen flow instead of aggregated thermodynamic efficiency metrics. Global metrics like round-trip or exergy efficiency are not disclosed, as the suggested framework embodies a hybrid energy-recovery system rather than a closed energy storage cycle.

3. Results and Discussion

3.1. PV Performance (TDM)

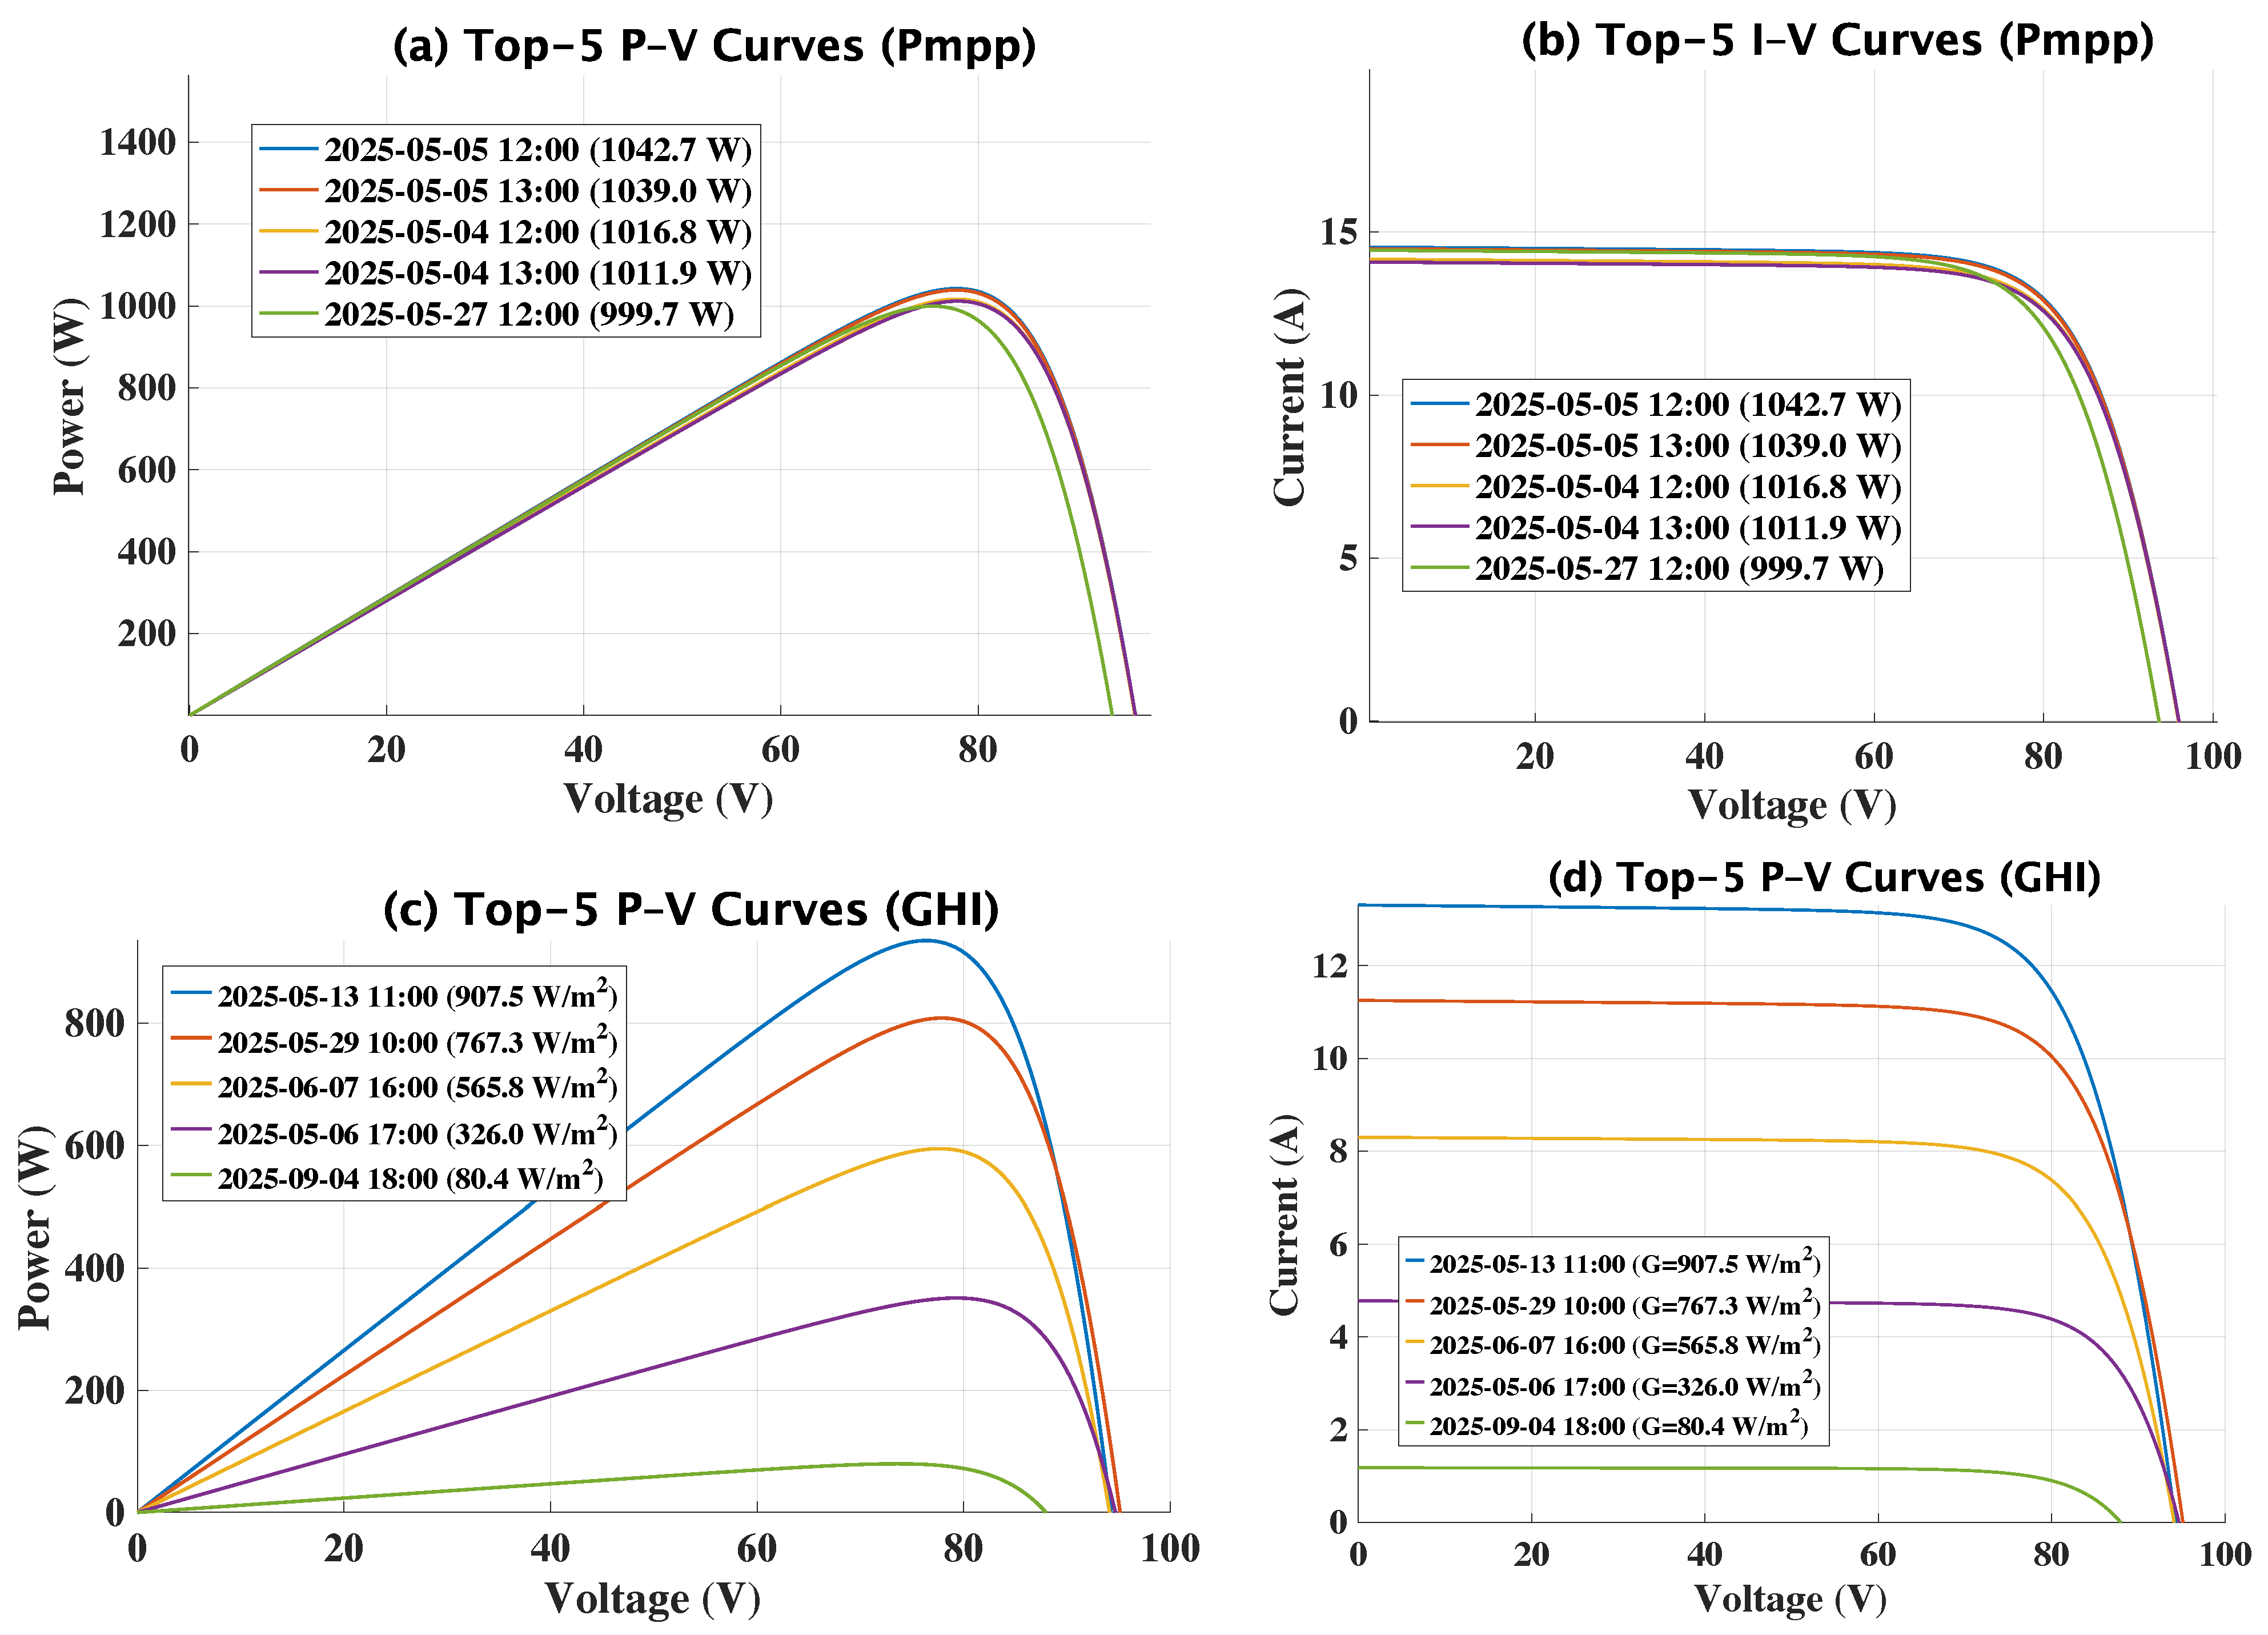
The modeling results are analyzed in relation to the PV parameters using the triple-diode model (TDM), which accounts for all losses and incorporates both series and shunt resistances. The modeling is conducted under standard test settings (STC), defined as a reference temperature of 25 °C, as the data sheet for all modules is to be derived under STC throughout the testing process at manufacturing facilities according to Table 2. Some of the details regarding the outputs of the PV-parameter (TDM), which is based on mathematical Equations (1)–(12). Table 5 and Table 6 jointly demonstrate the sensitivity of the TDM parameters to fluctuations in irradiance and temperature, affirming the physical resilience of the proposed PV model. In high-irradiance settings (Table 5), the PV module attains peak power levels over 1 kW, with fill factor values regularly ranging from 0.74 to 0.75, demonstrating robust electrical performance despite increased module temperatures. The incremental decline in open-circuit voltage ( V oc ) and fill factor (FF) at elevated temperatures illustrates the anticipated thermal degradation effects characteristic of semiconductor behavior. Conversely, Table 6 illustrates the significant dependence of short-circuit current ( I sc ), photocurrent ( I pv ), and maximum power output ( P mpp ) on GHI, wherein diminished irradiance levels lead to heightened shunt resistance ( R p ) and decreased diode saturation currents ( I o 1 , I o 2 , and I o 3 ), thereby emphasizing recombination and leakage loss mechanisms identified by the TDM. The uniformity of series resistance ( R s ) and the seamless variation of diode currents in both tables confirm the model’s capacity to accurately depict nonlinear PV behavior under various operating conditions, thereby affirming its appropriateness for precise analysis of solar-driven H2P.
The electrolyzer produces H2 using electrical energy, which is proportional to the energy input (Equation (13)). Uncertainty in the PV model affects H2P, particularly via the maximum power point ( P m p p ) and its integration. A framework derives P m p p from the TDM I-V solution (Equations (10) and (11)), with key uncertain parameters including R s , R p , and diode characteristics. The sensitivity of H2P is very similar to that of P m p p , and it is affected by weather conditions. The above equation causes secondary oscillations because of mistakes in TDM parameters. This aligns with observed patterns in hourly and daily data and the relationship between PV outputs and environmental conditions, as seen in Table 5, Table 6 and Table 7.
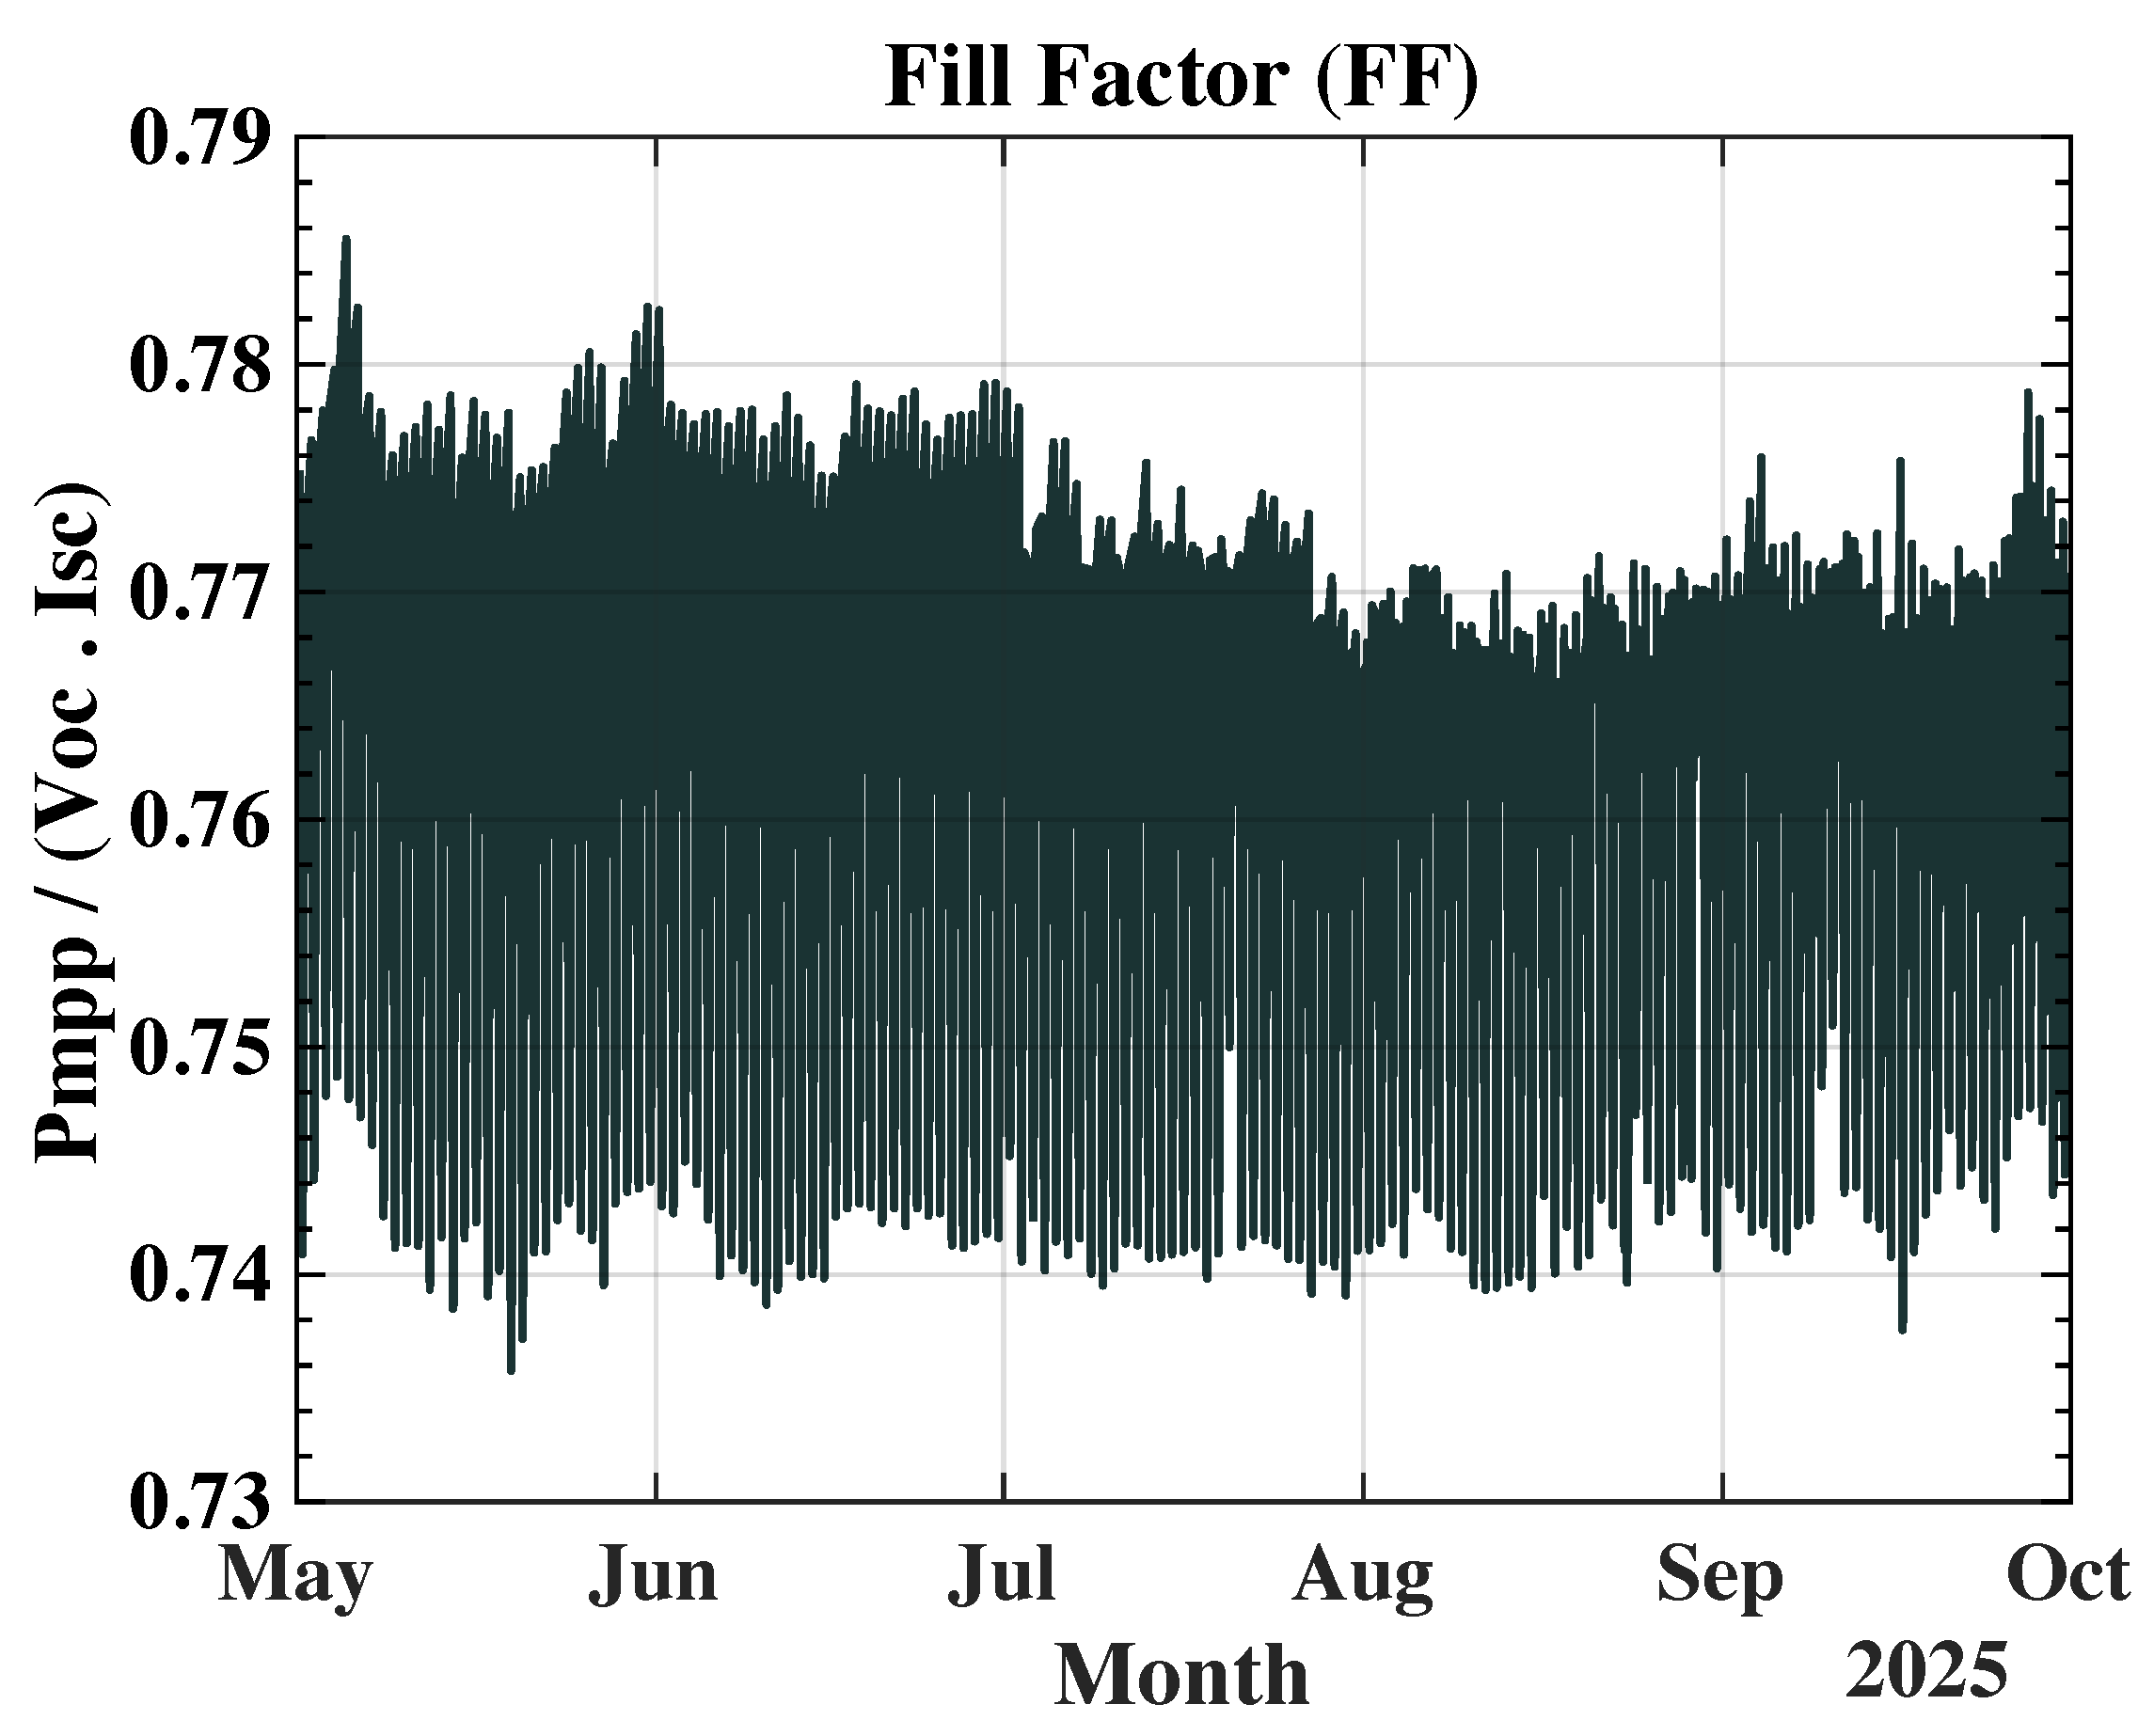
Figure 5 shows the P–V and I–V curves at the highest of P m p p values and at various global horizontal irradiances (GHI) during the summer period of 2025 in Saudi Arabia. Figure 6 illustrates the fill factor (FF) of a photovoltaic (PV) cell, a key performance metric used to evaluate the quality and efficiency of a solar cell. It represents how closely the cell’s power curve (I–V curve) approaches its ideal shape. Fill factor (FF) is calculated as the ratio between the maximum power the cell can produce, the maximum operating power ( P m p p ), and the mathematical maximum possible power, the product of the open-circuit voltage ( V o c ) and the short-circuit current ( I s c ). The Table 7 presents a summary of the monthly PV power output ( P m p p ) for the summer season in Saudi Arabia in 2025. The results show that the region’s strong solar irradiance consistently elevates solar production during the summer months. May exhibits the peak total energy output of 235,061.6 Wh, followed by a gradual decrease in June and July due to rising ambient temperatures, which marginally impacts PV efficiency. August and September exhibit additional decreases, with September recording the lowest summer output at 190,088 Wh. The total energy generated throughout the summer period amounts to 1,070,636 Wh over 154 operational days, indicating the significant solar resource availability in Saudi Arabia and the effective performance of the PV system during prolonged high-irradiance months.

3.2. Hydrogen Production → PV and H2T

The mathematical model examines how PV energy is converted into green H2 and how that H2 is used for power generation with a H2T. The research is in terms of the hourly, daily, and monthly H2 yields produced by the PV–electrolyzer system, together with the electrical output from the turbine using the stored H2. These data together highlight the effectiveness of integrating solar H2 generation with turbine energy recovery. Table 8 encapsulates the monthly H2P generated from the PV source during the summer season of 2025. The PV system provided 1.02 MWh of power to the electrolyzer, yielding 22.62 kg of hydrogen, which is equal to 251.62 Nm3, with a total water use of 203.5 L. Monthly patterns indicate that H2 generation peaks in May (4.96 kg) and progressively diminishes until September, correlating with decreased PV output resulting from increased ambient temperatures and reduced irradiance in late summer.
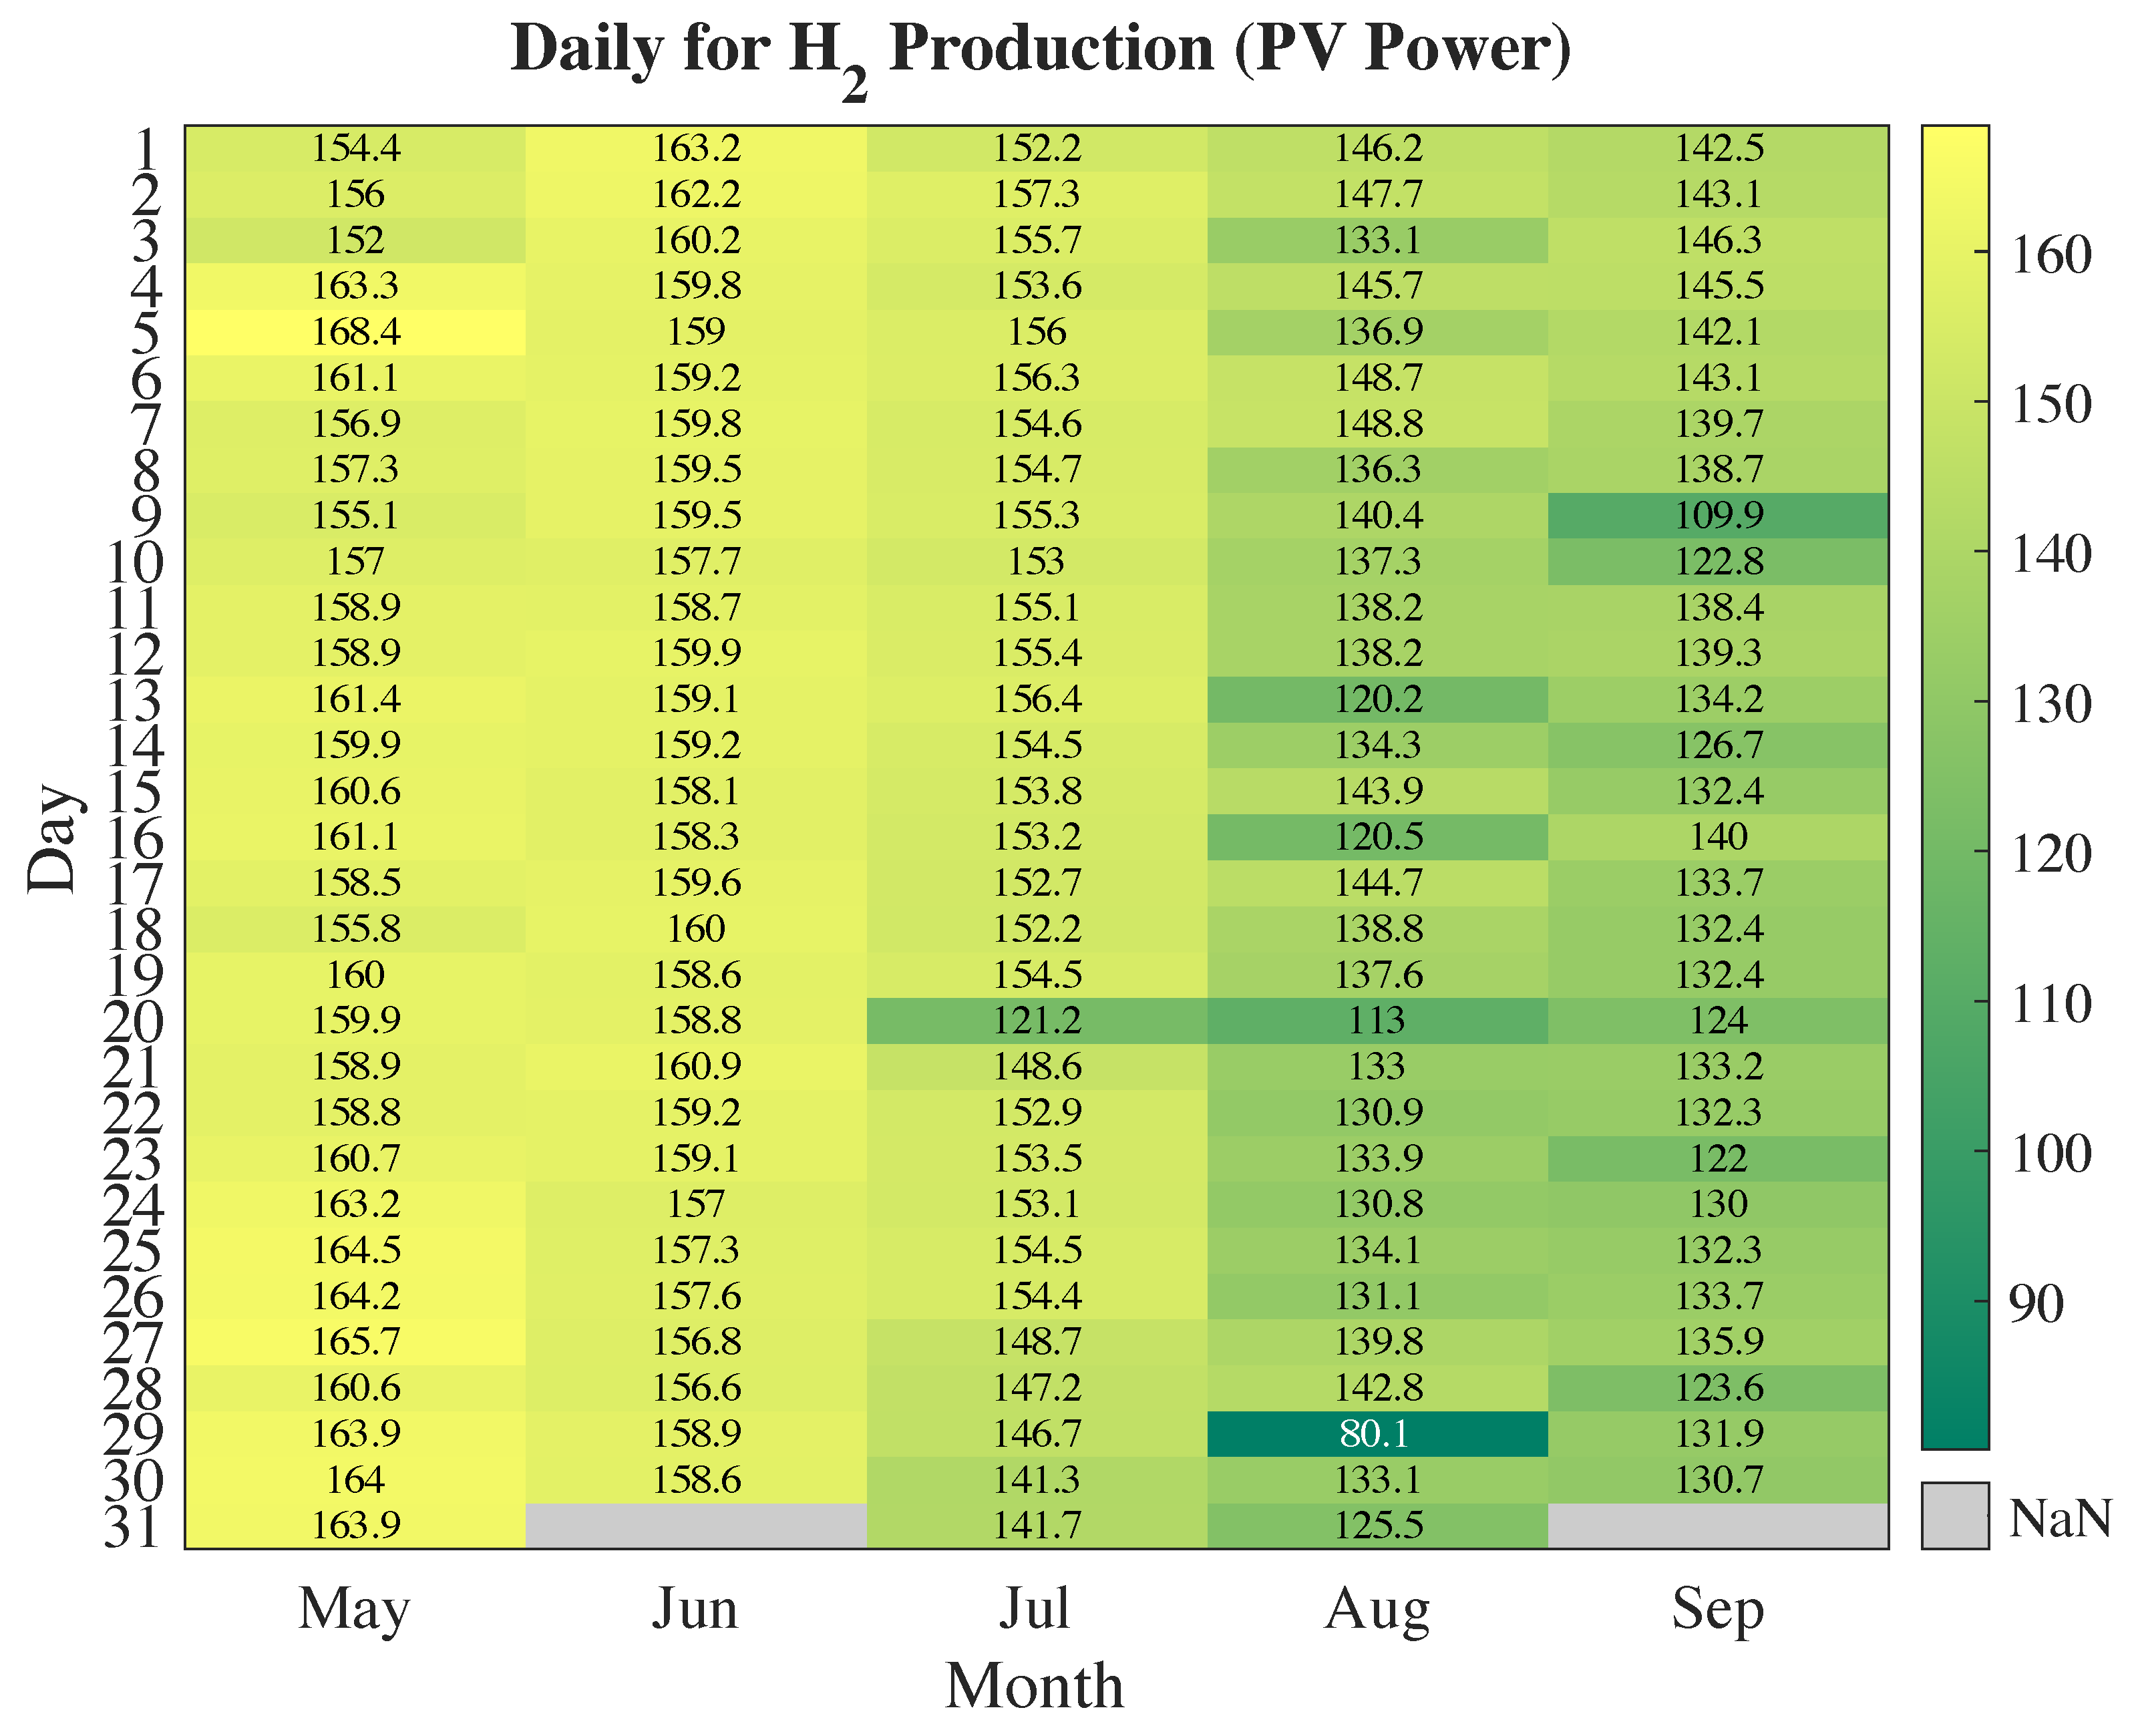
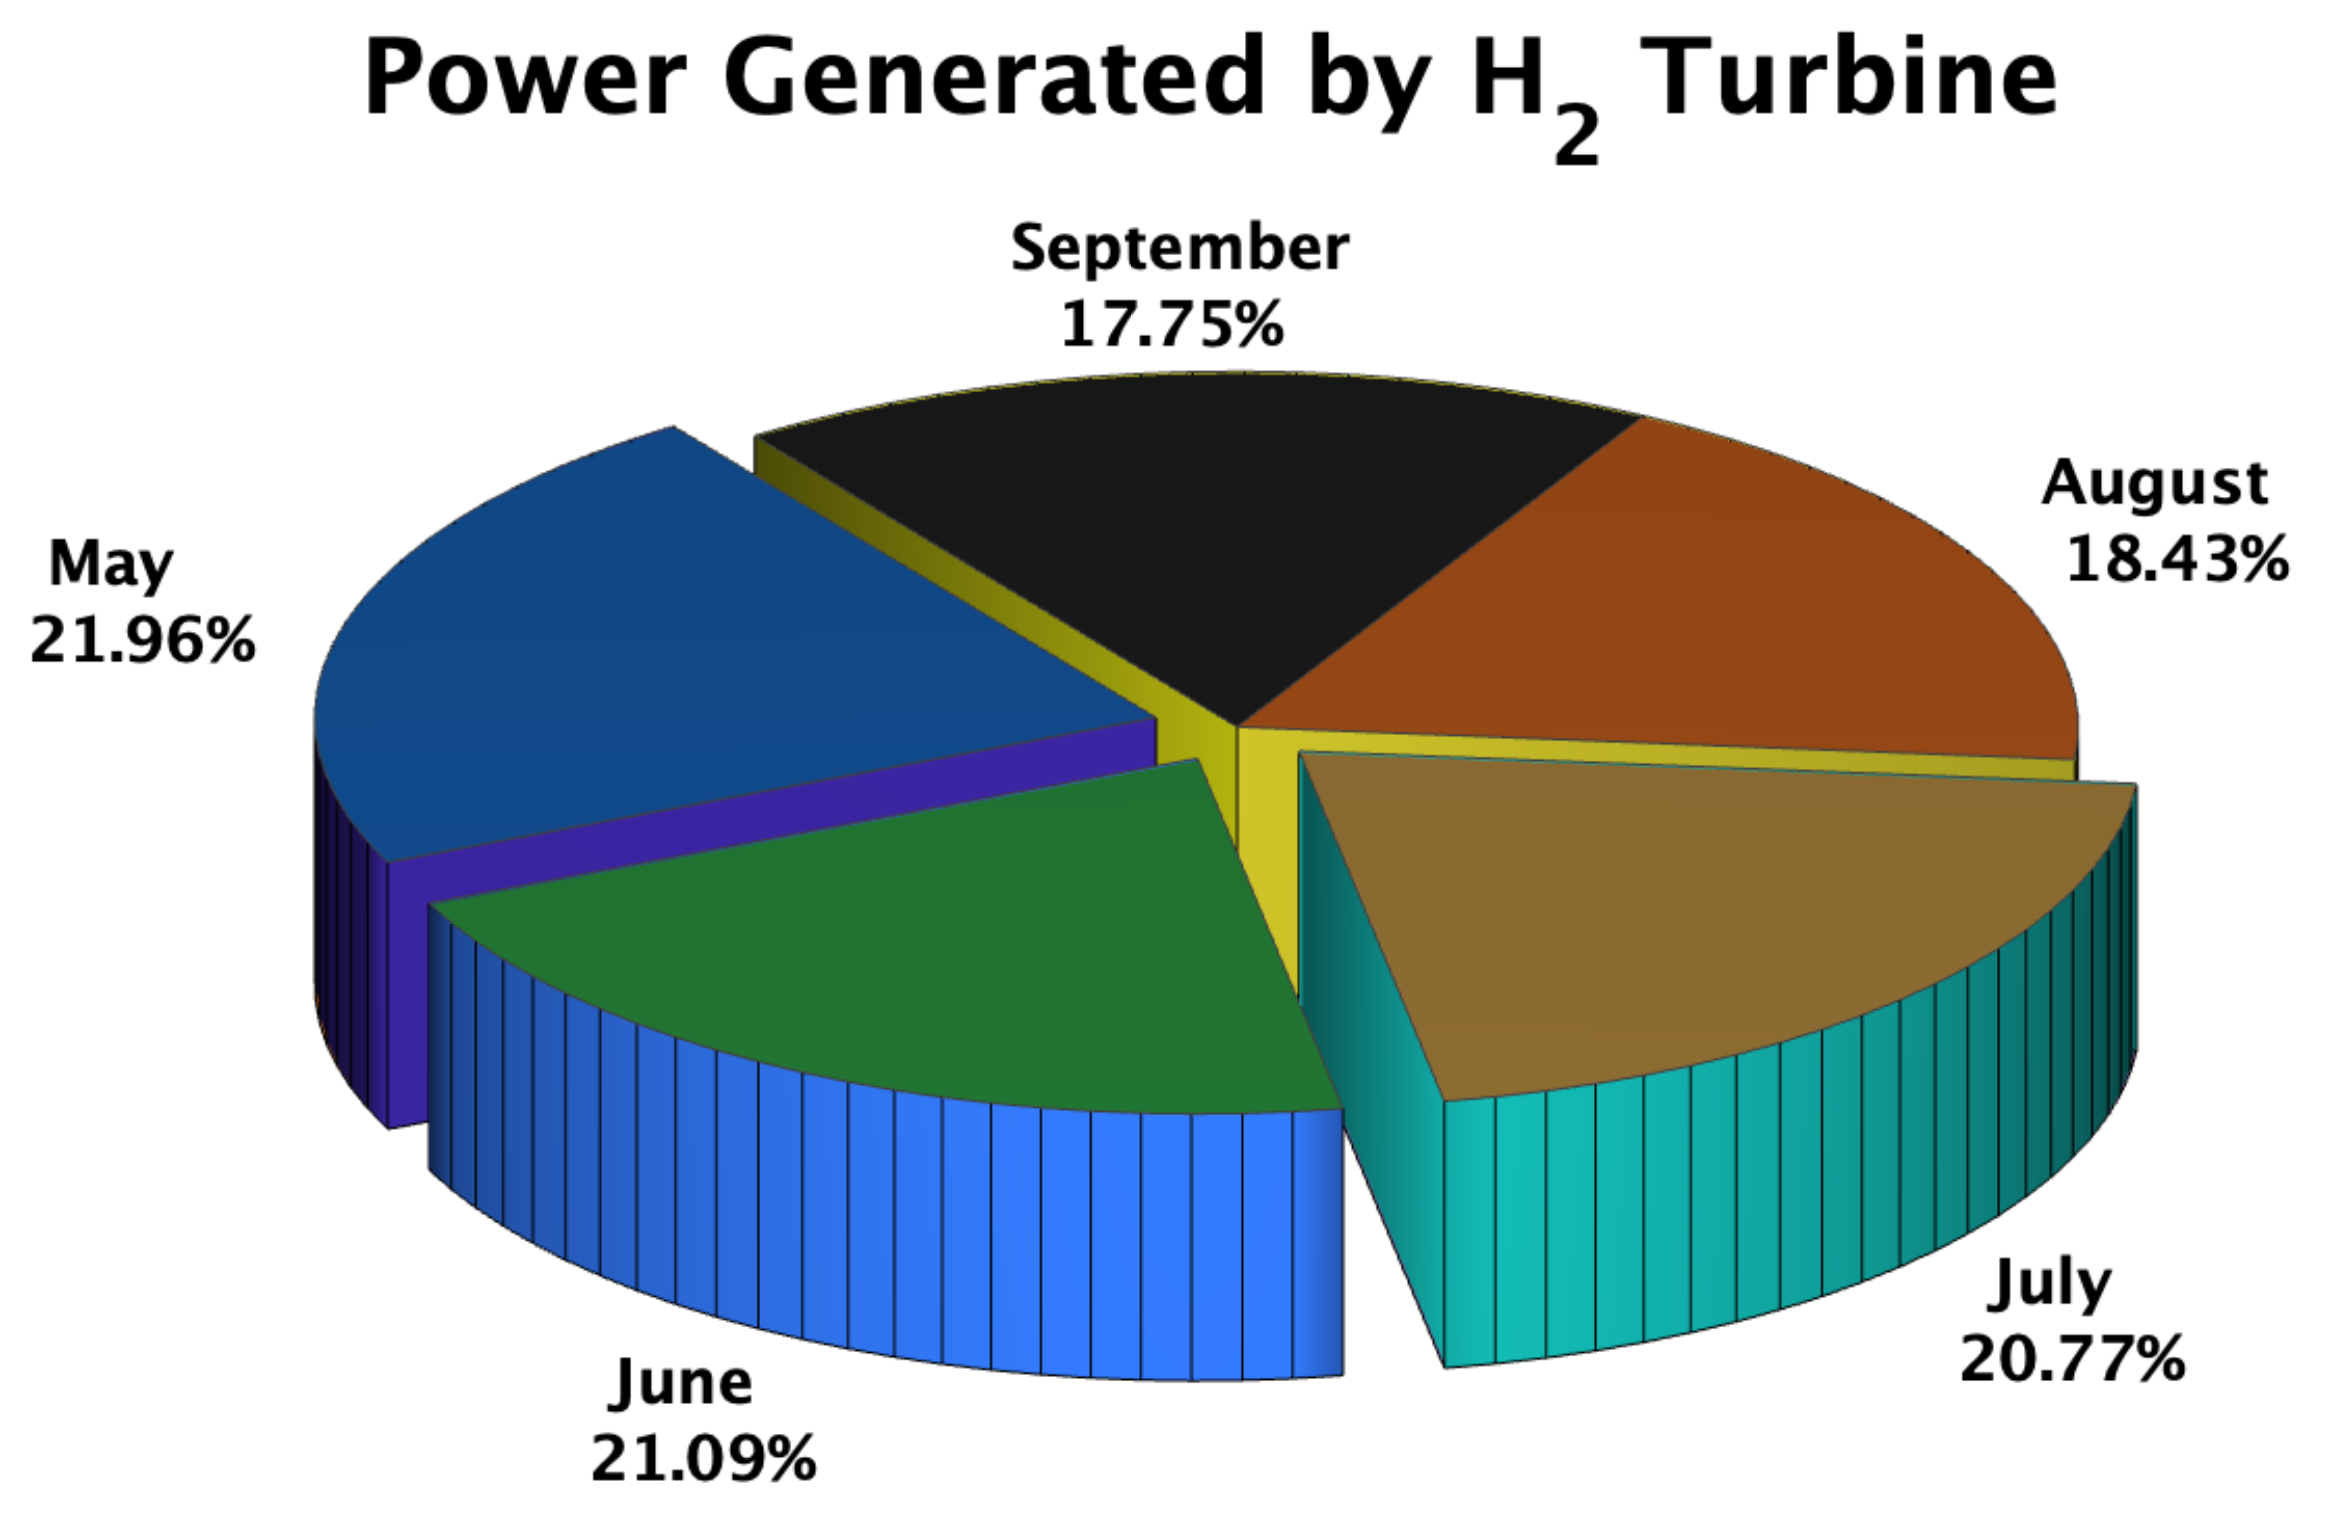
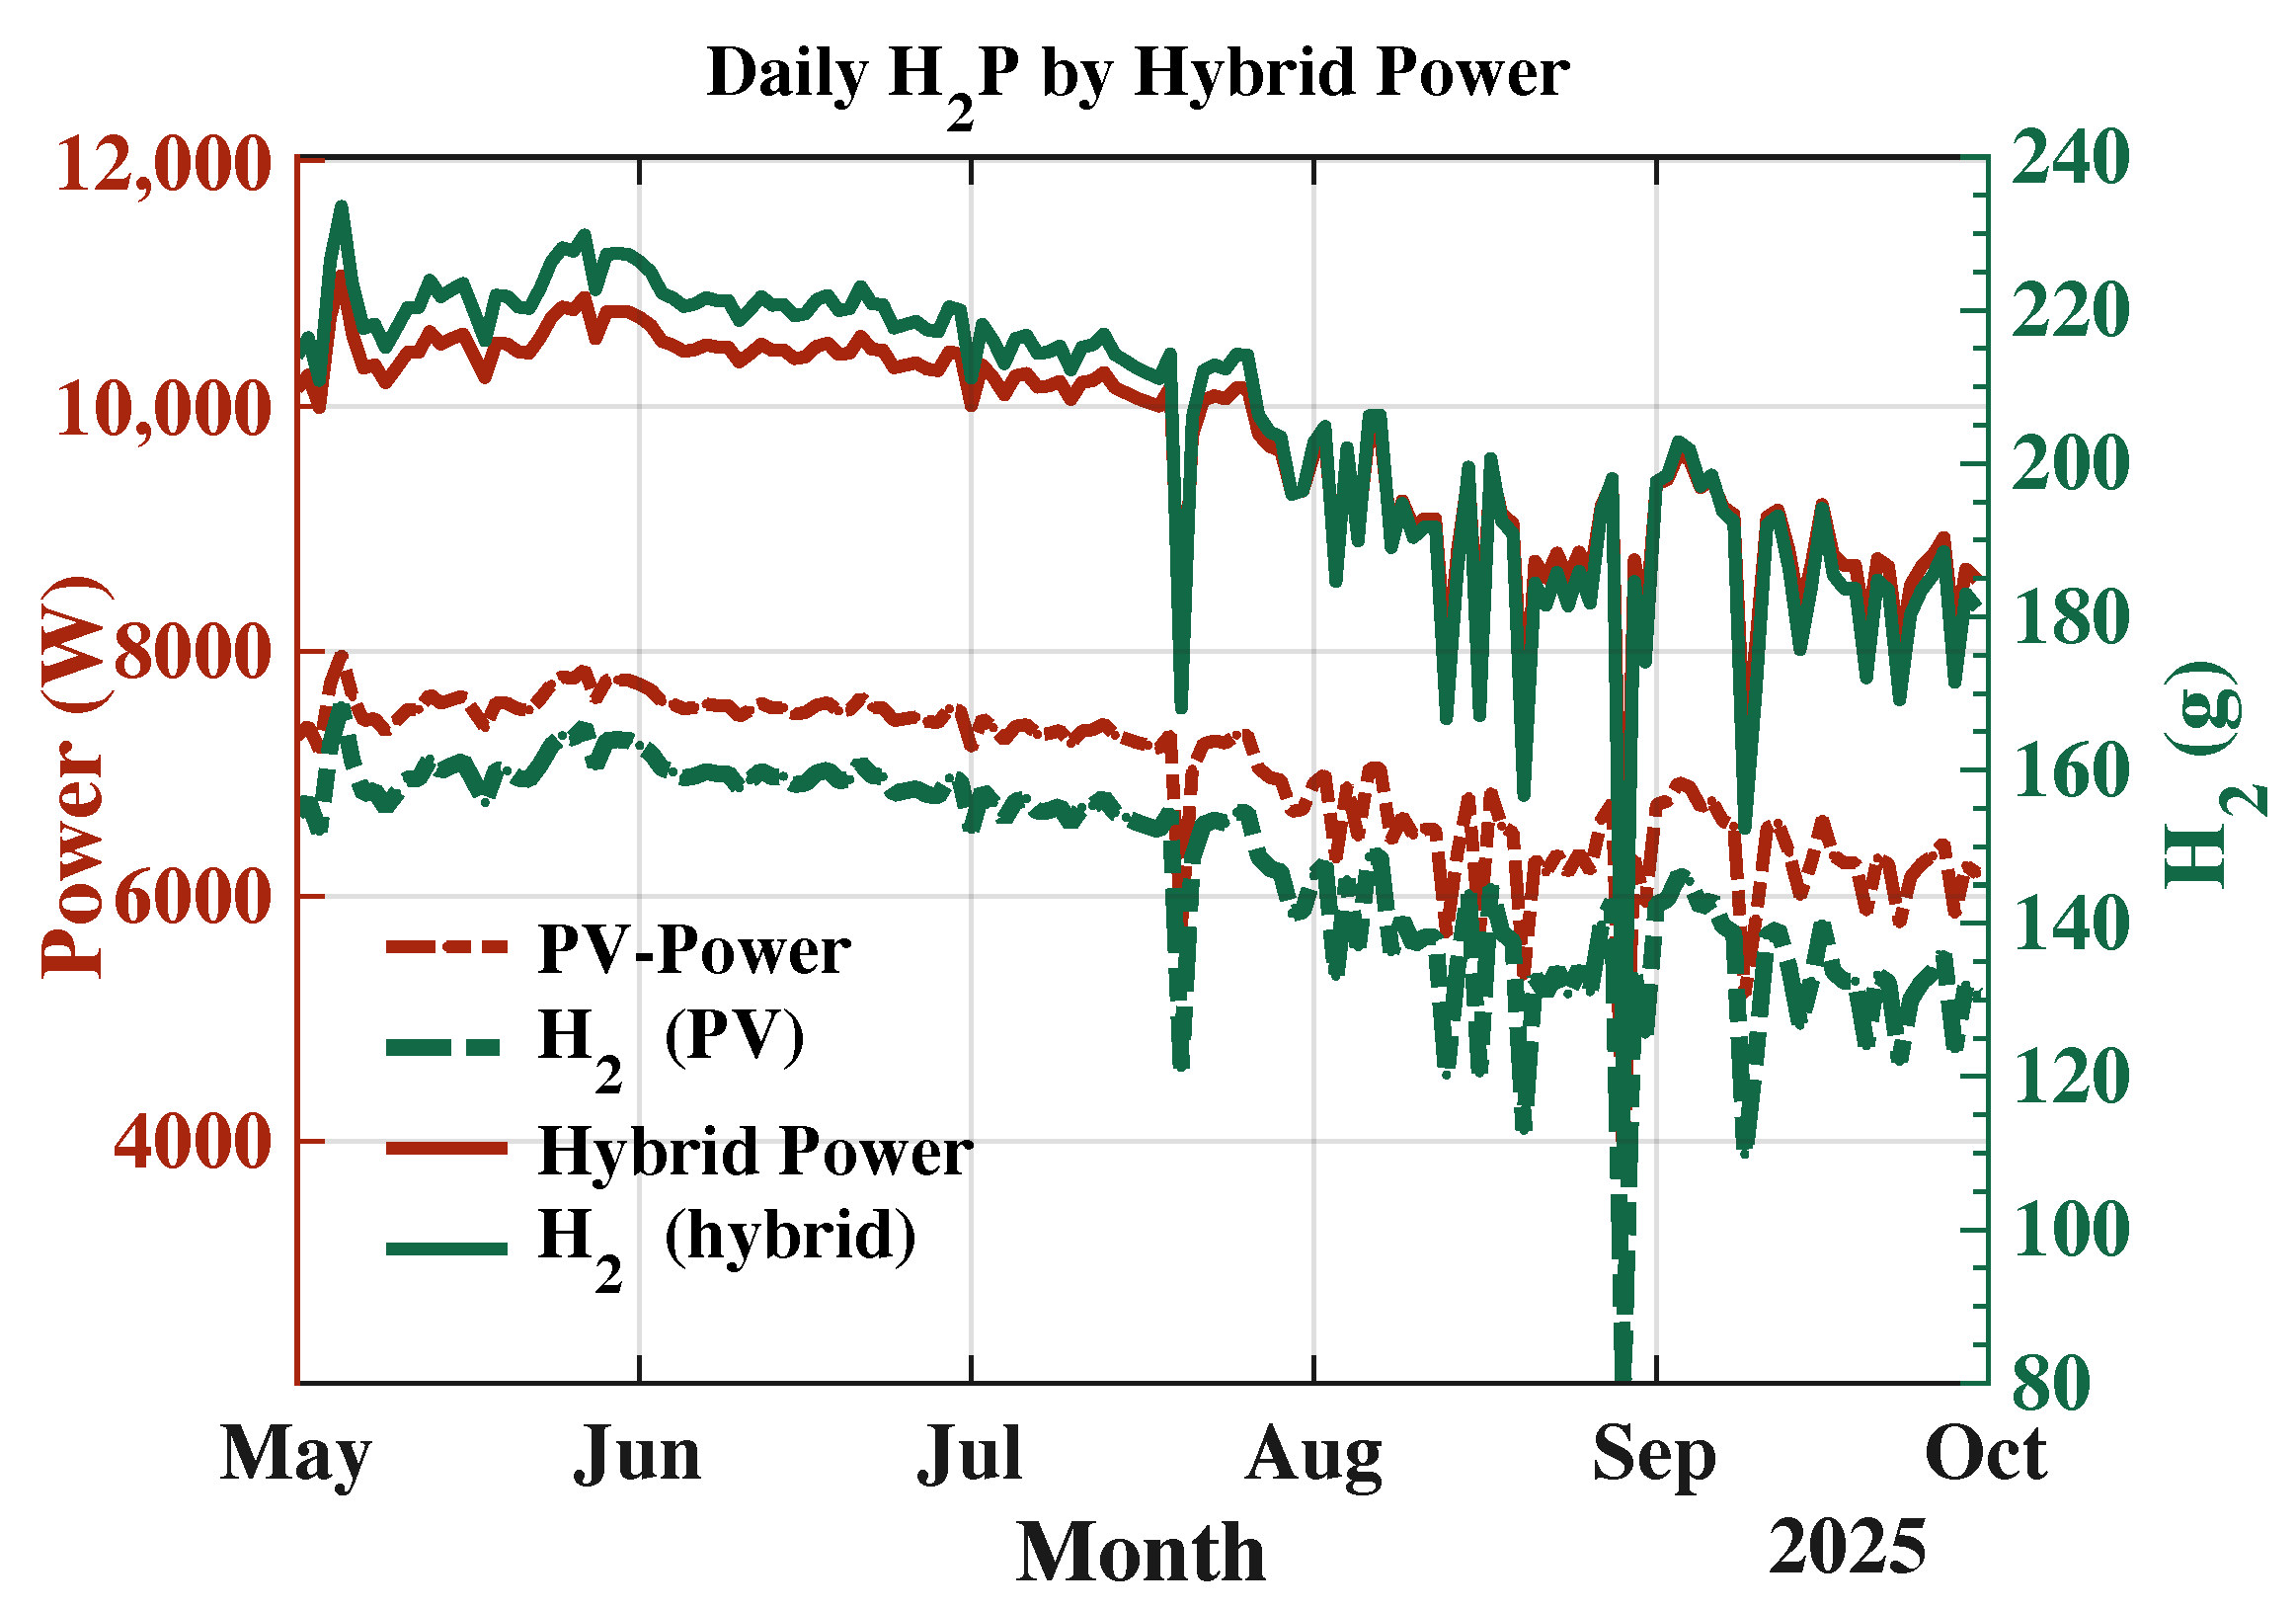
The H2P model presumes consistent electrolyzer performance characteristics, including a uniform SEC and stable conversion efficiency across time. This assumption overlooks short-term operational dynamics, part-load performance, degradation effects, and auxiliary losses that may arise under actual operating circumstances. Thus, the quoted H2 yields should be regarded as theoretical approximations, with real output possibly varying due to transitory electrolyzer performance and system degradation. Nonetheless, while the same assumptions are uniformly implemented throughout all simulated situations, the comparison trends and relative performance enhancements stay steadfast, albeit the absolute H2 yield figures may possess an intrinsic margin of error. Figure 7 depicts the H2 generated by PV power daily. PV output continues to be robust in May and June, with average daily peaks above 6.5 kW, followed by a gradual decline in both PV power and H2P, accompanied by increased variability in August and September. These findings demonstrate the enormous potential for solar-powered H2 generation in the coastal areas of Saudi Arabia. The H2T produced monthly electrical energy in the summer of 2025, as shown in Table 9. The turbine generated a cumulative total of 414,578 Wh during 154 operational days, with peak production in May (91,014 Wh) and exhibiting a progressive fall towards September, corresponding with the seasonal reduction in H2 supply. Figure 8 depicts the H2turbine’s contribution to overall summer power production, indicating that May and June account for the largest proportions (21.95% and 21.10%), while output progressively declines through August and September due to decreased H2 supply. This distribution illustrates the significant correlation between turbine performance and seasonal PV-driven H2 generation. These findings demonstrate the enormous potential for solar-powered H2P, and the turbine exhibited consistent performance across summer months, illustrating the dependability of PV-driven H2 storage for dispatchable power production in the Saudi environment.
The reported output of the H2T is corroborated by a simple energy balance. The total H2 generated during the summer period is approximately 22.6 kg (Table 8). Utilizing the H2 lower heating value of 33.33 kWh/kg and a turbine efficiency of 55 % , the maximum recoverable electrical energy is calculated as E H 2 T = 22.6 × 33.33 × 0.55 415 kWh . This value closely aligns with the simulated turbine output of 414.6 kWh shown in Table 9, thereby validating the internal consistency of the PV–electrolyzer–H2 turbine energy conversion chain.
The electrolyzer specific energy consumption (SEC) and H2 turbine efficiency ( η Turbine ) were examined to evaluate the reliability of the proposed PV–electrolyzer–H2 turbine framework under real-world uncertainties. The SEC exhibited fluctuations of ±10% from its nominal value of 45 kWh/kg, while turbine efficiency varied by ±5% from a baseline of 55%. The findings revealed a nearly linear relationship between SEC variations and H2P, where a 10% increase in SEC resulted in a 10% reduction in output (from 22,615.61 g to 20,354.05 g), while a 10% decrease led to a 12.5% increase (from 4964.90 g to 5585.51 g). In addition, turbine efficiency directly affected the recoverable electrical energy from H2, with power output varying by ±5% and hybrid H2P changing by less than ±3%. The robustness of the modeling framework is confirmed by consistent performance trends and the demonstrated advantages of the hybrid PV–H2T configuration under varying efficiency assumptions, as presented in Table 10 and Table 11.

3.3. Hydrogen Production and Hydrogen Turbine (PV and Hybrid)

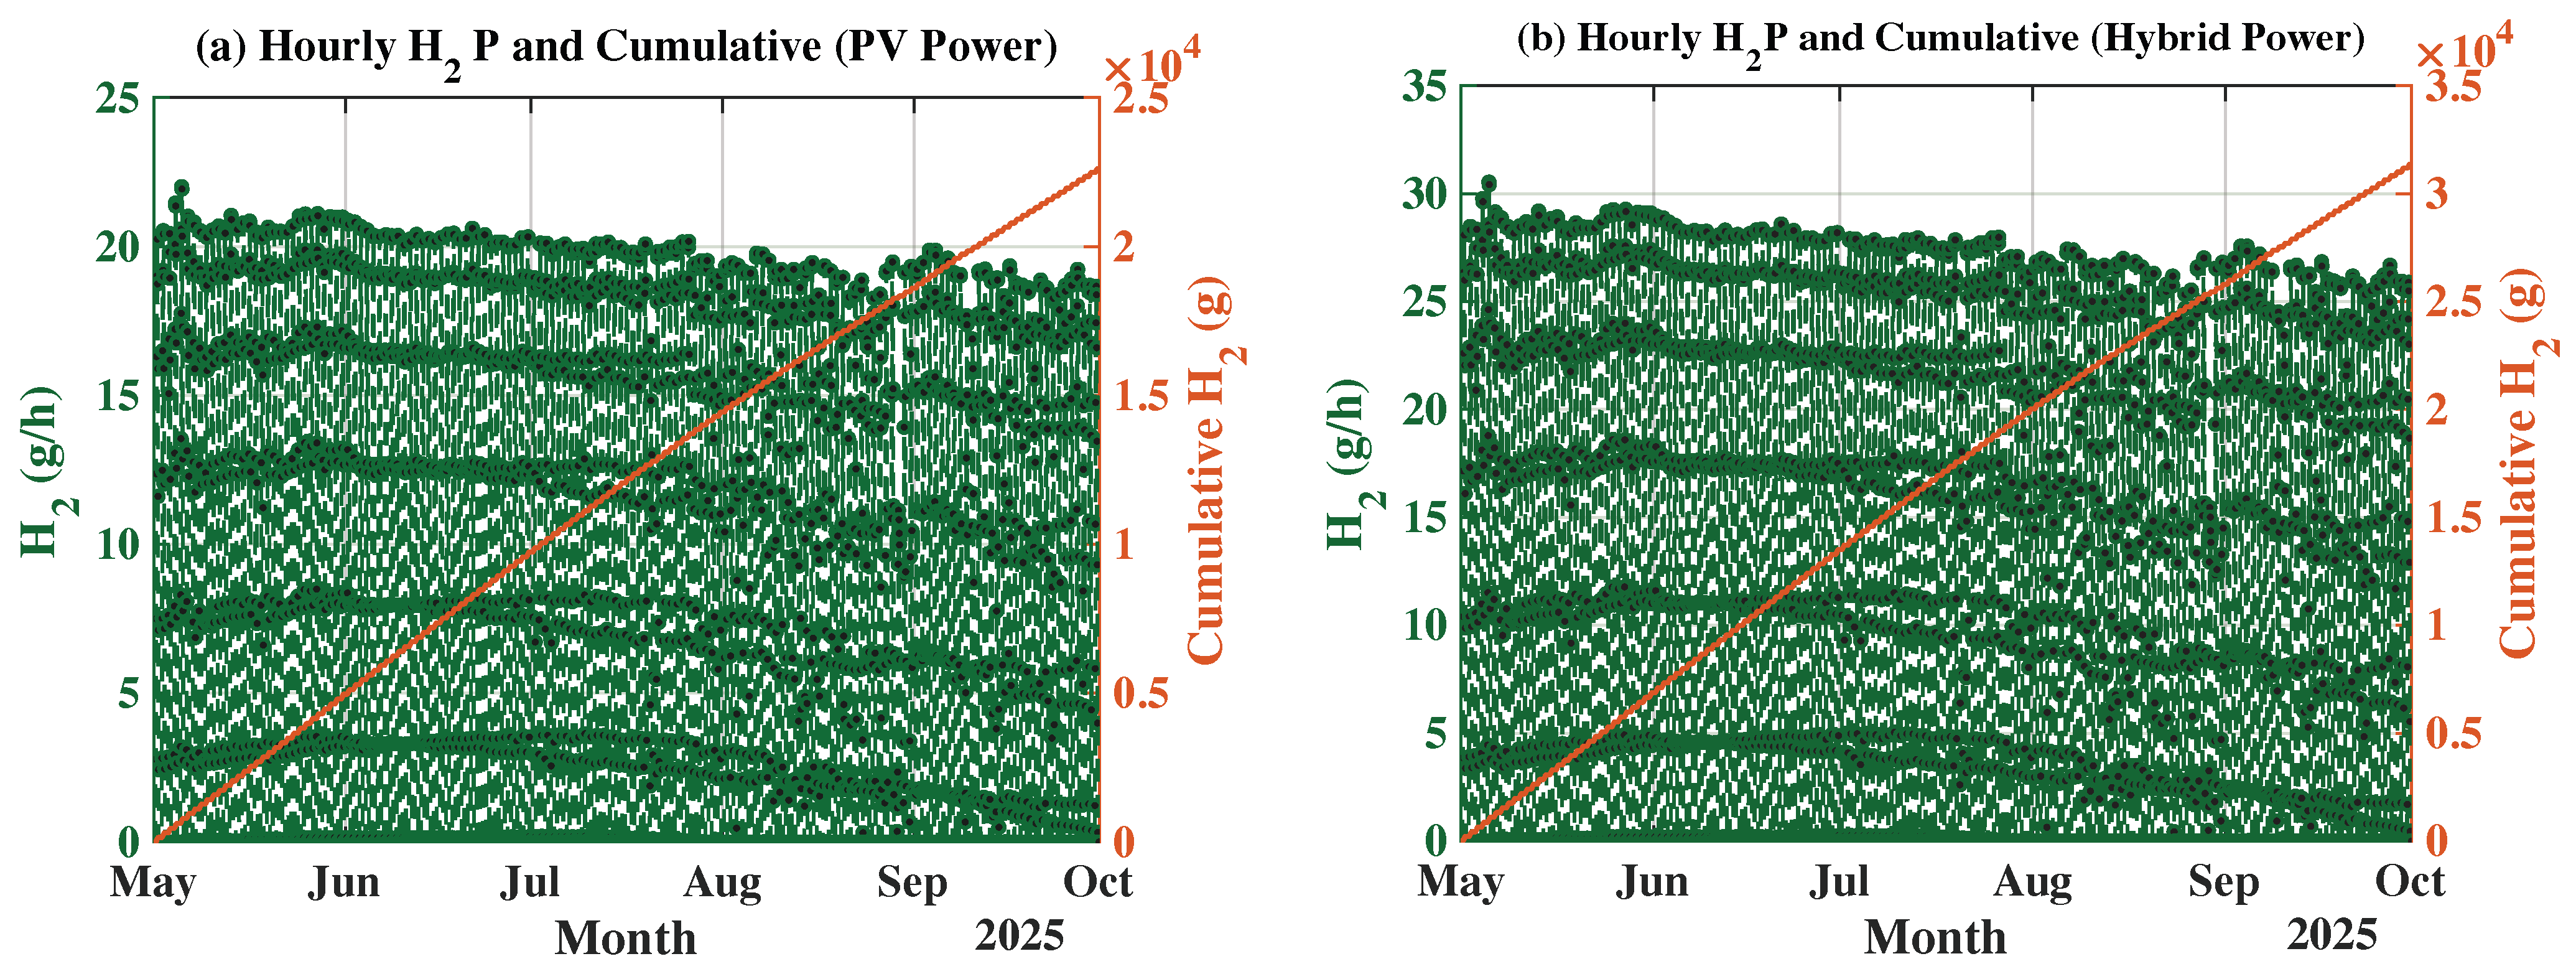
Table 12 and the associated data demonstrate the efficacy of the hybrid energy system in augmenting H2P throughout the summer of 2025. it illustrates that the hybrid source, which integrates PV power with turbine-generated electricity, substantially enhances the energy provided to the electrolyzer, achieving a total of 1.41 MWh and producing 31.37 kg of hydrogen (349 Nm3) with a water usage of 282.31 L. The H2P peaks in May at 6.89 kg and progressively declines until September, indicative of seasonal fluctuations in solar irradiation and hybrid power supply. Figure 9 juxtaposes the daily photovoltaic (PV) power output, H2 generated only from PV, and H2 created by the hybrid system, showing that the hybrid configuration routinely surpasses the PV-only scenario, particularly during intervals of diminished irradiance in late summer. Figure 10a illustrates the hourly H2 generation alongside the cumulative output. The hourly H2 production is consistently constant (10–22 g/h), and the cumulative curve exhibits a linear growth, so validating the continuous and dependable functioning of the PV–electrolyzer system, and Figure 10b shows the hourly H2P and cumulative yield, indicating that the hybrid system consistently generates between 20 and 30 g/h and has a pronounced linear rise in cumulative output throughout the seasonal duration.
H2 Turbines are preferred over PEM fuel cells (PEMFCs) because of their enhanced appropriateness for large-scale, dispatchable power generation and their compatibility with utility-scale energy infrastructure. From an energy-balance standpoint, the PV–electrolyzer–turbine sequence adheres to ( E H 2 T = E PV · η PV · η EL · η stor · η turb ), where each efficiency parameter reflects inherent losses due to semiconductor recombination and resistive phenomena (PV), electrochemical overpotentials and ohmic losses (electrolysis), H2 management and storage, as well as thermodynamic constraints of combustion-based power generation. Although PEMFCs may exhibit higher stack-level electrical efficiency, their scalability, cost, and operational limitations constrain their applicability in the multi-hundred-kilowatt to megawatt range studied here, whereas H2 Turbines provide robust grid support, fast ramping, and straightforward integration with existing thermal infrastructure. The proposed hybrid PV–H2T loop satisfies energy conservation because it does not create additional energy; instead, surplus PV electricity is temporarily converted to chemical energy and subsequently partially recovered, ensuring that the hybrid output remains bounded by the initial PV input minus cumulative conversion losses. The observed increase in H2P under hybrid operation therefore indicates improved utilization of recovered energy that would otherwise be curtailed, rather than any increase in the system’s net energy content.
Due to operational limitations and scalability considerations, the proposed PV–AEL–H2T hybrid framework is inherently scalable in formulation; however, MW/GW deployment presents system-level limitations primarily influenced by PV intermittency and grid interconnection constraints, electrolyzer minimum-load and ramp-rate restrictions during part-load operation, water supply and deionization/cooling capacities, H2 compression, storage sizing, safety compliance, and turbine dispatch limitations concerning combustion stability and emissions control. Thus, extensive implementations necessitate synchronized energy management and plant-level regulation to guarantee viable operation under fluctuating solar conditions.

4. Conclusions

This study presented a comprehensive and accurate modeling framework for solar-driven green H2 production by integrating a Triple-Diode photovoltaic (PV) model (TDM), an alkaline electrolyzer (AEL), and a hydrogen turbine (H2T) into a unified hybrid power architecture. In contrast to traditional PV–H2 research that utilizes simplified electrical models and open-chain power-to-H2 processes, the proposed framework incorporates detailed semiconductor loss mechanisms and explicitly considers H2-to-power recovery via a closed-loop hybrid configuration. The TDM exhibited robust capability in reconstructing PV electrical performance under realistic operating conditions. The results confirmed that, under high solar irradiance, the PV module attained peak maximum power point ( P m p p ) values exceeding 1 kW, as reported in Table 5 and illustrated in Figure 5. These findings confirm the suitability of the TDM for accurate estimation of PV output, particularly under high irradiance and elevated temperature conditions, where simplified diode models can introduce systematic deviations. The alkaline electrolysis model, integrated with SEC-based and Faraday-law formulations, enabled accurate quantification of H2P on hourly, daily, and monthly timescales. During the summer of 2025, the PV-driven electrolyzer generated 22.6 kg of green H2 using approximately 1.02 MWh of electrical energy, with a corresponding water consumption of about 203 L. Seasonal patterns indicated peak H2P in May, followed by a gradual decrease toward September, consistent with variations in solar irradiance and ambient temperature. Incorporating a hydrogen turbine added a complementary dimension of energy utilization by converting stored H2 into dispatchable electrical power. The H2T produced approximately 414.6 kWh over the study period, demonstrating the feasibility of H2-based power recovery within the proposed framework. Reintegrating turbine-generated power with PV electricity in the hybrid configuration increased total H2P to 31.4 kg without requiring additional PV capacity, highlighting the effectiveness of the hybrid power feedback mechanism.
Overall, the proposed PV–AEL–H2T framework provides a coherent and scientifically grounded method for assessing solar-driven H2 systems under real climatic conditions. The electrolyzer and turbine models adopt constant efficiency parameters, which were applied consistently across all scenarios to preserve the validity of comparative trends. Future work may extend the present framework by incorporating load-dependent electrolyzer efficiencies, dynamic turbine operation, and multi-module or utility-scale configurations to enhance practical applicability. The outcomes of this study support the strategic role of integrated solar–hydrogen systems in advancing renewable energy utilization and align with Saudi Vision 2030 and global decarbonization objectives.


Author Contributions

Conceptualization, A.A. (Abdullah Alrasheedi), M.M. and A.A. (Abdullah Abusorrah); methodology, A.A. (Abdullah Alrasheedi); software, A.A. (Abdullah Alrasheedi); validation, A.A. (Abdullah Alrasheedi) and M.M.; formal analysis, A.A. (Abdullah Alrasheedi); investigation, A.A. (Abdullah Alrasheedi); resources, A.A. (Abdullah Alrasheedi), M.M. and A.A. (Abdullah Abusorrah); data curation, A.A. (Abdullah Alrasheedi); writing—original draft preparation, A.A. (Abdullah Alrasheedi); writing—review and editing, M.M.; visualization, M.M. and A.A. (Abdullah Alrasheedi); supervision, M.M. and A.A. (Abdullah Abusorrah). All authors have read and agreed to the published version of the manuscript.

Funding

This research was funded by the Deanship of Scientific Research (DSR), KAU.

Data Availability Statement

No new experimental data were generated in this study. All data were obtained from publicly available meteorological databases and manufacturer datasheets, and all derived data are included within the article.

Acknowledgments

This project was funded by the Deanship of Scientific Research (DSR) at King Abdulaziz University, Jaddah, Saudi Arabia under grant. The authors, therefore, acknowledge with thanks DSR for technical and financial support.

Conflicts of Interest

The authors declare no conflicts of interest.

Abbreviations

H2PHydrogen Production
H2THydrogen turbine
CO2carbon dioxide
GHIglobal horizontal irradiance
TTemperature
AELAlkaline electrolyzers
PEMproton exchange membrane electrolyzers
SOESolid Oxide Electrolyzers
AEManion exchange membrane
PVPhotovoltaic
P m p p peak output power
I m p p peak output Current
V o c open-circuit voltage
I s c Short-circuit current
MPPTmaximum power point tracking
TDMTriple-diode model
STCStandard test conditions
SECSpecific Energy Consumption

References

  1. Saif, A.G.H.; Alquaity, A.B.S.; Mokheimer, E.M.A. Techno-economic analysis of green hydrogen production in Saudi Arabia: A comparative study of solar PV and CSP technologies. Int. J. Hydrogen Energy 2025, 105, 1361–1374. [Google Scholar] [CrossRef] [Scilit]
  2. Boretti, A. Green hydrogen electrolyzer and hydrogen-methane CCGT power plant in NEOM City. Int. J. Hydrogen Energy 2024, 67, 1056–1064. [Google Scholar] [CrossRef] [Scilit]
  3. Zhou, H.; Xue, J.; Gao, H.; Ma, N. Hydrogen-fueled gas turbines in future energy systems. Int. J. Hydrogen Energy 2024, 64, 569–582. [Google Scholar] [CrossRef] [Scilit]
  4. Öberg, S.; Odenberger, M.; Johnsson, F. Exploring the competitiveness of hydrogen-fueled gas turbines in future energy systems. Int. J. Hydrogen Energy 2022, 47, 624–644. [Google Scholar] [CrossRef] [Scilit]
  5. Tian, W.; Wang, Y.; Du, S.; Wang, Q.; Bahri, I.; Qiu, Y.; Chen, Z.; Li, J. Hybrid-mode offshore hydrogen-producing wind turbine: Grid-following and grid-forming operation under variable grid conditions. Sustain. Energy Grids Netw. 2025, 44, 102048. [Google Scholar] [CrossRef] [Scilit]
  6. Munther, H.; Hassan, Q.; Mohammed, A.; Hanoon, T.M.; Algburi, S. Techno-economic and environmental evaluation of green hydrogen co-firing in a 570 MWe gas turbine combined cycle power plant in Iraq. Unconv. Resour. 2025, 6, 100163. [Google Scholar] [CrossRef] [Scilit]
  7. Vostakola, M.F.; Salamatinia, B.; Horri, B.A. A review on recent progress in integrated green hydrogen production processes. Energies 2022, 15, 1209. [Google Scholar] [CrossRef] [Scilit]
  8. Grigoriev, S.A.; Fateev, V.N.; Bessarabov, D.G.; Millet, P. Current status, research trends, and challenges in water electrolysis science and technology. Int. J. Hydrogen Energy 2020, 45, 26036–26058. [Google Scholar] [CrossRef] [Scilit]
  9. Kumar, R.; Thakur, A.K.; Gupta, L.R.; Gehlot, A.; Sikarwar, V.S. Advances in phase change materials and nanomaterials for applications in thermal energy storage. Environ. Sci. Pollut. Res. 2024, 31, 6649–6677. [Google Scholar] [CrossRef] [Scilit]
  10. Herdem, M.S.; Mazzeo, D.; Matera, N.; Baglivo, C.; Khan, N.; Congedo, P.M.; De Giorgi, M.G. A brief overview of solar- and wind-based green hydrogen production systems: Trends and standardization. Int. J. Hydrogen Energy 2024, 51, 340–353. [Google Scholar] [CrossRef] [Scilit]
  11. Ćalasan, M.; Abdel Aleem, S.H.E.; Zobaa, A.F. A new approach for parameter estimation of double- and triple-diode photovoltaic models based on the iterative Lambert W function. Sol. Energy 2021, 218, 392–412. [Google Scholar] [CrossRef] [Scilit]
  12. Zaky, A.A.; Alhumade, H.; Yousri, D.; Fathy, A.; Rezk, H.; Givalou, L.; Falaras, P. Modeling and optimization of a triple-diode model of dye-sensitized solar panels using a heterogeneous marine predators algorithm. Mathematics 2022, 10, 3143. [Google Scholar] [CrossRef] [Scilit]
  13. Khyani, H.K.; Vajpai, J. Development of a triple-diode-based generalized photovoltaic module model. e-Prime 2025, 12, 100964. [Google Scholar] [CrossRef] [Scilit]
  14. Babay, M.-A.; Adar, M.; Chebak, A.; Mabrouki, M. Forecasting green hydrogen production: An assessment of renewable energy systems using deep learning and statistical methods. Fuel 2025, 381, 133496. [Google Scholar] [CrossRef] [Scilit]
  15. Hüner, B. Mathematical modeling of an integrated photovoltaic-assisted PEM water electrolyzer system for hydrogen production. Int. J. Hydrogen Energy 2024, 79, 594–608. [Google Scholar] [CrossRef] [Scilit]
  16. Hidouri, D.; Marouani, R.; Cherif, A. Modeling and simulation of a renewable energy PV/PEM system with green hydrogen storage. Eng. Technol. Appl. Sci. Res. 2024, 14, 12543–12548. [Google Scholar] [CrossRef] [Scilit]
  17. Li, G.; Song, C.; Han, G.; Chen, Z.; Huang, J. Optimization of hydrogen production system performance using photovoltaic/thermal-coupled PEM electrolysis. Energies 2024, 17, 5405. [Google Scholar] [CrossRef] [Scilit]
  18. Canadian Solar Inc. CS6.1-72TB TOPBiHiKu6 (590–620 W) Photovoltaic Module Datasheet; Version 1.7; CSI Solar Co., Ltd.: Suzhou, China, 2024. Available online: https://static.csisolar.com/wp-content/uploads/sites/9/2023/10/12111132/CS-Datasheet-TOPBiHiKu6-TOPCon_CS6.1-72TB_v1.5_EN.pdf (accessed on 1 March 2024).
  19. Nel Hydrogen. Electrolysers Brochure, Rev. D; Nel Hydrogen: Oslo, Norway, 2021; Available online: https://nelhydrogen.com/resources/electrolysers-brochure/ (accessed on 1 March 2023).
  20. Elazab, O.S.; Hasanien, H.M.; Alsaidan, I.; Abdelaziz, A.Y.; Muyeen, S.M. Parameter estimation of a three-diode photovoltaic model using the grasshopper optimization algorithm. Energies 2020, 13, 497. [Google Scholar] [CrossRef] [Scilit]
  21. Wang, S.; Wang, C.; Ge, Y.; Liu, S.; Xu, J.; Amer, R.A. In-depth analysis of photovoltaic module parameter estimation. Energy 2024, 291, 130345. [Google Scholar] [CrossRef] [Scilit]
  22. Gulkowski, S. Modeling and experimental studies of photovoltaic system performance under Polish climate conditions. Energies 2023, 16, 7017. [Google Scholar] [CrossRef] [Scilit]
  23. Kumar, A.; Agarwal, R. Mathematical modeling and analysis of single-, double-, and triple-diode-based PV modules. In Proceedings of the 2023 International Conference for Advancement in Technology (ICONAT), Goa, India, 24–26 January 2023; pp. 1–6. [Google Scholar] [CrossRef] [Scilit]
  24. Şahin, M.E. An overview of different water electrolyzer types for hydrogen production. Energies 2024, 17, 4944. [Google Scholar] [CrossRef] [Scilit]
  25. Shiva Kumar, S.; Lim, H. An overview of water electrolysis technologies for green hydrogen production. Energy Rep. 2022, 8, 13793–13813. [Google Scholar] [CrossRef] [Scilit]
  26. Koponen, J.; Ruuskanen, V.; Hehemann, M.; Rauls, E.; Kosonen, A.; Ahola, J.; Stolten, D. Effect of power quality on the design of proton exchange membrane water electrolysis systems. Appl. Energy 2020, 279, 115791. [Google Scholar] [CrossRef] [Scilit]
  27. Viinanen, T.; Ruuskanen, V.; Ahola, J.; Niemelä, M.; Küngas, R.; Sonnabend, P.; Vuorsalo, S.; Kauhanen, M.; Kauranen, P. Serial connection of 48-cell alkaline electrolysis stacks. J. Power Sources 2025, 659, 238382. [Google Scholar] [CrossRef] [Scilit]
Figure 1. Schematic of H2P, corresponding with H2T (H2T power → back to electrolyzer as hybrid).
Energies 19 00435 g001
Figure 2. Jeddah GHI and Ta for summer months.
Energies 19 00435 g002
Figure 3. I–V and P–V Curves of PV module under STC (1000 W/m2, 25 °C).
Energies 19 00435 g003
Figure 4. Triple-diodes model Circuit (TDM).
Energies 19 00435 g004
Figure 5. P–V and I–V characteristics.
Energies 19 00435 g005
Figure 6. Fill factor details (FF).
Energies 19 00435 g006
Figure 7. The details of PV power and H2P in the summer season.
Energies 19 00435 g007
Figure 8. Percentages only; absolute values are provided in Table 9.
Energies 19 00435 g008
Figure 9. Comparison of Daily H2P: PV Power vs. PV + H2T Power.
Energies 19 00435 g009
Figure 10. The hourly green H2P from hybrid power.
Energies 19 00435 g010
Table 1. Summary of recent studies integrating PV modeling with PEM electrolysis and corresponding H2P results.
Ref.PV-Model|Electrolyser|TurbineDescription
[14]SDM|PEM|NonePolycrystalline panels achieved the highest H2P of 60.65 kg in 2018, while amorphous panels declined by 2023. Monocrystalline panels had an efficiency range of 9.96% in 2018 to 5.56% in 2015, while polycrystalline panels showed a narrower range and amorphous panels peaked at 7.71% in 2019.
[15]SDM|PEM|NoneThe operation temperature of the PEM water electrode increased from 25 °C to 80 °C, with H2 flow rates of approximately 1.44 and 1.82 mL/min at 2 A/cm2. The maximum H2P rates for 7-cell and 14-cell PV-assisted PEM electrolyzer stacks are about 349.98 mL/min and 699.91 mL/min, respectively. The overall efficiency of the integrated PV-assisted PEM electrolyzer stack ranges from approximately 6.0% to 6.5%, depending on solar irradiance levels.
[16]SDM|PEM|NoneThe hybrid system consisted of 1.2 MW PV solar panels, a 1.0 MW PEM electrolyzer, a high-pressure H2 storage tank, and a PEM fuel cell (PEMFC) for H2-to-power conversion. Modeling results indicate a daily H2P of around 200 kg via electrolysis, sufficient to power 100 electric vehicles with a 250 km driving range. Actual climatic conditions and variable PV performance enhance storage efficiency and capacity by approximately 30%.
[17]CPV/T|PEM|NoneH2P is significantly elevated between 11:00 and 16:00, peaking between 12:00 and 13:00. The peak H2 generation rates are 99.11 g/s for the CPV/T–PEM system and 29.02 g/s for the PV/T–PEM system. The peak energy efficiencies reach 66.7% and 70.6%, respectively. The CPV/T–PEM system achieves a maximum H2P rate of 2240.41 kg/day, with coal savings of 15.5 tons/day and CO2 emission reductions of 38.0 tons/day, outperforming the PV/T–PEM system.
This workTDM|Alkaline (AEL)|H2TThe PV system generated 1.07 MWh during the summer period. The alkaline electrolyzer produced 22.6 kg of green H2 with a water consumption of approximately 203 L. The generated H2 was converted into electricity using a H2T, producing 414.6 kWh, which was integrated with PV power to form a hybrid renewable energy system. This hybrid configuration increased H2P to 31.4 kg, demonstrating a substantial improvement in renewable H2 output.
Table 2. Details of data under Standard Test Conditions (STC): 1000 W/m2, AM 1.5, T cell = 25 °C.
a. Electrical Parameter (Front-side only)Value
Nominal maximum power ( P max ) [W]610
Optimum operating voltage ( V mp ) [V]44.4
Optimum operating current ( I mp ) [A]13.74
Open-circuit voltage ( V oc ) [V]52.2
Short-circuit current ( I sc ) [A]14.66
Module efficiency ( η )22.60%
R s and R p [ Ω ]0.3045 and 504.6
α 1 , α 2 , and α 3 1.2, 2.0, and 3.0
Io1, Io2, and Io3 [A]1.0 × 10−9, 1.0 × 10−6, and 1.0 × 10−7
E g [eV]1.12
b. Bifacial Gain (+5%)641 W, 44.4 V, 14.43 A, and η 23.7 %
c. Specification of Mechanical DataValue/Description
Cell typeTOPCon n-type crystalline silicon cells
Cell arrangement ( N s )144 cells ( 2 × [ 12 × 6 ] )
Module dimensions 2382 × 1134 × 30  mm (≈ 93.8 × 44.6 × 1.18  in)
Weight33.6 kg (74.1 lb)
Front glass2.0 mm heat-strengthened glass with anti-reflective coating
Back glass2.0 mm heat-strengthened glass
Junction boxIP68 protection, 3 bypass diodes
Table 3. Alkaline hydrogen electrolyzer (Nel A-Series): Technical parameters.
ParameterTypical Range
H2 production rate [Nm3/h]50–485
Dynamic operating range15–100%
H2 purity ( y H 2 ) [%]99.99–99.998
O2 content in H2 [ppm (v)]<2
H2O content in H2 [ppm (v)]<2
Stack power consumption ( E stack ) [kWh/Nm3 H2]3.8–4.4
Stack efficiency ( η stack ) [%]70–85
Operating temperature (T) [°C]2–40 (ambient)
Delivery pressure (P) [barg]1–200
Specific energy consumption (SEC) [kWh/kg]45
Table 4. Summary of alkaline water electrolysis chemical reactions.
Reaction/ParameterDescription
Anode: 2 OH H 2 O + 1 2 O 2 + 2 e
Cathode: 2 H 2 O + 2 e 2 OH + H 2
Charge carrier: H +
Efficiency (%):50–78%
Operating temperature:70–90 °C
Cell pressure:<30 bar
Hydrogen purity:99.5–99.9998%
Table 5. Some of TDM parameter results in terms of the highest maximum power point.
Time4 May 2025 12:004 May 2025 13:005 May 2025 12:005 May 2025 13:0027 May 2025 12:00
G [W/m2]965.70960.00991.10987.70984.60
T a [°C]30.8030.6030.5030.6040.50
T m [K]329.30329.00329.70329.70339.50
V t h [V]0.030.030.030.030.03
I s c [A]14.1614.0814.5314.4814.44
V o c [V]95.9095.9695.9595.9393.61
R s [ Ω ]0.300.300.300.300.30
R p [ Ω ]522.52525.63509.13510.88512.49
I p v [A]14.1714.0914.5414.4914.45
I o 1 [A] 4.07 × 10 8 3.92 × 10 8 4.23 × 10 8 4.23 × 10 8 1.17 × 10 7
I o 2 [A] 1.04 × 10 5 1.07 × 10 5 1.07 × 10 5 1.07 × 10 5 2.04 × 10 5
I o 3 [A] 5.27 × 10 7 5.18 × 10 7 5.36 × 10 7 5.36 × 10 7 8.50 × 10 7
V m p p [V]77.6777.7177.7077.6975.33
I m p p [A]13.0913.0213.4213.3713.27
P m p p [W]1016.771011.901042.661038.98999.72
FF0.750.750.750.750.74
Table 6. Some of TDM parameter results in terms of different GHI levels.
Time22 May 2025 18:0013 June 2025 08:0013 June 2025 16:008 August 2025 13:0022 September 2025 11:00
G [W/m2]135.60354.60575.70913.70797.70
T a [°C]35.2032.7038.1042.6041.00
T m [K]311.90315.20326.40339.70335.10
V t h [V]0.030.030.030.030.03
I s c [A]1.995.208.4413.4011.70
V o c [V]90.4294.3493.9893.1693.55
R s [ Ω ]0.300.300.300.300.30
R p [ Ω ]3721.241423.01876.50552.26632.57
I p v [A]1.995.208.4513.4111.71
I o 1 [A] 5.66 × 10 9 8.31 × 10 9 2.96 × 10 8 1.20 × 10 7 7.49 × 10 8
I o 2 [A] 2.98 × 10 6 3.81 × 10 6 8.51 × 10 6 2.07 × 10 5 1.53 × 10 5
I o 3 [A] 2.17 × 10 7 2.58 × 10 7 4.56 × 10 7 8.59 × 10 7 6.93 × 10 7
V m p p [V]75.5478.8277.5574.9776.24
I m p p [A]1.844.817.7812.3410.74
P m p p [W]138.90379.22603.36925.34818.77
FF0.770.770.760.740.75
Table 7. The PV output during summer season for one module (144 cells).
Month (2025)Total of P m p p (Wh)
May235,061.6
June225,760.4
July222,419.5
August197,306.4
September190,088
Total Power1,070,635.9
Operating days154
Table 8. H2P generated by PV.
Month 2025Energy Used (Wh)H2 (g)H2 (Nm3)H2O (mL)
May223,420.444964.9055.2444,684.09
June214,760.414772.4553.1042,952.08
July211,497.094699.9452.2942,299.42
August187,441.054165.3646.3437,488.21
September180,583.634012.9744.6536,116.73
Total1,017,702.6222,615.61251.62203,540.53
Table 9. The power output of H2T.
Month (2025)Power Generated by H2T (Wh)
May91,014.041
June87,486.233
July86,156.864
August76,357.237
September73,563.752
Total Power414,578.128
Operating days154
Table 10. H2 production generated by PV under ±10% variation in SEC.
Month 2025H2 (g)H2 (+10% SEC) (g)H2 (−10% SEC) (g)
May4964.904468.415585.51
June4772.454295.215369.01
July4699.944229.945287.43
August4165.363748.824686.03
September4012.973611.674514.59
Total22,615.6120,354.0525,442.57
Table 11. Power output of the H2 turbine under ±5% variation in turbine efficiency ( η turbine ).
Month 2025H2T (Wh)H2T (+5% η turbine ) (Wh)H2T (−5% η turbine ) (Wh)
May91,014.0495,978.4486,049.64
June87,486.2392,258.2182,714.26
July86,156.8690,856.3381,457.40
August76,357.2480,522.1872,192.30
September73,563.7577,576.3269,551.18
Total414,578.13437,191.48391,964.78
Table 12. H2 production from hybrid source ( P H 2 Hybrid ).
Month 2025Energy Used (Wh)H2 (g)H2 (Nm3)H2O (mL)
May309,883.786886.3176.6261,976.76
June297,872.336619.3973.6559,574.47
July293,346.116518.8072.5358,669.22
August259,980.435777.3464.2851,996.09
September250,469.205565.9861.9350,093.84
Total1,411,551.8531,367.82349.00282,310.37
Disclaimer/Publisher’s Note: The statements, opinions and data contained in all publications are solely those of the individual author(s) and contributor(s) and not of MDPI and/or the editor(s). MDPI and/or the editor(s) disclaim responsibility for any injury to people or property resulting from any ideas, methods, instructions or products referred to in the content.