Abstract
Prediction of the Electric Vehicle (EV) charging demand is of great importance to charging stations, especially for newly established charging stations whose demand is difficult to predict due to the absence of past time-series transaction data. This paper develops a deep learning method to fill the literature gap to predict charging demands for the new EV charging stations in the next few days, using a transaction dataset containing over 270 charging stations in Nanjing, eastern China. Specifically, our study introduces the average transactions of neighboring stations as new time-series variables and constructs a Convolutional Neural Network (CNN) model, which is a novel deep learning method. The R-squares of the CNN model achieve an average value of 0.90, which outperforms four time-series prediction models, e.g., the Long Short-Term Memory Network (LSTM) and the Extreme Gradient Boosting (XGBoost). In addition, we visualize the areas with high predicted demand for new charging stations using the trained CNN model and achieve a recommendation accuracy rate of 0.70, providing a reference for EV charging operation companies to find the optimal location of new charging stations. Accurate prediction for new charging stations in this study can provide actionable insights to charging station operators in location selection and create a more favorable EV ecosystem.
1. Introduction
Electric vehicles (EVs) have enjoyed rapid growth in recent years. Their advantages in the reduction of carbon and particulate matter emission, the cost of manufacturing, and improved battery life and mileage, have won the favor of a large number of consumers [1,2,3,4]. As reported in the Global EV Outlook by the International Energy Agency, global EV sales exhibit an exponential growth trend and are expected to reach 250 million in 2030 [5]. At the same time, the number of publicly accessible chargers is expected to rise from 2.7 million in 2022 to 13 million in 2030 worldwide.
While the growing popularity of EVs creates a large demand for EV charging facilities, the construction of charging facilities is still in short supply [6]. On one hand, the high cost of a newly established charging station prohibits many operators from entering, including the construction and operation cost [7,8,9] and the electricity cost [10,11,12]. Gamage et al. [8] find that the unit construction cost of direct current fast chargers ranges from $122,000 to $440,000, and Wang et al. [11] report that the annual grid-upgrade cost per station is between $250,000 and $400,000 through field measurements and simulations of high-power fast-charging stations. On the other hand, there is a geographical mismatch of charging stations and EV drivers [13,14]. The operators of EV charging facilities are not building new charging stations in locations with enough charging demands from EV drivers, and EV drivers usually have problems finding available charging stations nearby. Apart from spatial mismatch, temporal mismatch also deserves attention [15,16]. Existing stations may face congestion at peak time and be left idle during off-peak hours. Therefore, it is critical to predict the charging demand for the newly established stations, accurately identify the location where EV charging demand–supply mismatch is the greatest, and ensure that every new EV charging station provides efficient supply and is profitable.
While the previous literature on demand forecasting has examined the transactions [17,18] and charging load prediction [19,20,21] of charging stations, the extant literature mainly focuses on demand prediction for existing charging stations, which is difficult to directly apply to the forecast for newly established charging stations. Specifically, traditional demand forecasting primarily uses the past time-series transactions of a charging station to predict its future transactions due to the stability and accessibility of time-series data in prediction [22,23,24,25,26]. However, it is infeasible to predict charging demand for a new charging station in the same way since it does not obtain past time-series information. The purpose of our study is to fill in this research gap.
To solve this problem, this paper introduces new time-series variables and constructs a deep learning method for prediction. For a new charging station without past transaction data, we employ time-series transactions from its nearby existing charging stations as the new time-series variables and construct a Convolutional Neural Network (CNN) model to predict its future charging demand. The CNN model is a deep learning approach proficient in mining long-term dependencies and demonstrating strong performance in time-series prediction [27,28] and has been widely used in energy-related demand prediction [29,30,31]. In addition, we include station-specific covariates (e.g., number of charging piles, charging power), weather, temperature, and holiday variables to improve the prediction accuracy. Using the data from November 2023 to June 2024 from a partner charging station operation company, we predict the total next-few-days (e.g., 3 and 7 days) demand for new charging stations (average R2 = 0.90) with the CNN model. Moreover, we introduce four time-series prediction models as baselines, i.e., Long Short-Term Memory Network (LSTM), Extreme Gradient Boosting, Spatio-Temporal Graph Convolutional Network (ST-GCN), and Informer [25]. The prediction results show that the CNN model significantly outperforms the four baseline models (XGBoost: average R2 = 0.75, LSTM: average R2 = 0.82, ST-GCN: average R2 = 0.85, Informer: average R2 = 0.86).
Accurate demand prediction helps EV charging operation companies to solve the location selection problem of new charging stations. Therefore, our study employs the trained CNN model and identifies optimal locations for new charging stations by visualizing the areas with highest demand. We also visualize the current distribution of charging stations along with our recommendations to provide actionable guidance for companies on where to build new charging stations. In addition, to verify the prediction results of our model, we calculate the recommendation accuracy using the performance of actual new charging stations during the subsequent periods in our dataset. Across 37 newly established charging stations, our recommendation accuracy achieves 70% at both the top 10 and the top 20 performing stations. This has significant practical implications for EV charging operation companies as we narrow down the location-selection consideration set from the perspective of charging demand and provide solid support for the decision-making in the location selection of new charging stations.
This paper makes three key contributions. First, it contributes to the literature on demand prediction for charging stations. For EV charging operation companies, the demand prediction for new EV charging stations is the core issue in the location selection of a new station [32,33,34]. Yet, the lack of transaction data impedes efficient decision-making by EV charging operators. We adopt a novel approach by leveraging the transaction data from nearby stations as a new input feature to solve the problem, which has not been addressed in the previous literature. Second, the deep learning approach application contributes to the relevant methodological literature on demand prediction. Our work on demand forecasting for new charging stations expands the scenarios where deep learning methods can be employed [25,35,36,37]. In addition to predicting demand for existing stations using their own time-series data, deep learning methods are also capable of predicting demand for new charging stations. Lastly, we visualize our prediction results, which provide valuable and applicable guidance for companies to build new charging stations. This paper aims to help accelerate the supply of charging facilities, increase consumer demand for electric vehicles, and complete the positive feedback loop of green transportation, which may, in turn, lead to EV drivers’ range anxiety alleviation and a favorable EV ecosystem [9,17,38].
2. Literature Review
2.1. Prediction of EV Charging Demand
Charging demand prediction plays an important role in EV research. Previous studies mainly focus on the EV charging demand for existing charging stations for the purpose of infrastructure development, policy making, real-time operation of charging facilities, etc.
First, some studies analyze and build models for EV charging transactions (also called charging events) in charging stations. For example, Wang et al. [25] and Liu et al. [17] build Long Short-Term Memory (LSTM) models to predict the EV charging events in existing charging stations in the short term. Sone et al. [39] propose an uncertainty-aware deep learning framework to predict EV arrivals at a charging station, and the prediction performance achieves an R2 of 0.90. Su et al. [36] propose an operating status prediction model at electric vehicle (EV) charging stations and reveal that the mean forecast error is around 19.21% when estimating 18 min ahead.
Second, another school of EV-charging research focuses on charging load prediction for charging stations, which shares similar data and methodologies with transaction prediction. For example, Yin and Ji [20] develop a fusion deep learning model by introducing a Bayesian optimization method for charging load prediction, and they also propose a power prediction model based on federated learning and deep learning [3]. In addition, Wang et al. [40] use the Monte Carlo simulation method to predict the EV load distribution under the conditions of specific districts, seasons, and weather. Li and Han [41] propose an edge aggregation graph attention network (EGAT) prediction method combining LSTM for load prediction, and Xie et al. [19] also propose a load prediction framework for EV charging station groups based on multi-graph fusion.
Although these studies have investigated various methods in demand prediction of EV charging stations, they have only focused on the existing charging stations, and the demand prediction for new charging stations has not yet been explored. We contribute to these studies by developing a demand prediction model for new charging stations. By identifying the demand for new charging stations, our study helps companies respond to market demands and develop corporate strategies in a more data-driven fashion, which could facilitate the effective distribution of EV charging facilities and accelerate EV adoption. Appendix A provides a detailed summary of the literature referred.
2.2. Data Foundation for Charging Station Demand Prediction
Regardless of the type of demand prediction in the fields of electricity and transportation, the time-series data always plays a fundamental role. Time-series data is a set of data where the time interval between observations is fixed and constant (e.g., charging orders at a charging station in a day or an hour) [42]. A substantial number of studies take time-series data of the predictor variables as input features [17,25,36,43]. Moreover, Li et al. [44] use time-series data to predict new energy vehicle sales and charging infrastructure ownership, and Qiu et al. [24] present an ensemble deep learning method to forecast electricity load demand based on time-series data.
However, since past time-series transaction data are not available for new charging stations, we draw on the demand prediction literature that does not rely on time-series data. Song and Hu [18] predict the number of charging events of a charging station per week using spatial, weather, and traffic characteristics as inputs (R2 = 0.63). Similarly, Kabra et al. [45] and He et al. [46] also use the number of points-of-interest (POIs) as an indicator to assess the demand for bike-share stations (R2 = 0.70/0.67). Although the R-squares of the models are less than ideal when time-series data is absent, this literature provides theoretical guidance for our work. Moreover, some literature employs POIs to assist in forecasting charging demand. Wang et al. [47] grouped regions based on POI data for forecasting electric vehicle charging demand. Similarly, Tang et al. [48] employed POI data to conduct precise classification of urban functional zones in order to determine road network distribution when forecasting electric vehicle charging demand. Kchaou-Boujelben [49] provides an overview of the charging station location problem, indicating that charging demand will be affected by different types of POIs. Specifically, their research indicates that demand for charging stations is not only influenced by historical demand forecasts but also by local charging demand on the day itself. This can be indirectly measured by analyzing demand at nearby charging stations. New charging stations tend to perform better when there is an oversupply of charging demand in an area, and similarly, there is no need to add new stations if the nearby stations are consistently empty.
We contribute to this literature by employing the daily average transactions of existing stations in the neighborhood as an input variable to substitute for the missing time-series data. Meanwhile, we have verified that the new variables outperform traditional predictions based solely on POIs. Whilst POIs can reflect local demand density to some extent, they are static and cannot fluctuate in response to external factors such as time or temperature (weather). In the context of electric vehicle charging, transactions at nearby charging stations provide a more real-time reflection of local drivers’ charging demand, demonstrating superior predictive capability.
3. Data Sources
We cooperate with a leading EV charging station operator company in China. As of May 2023, this company has over 380 thousand public charging piles nationwide. Its charging operation expanded to more than 200 cities in 2025. The market share of this company is 19%, which is the second largest in China. For the EV charging station operator company, the market share of top and third platform is 20% and 16%, respectively. We collected transaction data from Nanjing, the capital of Jiangsu Province in eastern China, which includes 294 charging stations operated by the company.
The time period of our data is from 1 November 2023 to 30 June 2024 (242 days in total). We remove the poorly performing charging stations, which refer to stations with no charging orders for 220 days or more. Our final data includes 274 charging stations and their transactions during this period. Besides the transaction data, we also collect the characteristics of each charging station, such as the number of charging piles (separated by fast- and slow-charging), charging power, and price (See Table 1 for detail). In addition, we collect weather data from a public weather database to increase the prediction accuracy since weather and temperature may significantly affect user charging behaviors [18].

Table 1.
Variables and descriptions.
Our research visualizes the distribution of charging stations (see Figure 1a) and the distribution of charging orders (see Figure 1b) on a map of Nanjing. The coordinate reference system used throughout the study has been explicitly stated as the World Geodetic System. Horizontal and vertical coordinates indicate longitude and latitude, respectively, and the grey lines show the city boundaries and the boundaries of the districts within the city. We aggregate charging stations and charging orders in hexagonal grids [50], where the grid color shade indicates the density of quantity. Darker grids indicate that there are more charging stations or charging orders in the hexagonal region. As shown, most of the charging stations are located in the downtown districts and central areas of the suburban districts, and the distribution of charging transaction volumes follows the same pattern. However, there are also grids where the number of charging stations is small but the volume of charging orders is relatively high (e.g., grids in the northern center), which, to some extent, indicates that the location selection of new charging stations needs careful investigation, rather than merely following the population or POI distribution.
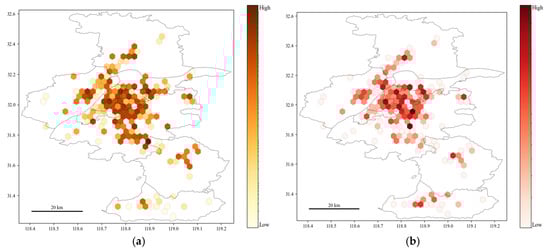
Figure 1.
Charging station and transaction distribution: (a) a heat map for charging stations; (b) a heat map for charging transactions.
The descriptive analysis of our data is shown in Table 2. To demonstrate the usage pattern of charging stations more clearly, we calculate the average number of orders per day for a charging station (see Figure 2). As presented, the transaction volumes of the major charging stations (more than 70%) are between 1 and 50, and nearly 10% of charging stations fulfill more than 50 charging orders per day. There is also 18.6% of charging stations with less than one charging order each day, which could be attributed to the low demand for charging in the neighborhood, consumer preferences, parking space grabbing, etc.
Table 2.
Descriptive statistics.
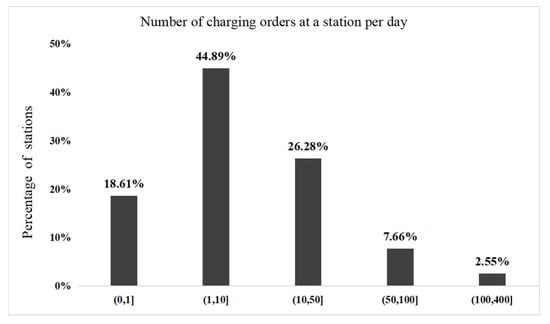
Figure 2.
The usage pattern of charging stations.
4. Methodology
Table 3 summarizes the terminology used in this paper.
Table 3.
Terminology.
4.1. Problem Statement
This paper aims to predict the EV charging demand for new charging stations, which refers to the daily transactions or charging orders at a charging station. We begin by describing the general solution to charging demand prediction and next introduce our innovation. The EV charging demand prediction is formulated as a mathematical problem below:
Given the historical data on EV charging demand at the station level, researchers aim to develop deep learning models to predict charging demand for the future (e.g., in the next hours or days). Thus, for each station, the charging transactions can be converted into time-series data (x1, x2, …, xt), t = (1, 2, …, n), where n is the number of points/records indexed in time order, which refers to days in our context. xt is the transactions of a charging station on day t. Given a sequence of EV charging transactions over the m past time intervals, i.e., (xt−m+1, …, xt−1, xt), a deep learning model is used to predict the transactions at each charging station for future p time intervals (xt+p). Therefore, the traditional EV charging demand prediction problem can be formulated by Figure 3a.
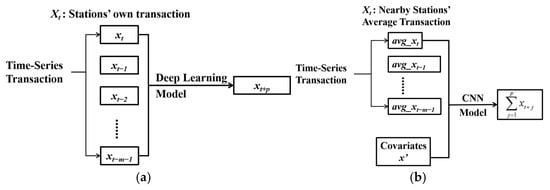
Figure 3.
Time-series prediction model: (a) existing stations’ demand prediction model; (b) new stations’ demand prediction model.
In our context, this paper aims to predict demand for future new charging stations that do not form any historical transaction data. Therefore, we introduce a new time-series variable: the average daily transaction of all charging stations within 3 km of the new station (avg_xt) and add many new input features as covariates, such as characteristics of charging stations, holidays, and temperature (see Table 1). In the CNN model construction, we treat each charging station as a new charging station and use the new time-series variable and other covariates as inputs to predict the sum of its future transactions over the next p days. The demand prediction problem for new EV charging stations can be formulated by Figure 3b.
4.2. EV Charging Demand Prediction Model: Convolutional Neural Network (CNN)
4.2.1. The CNN-Based EV Charging Demand Prediction Model
Recent studies have shown that deep learning methods, which automatically extract data features and learn non-linear relationships in the data, can make more accurate predictions than the conventional regression models [25,51,52]. First proposed in 1989 [53] and developed by Krizhevsky et al. [54], CNN has been widely adopted across various fields due to its suitability for data structures in different dimensions. In terms of demand prediction, the CNN model has been widely used in both transport and electricity sectors, such as charging power demand [35,55,56] and charging transaction demand [2,40].
For the reason that CNN applications vary in different time-series prediction domains and data structure dimensions [2,57], our research develops a one-dimensional CNN (1D-CNN) prediction model to ensure operational preciseness and greater generality based on our data structure. The basic structure of a 1D-CNN is similar to that of a classical CNN, which consists of an input layer, a convolutional layer, an activation function, a pooling layer, and a fully connected layer (see Figure 4).
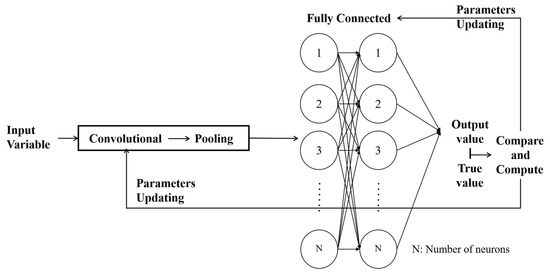
Figure 4.
One-dimensional convolutional neural network.
The input layer receives one-dimensional sequence data as input to the model. The convolutional layer is the core part of the 1D-CNN, which performs convolutional operations on the input sequence using 1D convolutional kernels to extract local features. The activation function transforms the output of the convolutional layer nonlinearly to enhance the expressive power of the model. Usually positioned after the convolutional layer, the pooling layer downsamples the output of the convolutional layer to reduce dimensionality and suppress redundant information. This operation concurrently decreases computational complexity while enhancing model robustness and generalization capability. Lastly, the fully connected layer is used for global analysis and decision-making on the features extracted from the convolutional and pooling layers. It maps local features to global categories or labels to achieve tasks such as classification or regression.
A presentation of all the input variables in our CNN model is shown in Table 1. The 1D-CNN model was configured with the following specifications: the architecture comprised three convolutional layers with kernel sizes of 3, 3, and 2, and 64, 128, and 256 filters, respectively. Each was followed by a ReLU activation function and a max-pooling operation with sizes of 2, 2, and 1. The model was trained for a maximum of 2000 epochs with a batch size of 32, using the Adam optimizer and Mean Squared Error (MSE) loss. An initial learning rate of 0.001 was employed, with a ReduceLROnPlateau scheduler to adjust it during training. Regularization was achieved via a dropout rate of 0.3 and L2 weight decay (1 × 10⁻⁴), complemented by early stopping with a patience of 100 epochs. While conventional time-series CNNs use a sliding window of historical values (m > 1) as input, our approach set m = 1 because the input already incorporates 7-day historical information (Avg_transactioni,t). This design allows the model to make predictions for the sum of future transactions (p = 1) using a comprehensive feature set representing both current conditions and recent historical context. All input features were standardized using a StandardScaler.
4.2.2. Model Evaluation Metrics
We employ 5 typical evaluation metrics, namely Mean Absolute Error (MAE), Root Mean Square Error (RMSE), Coefficient of Determination (R2), symmetric Mean Absolute Percentage Error (sMAPE), and Poisson Deviance, to evaluate model performance by comparing the difference between the predicted and observed charging demand (denoted as and , respectively) from different perspectives. MAE calculated by Equation (1) can quantify the error between the predicted and observed EV charging demand. Similarly to MAE, RMSE calculated by Equation (2) is a measure of error between predicted and true values. However, the RMSE is particularly sensitive to large errors and therefore reflects model performance in the presence of large deviations. A larger RMSE indicates a worse performance of the model. The coefficient of determination R2 is the square of the correlation coefficient R, which indicates the degree of explanation of the dependent variable y by the independent variable x. The introduction of R2 allows us to determine the degree of fit of the predicted value to the true value in a more direct way. The value of R2 calculated by Equation (3) lies between 0 and 1. A larger R2 indicates a better performance of the model. sMAPE calculated by Equation (4) quantifies the average magnitude of prediction errors in relative terms, providing an intuitive measure of forecast accuracy as a percentage deviation from actual values. A lower sMAPE indicates a better performance of the model. Poisson Deviance calculated by Equation (5) measures how well the model’s predictions match the Poisson distribution assumption of count data, with lower values indicating better distributional calibration.
4.3. Testing the CNN Model Within Different Scenarios
Our study sets up 3 scenarios to explore the performance of the CNN model, namely, Prediction (Scenario A), Comparison (Scenario B), and Recommendation (Scenario C). In Scenario A, we first employ the new time-series variables and predict the sum of transactions for new charging stations in the next several days (e.g., 3&7 days). We also test the sensitivity of our forecasting results to variations in the candidate set of nearby stations. In Scenario B, we first compare the predictive performance of the model when using POI as the input variable versus when using time-series data as the input variable. Second, we compare the CNN’s predictions with commonly used models such as LSTM and XGBoost to demonstrate the superiority of our approach. Third, we use the trained CNN model to visualize areas with high predicted demand where new charging stations are recommended to be built in Scenario C. Details are elaborated as follows.
In Scenario A, we first use the CNN model to predict the total number of transactions over the next 1, 3, 5, 7, and 10 days () separately using the new time-series variables (avg_xt−m+1 − avg_xt). Second, we conduct a sensitivity analysis by altering the set of nearby stations selected. In our primary analysis, the Avg_transaction was calculated using the average transaction from other charging stations within a 3 km radius of the target station. We then observe how the model’s performance changes when we employ alternative definitions of “nearby stations” and different methods for calculating Avg_transaction. As for the other covariate inputs not mentioned, we employ all of them by default in scenarios A, B, and C.
In Scenario B, we begin by comparing the performance of our method with that of traditional static point-of-interest (POI)-based prediction approaches. Next, we compare our model against competitive baseline models, including LSTM, XGBoost, and Spatio-Temporal Graph Convolutional Network (ST-GCN) and Informer. LSTM is a specialized recurrent neural architecture designed to model temporal dependencies and long-range patterns in sequential data, using gating mechanisms to mitigate the vanishing gradient problem [58]. XGBoost is a highly efficient and scalable gradient boosting framework that excels at capturing complex feature interactions through its ensemble of decision trees, making it particularly effective for tabular data prediction tasks [59]. ST-GCN explicitly models both spatial relationships between charging stations and temporal dynamics through graph convolutions and sequential learning, directly capturing the spatio-temporal dependencies in the station network [60]. Informer is a Transformer-based model specifically designed for long-sequence time-series forecasting, which improves efficiency through probsparse self-attention and self-attention distilling mechanisms while maintaining strong performance on capturing long-range dependencies [61].
In Scenario C, we choose a core area in Nanjing and visualize it in the form of hexagonal grids. We use the trained model to predict the future transactions over the next 7 days, provided that a new station is built in each area, and list the top 20 recommended areas for building new stations. We choose a seven-day total transaction volume because a week represents a complete working cycle, incorporating both working days and weekends. Measuring on a weekly basis provides a more accurate reflection of EV drivers’ charging patterns and the performance of new charging stations.
5. Results
5.1. Scenario A: Prediction
Before prediction, we first divide the 274 charging stations into training and test sets in an 8:2 ratio (220:54). As we aim to simulate predictions for new stations, the test set must not contain any stations from the training set. Second, we also divided the time periods into training (November 2023 to April 2024) and testing (May and June 2024). In summary, we employ data from 220 charging stations covering November 2023 to April 2024 as the training set, and data from 54 charging stations spanning May and June 2024 as the test set. This ensures that neither transactions of “new stations” nor transactions in “new time” are leaked into the training set (see Figure 5).
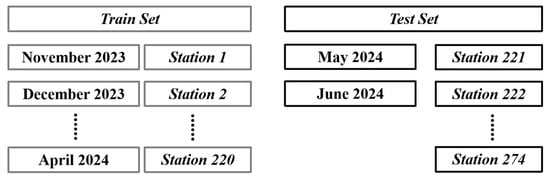
Figure 5.
Training-Test Split.
In prediction, we employ the new time series variable (the average transactions at other charging stations within 3 km from a target location) to predict five types of transactions. First, we predict the next-day transactions for new charging stations to test the feasibility of the new variable and lay the groundwork for the subsequent prediction of new charging stations. As presented in Table 4, the prediction results with R2 of 0.87 validates the new time-series variables as input for the future demand prediction of new charging stations. It is important to note that, given the focus of this forecast on daily transaction, certain charging stations may exhibit negligible or zero transactions. This may result in an oversized sMAPE value.
Table 4.
Prediction results for the transactions in the next several days.
Next, we make longer-term predictions using the same new time-series variables. Specifically, we predict the total number of transactions for new charging stations over the next 3, 5, 7, and 10 days (). The average R2 for the prediction is 0.90, and results are also shown in Table 4. Their stronger performance than next-day prediction indicates that our CNN model is more adaptable for a longer-term prediction. It may be because the sum of transactions in the next few days is more stable than the transactions of a single day. Note that the MAE and RMSE increase with the number of days, which can be explained by the larger number of transactions. Even if the predicted and true values increase proportionally, this still leads to larger MAE and RMSE.
We set the calculation radius for the variable Avg_transaction to 3 km as we consider this to be an acceptable range for EV drivers when charging. If the target charging station is unavailable, drivers can locate an alternative nearby. To validate the appropriateness of 3 km, we conduct additional sensitivity analysis. For the total transaction volume of new charging stations over the next 3 and 5 days, we test the prediction performance using 1 km, 3 km, and 5 km as the calculation radius for Avg_transaction. We also test the performance using the 3 and 5 nearest charging stations as the calculation radius. The results of the sensitivity analysis are shown in Table 5.
Table 5.
Sensitivity analysis: prediction results under different sets of stations nearby.
Overall, our model demonstrates robust predictive performance across different sets of nearby stations. However, a 3 km radius proves to be a more optimal choice compared to others, which is likely attributable to the uneven distribution of charging stations within the urban area. Generally speaking, charging stations are more densely concentrated in central urban areas while becoming sparser in suburban regions. This leads to the 1 km and 5 km radii exhibiting poor adaptability in extreme scenarios–a 5 km radius proves excessively large in city centers, whereas a 1 km radius becomes too small in suburban areas. Simultaneously, the k-nearest neighbor parameter setting presents certain inconsistencies. Without controlling the distance range, it may incorporate distant charging stations, introducing noise during model training. Within the cities we tested, 3 km represents a relatively suitable choice, ensuring an adequate number of nearby charging stations while excluding those at excessive distances.
5.2. Scenario B: Comparison and Validation
Several studies have established the relationship between variables such as population density and points-of-interest (POIs) and transport demand, utilizing these as input variables to forecast travel demand [46,49]. For comparison, we employ POI data provided by AutoNavi Map (also known as Amap)—one of the most widely used digital map and navigation platforms in China, which provides rich and up-to-date POI information that has been extensively adopted in mobility and demand prediction studies [62,63]. To systematically evaluate the impact of POI, we test three distinct scenarios: (1) POI only, (2) POI + Avg_transaction, and (3) Avg_transaction only. Table 6 demonstrates that our predictions using Avg_transaction only outperform the other two approaches. This is probably because POI merely simulates charging demand without exhibiting a strong correlation with actual demand in the context of EV charging. The transaction at nearby charging stations bears a more direct relationship with demand at the target station, thereby enabling more accurate forecasting of charging requirements. Furthermore, the joint use of POI and Avg_transaction may also exist in a potential correlation, introducing unnecessary noise to the model.
Table 6.
Comparison of prediction results for POI and Avg_transaction.
Second, we compare the CNN results of with those of XGBoost, LSTM, ST-GCN, and Informer under the four prediction metrics (), and the results in Table 7 show that the CNN model significantly outperforms the four baseline models in predicting the future demand for new charging stations. As shown in Table 7, our CNN model outperforms all benchmark models by effectively capturing local spatial patterns with high computational efficiency. The suboptimal performance of the other models can be attributed to their respective limitations: “XGBoost’’s reliance on manual feature engineering, “LSTM’’s high parametric complexity, ST-GCN’s unnecessary graph constraints for non-graph data, and Informer’s limited ability to capture localized fine-grained dependencies.
Table 7.
Comparison of prediction results (R2) for XGBoost, LSTM, ST-GCN, Informer, and CNN.
5.3. Scenario C: Recommendation
In scenario C, we present our predictions for more practical applications for the company. We first visualize the distribution of charging stations in downtown Nanjing (see Figure 6a). The geographical area that we choose is a square area in the center of the city, and the number of charging stations is recorded as of 30 June 2024. To better demonstrate the recommendations, it is more effective to recommend regions rather than specific locations for EV charging operation companies [13,64,65]. Therefore, we divide the map into hexagonal grids with a radius of 2 km and paint them red, with the shade indicating the number of stations in the grids [50]. As shown in the figures, the charging stations are mainly distributed in the center. We also mark some important POIs, such as Railway Station and South Railway Station, and code each grid to facilitate our subsequent retrieval for certain grids (see Figure 6b).
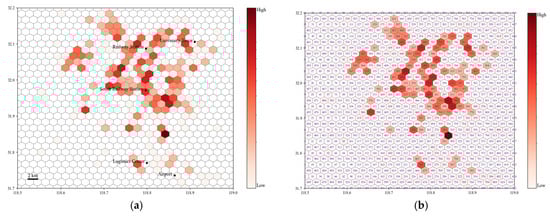
Figure 6.
Charging station distribution in the downtown area: (a) station distribution with hexagonal grids; (b) station distribution with coded hexagonal grids.
In detail, we simulate the opening of new charging stations and predict their total transactions over the next seven days (1–7 July 2024), at 0.1 intervals of both latitude and longitude, as shown in Figure 7. Since the region is divided into a hexagonal grid, the predicted transactions of the new stations in a certain grid are presented as the mean value of all simulated new stations contained in the same grid.
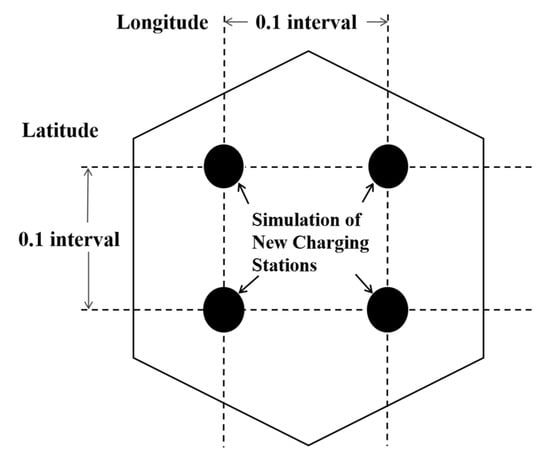
Figure 7.
Simulation of adding a new charging station.
It is important to note that besides the new time-series variables (avg_xt), the input variables for the predictive model should also be included and assigned to some value, such as the number of charging piles and charging price (see Table 1). For the variables Pricei,t, Slow_kwi, Fast_kwi, Slow_cnti, and Fast_cnti of each simulated new charging station, we make them equal to the mean value of the same characteristics of other existing stations within 3 km from the new charging station. We set vipi and pnpi to 1 because we suppose new charging stations will support more advanced features.
To begin with, we show the grids with the top 20 predicted seven-day transactions and label their numeric grid codes in Figure 8a. First, most of the labeled areas are connected to each other, such as the grids 780-750-765-339 and 605-167-589, which suggests that there are excessive charging demands in these grids, and the predicted transactions for new stations will be high. Second, some recommended grids appear alone, such as number 171. A possible explanation is that although the number of existing charging stations in these areas is small, they still generate a large number of daily transactions, leading to substantial predicted charging demands in new stations. These areas may be strategically advantageous for new charging stations due to lower market competition. Details about transaction predictions are placed in Appendix B.
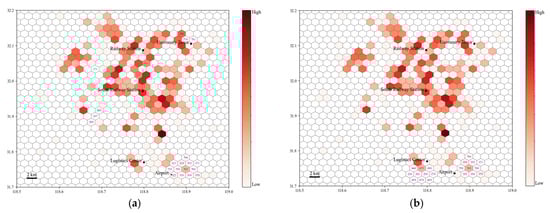
Figure 8.
Top 20 grids with the largest predicted transactions: (a) top 20 grids with the largest transactions; (b) top 20 grids with the largest Transaction_Pile.
Moreover, a practical concern in predicting the total number of transactions is that a charging station’s daily transactions are limited by its own characteristics, such as the number of charging piles. A charging station with fewer charging piles will not generate huge transactions even if it is located in an area with high charging demand. Therefore, our study calculates an additional metric, Average Pile Transactions (Total Transactions/Number of Charging Piles), at a certain charging station to better reflect the relationship between charging demand and charging stations in the region. We show the top 20 predicted best performers in Figure 8b. As presented in Figure 8b, a new area containing multiple grids near the logistics center appears on the top list. These grids are good candidates for new charging stations because although the existing charging stations around this area may have a low capacity, they still have high charging demand. Details about transactions/piles prediction are placed in Appendix B.
In summary, we exploit two indicators to recommend potential regions above because selecting the optimal location for a new charging station necessitates a multifaceted approach. It should also be emphasized that our model not only provides accurate predictions, but it also allows for great flexibility because many of the parameters in the model are adjustable. Therefore, our approach is highly practical for EV charging operation companies in location selection for new charging stations.
5.4. Recommendation Accuracy in Scenario C
In Scenario C, we select an area in downtown Nanjing and employ the trained CNN model to recommend the hexagonal grids where the predicted demand for new charging stations is high. In this section, we make a validation of our recommendation results. During the time period of our data, 37 new charging stations were actually established and opened in the focal city. We predict the sum of charging demand for these new charging stations within seven days from their opening day and compare it with their actual performance. Of the top 10 charging stations with the highest predicted demand, 7 stations are also in the top 10 for actual performance (Accuracy rate: 70%). Of the top 20 charging stations with the highest predicted demand, 14 charging stations also rank among the top 20 for actual performance (Accuracy rate: 70%). We also computed the Normalized Discounted Cumulative Gain (NDCG) metric between our predicted ranking of charging station performance and the actual performance ranking. The NDCG index is a widely used measure in information retrieval that evaluates ranking quality by considering both the relevance of items and their positions in the list, with higher weights assigned to top-ranking positions.
Secondly, for predicting the performance of recommended new charging stations, we establish a demand density-based prediction as our baseline model. The demand density model assumes that new stations built in regions with high existing transactions will achieve high performance rankings. We also conduct straightforward ablation studies (without weather; without price; without avg_transaction) during validation. All results are presented in Table 8. Table 8 demonstrates that our model’s predictions outperform those of the simple demand density-based approach, while the ablation studies confirm the value of our selected features. We also performed t-tests comparing the predictions of our CNN model against those of other methods, with all statistical significance at p < 0.01 further validating our findings.
Table 8.
Comparison of recommendation accuracy between CNN models and baseline models.
Some systematic disturbances cannot be avoided in the performance of actual new stations. For example, several of the model’s recommended top 10 charging stations have a limited number of charging piles. Also, even if the average daily charging demand for charging stations nearby is very high, the limited availability of these stations may be due to the common phenomenon of parking space grabbing [45,46].
6. Conclusions and Discussion
In this study, we develop a novel deep learning approach to solve the demand prediction problem for new charging stations. For a new charging station without past transactions, we introduce the average transactions of its nearby stations as new time-series variables to train the CNN model for demand prediction. First, we employ the new time-series variables to predict the charging demand for new charging stations over the next few days (average R2 of 0.90). Second, we compare our CNN prediction results with two baseline models, i.e., LSTM and XGBoost models, and validate the superior performance of our model against the baselines (XGBoost: average R2 = 0.75, LSTM: average R2 = 0.82, ST-GCN: average R2 = 0.85, Informer: average R2 = 0.86). Finally, we visualize the CNN model’s prediction results, provided a new charging station is established, and show the best-performing areas according to the predicted demands. We also validate our trained model using actual new charging stations, and the accuracy rates achieve 70% (in the top 10) and 70% (in the top 20). The findings of this study provide important theoretical contributions for the demand prediction literature and practical implications for EV charging operation companies.
6.1. Theoretical and Practical Implications
This study contributes to the literature on demand prediction for charging stations. The extant literature focuses on demand forecasting for existing charging stations, while demand for new charging stations has received less attention. In this paper, we propose a method to predict the demand for new charging stations by using the past average transactions of nearby stations as a new variable. The favorable prediction for future transactions at new charging stations fills a gap in the current literature regarding demand prediction for EV charging stations. Moreover, our findings extend the application scope of CNN models in electricity demand forecasting. CNNs can not only predict load/demand for existing charging stations but can also be useful in forecasting for new charging stations. Finally, we have demonstrated the efficiency and robustness of time-series data. For demand forecasting, time-series data proves more effective than traditional static POIs in predicting future demand at charging stations, a finding that holds true even for newly established charging points.
In practice, EV operation companies are suffering from siting new charging stations due to high construction costs and high uncertainty of returns. Our study provides important implications for these companies. First, we use a CNN model to effectively predict the daily transaction volume of new charging stations after introducing the new variables. These predicted transaction volumes can play a critical role in the construction of a new charging station, since high demand not only indicates undersupply in the vicinity, but also potential revenue to the company. Second, we have added several new indicators, such as price and charging power, to the demand forecast, which are important influencers of the demand for charging stations. Note that these indicators are highly flexible. In practice, engineers and designers can adjust these metrics based on the on-site situation of a new charging station and predict the demand accordingly. Finally, we also show the areas of high predicted demand in the form of hexagonal grids with a radius of 2 km, which provides an optional range for the site visits of new charging stations.
6.2. Limitations and Future Research
This study also has some limitations, which may provide implications for future research.
First, our study focuses only on the impact of short-term demand for new charging stations. Due to data limitations, we have not addressed the longer-term benefits of new charging stations after they are established, which may provide a more valuable reference for companies. Long-term demand forecasting may become a valuable research topic as time extends and the number of charging stations increases. For medium- and long-term prediction, the utilization of transactions aggregated at monthly or quarterly intervals as model inputs demonstrates greater appropriateness compared to daily data. Stated differently, employing transaction records from the preceding seven days to predict long-term volumes for subsequent months (or quarters), or even for a full year, lacks logical coherence and is difficult to realize in practice.
Second, our research was confined to a single city, which imposes limitations on the model’s generalizability. Although the selected city Nanjing possesses robust economic strength and high demand for electric vehicles, making it a representative case for studying EV charging stations, significant heterogeneity exists between cities in terms of factors such as traffic patterns and cultural aspects (including drivers’ charging habits). This heterogeneity may impact the model’s ability to generalize. Data constraints hinder our ability to validate the model across diverse urban contexts. Future research, particularly leveraging iterative advancements in generative artificial intelligence (such as large language models), could facilitate the development of city-specific (or province-specific) predictive models. This would significantly enhance the precision of new charging station deployment and the matching of charging demand.
Third, our study does not consider the impact of adding a new charging station on the demand for incumbent stations and the impact of dynamic charging prices (or other parameters). In the prediction, the key predictive variable (avg_transaction) does not account for the competitive impact that the new station itself would introduce upon its opening. This new station would become an active participant in the local market, potentially cannibalizing demand from existing ones, and this feedback loop is not captured in our current forecasting approach, which could indeed lead to estimation inaccuracies, particularly in saturated areas. Moreover, our recommendations for new charging station locations employ relatively optimistic parameters (such as setting both Vipi and Pnpi to 1, maintaining unchanged pricing, and using average values for charging point counts). User charging behavior varies across different times and locations. The construction of new charging stations requires combining engineers’ physical site assessments with advance evaluations of each station’s parameters, thereby maximizing the utility of our model.
Fourth, our CNN model tends to predict areas with relatively high demand when recommending new charging station locations. The rationale underlying this assertion is that while deep learning is capable of accommodating non-linear relationships, the fundamental logic of the proposed model is that the construction of new charging stations in high-demand areas will result in a significant increase in charging orders. This assertion is founded on logical reasoning, positing that the construction of an additional charging station in a region characterized by minimal daily transaction volumes is improbable to engender an escalation in EV drivers’ charging demands. However, our model still possesses the capability to identify areas with nascent demand. It can gradually approximate or anticipate potential trends during the construction of charging station networks. For instance, in areas where there is an absence of charging stations but charging demand is increasing, EV drivers will utilize nearby charging stations. This will serve to heighten demand at these stations, while concomitantly enabling our model to identify the emerging area.
Author Contributions
Conceptualization, J.Z. (Junyi Zheng) and P.S.; Data curation, J.Z. (Junyi Zheng) and S.Z.; Formal analysis, J.Z. (Jiawen Zhang); Funding acquisition, J.Z. (Junyi Zheng) and P.S.; Investigation, S.Z.; Methodology, J.Z. (Jiawen Zhang) and R.J.; Project administration, J.Z. (Junyi Zheng) and P.S.; Resources, J.Z. (Junyi Zheng) and S.Z.; Software, J.Z. (Jiawen Zhang); Supervision, J.Z. (Junyi Zheng) and P.S.; Validation, J.Z. (Jiawen Zhang), R.J. and S.Z.; Visualization, J.Z. (Jiawen Zhang); Writing—original draft, J.Z. (Jiawen Zhang) and R.J.; Writing—review and editing, R.J. and P.S. All authors have read and agreed to the published version of the manuscript.
Funding
This research was supported by the National Natural Science Foundation of China [Grants 72372067].
Data Availability Statement
The original contributions presented in the study are included in the article. Further inquiries can be directed to the corresponding author.
Conflicts of Interest
Authors Junyi Zheng and Sheng Zhao were employed by the company Wanbang Digital Energy Co., Ltd. The remaining authors declare that the research was conducted in the absence of any commercial or financial relationships that could be construed as a potential conflict of interest.
Appendix A
Table A1.
Literature review on charging demand forecasting for charging stations.
Table A1.
Literature review on charging demand forecasting for charging stations.
| Study | Research Objective | Research Subject | Research Method |
|---|---|---|---|
| Liu et al. [17] | EV charging schedule | Existing stations | A data-based intelligent charging scheduling method. |
| Sone et al. [39] | EV charging scheduling algorithms | Existing stations | Online EV scheduling algorithms to minimize peak charging demands. |
| Su et al. [36] | Operating status at EV charging stations | Existing stations | An operating status prediction based on deep learning. |
| Wang et al. [25] | Charging demand prediction | Existing stations | An LSTM neural network to predict the EV charging demand for the next few hours. |
| Wang et al. [40] | EV charging behavior and load | Existing stations | Charging load prediction method based on actual order data. |
| Yin and Ji [20] Yin and Ji [3] | EV charging load | Existing stations | Two different neural network models to predict charging load. |
| Li and Han [41] | EV charging load | Existing stations | An EGAT-LSTM method for EV charging load prediction |
| Xie et al. [19] | EV charging station cluster load | Existing stations | A load prediction framework for EV charging station groups based on multi-graph fusion. |
| Our Work | Charging demand prediction | New stations | Charging demand prediction for new charging stations based on deep learning. |
Appendix B
Appendix B shows the predicted seven-day total transactions in the top 20 areas.
Table A2.
Top 20 grids with the largest prediction (num. of transactions).
Table A2.
Top 20 grids with the largest prediction (num. of transactions).
| Rank | Grid Index | Prediction | Rank | Grid Index | Prediction |
|---|---|---|---|---|---|
| 1 | 370 | 1975 | 11 | 605 | 741 |
| 2 | 780 | 1975 | 12 | 322 | 729 |
| 3 | 355 | 1557 | 13 | 735 | 668 |
| 4 | 339 | 1390 | 14 | 350 | 603 |
| 5 | 354 | 1386 | 15 | 323 | 597 |
| 6 | 750 | 1224 | 16 | 776 | 584 |
| 7 | 371 | 1101 | 17 | 791 | 569 |
| 8 | 765 | 963 | 18 | 171 | 568 |
| 9 | 338 | 951 | 18 | 589 | 563 |
| 10 | 766 | 766 | 20 | 167 | 563 |
Table A3.
Top 20 grids with the largest prediction (Transaction_Pile).
Table A3.
Top 20 grids with the largest prediction (Transaction_Pile).
| Grid Index | Prediction | Rank | Grid Index | Prediction | |
|---|---|---|---|---|---|
| 1 | 659 | 99 | 11 | 339 | 71 |
| 2 | 674 | 99 | 12 | 675 | 70 |
| 3 | 689 | 99 | 13 | 370 | 68 |
| 4 | 274 | 99 | 14 | 780 | 68 |
| 5 | 226 | 95 | 15 | 750 | 66 |
| 6 | 258 | 94 | 16 | 354 | 65 |
| 7 | 242 | 92 | 17 | 765 | 59 |
| 8 | 690 | 86 | 18 | 338 | 59 |
| 9 | 660 | 80 | 18 | 766 | 58 |
| 10 | 355 | 74 | 20 | 371 | 57 |
References
- Chen, F.; Wang, Y.; Deng, H.; Sun, Q.; Chen, Q.; Xia, M. Probabilistic Prediction of Electric Vehicle Load in Service Area Incorporating Highway Spatiotemporal Traffic Information. Energy 2025, 329, 136683. [Google Scholar] [CrossRef]
- Wang, D.; Gan, J.; Mao, J.; Chen, F.; Yu, L. Forecasting Power Demand in China with a CNN-LSTM Model Including Multimodal Information. Energy 2023, 263, 126012. [Google Scholar] [CrossRef]
- Yin, W.; Ji, J. Prediction of EV Charging Load Based on Federated Learning. Energy 2025, 316, 134559. [Google Scholar] [CrossRef]
- Alaraj, M.; Radi, M.; Alsisi, E.; Majdalawieh, M.; Darwish, M. Machine Learning-Based Electric Vehicle Charging Demand Forecasting: A Systematized Literature Review. Energies 2025, 18, 4779. [Google Scholar] [CrossRef]
- IEA, International Energy Agency Global EV Outlook 2023: Catching Up with Climate Ambitions; Global EV Outlook; OECD: Paris, France, 2023; ISBN 978-92-64-85692-9.
- Mohammed, A.; Saif, O.; Abo-Adma, M.; Fahmy, A.; Elazab, R. Strategies and Sustainability in Fast Charging Station Deployment for Electric Vehicles. Sci. Rep. 2024, 14, 283. [Google Scholar] [CrossRef]
- Došljak, V.; Ćorović, V.; Mihailovic, A. A Two-Layer Optimization Model for Electric Vehicle Charging Station Distribution Using a Custom Genetic Algorithm: Application to Montenegro. Energy 2025, 330, 136611. [Google Scholar] [CrossRef]
- Gamage, T.; Tal, G.; Jenn, A.T. The Costs and Challenges of Installing Corridor DC Fast Chargers in California. Case Stud. Transp. Policy 2023, 11, 100969. [Google Scholar] [CrossRef]
- Zhou, G.; Zhu, Z.; Luo, S. Location Optimization of Electric Vehicle Charging Stations: Based on Cost Model and Genetic Algorithm. Energy 2022, 247, 123437. [Google Scholar] [CrossRef]
- Sarda, J.; Patel, N.; Patel, H.; Vaghela, R.; Brahma, B.; Bhoi, A.K.; Barsocchi, P. A Review of the Electric Vehicle Charging Technology, Impact on Grid Integration, Policy Consequences, Challenges and Future Trends. Energy Rep. 2024, 12, 5671–5692. [Google Scholar] [CrossRef]
- Wang, L.; Qin, Z.; Slangen, T.; Bauer, P.; Van Wijk, T. Grid Impact of Electric Vehicle Fast Charging Stations: Trends, Standards, Issues and Mitigation Measures—An Overview. IEEE Open J. Power Electron. 2021, 2, 56–74. [Google Scholar] [CrossRef]
- Diouf, B. Is the Grid Ready for the Electric Vehicle Transition? Energies 2025, 18, 4730. [Google Scholar] [CrossRef]
- Jha, S.; Pani, A.; Puppala, H.; Varghese, V.; Unnikrishnan, A. An Equity-Based Approach for Addressing Inequality in Electric Vehicle Charging Infrastructure: Leaving No One behind in Transport Electrification. Energy Sustain. Dev. 2025, 85, 101643. [Google Scholar] [CrossRef]
- Yi, Z.; Liu, X.C.; Wei, R. Electric Vehicle Demand Estimation and Charging Station Allocation Using Urban Informatics. Transp. Res. Part D Transp. Environ. 2022, 106, 103264. [Google Scholar] [CrossRef]
- Bailey, M.R.; Brown, D.P.; Shaffer, B.; Wolak, F.A. Show Me the Money! A Field Experiment on Electric Vehicle Charge Timing. Am. Econ. J. Econ. Policy 2025, 17, 259–284. [Google Scholar] [CrossRef]
- Zhao, Z.; Lee, C.K.M.; Ren, J. A Two-Level Charging Scheduling Method for Public Electric Vehicle Charging Stations Considering Heterogeneous Demand and Nonlinear Charging Profile. Appl. Energy 2024, 355, 122278. [Google Scholar] [CrossRef]
- Liu, J.; Lin, G.; Rehtanz, C.; Huang, S.; Zhou, Y.; Li, Y. Data-Driven Intelligent EV Charging Operating with Limited Chargers Considering the Charging Demand Forecasting. Int. J. Electr. Power Energy Syst. 2022, 141, 108218. [Google Scholar] [CrossRef]
- Song, Y.; Hu, X. Learning-Based Demand-Supply-Coupled Charging Station Location Problem for Electric Vehicle Demand Management. Transp. Res. Part D Transp. Environ. 2023, 125, 103975. [Google Scholar] [CrossRef]
- Xie, T.; Yun, X.; Zhang, G.; Li, H.; Zhang, K.; Wang, R. Charging Station Cluster Load Prediction: Spatiotemporal Multi-Graph Fusion Technology. Renew. Sustain. Energy Rev. 2024, 206, 114855. [Google Scholar] [CrossRef]
- Yin, W.; Ji, J. Research on EV Charging Load Forecasting and Orderly Charging Scheduling Based on Model Fusion. Energy 2024, 290, 130126. [Google Scholar] [CrossRef]
- Aduama, P.; Zhang, Z.; Al-Sumaiti, A.S. Multi-Feature Data Fusion-Based Load Forecasting of Electric Vehicle Charging Stations Using a Deep Learning Model. Energies 2023, 16, 1309. [Google Scholar] [CrossRef]
- Chatterjee, S.; Hazra, D.; Byun, Y.-C. GAN-Based Synthetic Time-Series Data Generation for Improving Prediction of Demand for Electric Vehicles. Expert Syst. Appl. 2025, 264, 125838. [Google Scholar] [CrossRef]
- Orzechowski, A.; Lugosch, L.; Shu, H.; Yang, R.; Li, W.; Meyer, B.H. A Data-Driven Framework for Medium-Term Electric Vehicle Charging Demand Forecasting. Energy AI 2023, 14, 100267. [Google Scholar] [CrossRef]
- Qiu, X.; Ren, Y.; Suganthan, P.N.; Amaratunga, G.A.J. Empirical Mode Decomposition Based Ensemble Deep Learning for Load Demand Time Series Forecasting. Appl. Soft Comput. 2017, 54, 246–255. [Google Scholar] [CrossRef]
- Wang, S.; Zhuge, C.; Shao, C.; Wang, P.; Yang, X.; Wang, S. Short-Term Electric Vehicle Charging Demand Prediction: A Deep Learning Approach. Appl. Energy 2023, 340, 121032. [Google Scholar] [CrossRef]
- Yang, C.; Zhou, H.; Chen, X.; Huang, J. Demand Time Series Prediction of Stacked Long Short-Term Memory Electric Vehicle Charging Stations Based on Fused Attention Mechanism. Energies 2024, 17, 2041. [Google Scholar] [CrossRef]
- Lara-Benítez, P.; Carranza-García, M.; Riquelme, J.C. An Experimental Review on Deep Learning Architectures for Time Series Forecasting. Int. J. Neur. Syst. 2021, 31, 2130001. [Google Scholar] [CrossRef]
- Tang, Z.; Ji, T.; Kang, J.; Huang, Y.; Tang, W. Learning Global and Local Features of Power Load Series through Transformer and 2D-CNN: An Image-Based Multi-Step Forecasting Approach Incorporating Phase Space Reconstruction. Appl. Energy 2025, 378, 124786. [Google Scholar] [CrossRef]
- Ullah, K.; Ahsan, M.; Hasanat, S.M.; Haris, M.; Yousaf, H.; Raza, S.F.; Tandon, R.; Abid, S.; Ullah, Z. Short-Term Load Forecasting: A Comprehensive Review and Simulation Study With CNN-LSTM Hybrids Approach. IEEE Access 2024, 12, 111858–111881. [Google Scholar] [CrossRef]
- Ying, C.; Wang, W.; Yu, J.; Li, Q.; Yu, D.; Liu, J. Deep Learning for Renewable Energy Forecasting: A Taxonomy, and Systematic Literature Review. J. Clean. Prod. 2023, 384, 135414. [Google Scholar] [CrossRef]
- Zhu, J.; Yang, Z.; Mourshed, M.; Guo, Y.; Zhou, Y.; Chang, Y.; Wei, Y.; Feng, S. Electric Vehicle Charging Load Forecasting: A Comparative Study of Deep Learning Approaches. Energies 2019, 12, 2692. [Google Scholar] [CrossRef]
- Ahmad, F.; Iqbal, A.; Ashraf, I.; Marzband, M.; Khan, I. Optimal Location of Electric Vehicle Charging Station and Its Impact on Distribution Network: A Review. Energy Rep. 2022, 8, 2314–2333. [Google Scholar] [CrossRef]
- Zhang, Y.; Wang, Y.; Li, F.; Wu, B.; Chiang, Y.-Y.; Zhang, X. Efficient Deployment of Electric Vehicle Charging Infrastructure: Simultaneous Optimization of Charging Station Placement and Charging Pile Assignment. IEEE Trans. Intell. Transport. Syst. 2021, 22, 6654–6659. [Google Scholar] [CrossRef]
- Hu, D.; Yang, D.; Liu, Z.-W. Data Siting and Capacity Optimization of Photovoltaic–Storage–Charging Stations Considering Spatiotemporal Charging Demand. Energies 2025, 18, 3306. [Google Scholar] [CrossRef]
- Kim, J.; Oh, S.; Kim, H.; Choi, W. Tutorial on Time Series Prediction Using 1D-CNN and BiLSTM: A Case Example of Peak Electricity Demand and System Marginal Price Prediction. Eng. Appl. Artif. Intell. 2023, 126, 106817. [Google Scholar] [CrossRef]
- Su, S.; Li, Y.; Chen, Q.; Xia, M.; Yamashita, K.; Jurasz, J. Operating Status Prediction Model at EV Charging Stations With Fusing Spatiotemporal Graph Convolutional Network. IEEE Trans. Transp. Electrific. 2023, 9, 114–129. [Google Scholar] [CrossRef]
- Xiang, B.; Zhou, Z.; Gao, S.; Lei, G.; Tan, Z. A Planning Method for Charging Station Based on Long-Term Charging Load Forecasting of Electric Vehicles. Energies 2024, 17, 6437. [Google Scholar] [CrossRef]
- Miller, T.; Durlik, I.; Kostecka, E.; Łobodzińska, A.; Matuszak, M. The Emerging Role of Artificial Intelligence in Enhancing Energy Efficiency and Reducing GHG Emissions in Transport Systems. Energies 2024, 17, 6271. [Google Scholar] [CrossRef]
- Sone, S.P.; Lehtomäki, J.J.; Khan, Z.; Umebayashi, K.; Kim, K.S. Robust EV Scheduling in Charging Stations Under Uncertain Demands and Deadlines. IEEE Trans. Intell. Transport. Syst. 2024, 25, 21484–21499. [Google Scholar] [CrossRef]
- Wang, S.; Liu, B.; Li, Q.; Han, D.; Zhou, J.; Xiang, Y. EV Charging Behavior Analysis and Load Prediction via Order Data of Charging Stations. Sustainability 2025, 17, 1807. [Google Scholar] [CrossRef]
- Li, X.; Han, Q. An EV Charging Station Load Prediction Method Considering Distribution Network Upgrade. IEEE Trans. Power Syst. 2024, 39, 4360–4371. [Google Scholar] [CrossRef]
- Pampel, F.C.; Ostrom, C.W. Time-Series Analysis: Regression Techniques. Contemp. Sociol. 1980, 9, 109. [Google Scholar] [CrossRef]
- Zhou, D.; Guo, Z.; Xie, Y.; Hu, Y.; Jiang, D.; Feng, Y.; Liu, D. Using Bayesian Deep Learning for Electric Vehicle Charging Station Load Forecasting. Energies 2022, 15, 6195. [Google Scholar] [CrossRef]
- Li, B.; Lv, X.; Chen, J. Demand and Supply Gap Analysis of Chinese New Energy Vehicle Charging Infrastructure: Based on CNN-LSTM Prediction Model. Renew. Energy 2024, 220, 119618. [Google Scholar] [CrossRef]
- Kabra, A.; Belavina, E.; Girotra, K. Bike-Share Systems: Accessibility and Availability. Manag. Sci. 2020, 66, 3803–3824. [Google Scholar] [CrossRef]
- He, P.; Zheng, F.; Belavina, E.; Girotra, K. Customer Preference and Station Network in the London Bike-Share System. Manag. Sci. 2021, 67, 1392–1412. [Google Scholar] [CrossRef]
- Wang, S.; Chen, A.; Wang, P.; Zhuge, C. Predicting Electric Vehicle Charging Demand Using a Heterogeneous Spatio-Temporal Graph Convolutional Network. Transp. Res. Part C Emerg. Technol. 2023, 153, 104205. [Google Scholar] [CrossRef]
- Tang, M.; Guo, X.; Qiu, J.; Li, J.; An, B. Electric Vehicle Charging Load Demand Forecasting in Different Functional Areas of Cities with Weighted Measurement Fusion UKF Algorithm. Energies 2024, 17, 4505. [Google Scholar] [CrossRef]
- Kchaou-Boujelben, M. Charging Station Location Problem: A Comprehensive Review on Models and Solution Approaches. Transp. Res. Part C Emerg. Technol. 2021, 132, 103376. [Google Scholar] [CrossRef]
- Xu, L.; Wei, Y.; Zhu, Y. Customer Voice on Two-Sided Platforms: The Effect of Surge Pricing on Customer Complaints. Manag. Sci. 2024, 71, 6729–6745. [Google Scholar] [CrossRef]
- LeCun, Y.; Bengio, Y.; Hinton, G. Deep Learning. Nature 2015, 521, 436–444. [Google Scholar] [CrossRef] [PubMed]
- Michailidis, P.; Michailidis, I.; Kosmatopoulos, E. Reinforcement Learning for Electric Vehicle Charging Management: Theory and Applications. Energies 2025, 18, 5225. [Google Scholar] [CrossRef]
- LeCun, Y.; Boser, B.; Denker, J.S.; Henderson, D.; Howard, R.E.; Hubbard, W.; Jackel, L.D. Backpropagation Applied to Handwritten Zip Code Recognition. Neural Comput. 1989, 1, 541–551. [Google Scholar] [CrossRef]
- Krizhevsky, A.; Sutskever, I.; Hinton, G.E. ImageNet Classification with Deep Convolutional Neural Networks. Commun. ACM 2017, 60, 84–90. [Google Scholar] [CrossRef]
- Muralitharan, K.; Sakthivel, R.; Vishnuvarthan, R. Neural Network Based Optimization Approach for Energy Demand Prediction in Smart Grid. Neurocomputing 2018, 273, 199–208. [Google Scholar] [CrossRef]
- Tovar Rosas, M.A.; Pérez, M.R.; Martínez Pérez, E.R. Itineraries for Charging and Discharging a BESS Using Energy Predictions Based on a CNN-LSTM Neural Network Model in BCS, Mexico. Renew. Energy 2022, 188, 1141–1165. [Google Scholar] [CrossRef]
- Rick, R.; Berton, L. Energy Forecasting Model Based on CNN-LSTM-AE for Many Time Series with Unequal Lengths. Eng. Appl. Artif. Intell. 2022, 113, 104998. [Google Scholar] [CrossRef]
- Hochreiter, S.; Schmidhuber, J. Long Short-Term Memory. Neural Comput. 1997, 9, 1735–1780. [Google Scholar] [CrossRef]
- Chen, T.; Guestrin, C. XGBoost: A Scalable Tree Boosting System. In Proceedings of the 22nd ACM SIGKDD International Conference on Knowledge Discovery and Data Mining; ACM: San Francisco, CA, USA, 2016; pp. 785–794. [Google Scholar] [CrossRef]
- Yan, S.; Xiong, Y.; Lin, D. Spatial Temporal Graph Convolutional Networks for Skeleton-Based Action Recognition. Proc. AAAI Conf. Artif. Intell. 2018, 32. Available online: https://ojs.aaai.org/index.php/aaai/article/view/12328 (accessed on 5 November 2025). [CrossRef]
- Zhou, H.; Zhang, S.; Peng, J.; Zhang, S.; Li, J.; Xiong, H.; Zhang, W. Informer: Beyond Efficient Transformer for Long Sequence Time-Series Forecasting. arXiv 2021, arXiv:2012.07436. [Google Scholar] [CrossRef]
- Chen, E.; Ye, Z.; Wang, C.; Zhang, W. Discovering the Spatio-Temporal Impacts of Built Environment on Metro Ridership Using Smart Card Data. Cities 2019, 95, 102359. [Google Scholar] [CrossRef]
- Xing, Y.; Wang, K.; Lu, J.J. Exploring Travel Patterns and Trip Purposes of Dockless Bike-Sharing by Analyzing Massive Bike-Sharing Data in Shanghai, China. J. Transp. Geogr. 2020, 87, 102787. [Google Scholar] [CrossRef]
- Sadeghi-Barzani, P.; Rajabi-Ghahnavieh, A.; Kazemi-Karegar, H. Optimal Fast Charging Station Placing and Sizing. Appl. Energy 2014, 125, 289–299. [Google Scholar] [CrossRef]
- Sun, Z.; Gao, W.; Li, B.; Wang, L. Locating Charging Stations for Electric Vehicles. Transp. Policy 2020, 98, 48–54. [Google Scholar] [CrossRef]
Disclaimer/Publisher’s Note: The statements, opinions and data contained in all publications are solely those of the individual author(s) and contributor(s) and not of MDPI and/or the editor(s). MDPI and/or the editor(s) disclaim responsibility for any injury to people or property resulting from any ideas, methods, instructions or products referred to in the content. |
© 2026 by the authors. Licensee MDPI, Basel, Switzerland. This article is an open access article distributed under the terms and conditions of the Creative Commons Attribution (CC BY) license.