Abstract
Large-scale storage solutions play a critical role in the ongoing energy transition, with Underground Hydrogen Storage (UHS) emerging as a possible option. UHS can benefit from existing natural gas storage expertise; however, key differences in hydrogen’s behavior compared to CH4 must be characterized at the pore scale to optimize the design and the management of these systems. This work investigates two-phase (gas–water) flow behavior using microfluidic devices mimicking reservoir rocks’ pore structure. Microfluidic tests provide a systematic side-by-side comparison of H2–water and CH4–water displacement under the same pore-network geometries, wettability, and flow conditions, focusing on the drainage phase. While all experiments fall within the transitional flow regime between capillary and viscous fingering, clear quantitative differences between H2 and CH4 emerge. Indeed, the results show that hydrogen’s lower viscosity enhances capillary fingering and snap-off events, while methane exhibits more stable viscous-dominated behavior. Both gases show rapid breakthrough; however, H2’s flow instability—especially at low capillary numbers (Ca)—leads to spontaneous water imbibition, suggesting stronger capillary forces. Relative permeability endpoints are evaluated when steady state conditions are reached: they show dependence on Ca, not just saturation, aligning with recent scaling laws. Despite H2 showing a different displacement regime, closer to capillary fingering, H2 mobility remains comparable to CH4. These findings highlight differences in flow behavior between H2 and CH4, emphasizing the need for tailored strategies for UHS to manage trapping and optimize recovery.
1. Introduction
The urgent need to reduce carbon emissions and enhance energy security has driven the development of new strategies for energy production and storage. Underground Gas Storage (UGS) has emerged as a possible solution for large-scale energy storage, overcoming capacity and safety issues [1,2,3,4]. In this context, Underground Hydrogen Storage (UHS) has gained attention, providing a sustainable means to store energy generated from renewable sources like wind and solar [5,6]. The concept of underground storage is not new, since it has been investigated and now largely exploited for the storage of natural gas to satisfy the need for a balance between constant supply and fluctuating energy demand. Therefore, most of the past and ongoing UHS projects exploit the experiences gained from underground natural gas storage [7]; however, the differing behaviors of hydrogen and methane still require systematic investigation.
As a result, in recent years, there has been growing research interest in UHS, particularly regarding the assessment of hydrogen dissolution in reservoir water [8], thermodynamic behavior of hydrogen and hydrogen-methane mixtures [9], and hydrogen diffusion through the caprock [10].
Although these studies have provided important insights into hydrogen behavior under storage conditions, underground porous media remain complex multiphase systems, where macro-scale behavior is influenced by micro-scale phenomena, such as pore-scale dynamics, that affect storage capacity, injectivity, and safety [11], making an improved understanding essential for reducing uncertainty at the reservoir scale [12,13].
Microfluidic devices are recognized as a valuable tool for investigating critical pore-scale phenomena that can occur in underground porous media, since they reproduce porous media geometry, allowing for direct visualization of fluid flow at the microscale [11,14,15]. They are especially useful for studying UHS, as they capture rapid and unstable displacement dynamics typical of low-viscosity gases such as hydrogen [16]. This reservoir-relevant use of microfluidics is commonly described through the “Reservoir-on-a-Chip (ROC)” paradigm, first introduced by Gunda et al. [17], where a pore-network representation is embedded in a microfluidic chip to simulate key features of a geological formation and to observe multiphase displacement mechanisms under controlled conditions. Unlike conventional core-flooding experiments, microfluidics provides direct observation of pore-scale phenomena, including capillary fingering and snap-off events that occur at very short timescales and small length scales [18], which are essential for understanding fluid behavior during injection and withdrawal cycles [19,20]. Ongoing research focuses on integrating laboratory microfluidic tests with numerical modelling approaches (computational microfluidics) [21]. Indeed, microfluidic tests provide valuable benchmark data sets, useful for validating numerical simulations and bridging the gap between laboratory observations and predictive simulations [22]. For a complete review of computational microfluidics with application to subsurface porous media, the reader can refer to Soulaine et al. [23].
A microfluidic device typically consists of a patterned substrate layer that hosts the microfluidic circuit bonded to a transparent covering layer, which enables visualization of the fluids inside [11,24]. In Reservoir-on-a-Chip applications, the microfluidic patterned core replicates porous media geometry, with features ranging from a few to hundreds of micrometers. For a comprehensive treatment of micromodel design, material selection, and fabrication methods for multiphase flow studies, the reader can refer to [24].
For all the advantages previously described, microfluidics has been successfully applied to various subsurface investigations, including groundwater remediation [25,26,27,28], dissolution process [29], water–oil separation [30], CO2 storage [31,32], and enhanced oil recovery [33]. Microfluidics has proven to be a valuable tool also for studying microbial activities that can have significant implications for UHS, such as biofilms causing bio-clogging and microbiologically influenced corrosion (MIC) [34,35,36,37,38,39,40,41]. For a more detailed examination of the microbial phenomena influencing UHS, the reader can refer to [42,43], where further insights and in-depth discussions on this topic are provided.
Furthermore, micromodels can be used to replicate drainage and imbibition processes and to study underlying phenomena like viscous fingering, capillary fingering, and snap-off [44,45,46,47,48], or provide insights into the fraction of unrecoverable gas due to capillary trapping. Recently, micromodels found application in the investigation of contact angle hysteresis and capillary trapping under high pressure in hydrogen/brine systems [15,49,50]. A detailed investigation of wettability influences is reported in the work of AlOmier et al. [51], with a particular focus on how mixed wettability in porous media affects fluid displacement dynamics, highlighting the impact of mixed wettability on injection time, spatial invasion patterns, and dynamic pressure profiles in subsurface systems. Microfluidic experiments have also been proposed as a way to better understand and address three major potential hurdles for porous media systems, including induced seismicity, leakage by hydraulic displacement, and chemical conversion resulting from ineffective gas curtains (e.g., N2, CH4) [52].
The current study presents the results of microfluidic flow tests investigating pore-scale phenomena relevant to UGS systems. The micromodels used for the tests are commercial Micronit® (Micronit, Enschede, The Netherlands) glass-glass devices with engraved fluidic paths, created by wet etching, and featuring patterns simulating porous media, namely the Physical Rock Network. These devices are made of borosilicate glass, which is intrinsically water-wet according to the manufacturer’s specifications. The pore network area dimensions are approximately 2 × 1 cm, and the isotropic channels have a 20 μm etch depth.
Using Physical Rock Network devices, two-phase fluid flow tests are performed for water-hydrogen and water-methane systems. The objectives of this work are to observe displacement regimes and pore-scale phenomena that can occur during multiphase flow and to estimate the endpoint relative permeabilities during displacement processes, focusing on the drainage phase. The present work provides a direct, side-by-side comparison between hydrogen and methane under the same experimental conditions in the same pore network, explicitly analyzing how capillary number, mobility ratio, and fluid properties (such as viscosity and compressibility) influence displacement patterns, residual saturations, and relative permeability. While the experimental and analysis methods have been established in previous studies, the novelty of this work lies in performing a controlled comparison of H2 and CH4. To the authors’ knowledge, there are currently no micromodel studies that systematically compare methane and hydrogen flow regimes and relative permeability in a common experimental framework while mapping the results onto a Lenormand-type diagram.
Initially, to validate the setup, a set of tests is performed to evaluate the absolute permeability of the tested device.
The following sections of the article recall the flow test procedures, the methodologies applied to analyze the results and provide a comprehensive description of the tests performed. The experimental results yield significant insights into fluid behavior at the pore scale, providing valuable data for the development of efficient hydrogen and methane storage strategies. Finally, the article discusses the potential, limitations, and future directions of this experimental approach, establishing it as a strong foundation for further research in the field.
2. Materials and Methods
2.1. Microfluidic Flow Test Procedures
The present section briefly recalls the methodologies that guided the design of microfluidic tests, as already detailed in Loffredo et al. [53]. Specifically, three main procedures for testing Micronit® glass-glass devices were identified:
- Multiphase tests to collect pore-scale observations.
- Single-phase tests to determine absolute permeability.
- Multiphase tests to evaluate the endpoint relative permeability and residual saturations.
2.1.1. Multiphase Tests for Preliminary Pore-Scale Observations
This first series of multiphase experiments aimed to qualitatively assess how fluid dynamic viscosity and injection velocity influence flow patterns and pore-scale phenomena.
As a standard procedure, in a multiphase test, the device is fully saturated with a fluid (resident), which is subsequently displaced by a second one (invading), injected at a fixed rate. The test is referred to as drainage, and the non-wetting fluid is injected and displaces the wetting fluid. Conversely, an imbibition test is performed when the wetting fluid displaces the non-wetting one. When the flow patterns stabilize with negligible spatial variation over time, quasi-steady-state conditions are considered achieved. At this point, the final fluid configuration is acquired, and the residual saturation value is assessed. Operationally, a microscope is typically used to observe and characterize the percolation patterns through the porous media. This approach, similar to the previous study of Lysyy et al. [50], also enables capturing pore-scale dynamics (e.g., snap-off) during the injection phase and the following quasi-static conditions.
As in the work of Lysyy et al. [54], to characterize the flow regime and the relative importance of different forces in pore-scale displacement, we introduce the key dimensionless groups that control multiphase flow in porous media. In such dimensionless groups, the velocity refers to Darcy’s velocity calculated as:
where is the flow rate [m3/s], is the effective porosity [-], and the cross-sectional area [m2].
Reynolds number (Re) quantifies the ratio of inertial to viscous forces, and it is defined as:
where is the fluid density [kg/m3], U is the Darcy’s velocity [m/s], μ is the dynamic viscosity of the displacing fluid [Pa s], and a characteristic length (median pore diameter) [m]. In pore-scale displacements, very small Re values indicate that inertial effects are negligible and flow remains in the laminar regime.
Peclet number (Pe) quantifies the rate of convective transport to the rate of diffusive transport, and it is defined as:
where is the molecular diffusion coefficient [m2/s]. ⋯ ≫ 1 indicates that convection dominates over diffusion, consistent with advection-driven displacement in structured pore networks.
Bond Number (Bo) assesses the relative importance of gravitational to capillary force, and it is defined as:
where is the density difference between fluids, the gravitational acceleration, and σ the interfacial tension between the two fluids [N/m]. Very small Bo values indicate negligible gravity effects.
Finally, several studies have identified two key parameters that significantly influence the macroscopic patterns of fluid interfaces in displacement processes [46,55,56]: the Capillary Number (Ca) and the Viscosity Ratio (M). While it is widely recognized that the Ca measures the ratio of viscous forces to capillary forces, challenges remain in establishing a universally accepted definition. For a complete review, the reader can refer to Guo [57]. In our work, since the focus is on pore-scale phenomena, we adopt a microscopic capillary number definition, in particular, that defined in the SPE Enhanced Oil Recovery Textbook [58]:
where is the dynamic viscosity of the wetting phase [Pa s].
When Ca ≈ 1, viscous forces dominate, whereas capillary forces prevail when Ca ≪ 1 [57].
The Viscosity Ratio (M) is defined as [56]:
This parameter is crucial for assessing the stability of the fluid front. Along with , it is employed to identify displacement patterns through the porous media, as first presented by R. Lenormand [54,56], who introduced a phase diagram with M as the vertical axis and Ca as the horizontal axis, as reported in Figure 1.
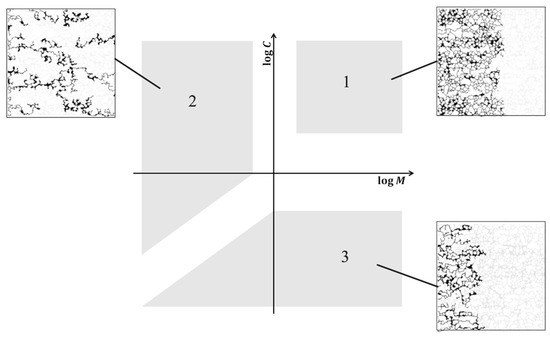
Figure 1.
Example of simulated CFD patterns and their qualitative classification according to Lenormand map.
According to the values of M and Ca, the Lenormand phase diagram determines whether viscous or capillary forces prevail, thereby influencing the nature of fluid displacement. Three primary displacement regimes are identified:
- Stable displacement (1 in Figure 1), characterized by a nearly flat advancing front throughout the medium, leaving behind trapped clusters of only a few pore sizes.
- Viscous fingering (2 in Figure 1) generates tree-like percolation patterns that extend in the direction of the flow without any backward loops.
- Capillary fingering (3 in Figure 1), whose percolation pattern features finger-like structures that can grow in all directions, including backward, leading to the trapping of large clusters.
Modifications in porous geometry can shift regime boundaries. For example, Zhang et al. [46] showed that a more homogeneous porous pattern exhibited wider domains and smaller transition regions compared to Lenormand’s device. Therefore, applying the same Ca across different topological systems can result in variations in displacement mechanisms. Nevertheless, the general structure of the phase diagram remains unchanged and applicable to 2D microfluidic pore devices.
A series of drainage/imbibition tests was designed to identify the corresponding point in the Lenormand phase diagram and observe the resulting displacement patterns to define the boundaries of the phase diagram for our specific system. However, during imbibition, water invaded the pores too rapidly to allow quantitative observations, preventing reliable capture of pore-scale dynamics. For this reason, the present analysis focuses on the drainage (gas injection) process.
Saturation and porosity were estimated using a custom image-processing algorithm, described in Appendix A.
2.1.2. Single-Phase Tests for Absolute Permeability Assessment
The single-phase test procedure for absolute permeability assessment involves a series of fluid injections at constant flow rates, with the recording of pressure drop across the device once steady-state conditions are reached (i.e., pressure drop across the device remains constant over time). The absolute permeability value is then obtained by inverting Darcy’s equation (Equation (7)):
where
- L [m] is the distance between the inlet and outlet ports of the device,
- A [m2] is the cross-sectional area perpendicular to the fluid flow,
- μ [Pa s] is the dynamic viscosity of the injected fluid,
- q [m3/s] is the fixed flow rate,
- [Pa] is the measured pressure drop across the device.
All tests were performed at ambient pressure. The inlet pressure sensor was calibrated against atmospheric pressure (Patm). To avoid recording negative values and ensure an accurate representation of the system’s pressure, a back-pressure regulator (BPR) set to 104 Pa was installed downstream of the micromodel, ensuring:
A detailed description of the experimental setup is available in [53] and similar configurations can be found in [59,60,61].
Referring to the scheme in Figure 2, it is observed that the measured pressure drop () includes contributions from the porous network as well as from the inlet/outlet tubing tubes (I/O tubes) and the inlet/outlet channels (I/O channel). Therefore, to assess the permeability of the porous pattern, it is necessary to estimate the contributions from these additional sections and subtract them from the measured total pressure drop. The hydraulic resistance (Rh) of the tubes and channels was calculated analytically according to the procedure suggested by technical literature [53,61]. The calculated values of Rh for H2, CH4, and water are summarized in Table 1.
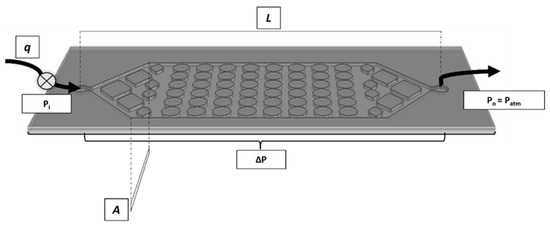
Figure 2.
Scheme of a microfluidic device, with parameters of Darcy’s equation. Black arrows are shown in correspondence of the device inlet and outlet.

Table 1.
Calculated hydraulic resistance I/O tubing and channels for different injected fluids.
2.1.3. Multiphase Tests for Endpoint Relative Permeability Evaluation
In this series of experiments, drainage and imbibition tests were performed. The reader can refer to Loffredo et al. [53] for details. Here, we report the equations used to evaluate the effective permeability (Equation (9)), where all parameters are already defined in Equation (7), except , which represents the viscosity of the invading fluid, and the corresponding relative permeability (Equation (10)):
Our preliminary steady-state experiments captured the gas endpoint, i.e., the relative permeability of the gas when the residual water saturation value is reached.
3. Results
In the following section, the experimental results are presented and discussed in detail. For clarity, this section is structured into two parts:
- (1)
- single-phase microfluidic flow tests aimed at validating the setup and estimating absolute permeability of the pore network, and
- (2)
- multiphase tests, focused on the investigation of pore-scale dynamics and evaluating endpoint relative permeability values.
3.1. Single-Phase Microfluidic Flow Tests
Absolute permeability tests were carried out at ambient pressure and temperature by injecting water through the microfluidic device while keeping the gas line closed. A detailed description of the experimental setup is provided in [53].
The pressure value at the inlet was measured using a calibrated Elvesys® MPS03 (Elveflow, Paris, France) sensor, and the total porosity of the micro-model was determined from a stitched image of the empty device acquired with the microscope.
Exploiting Darcy’s Law (Equation (7)), the absolute permeability of the porous network () can be derived from the obtained from theoretical corrections of pressure measurements.
The permeability values associated with each injection step fall within the range of 4.85 D to 5.67 D, averaging at 5.26 D, with the length of the sample set to 2 cm.
Micronit® Datasheet [62] declares that the absolute permeability values for the Physical Rock device range from 6.62 D to 7.79 D, which are slightly higher compared to those obtained from our tests. This discrepancy is likely due to additional pressure losses within our experimental setup, which were not accounted for during the measurements. Additionally, our approach applies two theoretical corrections to pressure measurements, whereas Micronit® reports absolute permeability values based on experimental procedure [62] that account for the system baseline pressure losses directly. In our workflow, both absolute and effective permeability are computed from pressure measurements, using the same correction procedures to quantify the impact of the inlet and outlet tubing on the pressure drops. A sensitivity analysis for the hydrogen relative permeability endpoints, performed by varying the tubing length across a wide range, showed a negligible impact.
It should be noted that the absolute permeability of the Physical Rock Network micromodel (of the order of 5 Darcy) is significantly higher than that of typical reservoir sandstones, which generally range between and D. This relatively high permeability arises from simplified 2D planar geometry and the need to ensure in-plane connectivity at the micromodel scale. Therefore, the chip is not designed to quantitatively to reproduce a reservoir rock, but rather to serve as an idealized 2D pore network for qualitatively investigating the dependence of water–gas displacement patterns and relative permeability on capillary number and viscosity ratio.
3.2. Multi-Phase Microfluidic Flow Tests
Drainage and imbibition tests for water-hydrogen and water-methane systems were designed by adjusting the flow rates to achieve different and observe the resulting displacement patterns. The tests covered Ca values from 10−6 to 10−4, with particular focus on and , corresponding to flow rates of 100 μL/min and 10 μL/min, respectively. Table 2 lists the main parameters of the experiments.
Table 2.
Dynamic Viscosity, Interfacial Tension, Density, and Molecular Diffusion Coefficient in water-hydrogen and water-methane systems at 20 °C and 1 atm.
The mean pore diameter (), i.e., the characteristic length of Equation (4), was estimated from the micromodel geometry using the A* algorithm described in Salina Borello et al. [66], yielding a value of 171 .
Based on the dimensionless groups reported in Table 3 and Table 4, both H2–water and CH4–water flows fall within the laminar regime. Displacement behavior is controlled by capillary–viscous competition while diffusion and buoyancy play minor roles under our experimental conditions.
Table 3.
Dimensionless Number for water–hydrogen system.
Table 4.
Dimensionless Number for water–methane system.
In all tests, water was the wetting phase. Thus, in drainage tests when gas is the invading fluid, resulting in . Conversely, in imbibition tests, is opposite in sign (Table 5).
Table 5.
Mobility Ratio in water–hydrogen and water–methane systems.
The eight distinct tests correspond to eight points in the Lenormand diagram (Figure 1). All points lie close to the boundary between capillary-dominated and non-capillary regimes. According to Blunt, capillary forces become significant for Ca < 10−5 [67]. This suggests that our drainage experiments fall within the transitional region between capillary fingering and viscous fingering. However, the boundaries shown in Figure 1 are system dependent [56]. As a result, the lines drawn on the graph provide a reasonable approximation but may not accurately apply to all of our micromodels [68].
A preliminary attempt to outline regime boundaries for our micromodel is presented in Figure 3; however, the construction of a complete Lenormand diagram would require experiments spanning a broader range of Ca and M values, which fall outside the scope of this study.
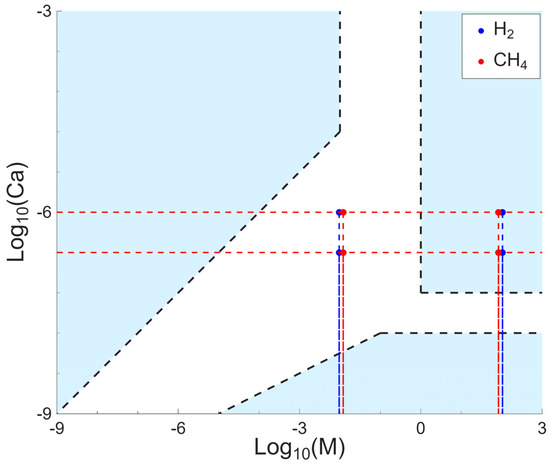
Figure 3.
Lenormand diagram for our experiments, with hypothetical regions and boundaries.
The dynamic viscosity values at ambient conditions (20 °C, 1 bar) used in the calculations are taken from NIST reference data [69]. Such values are consistent with those expected at typical underground gas storage conditions (e.g., 150–200 × 105 Pa, 45 °C): water viscosity remains around 10−4 Pa·s. Similarly, H2 and CH4 viscosities remain in the 10−5 Pa·s range. The interfacial tension of H2–brine and CH4–brine systems is reported to be in the range of 0.06–0.072 N/m [70], consistent with the values measured at ambient conditions (Table 2). Therefore, the explored Ca range (10−4 to 10−6) and the mobility ratios are qualitatively representative of reservoir conditions when appropriate flow rates and fully water-wet conditions are considered. Indeed, it must be noted that in the definition of capillary number here adopted, the wetting-phase viscosity appears in the numerator. In systems with intermediate or mixed wettability, the viscosity appearing in the numerator would change, causing the capillary number and the Lenormand regime boundaries to shift accordingly. Strictly water-wet micromodels compared to heterogeneous, mixed-wettability field conditions are a key limitation of the methodology.
3.2.1. Hydrogen–Water Systems
Figure 4 and Figure 5 illustrate the evolution of the hydrogen front (lighter color) during drainage tests corresponding to equal to 10−4 and 10−5, respectively. The frames were captured at different times during the displacement process. As expected, the hydrogen saturation (Sg) observed at the end of the drainage process increases with the increasing , in agreement with classical pore-scale displacement theories [56].
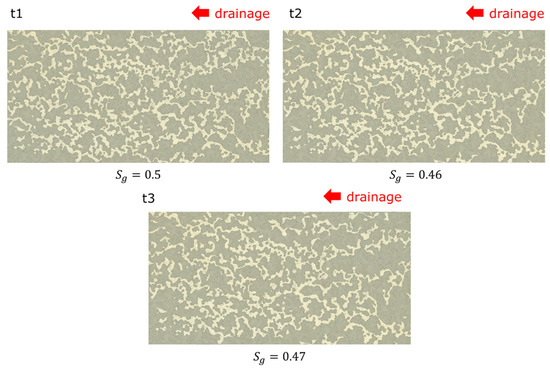
Figure 4.
Evolution of the hydrogen front at different time steps at .
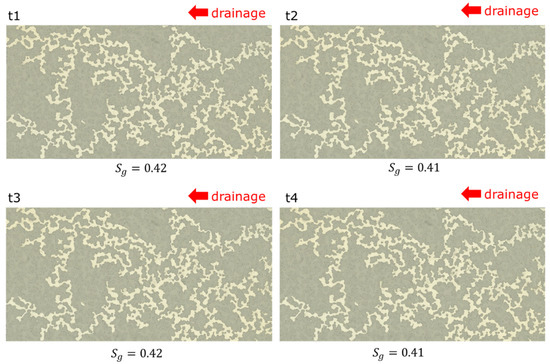
Figure 5.
Evolution of the hydrogen front at different time steps at .
Hydrogen rapidly invaded the pores of the micro model with an almost instantaneous breakthrough time (of the order of milliseconds), with a sequence of Haines Jumps, regardless of the imposed Ca. This behavior confirms hydrogen’s non-wetting character, as also reported in Andrew et al. [71]. Within the invaded pores, hydrogen predominantly occupied the available space, although small water accumulations were observed at the bottom of the pore medium due to the surface irregularities of the device [50]. Red arrows in Figure 6 highlight water droplets observed at the breakthrough (t1) for Ca = 10−4 and Ca = 10−5, respectively. Such droplets were most pronounced at high Ca and were significantly reduced by the end of the test (t2), likely due to the hydrophilic nature of the micromodel surfaces, which promotes water-phase connectivity, and to the water evaporation into the hydrogen phase, especially at low Ca [50]. Refer to Supplementary Materials for a video of the run at Ca = 10−4.
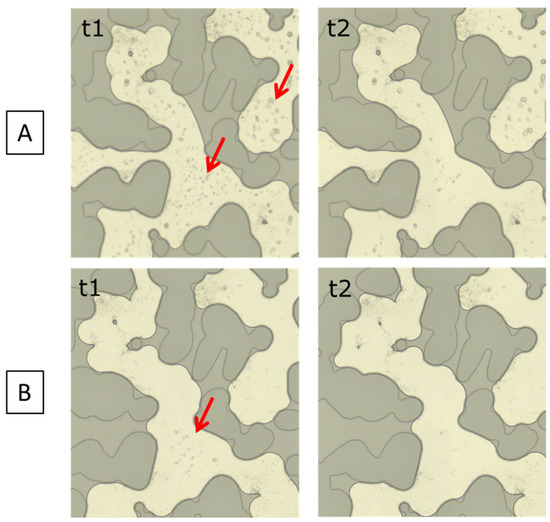
Figure 6.
Water droplets (red arrows) displacement by hydrogen during drainage at (A) and (B). Hydrogen percolation was limited by small pore throats.
At higher magnification, irregularities along the pore walls led to the development of thick wetting layers, as indicated by the red arrows in Figure 7. These layers play a significant role in pore-scale processes [67], potentially acting as swelling arc menisci. However, their precise influence requires further investigation.
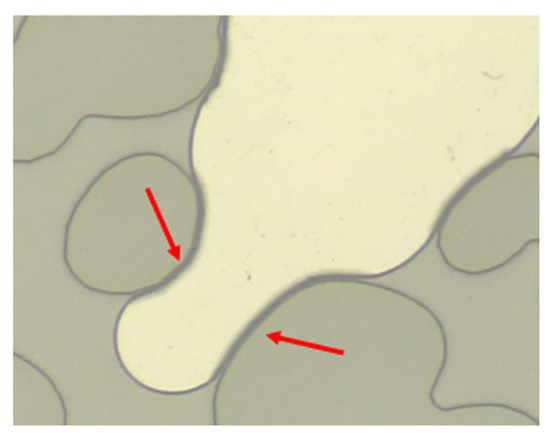
Figure 7.
Wetting layers highlighted by red arrows.
Another important aspect concerns the connectivity of the non-wetting phase, which determines whether the phase forms continuous pathways through the pore network. At low Ca, hydrogen showed high connectivity, with multiple continuous gas pathways observed (Figure 5). Conversely, at high Ca, both connected and disconnected hydrogen regions were observed (Figure 4).
The dominant mechanism occurring during drainage in the disconnected non-wetting phase front was identified as Roof snap-off [72]. This phenomenon occurs when the advancing interface becomes unstable when entering a neighboring pore (t1 in Figure 8). To maintain capillary equilibrium, water accumulates in the pore throat, leading to the disconnection of the non-wetting phase (hydrogen) (t2 in Figure 8).
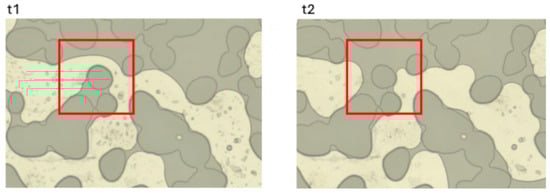
Figure 8.
Example of Roof Snap-Off highlighted in the red boxes: t1 before and t2 after snap-off event.
In the context of seasonal hydrogen storage, snap-off during or after drainage is undesirable, as it can lead to permanent hydrogen entrapment. Although the highest hydrogen saturation (Figure 4) was achieved at a high Ca (10−4), increasing injection rates do not necessarily improve injection efficiency due to the potential snap-off events [73].
Regarding the flow regime, the logCa-logM diagram (Figure 1) would predict unstable viscous-dominated displacement at the analyzed Ca. However, as previously discussed, the regime boundaries are system-dependent [46] and may not fully apply to this micromodel. Localized features of both viscous and capillary flow regimes were observed: the presence of connected hydrogen pathways obstructed only by narrow pore throats at low Ca suggests the influence of capillary fingering; conversely, Roof snap-off triggered when hydrogen attempts to penetrate narrow throats at high Ca indicates a stronger influence of viscous forces [46].
The final configuration reached at the end of the drainage experiment serves as the starting point for the imbibition test. However, at the investigated capillary numbers (e.g., Ca = 10−4 and Ca = 10−5), injecting 5 mL of water resulted in rapid and complete saturation as soon as the water overcomes the pressure drop along the circuit and enters the pore network. This rapid water invasion is driven by both strong capillary forces combined with the higher viscosity of water relative to gas, which generates a large viscous pressure gradient. As a result, pore-scale dynamics during imbibition could not be reliably captured with the current setup.
Figure 9A and Figure 10A show the pressure profiles for hydrogen drainage tests performed at flow rates of 100 μL min−1 and 10 μL min−1. Each test was repeated three times to ensure reproducibility. Figure 9A and Figure 10A show the corresponding maps of once the pressure stabilized under steady-state flow conditions.
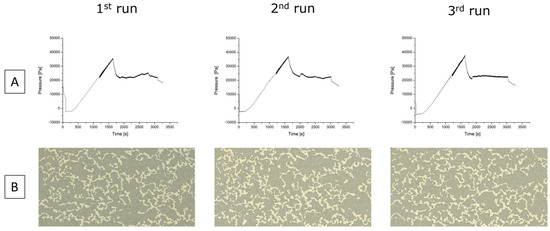
Figure 9.
(A) Pressure measurement for the three runs of drainage tests performed with hydrogen as the non-wetting fluid with q = 100 μL min−1. (B) Maps of the device at the end of each drainage test.
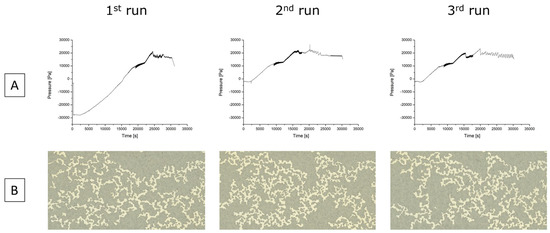
Figure 10.
(A) Pressure measurement for the three runs of drainage tests performed with hydrogen as the non-wetting fluid with q = 10 μL min−1. (B) Maps of the device at the end of each drainage test.
The recorded pressure shows a sharp rise to a maximum value that depends on the injection velocity, then decreases rapidly before transitioning smoothly into a plateau. We interpret the maximum as the threshold pressure that the gas must overcome to break through the porous structure. Once the gas phase establishes preferential pathways, the pressure drops significantly and stabilizes at a constant value, which corresponds to the measured pressure drop across the device.
A transient negative pressure spike was observed at the start of the injection. This can be attributed to the expansion of the gas stored in the upstream tubing, released when the inlet valve opens. The amplitude of these spikes is consistent with this interpretation, as it depends on the residence time of hydrogen in the injection line (tests initiated after long pauses versus sequential runs). After this transient, the gas–water displacement proceeds as described above.
The pressure data for each test are reported in Table 6.
Table 6.
Pressure drops across porous media at the different capillary numbers for hydrogen-water system.
These pressure drops were used to calculate the endpoint of the relative permeability curve using the modified Darcy’s law (Equations (9) and (10)). The resulting values are reported in Table 7.
Table 7.
Relative permeability at the different capillary numbers for hydrogen-water system.
The residual water saturations estimated through image processing are reported in Table 8. The values show good reproducibility across all runs.
Table 8.
Residual water saturations at the different capillary numbers for hydrogen-water system.
Tests conducted at Ca = 10−6 did not yield any quantitative results for the endpoint of the hydrogen relative permeability endpoint or for residual water saturation. At such a low flow rate (1 mL min−1), hydrogen could not overcome entry pressure, preventing gas from entering the chip. Instead, negative gas-line pressures were recorded immediately after opening the injection valve, indicating that the imposed viscous drive was not sufficient to counteract capillary forces. Indeed, the limited syringe volume (5 mL per injection cycle) does not allow for maintaining a continuous viscous drive along the entire flow path. Consequently, hydrogen’s displacement becomes fully capillary-dominated. Gas compressibility combined with strong capillary suction led to spontaneous water re-entry (backflow) through the outlet tubing into the micromodel, further preventing gas entrance. Additionally, interfacial behavior at the three-phase contact line (solid–water–gas) may further enhance spontaneous imbibition in the H2–water system. Studies on moving-contact-line have shown that capillary-driven flow and contact-angle hysteresis strongly control wetting-phase re-entry and interface stability at low Ca [74,75].
Figure 11 provides an example of a pressure profile recorded under these conditions.
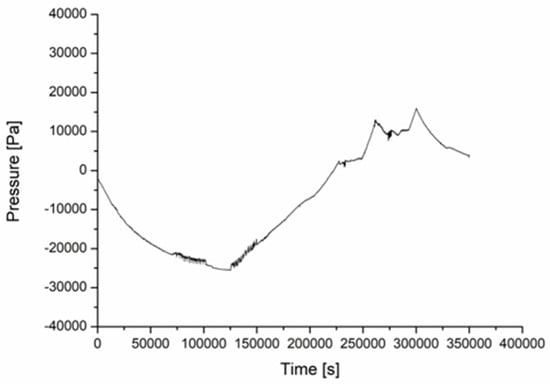
Figure 11.
An example of pressure profiles recorded by the Elveflow® (Elveflow, Paris, France) MPS during a drainage test performed with hydrogen as the non-wetting fluid with q = 1 μL min−1.
3.2.2. Methane–Water Systems
Figure 12 and Figure 13 illustrate the evolution of the methane front (lighter color) during drainage tests corresponding to capillary numbers of 10−4 and 10−5, respectively. As previously mentioned, the frames are acquired during the displacement process, showing the dynamics of the flow front over time.
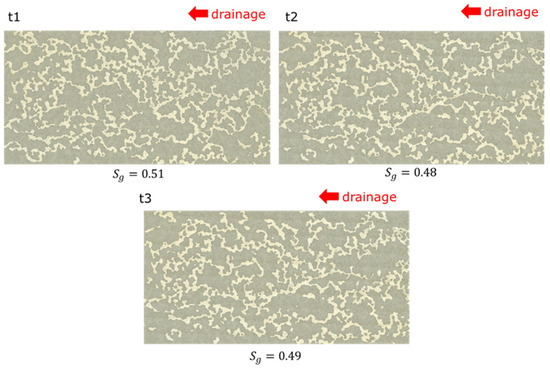
Figure 12.
Evolution of the methane front at different time steps at .
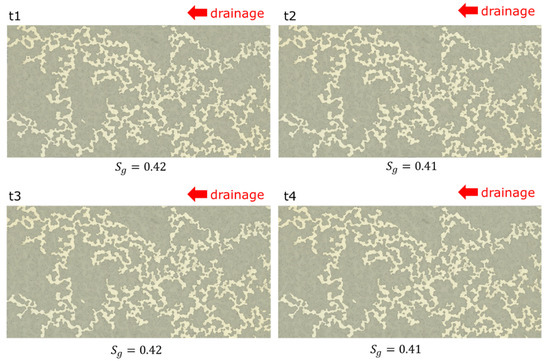
Figure 13.
Evolution of the methane front at different time steps at .
Similarly to hydrogen, methane rapidly invades the pores upon entering the micro-model, showing millisecond-scale invasion independently of the capillary number (Ca). Methane saturation (Sg) increased with rising Ca, in agreement with classical pore-scale displacement theory. Pore-scale phenomena, such as snap-off, were observed similarly for hydrogen, suggesting that the general pore-scale dynamics remain comparable for both gases during drainage. However, a key difference was observed: methane, being more viscous than hydrogen, exhibited a dominant viscous fingering behavior.
As in the hydrogen tests, no significant observations could be made during imbibition. At the capillary numbers investigated, water entered the micromodel too rapidly to allow reliable visualization of pore-scale displacement mechanisms.
Figure 14A, Figure 15A, and Figure 16A present the pressure measurements for the three methane drainage tests performed at flow rates of 100 μL min−1, 10 μL min−1, and 1 μL min−1, corresponding to Ca values of 104, 10−5, and 10−6, respectively. Figure 14B, Figure 15B and Figure 16B show the corresponding device maps at steady state, after pressure reaches stabilization, but while fluids were still flowing.
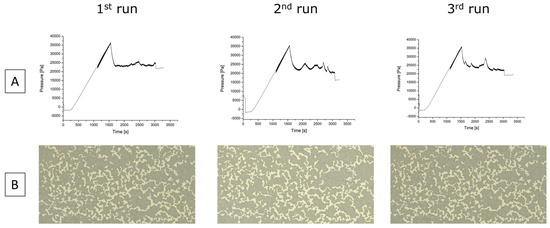
Figure 14.
(A) Pressure measurement for the three runs of drainage tests performed with methane as the non-wetting fluid with q = 100 μL min−1. (B) Maps of the device at the end of each drainage test.
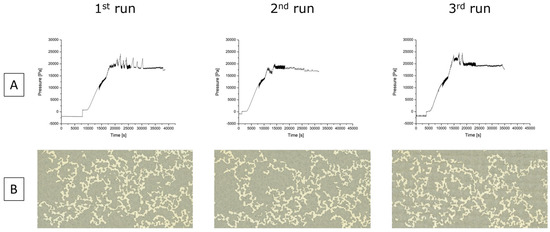
Figure 15.
(A) Pressure measurement for the three runs of drainage tests performed with methane as the non-wetting fluid with q = 10 μL min−1. (B) Maps of the device at the end of each drainage test.
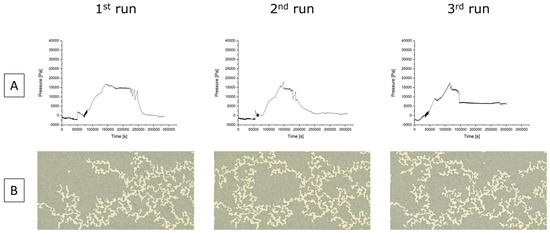
Figure 16.
(A) Pressure measurement for the three runs of drainage tests performed with methane as the non-wetting fluid with q = 1 μL min−1. (B) Maps of the device at the end of each drainage test.
Across all tests, the pressure profiles exhibit similar trends: an initial sharp rise to a maximum value, dependent on the injection velocity, followed by a rapid decrease and a transition to a steady plateau. The maximum pressure is interpreted as the threshold that the gas must overcome to break through the porous structure. Once the gas phase establishes preferential pathways through the device, the pressure drops significantly and stabilizes at a constant value. This stabilized pressure corresponds to the pressure drop across the device under steady-state conditions. This value can then be used to calculate the gas relative permeability endpoint using Darcy’s law.
In the case of methane, the transient pressure rise is more gradual and exhibits more irregular fluctuations compared with hydrogen. This behavior reflects the greater resistance encountered during displacement, due both to methane’s higher viscosity and to the significant capillary forces required to mobilize water. As a consequence, the pressure takes longer to stabilize following the onset of gas injection.
The pressure data for each test are reported in Table 9.
Table 9.
Pressure drops across porous media at the different capillary numbers for methane-water system.
The values of relative permeability for each capillary number are reported in Table 10:
Table 10.
Relative permeability at the different capillary numbers for methane-water system.
Residual water saturations are reported in Table 11. Results demonstrate a high level of reproducibility for the experiments conducted across all tests.
Table 11.
Residual water saturations at the different capillary numbers for methane-water system.
4. Discussion
Drainage tests conducted at different capillary numbers with methane and hydrogen show differences in displacement behavior, which are quantitative rather than representing distinct flow regimes. Indeed, differences in snap-off frequency, pressure stabilization speed, residual water saturation, and relative permeability endpoints are observed.
The results show that hydrogen’s lower viscosity enhances capillary fingering and snap-off events, while methane exhibits more stable viscous-dominated behavior.
Looking at the Lenormand phase diagram (Figure 3), although all experiments fall within the transitional regime between capillary fingering and viscous fingering, no sharp regime shift is observed. However, the two gases behaved differently due to their contrasting viscosities. Methane, having higher viscosity, typically requires larger pressure buildup to displace water, as indicated by the steeper and prolonged initial pressure rise. In contrast, hydrogen, less viscous and less dense, flows more easily through the pore structure, resulting in a smoother and faster pressure stabilization.
Relative permeability endpoints differed slightly between the gases, particularly at higher capillary numbers. At Ca = 10−4, methane shows a marginally higher endpoint relative permeability value (0.027 ± 0.0011) compared with hydrogen (0.023 ± 0.0005). This suggests that methane maintained an effective gas-phase continuity and efficient flow pathway under these conditions. The trend is consistent across three independent experiments per gas (Table 7 and Table 8). At lower Ca (10−5), both gases showed similar endpoint values (~0.004), indicating that viscosity differences become less influential as capillary forces prevail.
Residual water saturation measurements further support this interpretation. As shown in Figure 17, methane yielded consistently lower residual water saturation than hydrogen at both tested Ca values, indicating a more efficient water displacement, likely due to the higher viscous force.
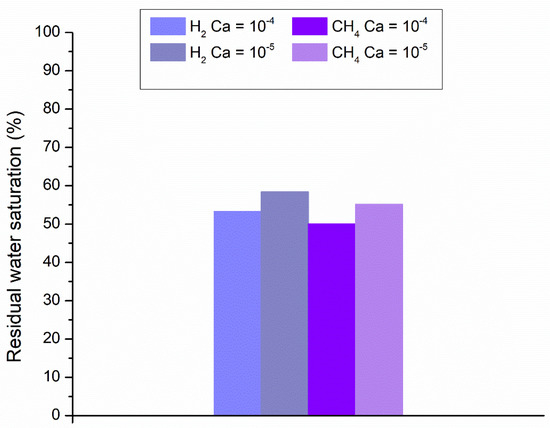
Figure 17.
Residual saturation of water at the two capillary numbers after reaching steady-state conditions.
Additional information can be gained by comparing gas mobilities, defined as the ratio between effective permeability and dynamic viscosity. For the same effective permeability values, hydrogen exhibits a higher mobility due to its lower viscosity, enabling faster displacement and more rapid pressure stabilization. In contrast, methane’s lower mobility leads to a slower and more resistant flow, consistent with the pressure profiles observed. Despite the similar relative-permeability endpoints, differences in viscosity and mobility significantly affect displacement dynamics and are expected to influence breakthrough behavior and gas cycling efficiency at the reservoir scale. Core-flood experiments [76,77] and reservoir-scale simulations [78] for underground hydrogen storage have shown that higher gas mobility is associated with sharper and earlier gas breakthrough, stronger gas overriding and channeling, and a reduced sweep efficiency in some configurations. This directly affects working gas volume and the efficiency of cyclic injection–withdrawal operations [79].
Overall, the results indicate that the displacement patterns lie within a transitional zone where viscous and capillary forces interact. The observed patterns—consistent with the Lenormand diagram (Figure 3)—tend toward a viscous fingering, especially at higher Ca. The variations in displacement efficiency—reflected in the evolution of pressure, residual saturation, and relative permeability endpoints—highlight the critical role of fluid properties, particularly viscosity, in governing gas injection and storage in porous media.
5. Conclusions
This research presents a comprehensive microfluidic experimental approach to investigate multiphase flow in porous media. The results demonstrate the potential of microfluidics to investigate pore-scale dynamics. Comparing hydrogen and methane as non-wetting phases highlights how differences in fluid properties—such as viscosity and density—significantly influence displacement patterns, as shown by the transition from capillary fingering (dominant in hydrogen) to viscous fingering (more prevalent in methane).
The experimental results further show that key multiphase flow parameters—such as relative permeability endpoints and residual saturations—are strongly dependent on the capillary number (Ca). This supports the hypothesis that relative permeability is not solely a function of saturation, but also of flow conditions. This observation aligns with recent studies, such as Karadimitriou et al. [80], which propose Ca-dependent scaling laws. Within the transitional flow regime explored, the differences between H2 and CH4 are quantitative. Indeed, comparative analysis revealed that hydrogen’s lower viscosity induces greater displacement instability and higher sensitivity to snap-off events, potentially leading to increased water entrapment. The observation of strong capillary-driven penetration and pronounced snap-off in H2–brine systems is consistent with earlier micromodel and imaging studies. While the experimental and analysis methods follow established approaches, the core innovation lies in the first systematic comparison of H2 and CH4 under identical pore-network geometries, wettability conditions, and flow rates. This allows direct observation of differences in capillary penetration, snap-off frequency, and residual water saturation governed jointly by fluid properties, capillary number, and mobility ratio. These insights go beyond qualitative pattern recognition, shedding light on how capillary forces, viscous forces, and fluid compressibility interact to control gas invasion and trapping. This has direct implications for optimizing cushion-gas selection and injection–withdrawal strategies in underground hydrogen storage, where pressure management and gas-phase continuity critically affect pore-scale trapping efficiency and recovery performance.
Although the micromodels capture essential pore-scale mechanisms, such as capillary fingering, viscous fingering, snap-off, and Haines jumps, it is important to recognize that they represent an idealized porous medium. Real reservoir rocks exhibit significantly greater heterogeneity in pore structure, mineral composition, and wettability, in addition to much lower permeabilities.
The range of Capillary Numbers used here (10−6 to 10−4, with a focus on 10−4 and 10−5) was selected to investigate different flow regimes, with particular attention to those occurring in the transition between capillary-dominated and viscous-dominated behaviors. These Ca values are consistent with those reported for water–gas displacement under reservoir-relevant conditions, especially in the near-wellbore region. However, although these Ca values are suitable for laboratory-scale investigations, they may only partially capture the full range of flow regimes encountered at reservoir conditions. Future work should therefore consider expanding the Ca range, as well as varying viscosity ratios and other dynamic parameters, to construct a more complete Lenormand-type diagram for water–gas systems and better define the transitions between capillary fingering, viscous fingering, and more stable displacement.
Further research could also integrate these detailed pore-scale observations with reservoir-scale simulations to upscale relative permeability curves and dynamic flow behavior. In addition, constructing a complete Lenormand diagram, tailored to our specific system—through experiments spanning a broader range of viscosity ratios and capillary numbers—will enhance predictive capability and support more effective reservoir-management and optimization strategies.
Future development will include implementing steady-state co-injection in a dual-inlet micromodel to reconstruct full relative-permeability curves across a range of water and gas saturations. This will require optimization of both the experimental procedures and the microfluidic setup.
Additional work will also focus on measuring static and dynamic contact angles, including hysteresis, on simple geometries to investigate the effects of gas composition, brine salinity, and pressure. Capillary pressure will also be upscaled using the J-function to enable the integration of laboratory data into reservoir models.
Overall, these future developments aim to strengthen the link between pore-scale mechanisms and field-scale flow dynamics, improving predictive modeling of underground hydrogen storage. By expanding the experimental parameter space—including Ca range, viscosity ratios, and wettability—and integrating results into advanced simulation workflows, this research will contribute to the optimization of injection and withdrawal strategies, enhancing both the safety and efficiency of hydrogen storage in geological formations.
Supplementary Materials
The following supporting information can be downloaded at: https://www.mdpi.com/article/10.3390/en19020348/s1, Video S1: hydrogen drainage at Ca = 10−4.
Author Contributions
Conceptualization, M.L., C.S. and D.V.; methodology, M.L., C.S., N.S.V. and D.V.; software, E.S.B.; validation, M.L. and C.S.; formal analysis, M.L. and C.S.; investigation, M.L.; resources, M.S., D.B., A.M. and C.C.; data curation, M.L. and E.S.B.; writing—original draft preparation, M.L., C.S. and D.V.; writing—review and editing, N.S.V., E.S.B., M.S., D.B., A.M., F.C.P., F.V., C.C. and D.V.; visualization, M.L. and C.S.; supervision, C.S. and D.V.; project administration, F.C.P., F.V. and D.V.; funding acquisition, F.C.P., F.V. and D.V. All authors have read and agreed to the published version of the manuscript.
Funding
This research was funded by Snam-Stogit and by the European Union—NextGenerationEU under the National Recovery and Resilience Plan (NRRP), Mission 04 Component 2 Investment 3.1|Project Code: IR0000027—CUP: B33C22000710006—iENTRANCE@ENL: Infrastructure for Energy TRAnsition aNd Circular Economy@EuroNanoLab.
Data Availability Statement
The data presented in this study are available on request from the corresponding author because the data are part of an ongoing study.
Conflicts of Interest
The authors declare no conflicts of interest.
Appendix A
Images were acquired with a 10× objective and 176× zoom, yielding a resolution of 1.14 µm/px. To estimate gas saturation, microscope images were binarized using a thresholding algorithm based on the HSV color representation. No dyes were added to the water to preserve the microfluidic chips and enable their reuse; therefore, differences in Hue among gas, liquid, and solid phases were not pronounced. The Value channel proved to be the most sensitive parameter (Figure A1 and Figure A2). In the histograms of the pixel Value distribution within the images, two peaks corresponding to the gas phase and the liquid + solid phase can be clearly distinguished (Figure A2c).

Figure A1.
Example of Hue (a), Saturation (b), and Value (c) of a chip image during a drainage test.
Figure A1.
Example of Hue (a), Saturation (b), and Value (c) of a chip image during a drainage test.


Figure A2.
Example of distribution of Hue, Saturation and Value of a chip image during a drainage test; vertical red lines delimit the threshold interval on Value representing pore space occupied by gas.
Figure A2.
Example of distribution of Hue, Saturation and Value of a chip image during a drainage test; vertical red lines delimit the threshold interval on Value representing pore space occupied by gas.

Thresholding based on the Value channel cannot account for the shadow effect near pore walls (Figure A3a), which arises from etching. The shadow transitions from very dark to light because its intensity varies with the curvature’s inclination: the more the surface is tilted relative to the light direction, the darker it appears (Figure A3b). For the microfluidic chip under consideration, the etching depth is 20 µm on each side, corresponding to a degrading shadow of approximately 16 pixels at the adopted image resolution. The darkest portion of the shadow, spanning about 10 pixels, cannot be detected using the Value threshold, resulting in a significant underestimation of porosity. To overcome this issue, dilation was applied to the thresholded image using a 3 × 3 cross-shaped kernel, and the operation was iterated 10 times.

Figure A3.
(a) Shadow effect on solid walls; (b) schematic of the effect of curvature’s inclination with respect to the light direction.
Figure A3.
(a) Shadow effect on solid walls; (b) schematic of the effect of curvature’s inclination with respect to the light direction.

Finally, small objects, for example, water droplets in the gas phase, and small holes due to noise, are removed from the binarized image.
Gas saturation () is then obtained from the binarized image by applying the formula
where is the pixel count of the binarized mask, is the pixel count of the isolated pores, is the image width in pixels, is the image height in pixels, is the effective porosity.
A preliminary binarization is performed on the empty chip to identify the peaks in the Value distribution corresponding to the solid phase and the empty pores, and to validate the estimated total porosity against the value declared by the chip manufacturer, yielding a discrepancy below 1%. An analogous analysis is carried out on the fully saturated chip to determine the number of pixels corresponding to isolated pores () and to assess the effective porosity ().
In detail, the algorithm to compute gas saturation during imbibition and drainage proceeds as follows:
- (1)
- Convert RGB image to HSV representation.
- (2)
- Plot the histograms of H, S and V within the image and identify the peaks corresponding to the gas phase and the liquid + solid phase.
- (3)
- Apply the gas thresholds to binarize the image, assigning value 1 to gas pixels only.
- (4)
- Remove small objects and small holes (areas < 150 pixels).
- (5)
- Apply dilation iteratively, repeating the operation 10 times, using a 3 × 3 cross-shaped kernel.
- (6)
- Compute gas saturation as follows:
- count the mask pixels
- subtract the pixels corresponding to isolated pores ()
- divide by the total number of pixels )
- divide by the effective porosity ().
References
- Benetatos, C.; Bocchini, S.; Carpignano, A.; Chiodoni, A.; Cocuzza, M.; Deangeli, C.; Eid, C.; Ferrero, D.; Gerboni, R.; Giglio, G.; et al. How underground systems can contribute to meet the challenges of energy transition. Geam. Geoing. Ambient. E Mineraria 2021, 1224, 65–80. [Google Scholar] [CrossRef]
- Li, M.; Liu, J.; Xia, Y. Risk Prediction of Gas Hydrate Formation in the Wellbore and Subsea Gathering System of Deep-Water Turbidite Reservoirs: Case Analysis from the South China Sea. Reserv. Sci. 2025, 1, 52–72. [Google Scholar] [CrossRef]
- Wu, J.; Ansari, U. From CO2 Sequestration to Hydrogen Storage: Further Utilization of Depleted Gas Reservoirs. Reserv. Sci. 2025, 1, 19–35. [Google Scholar] [CrossRef]
- Cao, L.; Lv, M.; Li, C.; Sun, Q.; Wu, M.; Xu, C.; Dou, J. Effects of Crosslinking Agents and Reservoir Conditions on the Propagation of Fractures in Coal Reservoirs During Hydraulic Fracturing. Reserv. Sci. 2025, 1, 36–51. [Google Scholar] [CrossRef]
- Haddad, P.G.; Ranchou-Peyruse, M.; Guignard, M.; Mura, J.; Casteran, F.; Ronjon-Magand, L.; Senechal, P.; Isaure, M.-P.; Moonen, P.; Hoareau, G.; et al. Geological storage of hydrogen in deep aquifers—An experimental multidisciplinary study. Energy Environ. Sci. 2022, 15, 3400–3415. [Google Scholar] [CrossRef]
- Heinemann, N.; Alcalde, J.; Miocic, J.M.; Hangx, S.J.T.; Kallmeyer, J.; Ostertag-Henning, C.; Hassanpouryouzband, A.; Thaysen, E.M.; Strobel, G.J.; Schmidt-Hattenberger, C.; et al. Enabling large-scale hydrogen storage in porous media-the scientific challenges. Energy Environ. Sci. 2021, 14, 853–864. [Google Scholar] [CrossRef]
- Al-Shafi, M.; Massarweh, O.; Abushaikha, A.S.; Bicer, Y. A review on underground gas storage systems: Natural gas, hydrogen and carbon sequestration. Energy Rep. 2023, 9, 6251–6266. [Google Scholar] [CrossRef]
- Tawil, M.; Borello, E.S.; Bocchini, S.; Pirri, C.F.; Verga, F.; Coti, C.; Scapolo, M.; Barbieri, D.; Viberti, D. Solubility of H2-CH4 mixtures in brine at underground hydrogen storage thermodynamic conditions. Front. Energy Res. 2024, 12, 1356491. [Google Scholar] [CrossRef]
- Tawil, M.; Borello, E.S.; Panini, F.; Loffredo, M.; Bocchini, S.; Verga, F.; Pirri, F.; Coti, C.; Scapolo, M.; Ferraro, P.; et al. PVT Analysis for Hydrogen and Methane Mixtures for Underground Hydrogen Storage. In SPE Europe Energy Conference and Exhibition; SPE: Turin, Italy, 2024; p. D031S017R003. [Google Scholar] [CrossRef]
- Borello, E.S.; Bocchini, S.; Chiodoni, A.; Coti, C.; Fontana, M.; Panini, F.; Peter, C.; Pirri, C.F.; Tawil, M.; Mantegazzi, A.; et al. Underground Hydrogen Storage Safety: Experimental Study of Hydrogen Diffusion through Caprocks. Energies 2024, 17, 394. [Google Scholar] [CrossRef]
- Massimiani, A.; Panini, F.; Marasso, S.L.; Vasile, N.; Quaglio, M.; Coti, C.; Barbieri, D.; Verga, F.; Pirri, C.F.; Viberti, D. Design, Fabrication, and Experimental Validation of Microfluidic Devices for the Investigation of Pore-Scale Phenomena in Underground Gas Storage Systems. Micromachines 2023, 14, 308. [Google Scholar] [CrossRef]
- Carden, P.; Paterson, L. Physical, chemical and energy aspects of underground hydrogen storage. Int. J. Hydrogen Energy 1979, 4, 559–569. [Google Scholar] [CrossRef]
- Hashemi, L.; Glerum, W.; Farajzadeh, R.; Hajibeygi, H. Contact angle measurement for hydrogen/brine/sandstone system using captive-bubble method relevant for underground hydrogen storage. Adv. Water Resour. 2021, 154, 103964. [Google Scholar] [CrossRef]
- Rücker, M.; Berg, S.; Armstrong, R.T.; Georgiadis, A.; Ott, H.; Schwing, A.; Neiteler, R.; Brussee, N.; Makurat, A.; Leu, L.; et al. From connected pathway flow to ganglion dynamics. Geophys. Res. Lett. 2015, 42, 3888–3894. [Google Scholar] [CrossRef]
- van Rooijen, W.; Hashemi, L.; Boon, M.; Farajzadeh, R.; Hajibeygi, H. Microfluidics-based analysis of dynamic contact angles relevant for underground hydrogen storage. Adv. Water Resour. 2022, 164, 104221. [Google Scholar] [CrossRef]
- Bahrami, M.; Mahani, H.; Zivar, D.; Ayatollahi, S. Microfluidic investigation of pore-scale flow behavior and hysteresis in underground hydrogen storage in sandstones. J. Energy Storage 2024, 98, 112959. [Google Scholar] [CrossRef]
- Gunda, N.S.K.; Bera, B.; Karadimitriou, N.K.; Mitra, S.K.; Hassanizadeh, S.M. Reservoir-on-a-Chip (ROC): A new paradigm in reservoir engineering. Lab Chip 2011, 11, 3785–3792. [Google Scholar] [CrossRef]
- Singh, K.; Menke, H.; Andrew, M.; Lin, Q.; Rau, C.; Blunt, M.J.; Bijeljic, B. Dynamics of snap-off and pore-filling events during two-phase fluid flow in permeable media. Sci. Rep. 2017, 7, 5192. [Google Scholar] [CrossRef]
- Chen, Y.; Li, Y.; Valocchi, A.J.; Christensen, K.T. Lattice Boltzmann simulations of liquid CO2 displacing water in a 2D heterogeneous micromodel at reservoir pressure conditions. J. Contam. Hydrol. 2018, 212, 14–27. [Google Scholar] [CrossRef]
- Jahanbakhsh, A.; Wlodarczyk, K.L.; Hand, D.P.; Maier, R.R.J.; Maroto-Valer, M.M. Review of microfluidic devices and imaging techniques for fluid flow study in porous geomaterials. Sensors 2020, 20, 4030. [Google Scholar] [CrossRef]
- Raeli, A.; Borello, E.S.; Serazio, C.; Czelusniak, L.E.; Bingert, T.N.; Krause, M.J.; Viberti, D. Analysis of Lattice Boltzmann Method Potentials for Understanding Underground Fluid Storage Microscale Phenomena. In Proceedings of the OMC Med Energy Conference and Exhibition, Ravenna, Italy, 8 April 2025. [Google Scholar]
- Yiotis, A.; Karadimitriou, N.K.; Zarikos, I.; Steeb, H. Pore-scale effects during the transition from capillary- to viscosity-dominated flow dynamics within microfluidic porous-like domains. Sci. Rep. 2021, 11, 3891. [Google Scholar] [CrossRef]
- Soulaine, C.; Maes, J.; Roman, S. Computational Microfluidics for Geosciences. Front. Water 2021, 3, 643714. [Google Scholar] [CrossRef]
- Massimiani, A.; Panini, F.; Marasso, S.L.; Cocuzza, M.; Quaglio, M.; Pirri, C.F.; Verga, F.; Viberti, D. 2D Microfluidic Devices for Pore-Scale Phenomena Investigation: A Review. Water 2023, 15, 1222. [Google Scholar] [CrossRef]
- Browne, C.A.; Shih, A.; Datta, S.S. Pore-Scale Flow Characterization of Polymer Solutions in Microfluidic Porous Media. Small 2020, 16, e1903944. [Google Scholar] [CrossRef] [PubMed]
- Xu, W.; Ok, J.T.; Xiao, F.; Neeves, K.B.; Yin, X. Effect of pore geometry and interfacial tension on water-oil displacement efficiency in oil-wet microfluidic porous media analogs. Phys. Fluids 2014, 26, 093102. [Google Scholar] [CrossRef]
- Wang, L. Simulation of Slip Flow and Phase Change in Nanopores. PhD Thesis, Colorado School of Mines, Golden, CO, USA, 2014. [Google Scholar]
- Park, S.; Anggraini, T.M.; Chung, J.; Kang, P.K.; Lee, S. Microfluidic pore model study of precipitates induced by the pore-scale mixing of an iron sulfate solution with simulated groundwater. Chemosphere 2021, 271, 129857. [Google Scholar] [CrossRef]
- Poonoosamy, J.; Soulaine, C.; Burmeister, A.; Deissmann, G.; Bosbach, D.; Roman, S. Microfluidic flow-through reactor and 3D Raman imaging for: In situ assessment of mineral reactivity in porous and fractured porous media. Lab Chip 2020, 20, 2562–2571. [Google Scholar] [CrossRef]
- Quaglio, M.; Bianco, S.; Castagna, R.; Cocuzza, M.; Pirri, C.F. Elastomeric nanocomposite based on carbon nanotubes for Polymerase Chain Reaction device. Microelectron. Eng. 2011, 88, 1860–1863. [Google Scholar] [CrossRef]
- Amarasinghe, W.; Farzaneh, S.; Fjelde, I.; Sohrabi, M.; Guo, Y. A Visual Investigation of CO2 Convective Mixing in Water and Oil at the Pore Scale Using a Micromodel Apparatus at Reservoir Conditions. Gases 2021, 1, 53–67. [Google Scholar] [CrossRef]
- Lao, J.; Xie, Z.; Du, S.; Zhou, Y.; Song, H. Reducing energy consumption and enhancing trapping and capacity of CO2 sequestration: The effects of pore heterogeneity and fluid properties. Energy 2024, 304, 132088. [Google Scholar] [CrossRef]
- Lei, W.; Liu, T.; Xie, C.; Yang, H.; Wu, T.; Wang, M. Enhanced oil recovery mechanism and recovery performance of micro-gel particle suspensions by microfluidic experiments. Energy Sci. Eng. 2020, 8, 986–998. [Google Scholar] [CrossRef]
- Pousti, M.; Zarabadi, M.P.; Amirdehi, M.A.; Paquet-Mercier, F.; Greener, J. Microfluidic bioanalytical flow cells for biofilm studies: A review. Analyst 2019, 144, 68–86. [Google Scholar] [CrossRef]
- Gaol, C.L.; Ganzer, L.; Mukherjee, S.; Alkan, H. Investigation of clogging in porous media induced by microorganisms using a microfluidic application. Environ. Sci. Water Res. Technol. 2021, 7, 441–454. [Google Scholar] [CrossRef]
- Alabbas, F.M.; Mishra, B. Microbiologically Influenced Corrosion of Pipelines in the Oil & Gas Industry. In Proceedings of the 8th Pacific Rim International Congress on Advanced Materials and Processing, Waikoloa, HI, USA, 4–9 August 2013; Springer International Publishing: Cham, Switzerland, 2013; pp. 3441–3448. [Google Scholar] [CrossRef]
- Kotu, S.P.; Erbay, C.; Sobahi, N.; Han, A.; Mannan, S.; Jayaraman, A. Integration of Electrochemical Impedance Spectroscopy and Microfluidics for Investigating Microbially Influenced Corrosion Using Co-Culture Biofilms. In Proceedings of the Corrosion Conference and Expo 2016, Vancouver, BC, Canada, 6–10 March 2016. Paper Number. NACE-2016-7793. [Google Scholar]
- Karimifard, S.; Li, X.; Elowsky, C.; Li, Y. Modeling the impact of evolving biofilms on flow in porous media inside a microfluidic channel. Water Res. 2021, 188, 116536. [Google Scholar] [CrossRef] [PubMed]
- Liu, N.; Ostertag-Henning, C.; Fernø, M.A.; Dopffel, N. Growth on Hydrogen by the Sulfate-Reducing Oleidesulfovibrio alaskensis Induces Biofilm Dispersion and Detachment─Implications for Underground Hydrogen Storage. Environ. Sci. Technol. 2025, 59, 7095–7105. [Google Scholar] [CrossRef] [PubMed]
- Liu, N.; Fernø, M.A. Calcite-functionalized microfluidic chip for pore scale investigation of biogeochemical interactions in porous media. Lab Chip 2025, 25, 2320–2324. [Google Scholar] [CrossRef]
- Liu, N.; Kovscek, A.R.; Fernø, M.A.; Dopffel, N. Pore-scale study of microbial hydrogen consumption and wettability alteration during underground hydrogen storage. Front. Energy Res. 2023, 11, 1124621. [Google Scholar] [CrossRef]
- Wu, L.; Hou, Z.-M.; Luo, Z.-F.; Fang, Y.-L.; Huang, L.-C.; Wu, X.-N.; Chen, Q.-J.; Wang, Q.-C. Impacts of microbial interactions on underground hydrogen storage in porous media: A comprehensive review of experimental, numerical, and field studies. Pet. Sci. 2024, 21, 4067–4099. [Google Scholar] [CrossRef]
- Viveros, F.E.; Liu, N.; Fernø, M.A. Biogeochemical Interactions and Their Role in European Underground Hydrogen Storage. Minerals 2025, 15, 929. [Google Scholar] [CrossRef]
- Gutiérrez, B.; Juarez, F.; Ornelas, L.; Zeppieri, S.; de Ramos, A.L. Experimental Study of Gas–Liquid Two-Phase Flow in Glass Micromodels. Int. J. Thermophys. 2008, 29, 2126–2135. [Google Scholar] [CrossRef]
- Ferer, M.; Ji, C.; Bromhal, G.S.; Cook, J.; Ahmadi, G.; Smith, D.H. Crossover from capillary fingering to viscous fingering for immiscible unstable flow: Experiment and modeling. Phys. Rev. E 2004, 70, 7. [Google Scholar] [CrossRef] [PubMed]
- Zhang, C.; Oostrom, M.; Wietsma, T.W.; Grate, J.W.; Warner, M.G. Influence of viscous and capillary forces on immiscible fluid displacement: Pore-scale experimental study in a water-wet micromodel demonstrating viscous and capillary fingering. Energy Fuels 2011, 25, 3493–3505. [Google Scholar] [CrossRef]
- Niasar, V.J.; Hassanizadeh, S.M.; Pyrak-Nolte, L.J.; Berentsen, C. Simulating drainage and imbibition experiments in a high-porosity micromodel using an unstructured pore network model. Water Resour. Res. 2009, 45, W02430. [Google Scholar] [CrossRef]
- Khan, M.I.; Machado, M.V.B.; Khanal, A.; Delshad, M. Evaluating capillary trapping in underground hydrogen storage: A pore-scale to reservoir-scale analysis. Fuel 2024, 376, 132755. [Google Scholar] [CrossRef]
- Viveros, F.E.; Medina, O.E.; Moncayo-Riascos, I.; Lysyy, M.; Benjumea, P.N.; Cortés, F.B.; Franco, C.A. Hydrogen storage in depleted gas reservoirs using methane cushion gas: An interfacial tension and pore scale study. J. Energy Storage 2024, 98, 113110. [Google Scholar] [CrossRef]
- Lysyy, M.; Ersland, G.; Fernø, M. Pore-scale dynamics for underground porous media hydrogen storage. Adv. Water Resour. 2022, 163, 104167. [Google Scholar] [CrossRef]
- AlOmier, A.; Hoecherl, M.; Cha, D.; Ayirala, S.; Yousef, A.A.; Hoteit, H. Experimental Investigation of the Impact of Mixed Wettability on Pore-Scale Fluid Displacement: A Microfluidic Study. ACS Appl. Mater. Interfaces 2024, 16, 69165–69179. [Google Scholar] [CrossRef] [PubMed]
- Johnson, J.; Van Noort, R.; Nooraiepour, M.; Yarushina, V. Impact of Injection Rate Variation for Hydrogen Storage in Porous Media, a Microfluidics Case Study. In Fifth EAGE Global Energy Transition Conference & Exhibition (GET 2024); European Association of Geoscientists & Engineers: Rotterdam, The Netherlands, 2024; pp. 1–5. [Google Scholar] [CrossRef]
- Loffredo, M.; Serazio, C.; Verga, F.; Pirri, F.; Borello, E.S.; Coti, C.; Barbieri, D.; Scapolo, M.; Viberti, D. Investigation of Pore-Scale Phenomena for Underground Gas Storage Through Micromodels. In Proceedings of the OMC Med Energy Conference and Exhibition, Ravenna, Italy, 8 April 2025. [Google Scholar]
- Lysyy, M.; Liu, N.; Solstad, C.M.; Fernø, M.A.; Ersland, G. Microfluidic hydrogen storage capacity and residual trapping during cyclic injections: Implications for underground storage. Int. J. Hydrogen Energy 2023, 48, 31294–31304. [Google Scholar] [CrossRef]
- Cottin, C.; Bodiguel, H.; Colin, A. Influence of wetting conditions on drainage in porous media: A microfluidic study. Phys. Rev. E 2011, 84, 026311. [Google Scholar] [CrossRef] [PubMed]
- Lenormand, R.; Touboul, E.; Zarcone, C. Numerical models and experiments on immiscible displacements in porous media. J. Fluid Mech. 1988, 189, 165–187. [Google Scholar] [CrossRef]
- Guo, H.; Song, K.; Hilfer, R. A Critical Review of Capillary Number and its Application in Enhanced Oil Recovery. In Proceedings of the SPE Improved Oil Recovery Conference, Virtual, 31 August–4 September 2020. [Google Scholar] [CrossRef]
- Green, D.W.; Willhite, G.P. Enhanced Oil Recovery, 2nd ed.; Society of Petroleum Engineers: Richardson, TX, USA, 2018. [Google Scholar] [CrossRef]
- Gunda, N.S.K.; Joseph, J.; Tamayol, A.; Akbari, M.; Mitra, S.K. Measurement of pressure drop and flow resistance in microchannels with integrated micropillars. Microfluid. Nanofluidics 2013, 14, 711–721. [Google Scholar] [CrossRef]
- Joseph, J.; Gunda, N.S.K.; Mitra, S.K. On-chip porous media: Porosity and permeability measurements. Chem. Eng. Sci. 2013, 99, 274–283. [Google Scholar] [CrossRef]
- Pradhan, S.; Shaik, I.; Lagraauw, R.; Bikkina, P. A semi-experimental procedure for the estimation of permeability of microfluidic pore network. MethodsX 2019, 6, 704–713. [Google Scholar] [CrossRef] [PubMed]
- Lagraauw, R. EOR Chips Permeability Determination; Technical Report; Micronit, B.V., Ed.; Micronit: Enshede, The Netherland; Available online: https://micronit.com/mpattachment/file/download/id/66/ (accessed on 26 July 2023).
- Chow, Y.T.F.; Maitland, G.C.; Trusler, J.P.M. Interfacial tensions of (H2O + H2) and (H2O + CO2 + H2) systems at temperatures of (298–448) K and pressures up to 45 MPa. Fluid Phase Equilibria 2018, 475, 37–44. [Google Scholar] [CrossRef]
- Schmidt, K.A.G.; Folas, G.K.; Kvamme, B. Calculation of the interfacial tension of the methane–water system with the linear gradient theory. Fluid Phase Equilibria 2007, 261, 230–237. [Google Scholar] [CrossRef]
- vv. aa. ‘Solubility of Gases in Water’. Engineering Toolbox. 2008. Available online: https://www.engineeringtoolbox.com/gases-solubility-water-d_1148.html (accessed on 22 April 2021).
- Panini, F.; Borello, E.S.; Peter, C.; Viberti, D. Application of a* Algorithm for Tortuosity and Effective Porosity Estimation of 2D Rock Images. In Advanced Problem in Mechanics II; Indeitsev, D.A., Krivtsov, A.M., Eds.; Lecture Notes in Mechanical Engineering; Springer International Publishing: Cham, Switzerland, 2022; pp. 519–530. [Google Scholar] [CrossRef]
- Blunt, M.J. Multiphase Flow in Permeable Media: A Pore-Scale Perspective; Cambridge University Press: Cambridge, UK, 2017. [Google Scholar]
- Zhang, R.; He, X.; Chen, S. Interface and surface tension in incompressible lattice Boltzmann multiphase model. Comput. Phys. Commun. 2000, 129, 121–130. [Google Scholar] [CrossRef]
- Huber, M.L.; Lemmon, E.W.; Bell, I.H.; McLinden, M.O. The NIST REFPROP Database for Highly Accurate Properties of Industrially Important Fluids. Ind. Eng. Chem. Res. 2022, 61, 15449–15472. [Google Scholar] [CrossRef]
- Omrani, S.; Ghasemi, M.; Singh, M.; Mahmoodpour, S.; Zhou, T.; Babaei, M.; Niasar, V. Interfacial Tension–Temperature–Pressure–Salinity Relationship for the Hydrogen–Brine System under Reservoir Conditions: Integration of Molecular Dynamics and Machine Learning. Langmuir 2023, 39, 12680–12691. [Google Scholar] [CrossRef]
- Andrew, M.; Bijeljic, B.; Blunt, M.J. Pore-scale contact angle measurements at reservoir conditions using X-ray microtomography. Adv. Water Resour. 2014, 68, 24–31. [Google Scholar] [CrossRef]
- Roof, J.G. Snap-Off of Oil Droplets in Water-Wet Pores. Soc. Pet. Eng. J. 1970, 10, 85–90. [Google Scholar] [CrossRef]
- Deng, W.; Cardenas, M.B.; Bennett, P.C. Extended Roof snap-off for a continuous nonwetting fluid and an example case for supercritical CO2. Adv. Water Resour. 2014, 64, 34–46. [Google Scholar] [CrossRef]
- Snoeijer, J.H.; Andreotti, B. Moving Contact Lines: Scales, Regimes, and Dynamical Transitions. Annu. Rev. Fluid Mech. 2013, 45, 269–292. [Google Scholar] [CrossRef]
- Karim, A.M. A review of physics of moving contact line dynamics models and its applications in interfacial science. J. Appl. Phys. 2022, 132, 080701. [Google Scholar] [CrossRef]
- Zhong, L.; Baek, S.; Guo, M.; Bagwell, C.; Huerta, N. Hydrogen, Methane, Brine Flow Behavior, and Saturation in Sandstone Cores During H2 and CH4 Injection and Displacement. Energies 2024, 17, 5800. [Google Scholar] [CrossRef]
- Higgs, S.; Da Wang, Y.; Sun, C.; Ennis-King, J.; Jackson, S.J.; Armstrong, R.T.; Mostaghimi, P. Comparative analysis of hydrogen, methane and nitrogen relative permeability: Implications for Underground Hydrogen Storage. J. Energy Storage 2023, 73, 108827. [Google Scholar] [CrossRef]
- Bo, Z.; Hörning, S.; Underschultz, J.R.; Garnett, A.; Hurter, S. Effects of geological heterogeneity on gas mixing during underground hydrogen storage (UHS) in braided-fluvial reservoirs. Fuel 2024, 357, 129949. [Google Scholar] [CrossRef]
- Buscheck, T.A.; Goodman, A.; Lackey, G.; Camargo, J.D.T.; Huerta, N.; Haeri, F.; Freeman, G.M.; White, J.A. Underground storage of hydrogen and hydrogen/methane mixtures in porous reservoirs: Influence of reservoir factors and engineering choices on deliverability and storage operations. Int. J. Hydrogen Energy 2024, 49, 1088–1107. [Google Scholar] [CrossRef]
- Karadimitriou, N.; Valavanides, M.S.; Mouravas, K.; Steeb, H. Flow-Dependent Relative Permeability Scaling for Steady-State Two-Phase Flow in Porous Media: Laboratory Validation on a Microfluidic Network. Petrophysics 2023, 64, 656–679. [Google Scholar] [CrossRef]


Disclaimer/Publisher’s Note: The statements, opinions and data contained in all publications are solely those of the individual author(s) and contributor(s) and not of MDPI and/or the editor(s). MDPI and/or the editor(s) disclaim responsibility for any injury to people or property resulting from any ideas, methods, instructions or products referred to in the content. |
© 2026 by the authors. Licensee MDPI, Basel, Switzerland. This article is an open access article distributed under the terms and conditions of the Creative Commons Attribution (CC BY) license.