1. Introduction
Following the resolutions from the 2021 and 2023 COP conferences, developed nations commit to phasing out coal power plants without carbon capture and storage by 2030–2034. Developing nations are given a longer transition timeframe, until 2040–2050, reflecting the principle of common but differentiated responsibilities [
1].
Coal-fired power generation presents a clear duality: it is the most carbon-intensive fossil fuel and a central target for global emissions reduction, yet it remains a dependable and cost-effective means of satisfying rising electricity needs. In developed nations, coal consumption is slowly decreasing, whereas in many Asian countries and other developing regions, it continues to expand. Consequently, despite the common perception that the coal era is nearing its end, this energy source continues to make a significant contribution to the global electricity supply and helps maintain affordable energy for billions of people.
Since the early 1980s, a relatively moderate growth in coal production was observed: output volumes increased gradually and by the late 1990s reached approximately 20,000 TWh. However, since the 2000s the situation has changed dramatically, with coal production growing rapidly. This led to peak levels of global coal production in the early 2010s, exceeding 40,000 TWh. After reaching a maximum in 2012–2013, total production began to decline gradually, but remained at a high level and stabilized by 2020 [
2,
3].
Minor fluctuations were observed thereafter, while consumption levels remained consistently high and by 2025 had nearly returned to peak values. The largest contribution to coal consumption has traditionally come from China, whose share increased significantly during the first half of the period under consideration. India has also demonstrated steady growth in consumption, gradually becoming one of the key players in the global coal market. Other Asian countries have likewise increased demand, although at a more moderate pace. Other regions show only slight growth, and their share in total consumption remains relatively small.
Global coal consumption will continue to be driven primarily by Asian countries, while developed economies are reducing their dependence on coal. The highest CO
2 emissions from coal use are observed in Asia, reaching about 8400 million tonnes, which significantly exceeds the levels of other regions. North America stands out with emissions of around 1100 million tonnes, whereas Europe shows lower values, on the order of 430–600 million tonnes [
4].
Thus, current trends in the global coal industry include a significant increase in coal production and consumption in Asia, a gradual decline in its role in developed regions, and a corresponding shift in the distribution of carbon emissions [
5]. This highlights the continued importance of coal in the global energy balance, while simultaneously emphasizing the challenges associated with environmental impacts and the need for a transition to more sustainable energy sources [
6].
Modern global energy systems continue to rely heavily on coal, making a complete phase-out of its use in the foreseeable future virtually impossible. Coal retains its status as one of the leading primary energy sources, providing a substantial share of global electricity and heat generation, while also remaining the largest anthropogenic source of greenhouse gas emissions [
7].
It is precisely this dual role of coal—serving simultaneously as a fundamental component of the energy balance and as a major driver of climate risks—that creates a key contradiction and, at the same time, identifies the most promising pathway for accelerating the transition to a low-carbon energy system. Decarbonization measures in the coal sector are therefore capable of delivering the greatest volume of emission reductions in the short- and medium-term perspective.
For Kazakhstan, coal remains a key element of the national energy balance, serving as a reliable, affordable, and stable source of energy. Even with the growing share of renewable energy sources—such as solar, wind, and biomass—these technologies are not yet capable of fully replacing coal. Coal ensures the stability and energy security of Kazakhstan, especially during periods of peak demand. Today, Kazakhstan ranks among the world’s top ten countries and holds third place among CIS countries in terms of proven coal reserves and production volumes (around 50 deposits with total resources of approximately 150 billion tonnes). The country produces the full range of coal types, from lignite to hard coal, and the coal industry remains a leading sector of the economy and the backbone of the national energy system [
8].
The coal produced fully satisfies domestic demand, while a significant portion is exported. Kazakhstan consistently accounts for about 1.7% of global coal exports. Owing to its vast resource base, favorable geographical location, well-developed transport and logistics systems, and strong demand in both domestic and international markets, the coal sector is expected to continue developing. The coal industry also benefits from recurring crises affecting the global oil sector. At the same time, proven coal reserves far exceed oil reserves, which means that, under the current technological paradigm, coal will become an increasingly important strategic resource in the near future [
9].
Open-pit mining is still widely used in the development of large coal basins in Kazakhstan. This method allows relatively low-cost extraction and indicates the substantial potential of existing deposits. High-ash coal is produced, which is used at domestic power plants and actively supplied to foreign markets. The ash content of these coals ranges from 39% to 53%. Therefore, the competitiveness of Kazakhstan’s coal industry depends largely on the timely modernization of production technologies.
To reduce nitrogen oxide (NO
x) emissions during fuel combustion at thermal power plants and industrial boilers, various methods are employed, including flue gas recirculation, steam or water injection, reduction in excess air ratio, non-stoichiometric combustion, and low-emission combustion technologies. Among these approaches, staged air supply technology, commonly known as overfire air (OFA), is particularly effective [
10,
11,
12,
13].
In [
10], to address the problem of high NO
x emissions from 600 MW boilers at power plants, the authors developed an experimental test rig to model a cold gas–liquid flow at a 1:5 scale for a two-channel overfire air (OFA) system. In particular, the study investigated the effect of OFA injection velocity on the divergence angle of the outlet jet, jet penetration depth, and NO
x concentration in the flue gases.
In [
11], a novel combustion system was applied to a 600 MW down-fired boiler to reduce NO
x emissions without a noticeable increase in unburned carbon in fly ash. The system involved relocating the burners designed for lean fuel combustion from the arches to the front and rear walls, redistributing staged air supply, and introducing separated overfire air (SOFA). Using numerical modeling, the authors evaluated the influence of SOFA location (at the arches, in the throat, and in the upper furnace region) on combustion characteristics and NO
x emissions.
In [
12] investigated the retrofit of an aging 500 MW tangentially fired coal boiler with high pollutant emissions to achieve low NO
x emissions while maintaining high combustion efficiency. The study assessed and analyzed the combustion and emission characteristics of five different layout configurations aimed at optimizing the position and injection direction of separated overfire air (SOFA) using computational fluid dynamics (CFD) modeling.
In [
13], optimization of air distribution was carried out for a proposed SOFA system in a 500 MW tangentially fired boiler consisting of 20 identical modules. The authors evaluated various ratios of burner secondary air, closely coupled overfire air (CCOFA), and SOFA. The results showed that increasing the overall overfire air ratio effectively suppressed NO formation in the burner zone but had a negative impact on boiler performance. Under moderate air staging conditions, NO reduction began between the CCOFA and SOFA levels; therefore, the overfire air distribution could be optimized to improve overall boiler performance.
Thus, studies conducted by various researchers worldwide have demonstrated that the use of OFA technology, in its various configurations, has become a standard approach for reducing NOx emissions in coal-fired boilers and can also be applied to existing units through retrofit measures.
In the present study, for the first time for the BKZ-75 boiler at the Shakhtinsk TPP plant (Kazakhstan), operating on high-ash coal from the Karaganda basin, a comprehensive numerical investigation of staged combustion with overfire air (OFA) supply was performed. A detailed parametric analysis was carried out by varying both the fraction of additional air (OFA = 5%, 10%, 15%, 18%, 20%, 25%, and 30%) and the vertical location of the OFA injectors (h = 0.165 m; 0.75 m; 1.3375 m; 2.25 m; 2.5 m; 8 m; 9.4 m; 10 m; 11 m; and 12 m). Qualitative and quantitative relationships were established between the OFA injector position, the degree of air staging, and their effects on the temperature field as well as on the formation of carbon monoxide and nitrogen oxides. These findings provide deeper insight into the mechanisms governing harmful emission formation during the combustion of high-ash pulverized coal.
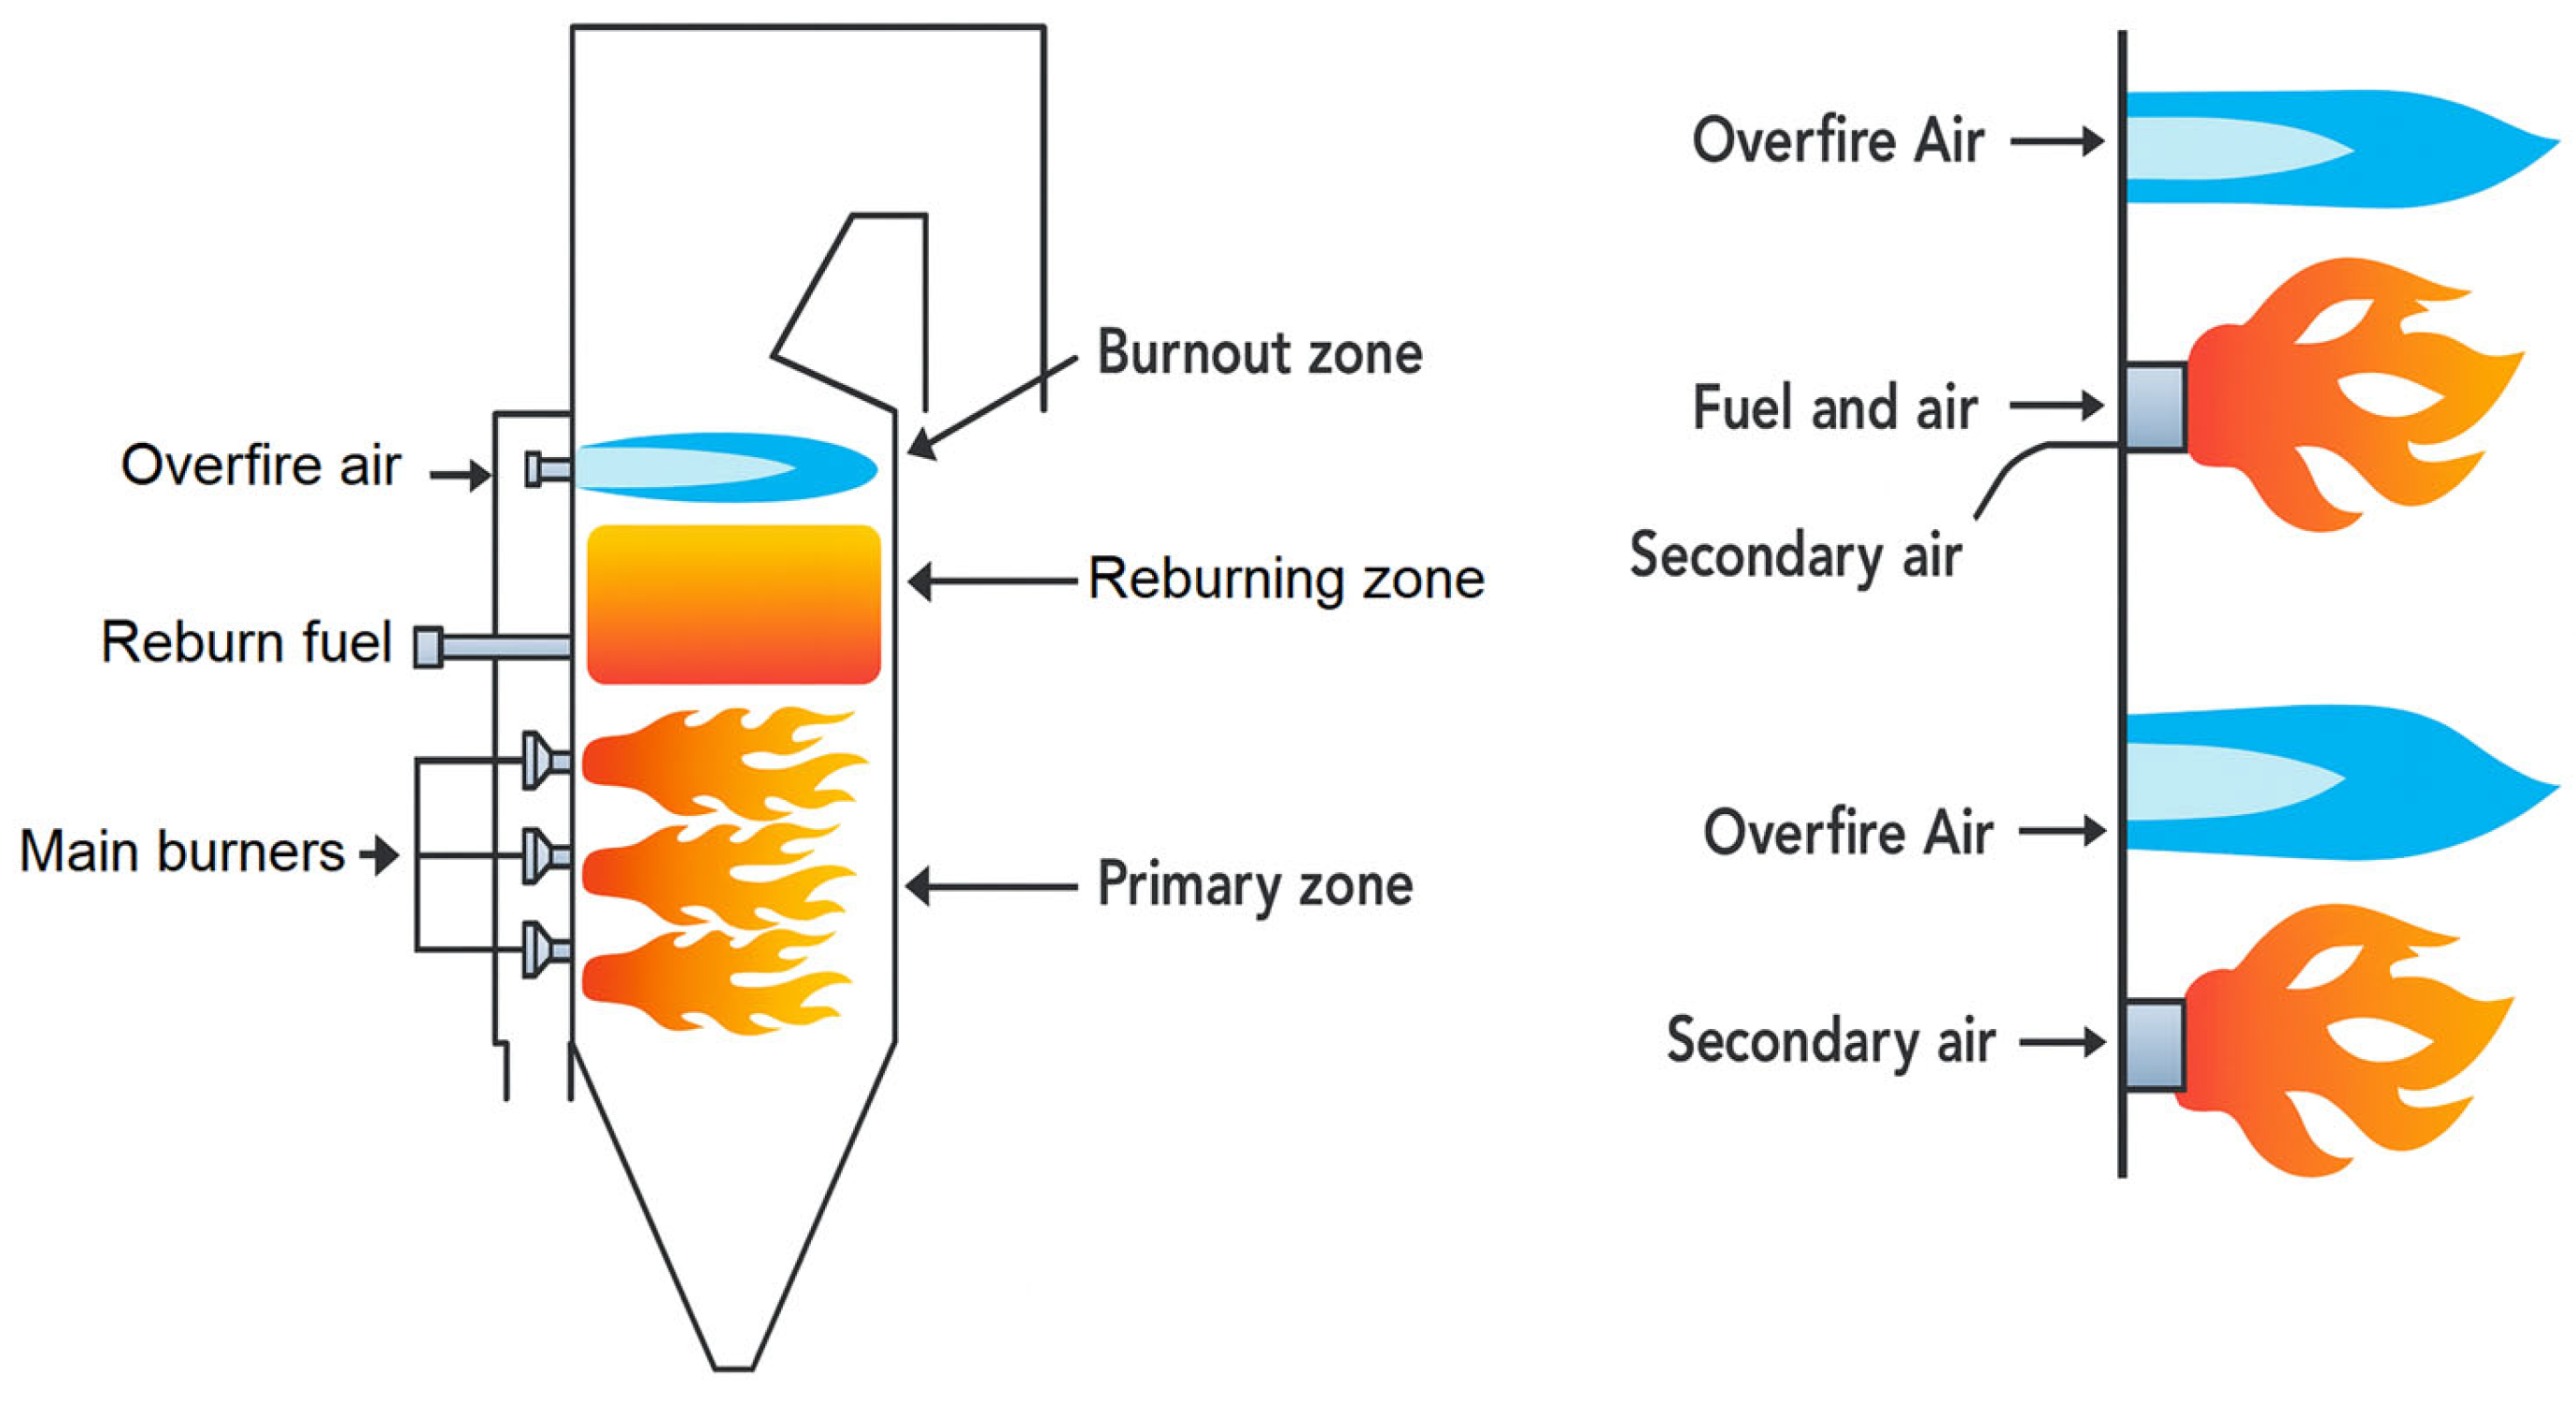
The essence of the OFA concept lies in dividing the combustion air into two streams. The primary air is supplied to the main combustion zone, while overfire air is injected at a higher level through dedicated injectors. As a result, two distinct zones are formed in the furnace: a fuel-rich (reducing) zone with limited oxygen availability, where NOx formation is suppressed, and a burnout zone with excess air, where fuel combustion is completed.
At an optimal OFA fraction (15–30% of the total air supply) and with proper injector placement, NO
x emissions can be reduced by 30–50% without an increase in unburned carbon losses [
14,
15]. The NO
x suppression mechanism involves several factors: reduction in peak flame temperatures, creation of a reducing atmosphere that promotes the conversion of NO
x to N
2, and a decrease in oxygen concentration in the zone where fuel-bound nitrogen is released.
Various OFA injection schemes and injector designs (
Figure 1) allow engineers to tailor air supply strategies, maximizing NO
x reduction while maintaining high combustion efficiency. OFA effectively represents a two-stage combustion process: the first stage limits NO
x formation, and the second stage ensures complete and clean fuel burnout, making this technology one of the most efficient approaches for low-emission coal combustion.
In accordance with the above, the aim of this study is to numerically investigate the effectiveness of applying OFA technology in the BKZ-75 pulverized coal boiler at the Shakhtinsk TPP plant in order to reduce harmful emissions during the combustion of high-ash Kazakh coal. To achieve this goal, the following scientific objectives are addressed: (1) determination of rational parameters for the placement of OFA injectors and the optimal OFA fraction that ensure maximum reduction of carbon monoxide and nitrogen oxide emissions without deterioration of combustion conditions; and (2) development of scientifically substantiated recommendations for the retrofit of existing pulverized coal boilers at thermal power plants in Kazakhstan to improve their environmental performance.
This paper examines the application of modern information technologies, digital models (digital twins), and 3D computational modeling methods to implement staged combustion technology using the Overfire Air method in the furnace chamber of the BKZ-75 boiler at the Shakhtinsk TPP plant. The obtained results make it possible to optimize the combustion processes of high-ash thermal coal, reduce particulate and gaseous emissions into the atmosphere, and establish a scientific and technical basis for the subsequent implementation of “clean energy” technologies at other coal-fired combined heat and power plants.
2. Materials and Methods
2.1. Mathematical Model
This study uses coupled models that include equations for mass, momentum, energy, and gas component concentrations to simulate heat and mass transfer, along with physicochemical processes in high-temperature combustion. It accounts for turbulence, multiphase combustion, chemical reactions, and radiant heat transfer. Overall, the system of equations is organized as follows [
16,
17,
18,
19,
20,
21]:
where
—transport variable (
u,
v,
w,
T,
C,
k,
),
—exchange rate,
—source term that takes into account chemical reactions, radiation, and interfacial interactions.
The numerical solution employs the finite volume method, which the authors have previously used successfully to study high-ash coal combustion at Kazakh thermal power plants [
22,
23,
24]. Turbulence is modeled through the standard k-ε model, where ‘k’ denotes turbulence kinetic energy and ‘ε’ signifies its dissipation rate.
The k-ε constants of the turbulence model have the following values: Cε1 = 1.44; Cε2 = 1.92; Cμ = 0.09; σk = 1.0; σε = 1.3.
A simplified kinetic scheme with integral reactions ending in final products is employed to simulate combustion. This approach reduces computational costs while still providing acceptable accuracy.
In modeling the processes occurring in the furnace of the studied boiler, the combustion process was considered in the following stages: pyrolysis with volatile release and formation of char residue, combustion of volatile matter, and combustion of carbon monoxide and char. When selecting pyrolysis and combustion models, the authors avoided the use of complex multi-component systems. In this study, a single-step pyrolysis model, as described in [
25], was employed.
During the pyrolysis process, volatile matter was treated as fictitious hydrocarbons, and the combustion rate of the pyrolysis products was determined using the Eddy Dissipation Model (EDM) concept proposed by Magnussen and discussed in detail in Ref. [
26]. These models have proven to be reliable and represent an excellent compromise for reducing computational costs [
27].
Initial conditions (t = 0): all velocities u = v = w = 0, excess pressure P = 0, other variables are taken as zero or taken from the convergent solution of previous calculations.
Boundary conditions:
At the entrance: ui—velocity values, cβ—initial concentration of each component, enthalpy h = cp·T determined by the flow temperature at the inlet, , where —degree of turbulence. , where Lm = 0.03 (4S/P), P—perimeter of the control volume at the entrance, S—its area.
At the exit: , , , ; .
In the plane of symmetry there is:
On a hard surface (the walls of the combustion chamber):
Boundary conditions for wall temperature are usually defined either by the wall temperature Tw or by the heat flux .
These models and methods provide a dependable representation of furnace processes with moderate computational effort.
2.2. Chemical Kinetics Model in Coal Combustion
In modeling the processes occurring in the furnace of the studied boiler, combustion was considered in the following stages: pyrolysis, with the release of volatile matter and formation of char; combustion of volatile products and carbon monoxide; and combustion of the char residue. The chemical model of pulverized coal combustion accounts for the overall oxidation reactions of fuel components to stable final products [
16,
20,
21].
Char combustion occurs more slowly than the combustion of volatiles and determines the overall burnout time of the fuel, which for pulverized coal is on the order of several seconds. The reaction mechanism is complex and multi-stage, with heterogeneous reactions on the particle surface playing a significant role and homogeneous reactions occurring in the gas phase (Equations (5)–(12)).
In heterogeneous reactions, oxides are formed on the surface of the char particles. At 926 °C, CO and CO2 are produced in approximately equal amounts, while an increase in temperature accelerates the oxidation rate of CO. The formation of harmful substances is accounted for in the reaction-kinetic models, including intermediate products and the direct reaction of CO with O2.
Atomic oxygen (O) does not initiate rapid chain reactions, but even a small amount of H2 generates OH radicals. CO2 formation occurs in two stages: first, the fuel decomposes into CO and H2O, and then CO is oxidized to CO2. At high temperatures and with abundant oxygen, the process is accelerated and can proceed as a single-step reaction, directly forming CO2.
In furnace chambers, calculating CO2 emissions is a complex task. Sulfur in coal occurs in the form of pyrite, organically bound sulfur, and sulfates. At the initial stage of combustion, sulfur-containing compounds form sulfur monoxide (SO), which is subsequently oxidized to sulfur dioxide (SO2). Upon contact with atmospheric moisture, SO2 converts into sulfurous acid (H2SO3).
A portion of the sulfur dioxide in the air is further oxidized to sulfur trioxide (SO3) (Equation (14)). It then reacts with water vapor to form sulfuric acid (H2SO4), which, like SO2, dissolves in atmospheric moisture (Equation (15)).
During coal combustion, the majority of nitrogen oxides are produced from fuel nitrogen (fuel NOx), while a smaller portion originates from atmospheric nitrogen (thermal NOₓ). The model accounts for volatile release, combustion of hydrocarbons and char, as well as NOₓ formation. During the decomposition of coal particles, approximately 80% of the nitrogen is released into the gas phase as cyanides, which are then converted into amines and subsequently either form NO or are reduced to N2.
Additionally, the following reactions occur: formation of HCN as a result of the interaction between hydrocarbons and NO:
and the heterogeneous reaction between NO and the char particle:
The remaining 20% of nitrogen is oxidized directly to NO at a rate proportional to the char burnout rate.
For the NOₓ formation model, it is necessary to determine the reaction rates affecting the concentrations of NH3, HCN, NO, O2, char, and volatile matter. Nitrogen oxides are among the most toxic emissions, so reducing their concentration at the furnace outlet is a critical task in coal combustion at thermal power plants.
2.3. Physical and Digital Models of Processes in the Combustion Chamber
The study examined the combustion chamber of the BKZ-75 boiler at Shakhtinsk TPP in Kazakhstan, which has a steam capacity of 75 tons per hour. The boiler is designed in a U-shape [
22,
23,
24]. Inside the combustion chamber, there are four pulverized coal burners positioned on the front and rear walls, arranged in a single tier with two burners on each wall. Each burner can produce 3.2 tons per hour when burning Karaganda coal of the KR-200 type, characterized by an ash content of 35.1%, a fineness R
90 of 20%, a coal density of 1350 kg/m
3, and a calorific value of coal is 1.8548 × 10
7 J/kg. The
Table 1,
Table 2 and
Table 3 present the main technical specifications of the boiler along with details about the fuel composition.
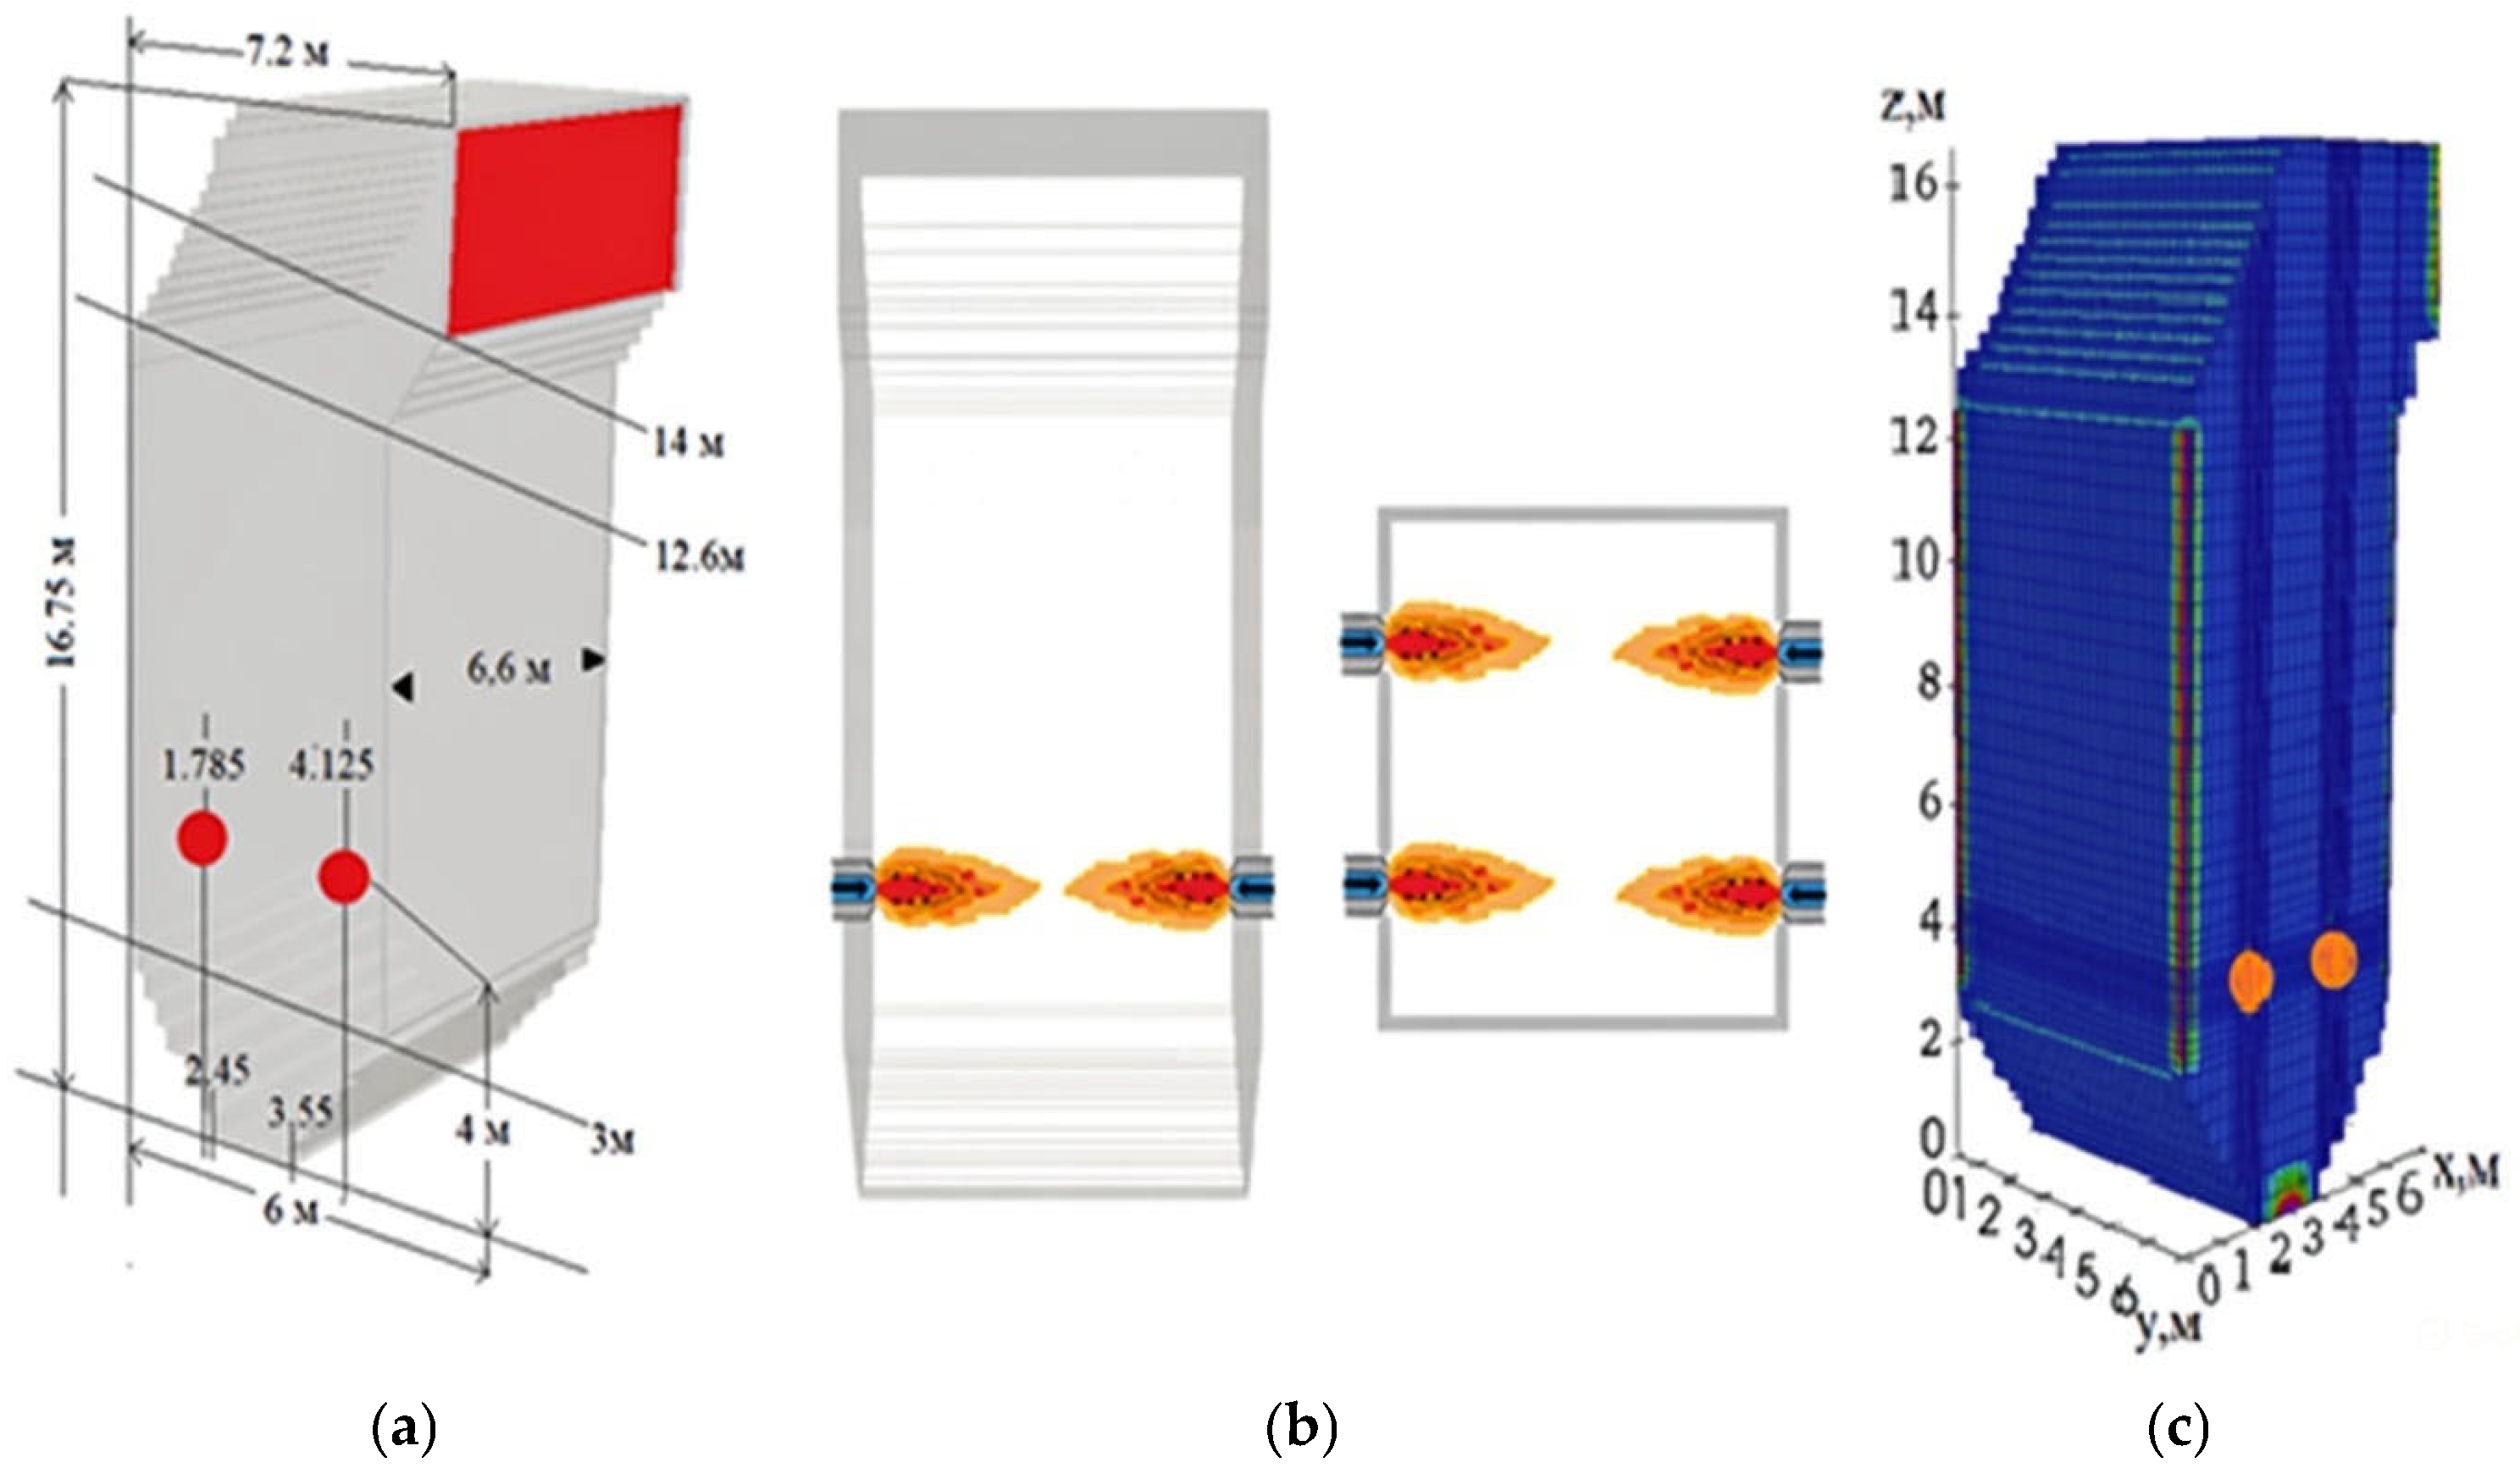
A 3D digital model of the BKZ-75 boiler’s combustion chamber was created, precisely representing its real dimensions and the placement of burner devices during operation at the Shakhtinsk TPP: four direct-flow pulverized coal burners arranged in a single tier, with two on opposite walls. All process parameters, including dust-air mixture and air supply, are considered (
Figure 2).
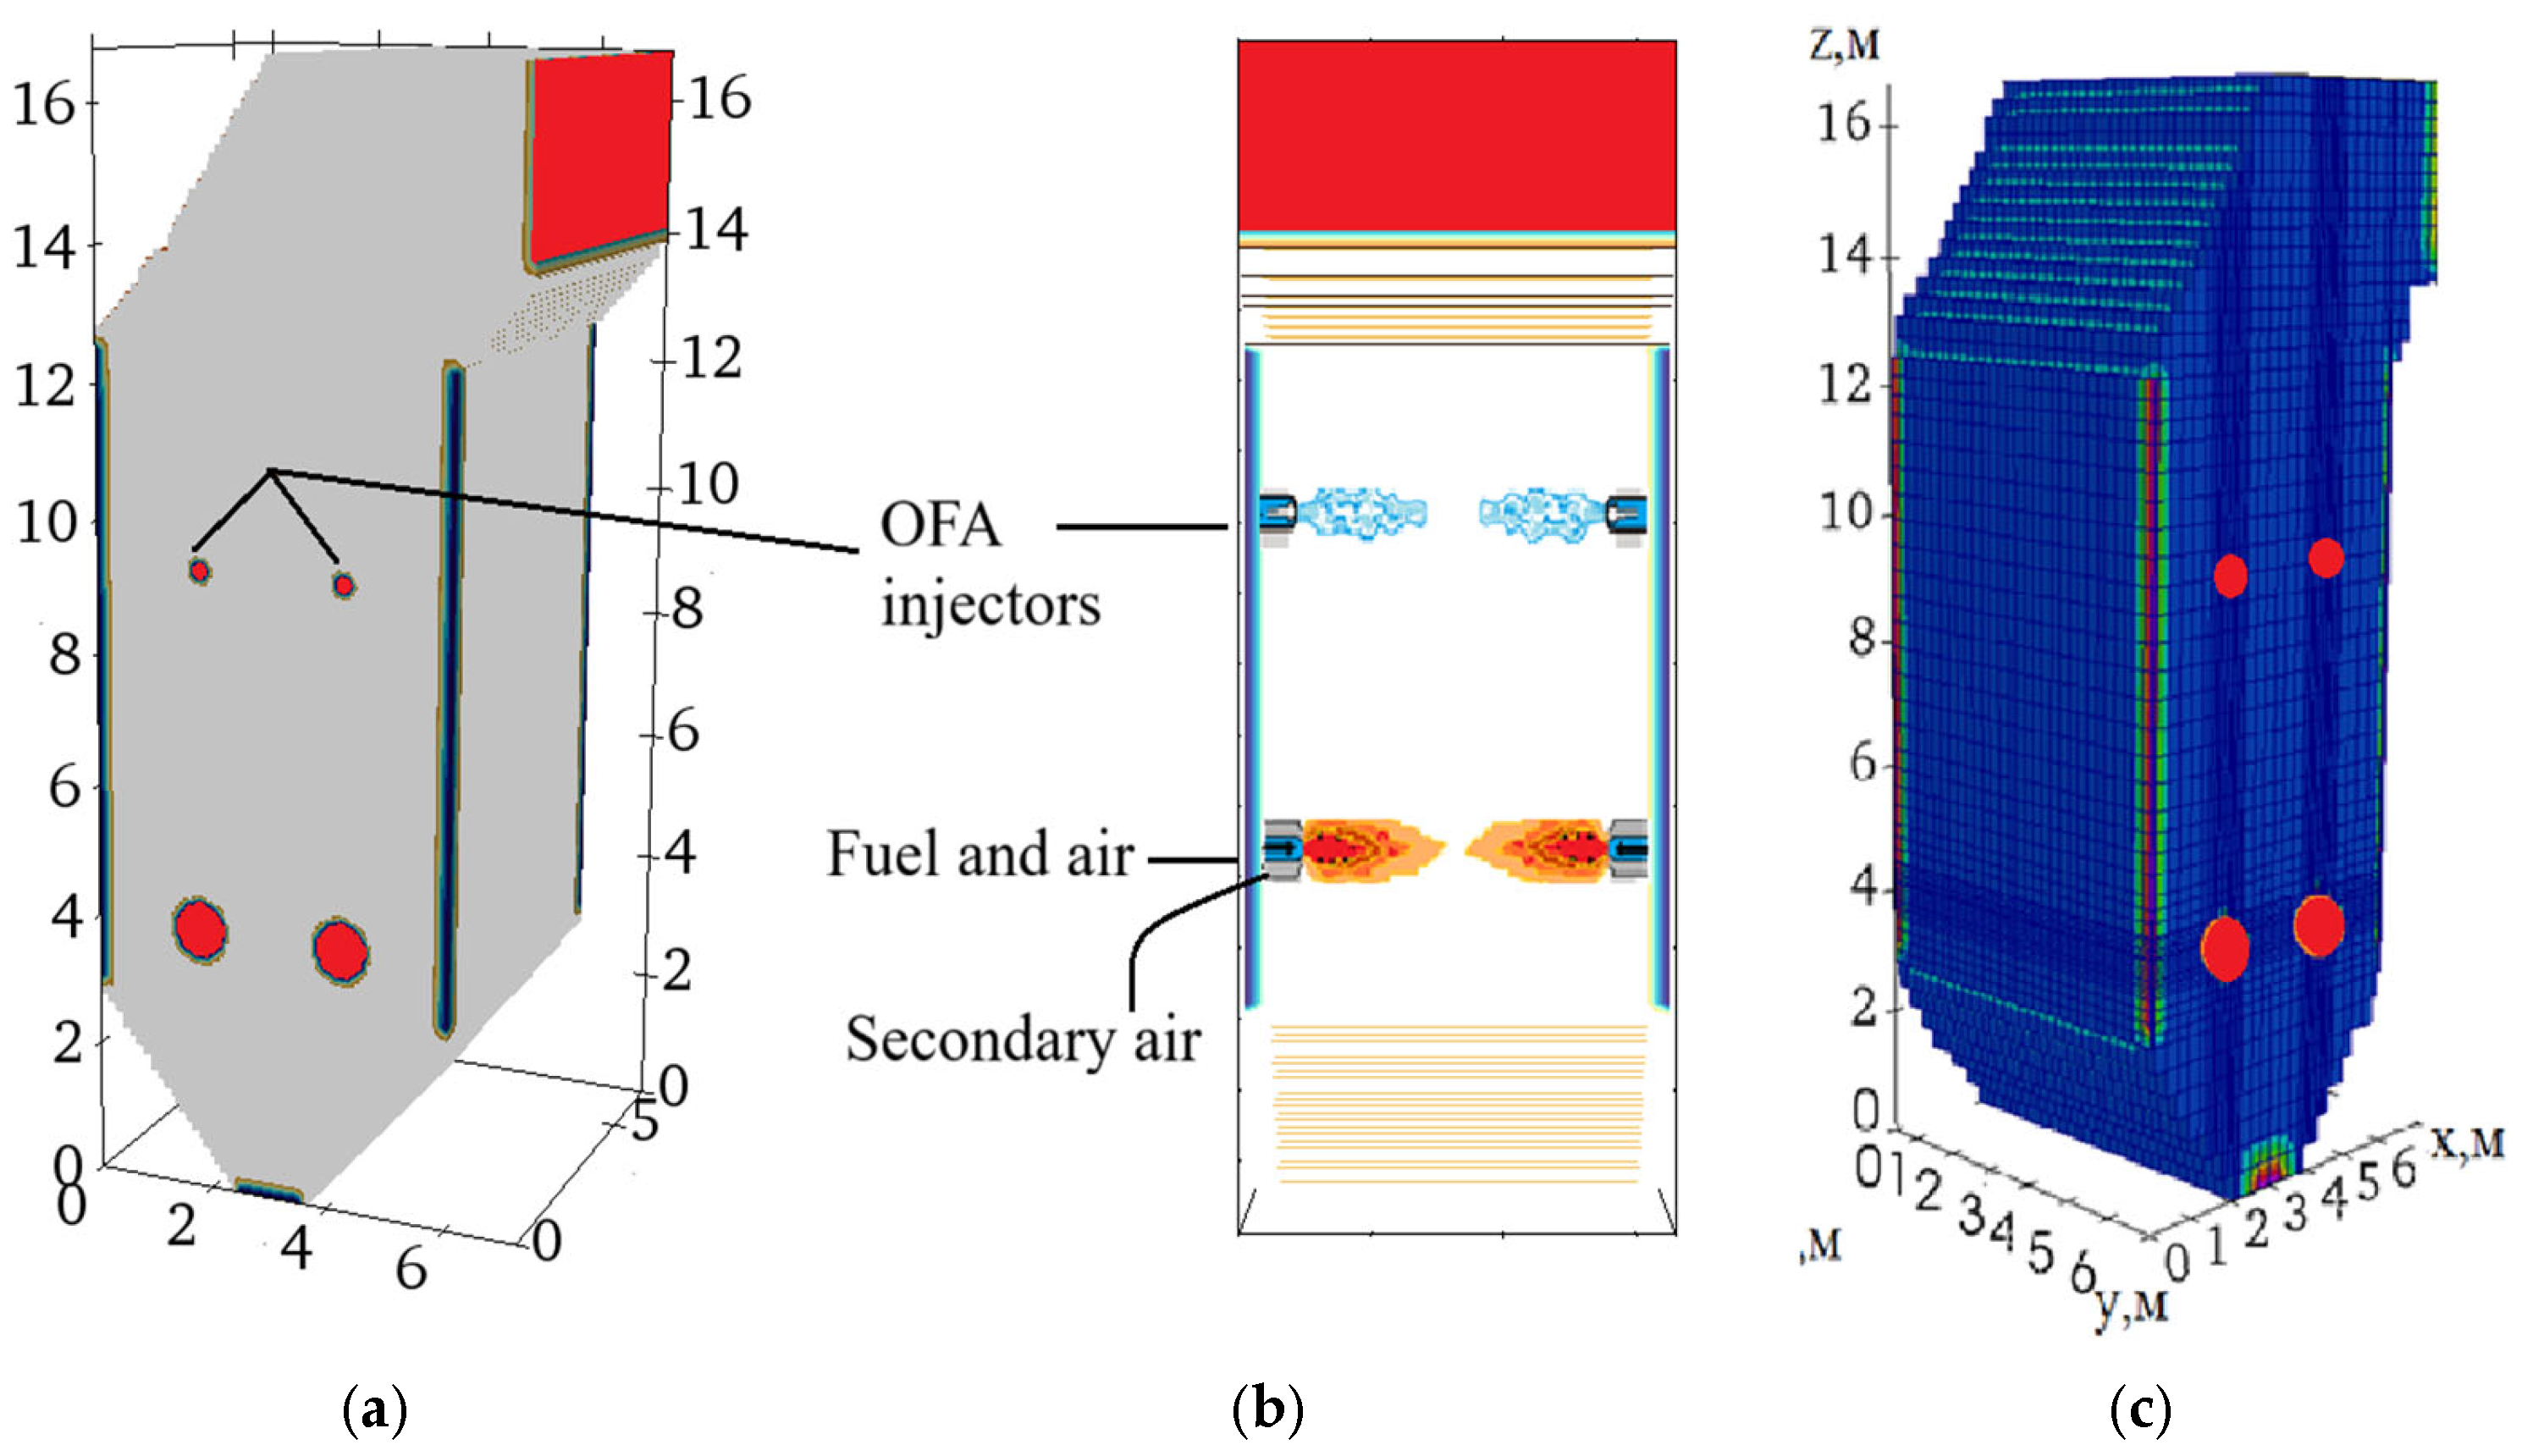
Figure 3 illustrates a general view of the BKZ-75 boiler’s combustion chamber (
Figure 3a), the arrangement of burner devices with injectors implementing two-stage combustion technology (
Figure 3b), and the division of the chamber into control volumes for numerical analysis (
Figure 3c).
The finite-difference grid has dimensions of 90 × 32 × 158 along the X, Y, and Z axes, resulting in 455040 control volumes. Condensation takes place in the fuel and air inlet zones as well as near the walls, providing high modeling accuracy with moderate computational effort costs.
For the computational experiments aimed at investigating heat and mass transfer processes in the furnace of a thermal power plant boiler, the FLOREAN 5.0 computer system, developed in Germany, was used as the primary software tool [
20,
21,
28,
29,
30]. This software is designed for comprehensive numerical modeling of reacting multiphase flows in domains with realistic geometries and is widely applied in the analysis of heat and mass transfer processes in the combustion chambers of various thermal power units.
Within the scope of this study, a methodology was developed to adapt the FLOREAN software system to the operating conditions in the Republic of Kazakhstan. The need for such adaptation is due to significant differences between Kazakh and German coals, primarily the high ash content of Kazakh fuel, reaching up to 50%, compared to approximately 8% for German coal, as well as differences in the design parameters of furnace chambers, types of burners, and methods of fuel and oxidizer supply. As a result, the original version of the FLOREAN software package was modified, expanded, and tested, enabling numerical experiments on the combustion of high-ash coal at Kazakh thermal power plants.
When implementing staged combustion, the primary parameters are the height of the OFA injectors and the flow rate of the Overfire Air (OFA). These influence the reduction in harmful emissions such as carbon and nitrogen oxides while maintaining boiler stability. The optimal placement of the OFA nozzles and airflow depends on the specific geometry and aerodynamics of the chamber. The OFA must adequately mix with incomplete combustion products and complete afterburning, located high enough above the burners to establish a reducing atmosphere in the primary zone and ensure thorough fuel burnout. This study utilized digital models of the combustion chamber and CFD techniques to perform a parametric analysis to determine the ideal height, h, of the OFA nozzles. The proposed injector placement options in the BKZ-75 boiler furnace included: h = 0.165 m; 0.75 m; 1.3375 m; 2.25 m; 2.5 m; 8 m; 9.4 m; 10 m; 11 m; 12 m.
This study investigated various air ratios supplied through OFA injectors to enable two-stage combustion. The control was conventional combustion without OFA (0%), while other options included OFA at 5%, 10%, 15%, 18%, 20%, 25%, and 30% of the total air supply.
Table 4 presents the calculated secondary air mass flow rates through the OFA nozzles for all the studied case modes.
3. Results
The research included a detailed analysis of how the height of the OFA injectors and the volume of additional air supplied through them impact the thermal regime of the BZK-75 boiler furnace, as well as the completeness of fuel combustion and dust-gas emissions of nitrogen oxides (NO) and carbon monoxide (CO). Model calculations and results demonstrated that altering OFA input parameters has a significant influence on temperature zone formation, mixture formation characteristics, reduction process development, and burnout efficiency. The findings reveal optimal air supply modes that reduce CO and NO emissions while maintaining stable combustion product temperatures, thereby enhancing both ecological and energy efficiency.
3.1. The Effect of the Installation Height of OFA Injectors on the Temperature and the Concentrations of NO and CO at the Furnace Outlet
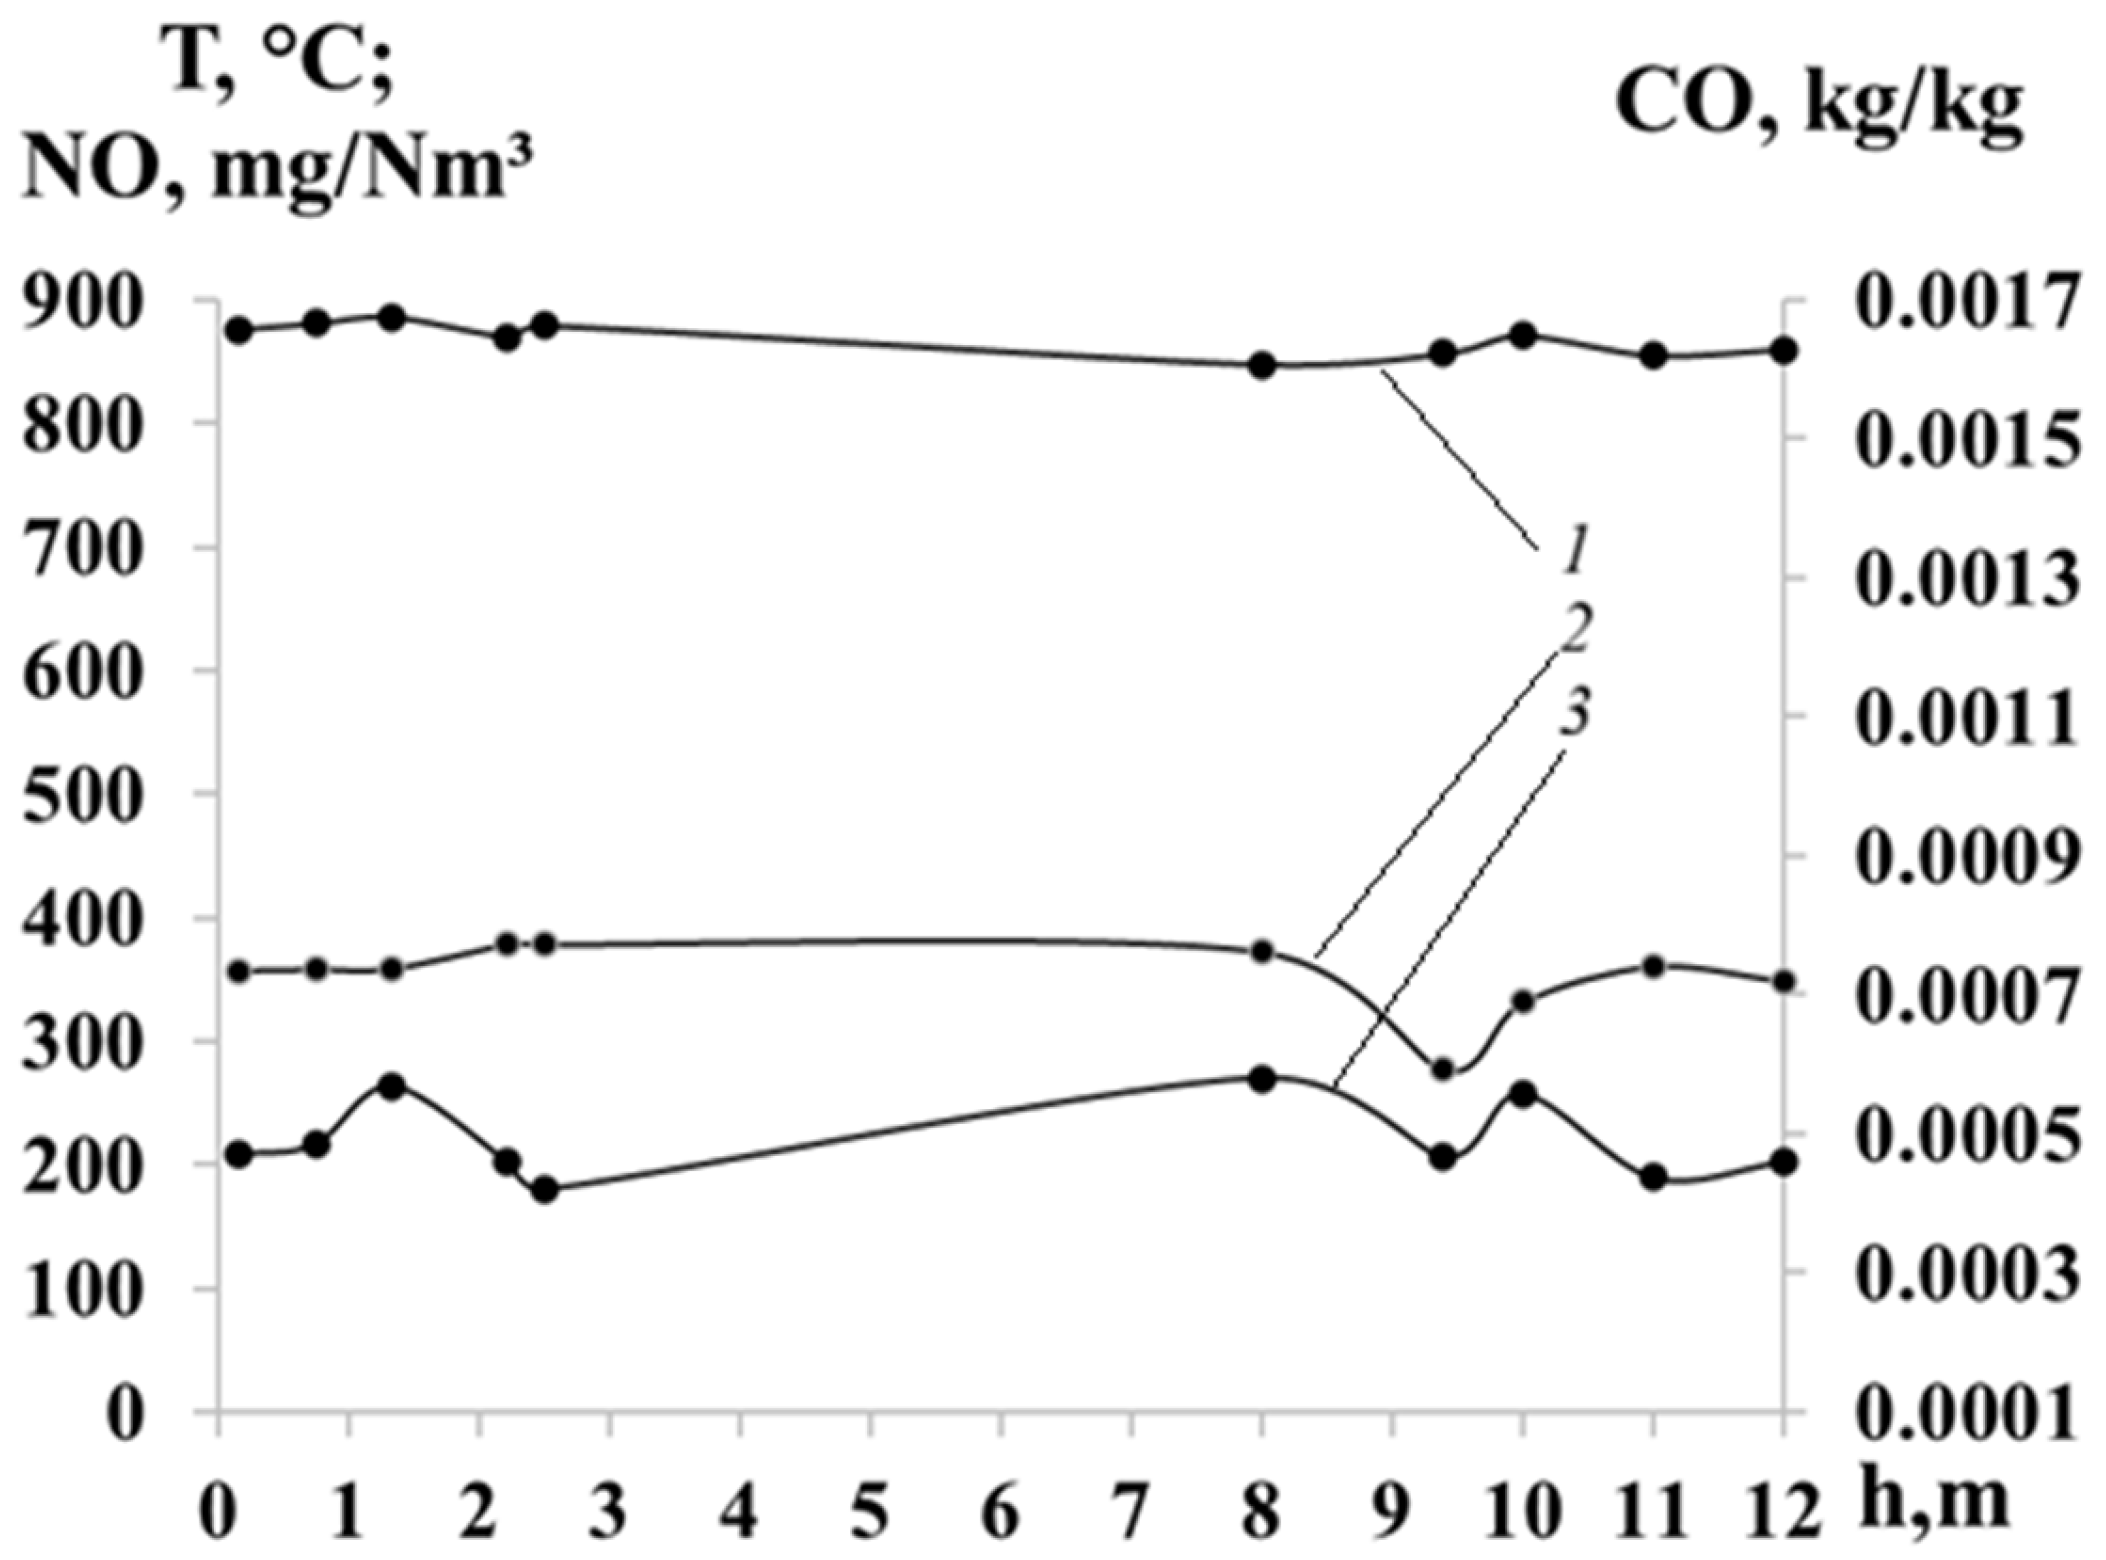
Figure 4 shows the dependence of the working medium temperature (curve 1), the concentrations of nitrogen oxide NO (curve 2), and carbon monoxide CO (curve 3) at the outlet of the BZK-75 boiler furnace on the height h at which the OFA injectors are located. Changing the height of the additional air supply significantly affects the temperature T in the burnout zone, the processes of NOₓ formation, and the completeness of fuel combustion.
As shown in the figure, the average temperature values (
Figure 4, curve 1) at the furnace outlet remain relatively stable, around 820–870 °C, regardless of the injector height. Small fluctuations of 30–40 °C may be due to shifts in air and fuel flow distributions, changes in mixing in the upper furnace zone, or local variations in heat release. The lack of sudden temperature shifts suggests that repositioning the OFA injectors within a reasonable range does not significantly disturb the furnace’s thermal performance regime.
The concentration of nitrogen oxide NO (
Figure 4, curve 2) at the outlet from the furnace space demonstrates an average level of about 350–400 mg/Nm
3, with a tendency to decrease in the height range of 8–9.4 m. This can be explained by the formation of a more pronounced reduction zone beneath the injectors, an increase in the interaction time of combustion products with volatile reducers (CO, hydrocarbons), as well as effective partial cooling of the thermal NO formation zone.
After surpassing a height of approximately 10 m, the NO concentration begins to rise slightly. This suggests a decrease in regenerative reactions, improved after-burning efficiency, and a potential increase in temperature in the over-jet air zone.
The concentration of CO (
Figure 4, curve 3) is an indicator of the completeness of fuel combustion. The distribution analysis reveals characteristic features:
At low injector placement (h = 1–3 m), the CO concentration increases—incomplete combustion occurs due to early interference of air flows into the flame;
In the interval h = 8–9.4 m, the concentration of CO is minimal, indicating the most efficient combustion and optimal turbulent mixing;
With further increase in height (h ≥ 10 m), the concentration of CO rises again: the over-fuel air is supplied too high, the afterburning zone shifts upwards, and some CO does not have time to oxidize.
The behavior of CO aligns with that of NO, confirming the presence of an optimal height h for installing OFA injectors.
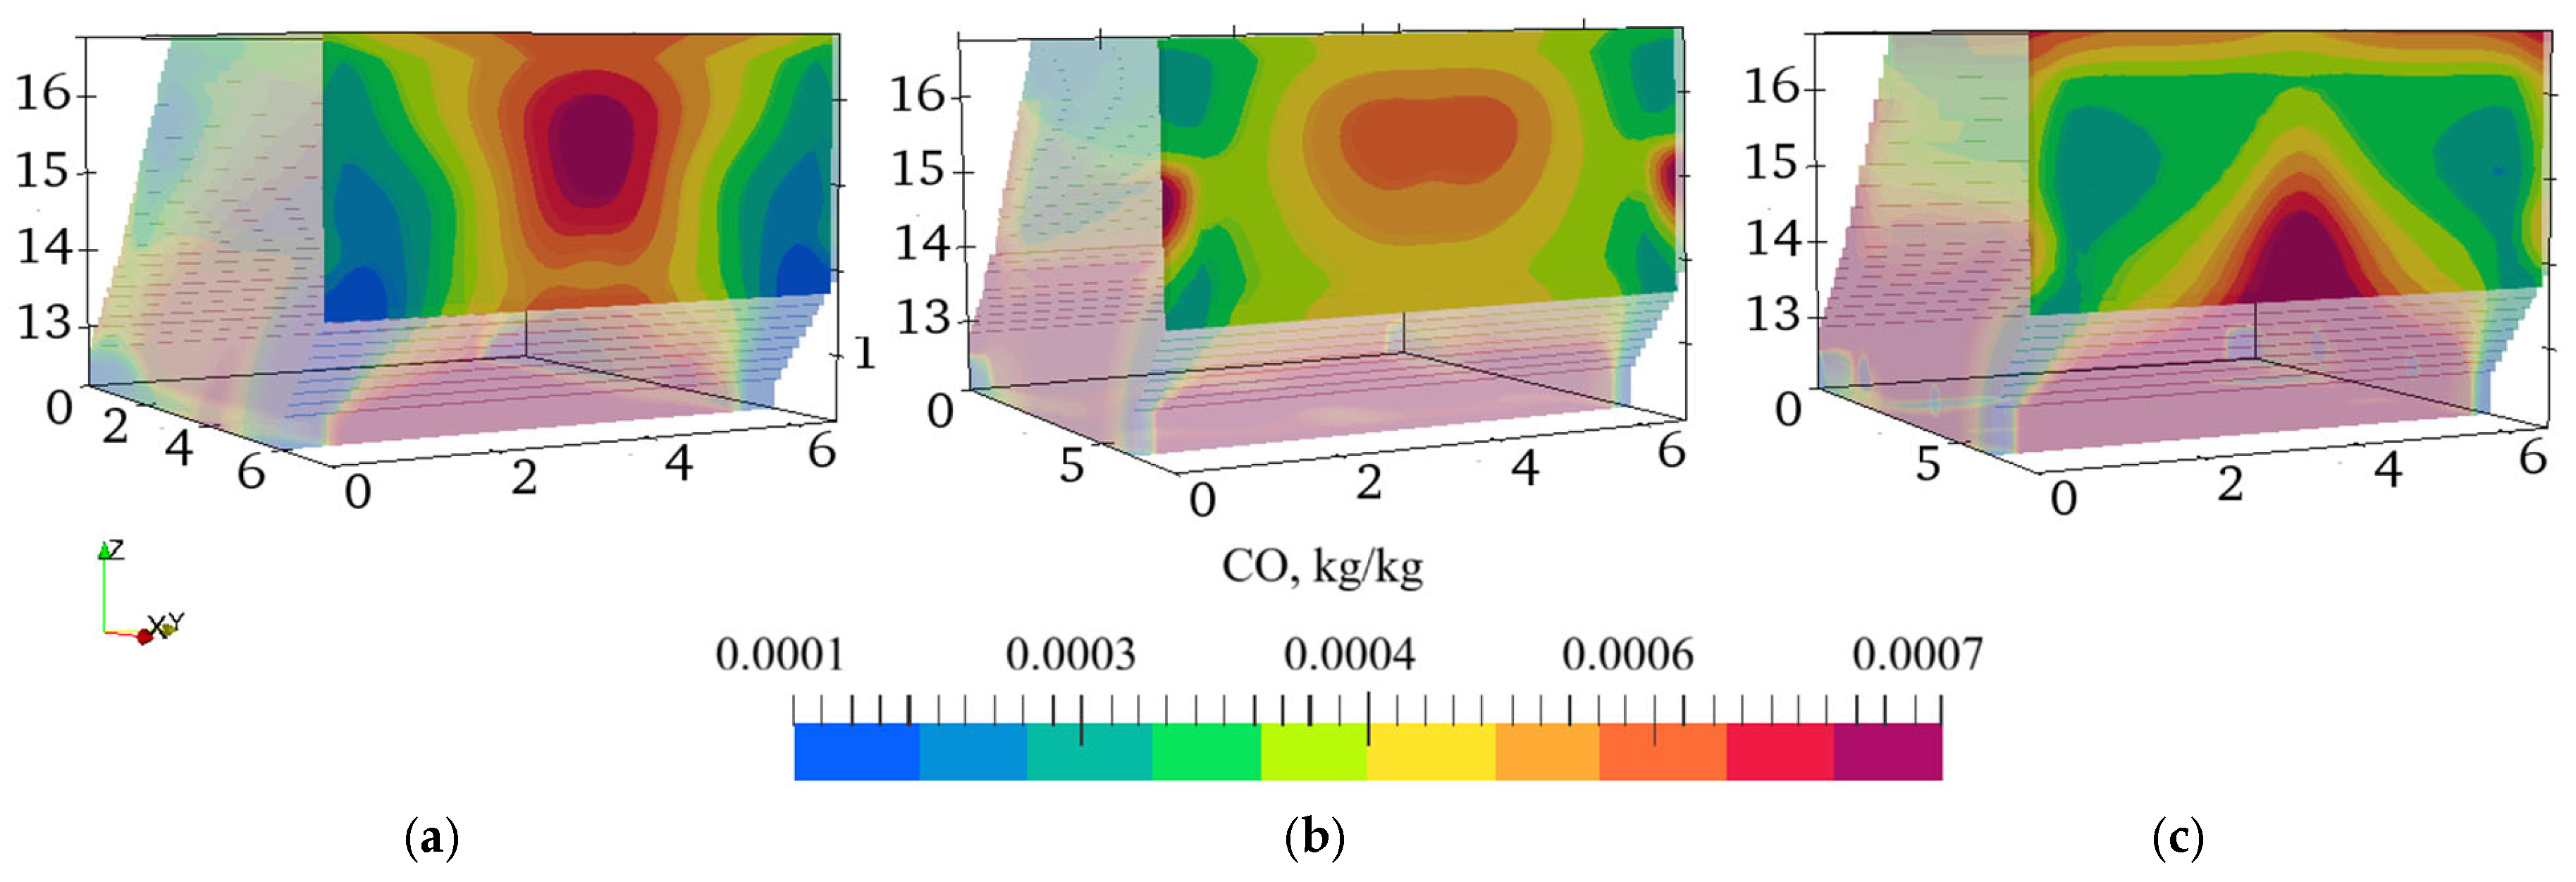
Figure 5 compares CO concentration distributions in the BKZ-75 boiler’s outlet section for three different OFA-injector heights. A consistent color scale (from 1 × 10
−4 to 7 × 10
−4 [kg/kg]) was applied across all cases, enabling an accurate comparison of results.
Analysis of
Figure 5a reveals that installing OFA injectors at a height of 2.25 m results in the most noticeable heterogeneity in concentration flow. In this scenario, a zone with elevated CO levels develops in the central part of the combustion chamber, reaching nearly the upper limit of acceptable levels at 0.00079 kg/kg. This zone has a well-defined local maximum and spans a significant portion of the cross-sectional height. Such a distribution suggests inadequate mixing of fuel and secondary air when the OFA injectors are placed too low, leading to zones of incomplete combustion and increased local CO accumulation.
From
Figure 5c, it is evident that the region of increased CO concentration shifts downward and partially moves towards the center of the furnace. The peak values again approach the upper scale limit—0.00095 kg/kg—but their distribution differs from the first case. It appears more vertically stretched and less sharply defined, yet still indicates areas of local under-combustion. This pattern is characteristic of overly high OFA injector settings, where secondary air is introduced too late, creating an elongated zone of incomplete CO oxidation that is transported by the gas flow towards the upper part of the furnace.
When OFA injectors are installed at a height of h = 9.4 m (see
Figure 5b), the CO concentration distribution throughout the entire area studied is the most uniform. The figure shows that this distribution is notably smoother, with no distinct high-concentration zones, and the peak CO levels are considerably lower than in the other two scenarios. Most concentration values cluster around 0.00073 kg/kg on the scale. This configuration offers an optimal balance of aerodynamics and mixture formation: placing OFA at this height ensures efficient air distribution, better burnout of volatile components, and lower overall CO concentrations.
The second option, with the OFA injectors placed at a height of h = 9.4 m, offers the best mixture formation quality and the most complete CO oxidation. In contrast, the first and third options show drawbacks when the OFA is introduced too early or too late, respectively: they cause local zones with higher carbon monoxide concentrations, reduce the uniformity of the gas flow, and increase the amount of incomplete combustion.
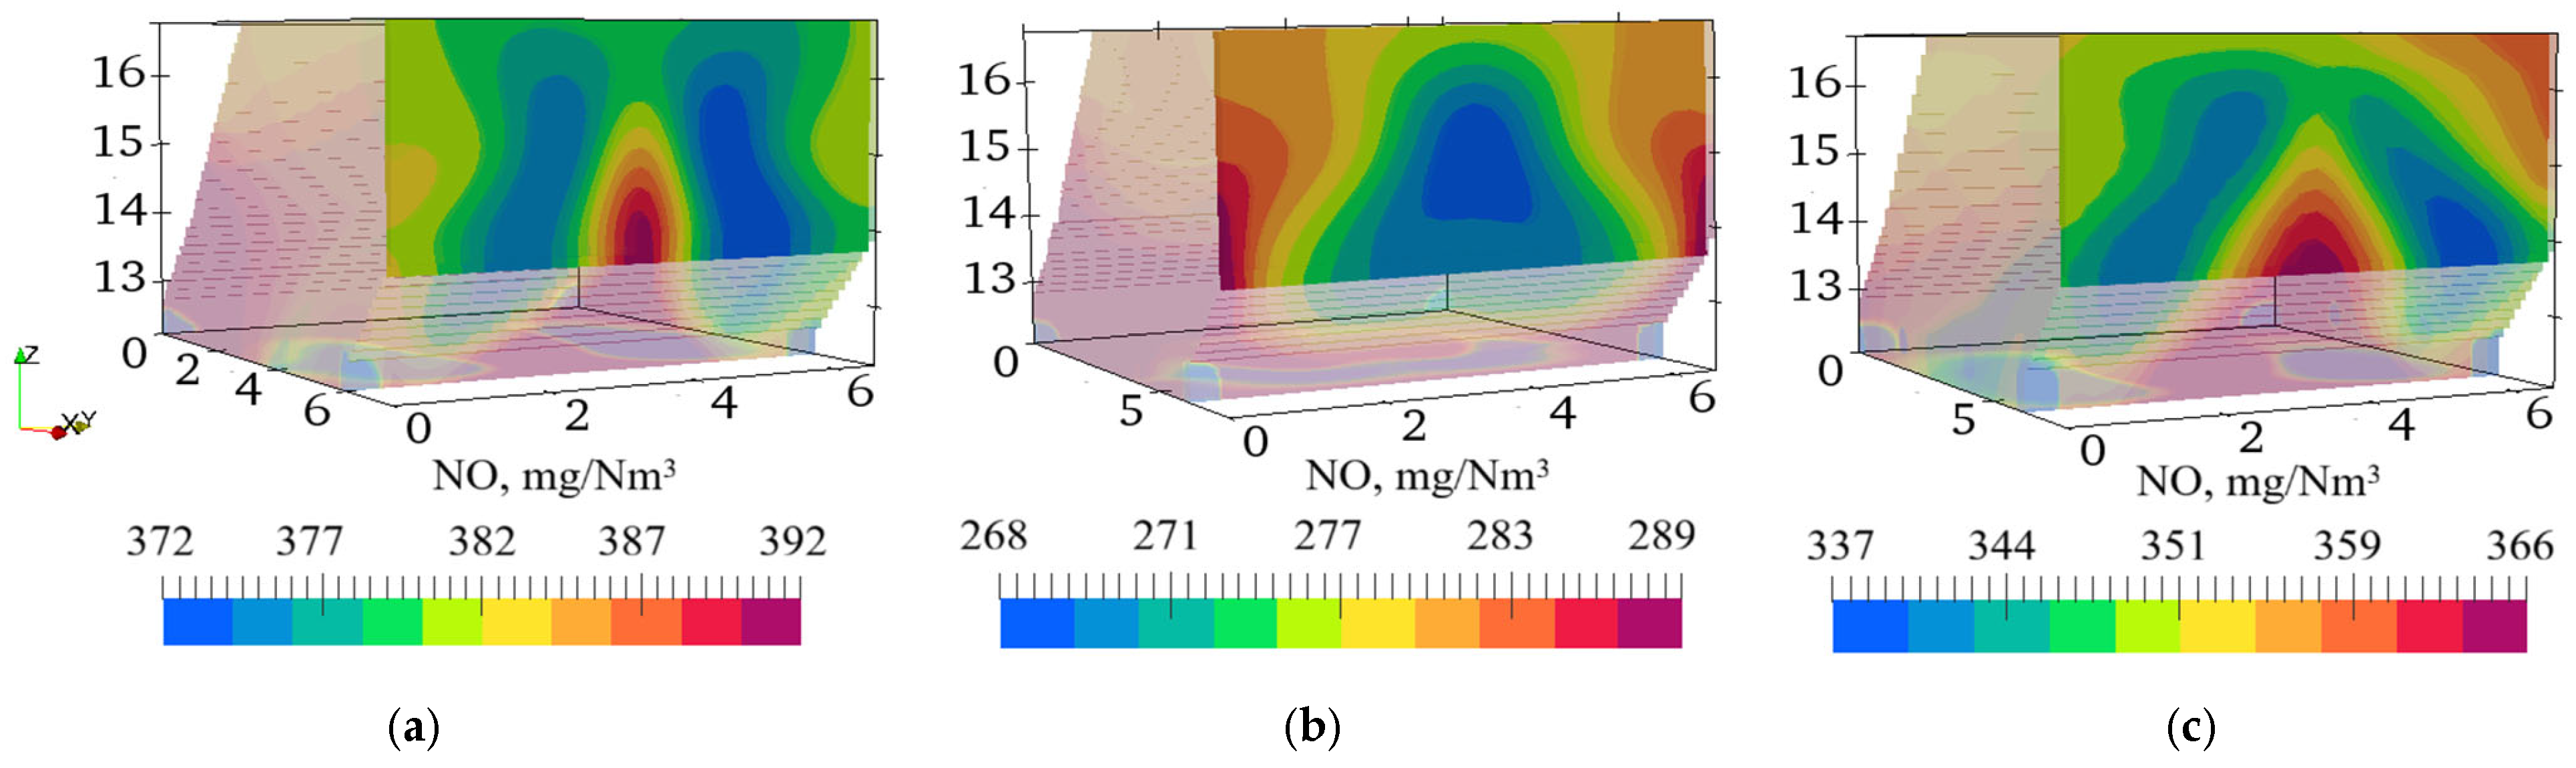
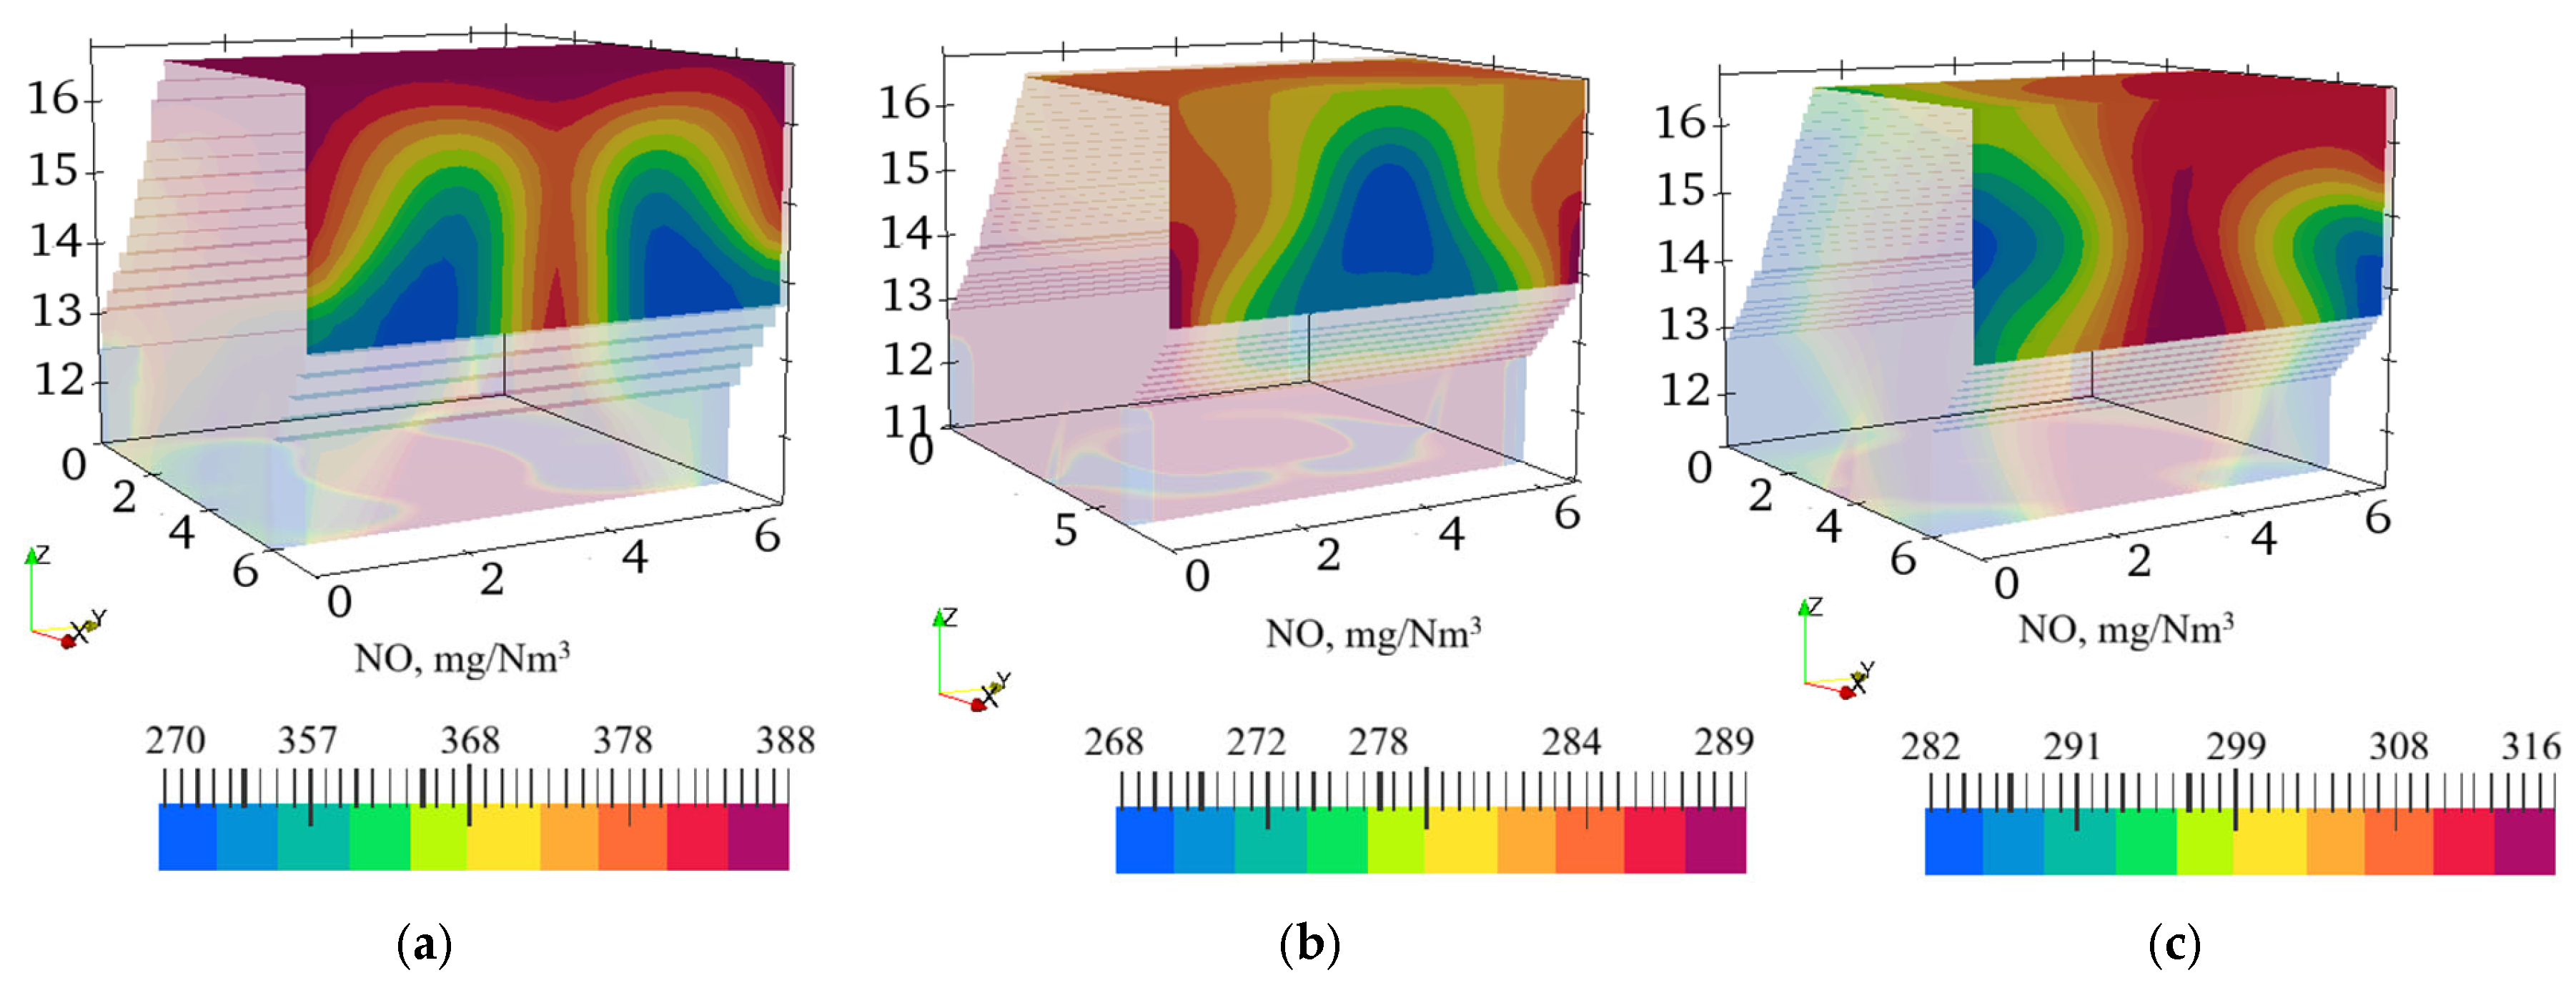
Figure 6 illustrates the nitrogen oxide (NO) concentration distributions at the furnace outlet of the BKZ-75 boiler for different heights (h) of the OFA injector installation.
The distributions of nitrogen oxide (NO) concentration shown in
Figure 6 demonstrate a significant influence of the additional air supply (OFA) mode on the intensity of NOₓ formation. Thus, in the first case (
Figure 6a), corresponding to a low height of the OFA system placement (h = 2.25 m), a pronounced zone of increased NO concentrations is formed, with maximum values of approximately 378.89 mg/Nm
3. This distribution is characterized by considerable heterogeneity and the presence of local maxima. It indicates a persistent area of elevated temperatures and insufficient efficiency of staged combustion, resulting in increased thermal NO formation.
In the second variant, corresponding to the middle position of the OFA (h = 9.4 m), areas of minimal NO levels emerge—277.12 mg/Nm3. Nitrogen oxide concentrations are more uniformly spread, lacking distinct peaks. This pattern results from the ideal mixing of combustion gases with overfire air, a decrease in temperature within the reaction zone, and the progression of reduction processes, all of which contribute to the most efficient suppression of nitrogen oxide formation.
In the third variant, where OFA injectors are placed at a high position (h = 12 m), NO concentrations reach intermediate levels, ranging from 337 to 366 mg/Nm3, with an average of 348.85 mg/Nm3. The distribution remains moderately heterogeneous, and areas of higher nitrogen oxide levels tend to shift towards the outer edges of the cross-section. Adding extra air at this height does not significantly improve the stable suppression of NO formation, as the reduction processes are confined within a limited zone volume.
The comparison of three options for supplying additional air reveals that the lowest NO concentrations occur at an average height of h = 9.4 m when placing OFA injectors. Both low and high placements of secondary air lead to increased NO formation, resulting from the premature or delayed development of low-temperature zones and inadequate reduction processes.
Table 5 presents quantitative data on temperature, carbon oxide, and nitrogen oxide concentrations across different modes, with heights h ranging from 0.165 m to 12 m.
3.2. The Dependence of the Temperature T of Combustion Products, as Well as the Concentrations of Carbon Oxides CO and Nitrogen NO on the Volume of Air Supplied Through OFA Injectors
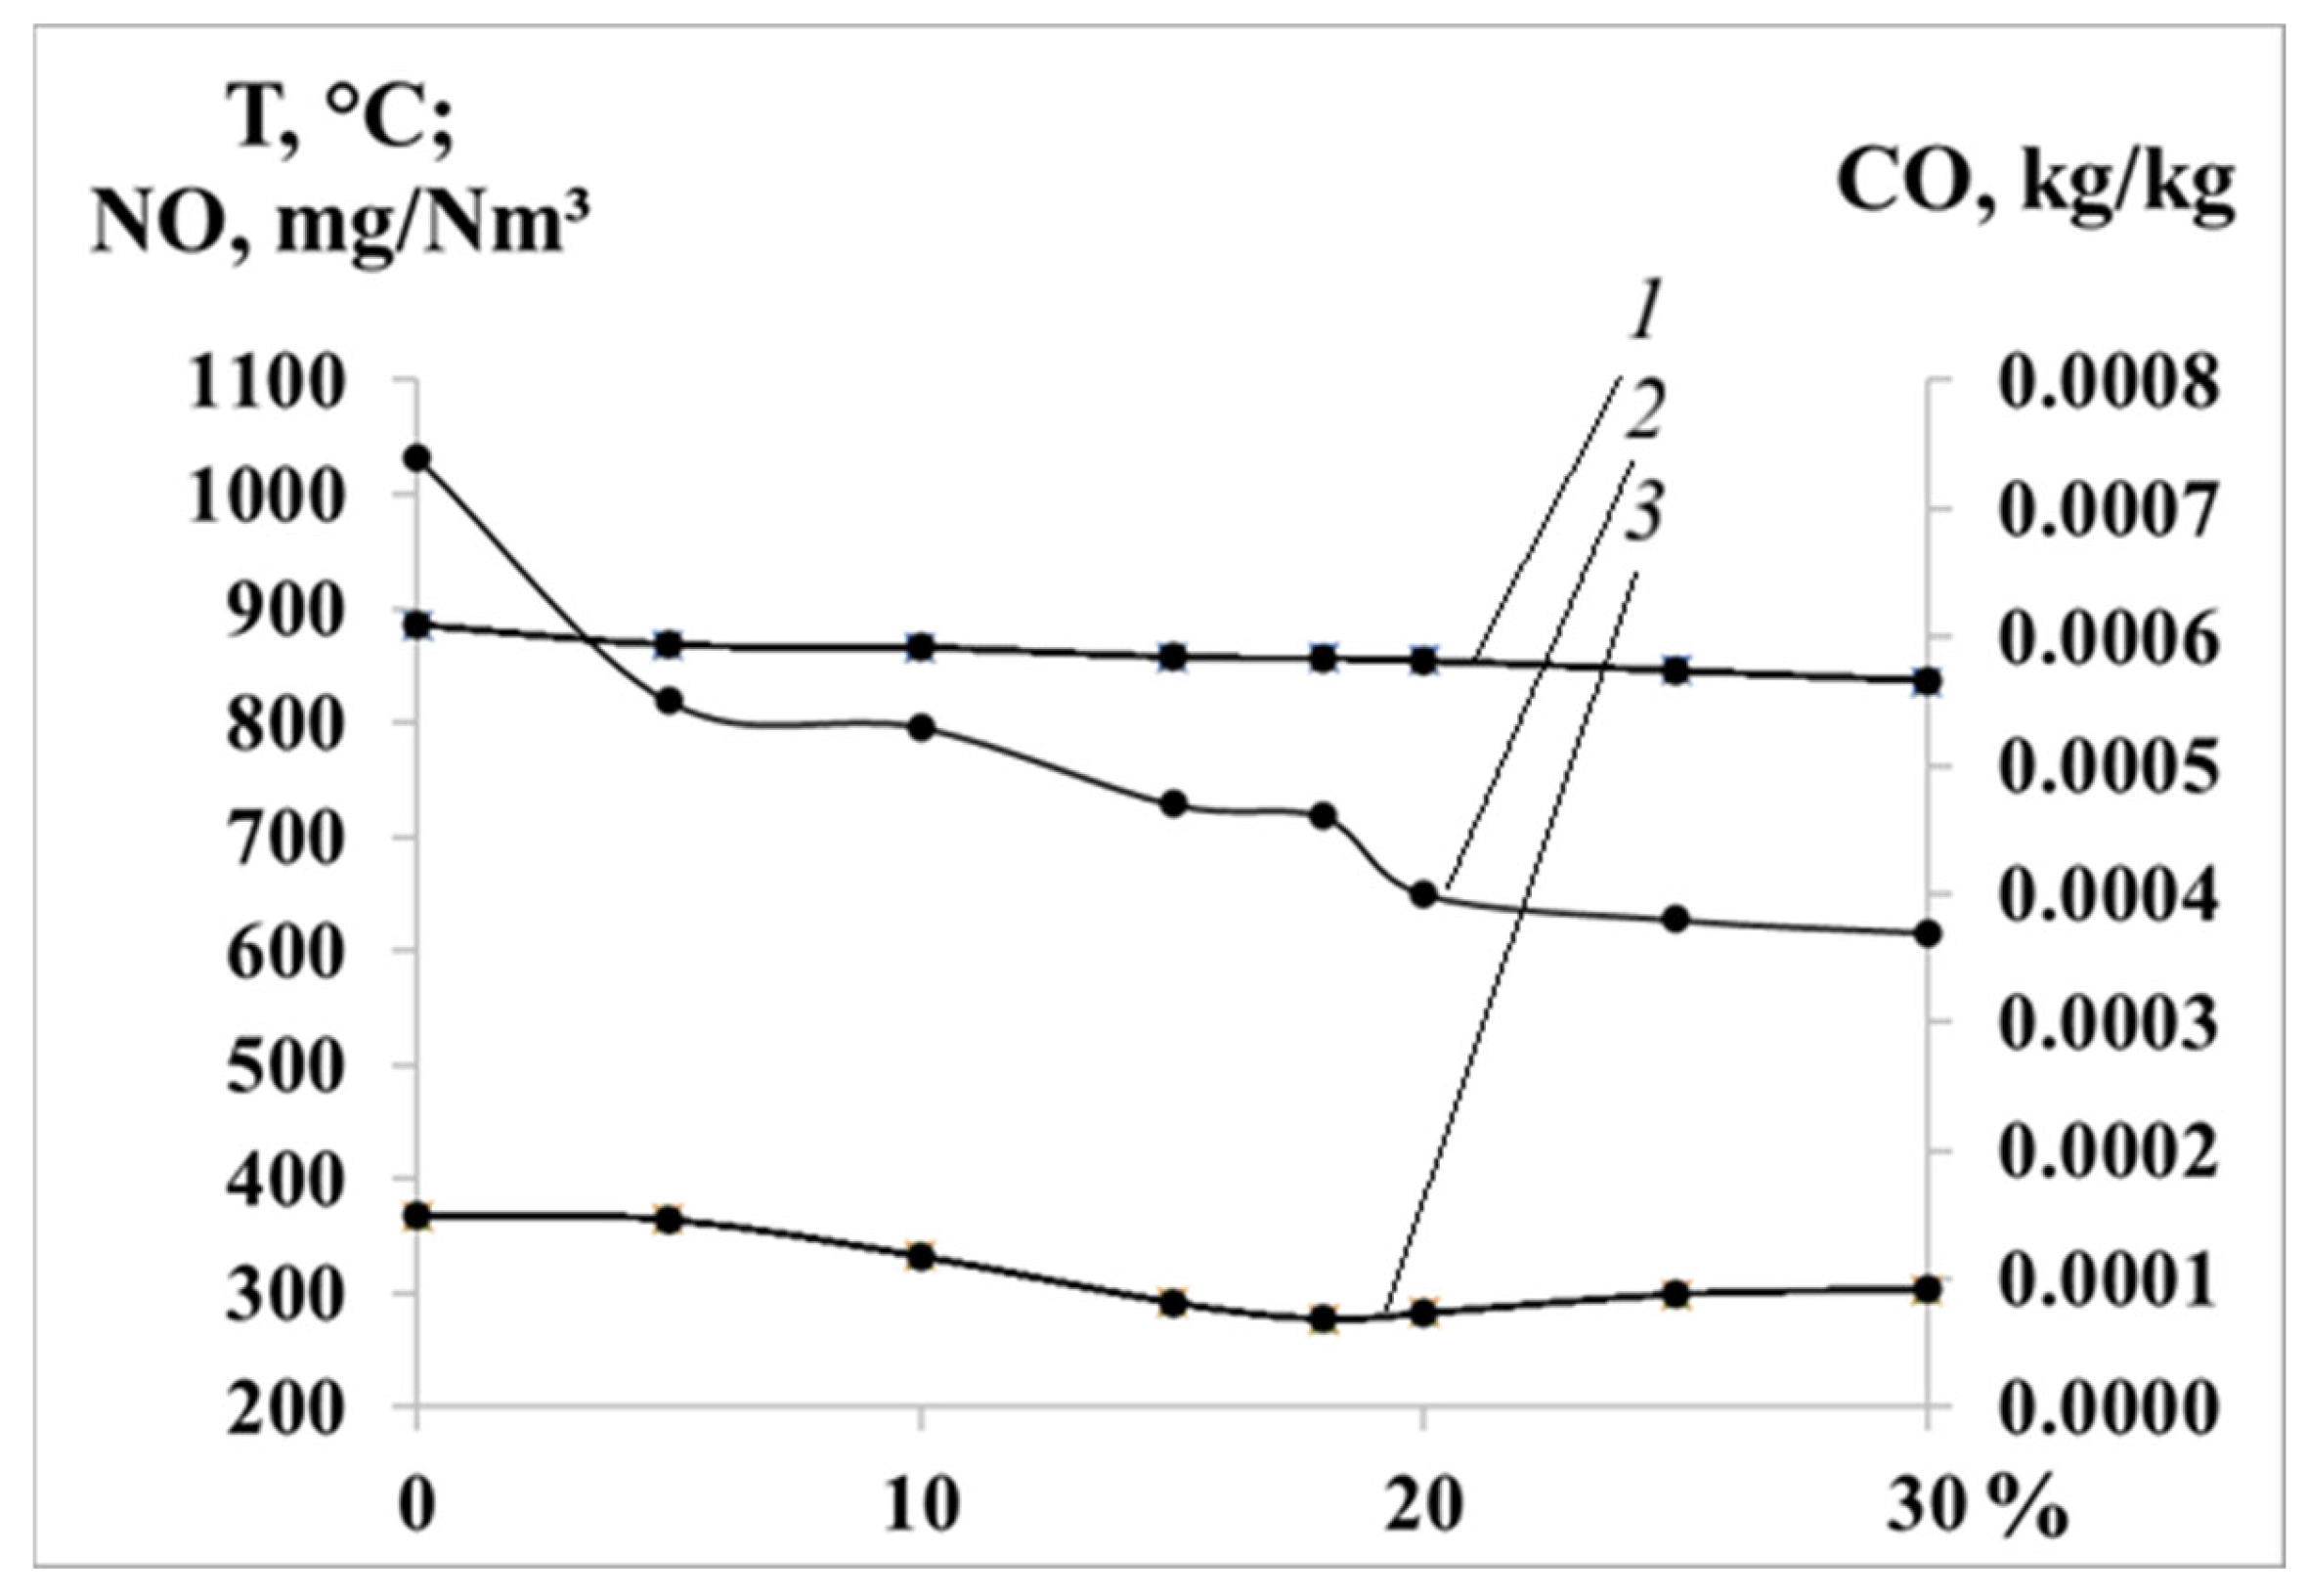
Figure 7 shows the dependence of the temperature T of the combustion products (
Figure 7, curve 1), as well as the concentrations of carbon monoxide CO (
Figure 7, curve 2) and nitrogen oxide NO (
Figure 7, curve 3) at the outlet of the combustion chamber on the volume of air supplied through the OFA injectors. The volume of additional air OFA is indicated as a percentage of the total amount of air supplied to the combustion chamber. Therefore, the following values were selected: OFA = 5%; 10%; 15%; 18%; 20%; 25% and 30%. Analysis of this figure shows that increasing the proportion of additional air has a complex effect on combustion processes and the formation of harmful dust and gas emissions into the atmosphere.
As the OFA supply increases, the furnace outlet temperature drops sharply within the 0–5% range due to the cooling effect of incoming air, then stabilizes around 820–860 °C, confirming stable thermal conditions at moderate OFA levels. The CO concentration gradually declines: at low OFA levels, incomplete combustion results in higher CO levels. As more air is added above the flame, the flame improves after burning, and turbulent mixing reduces the CO concentration by nearly half. The NO concentration also decreases to its lowest point at OFA levels between 10 and 18%, due to a more developed reduction zone and less thermal NO formation. Beyond this, an increased air supply slightly raises NO levels due to higher oxygen and temperature in the afterburning zone.
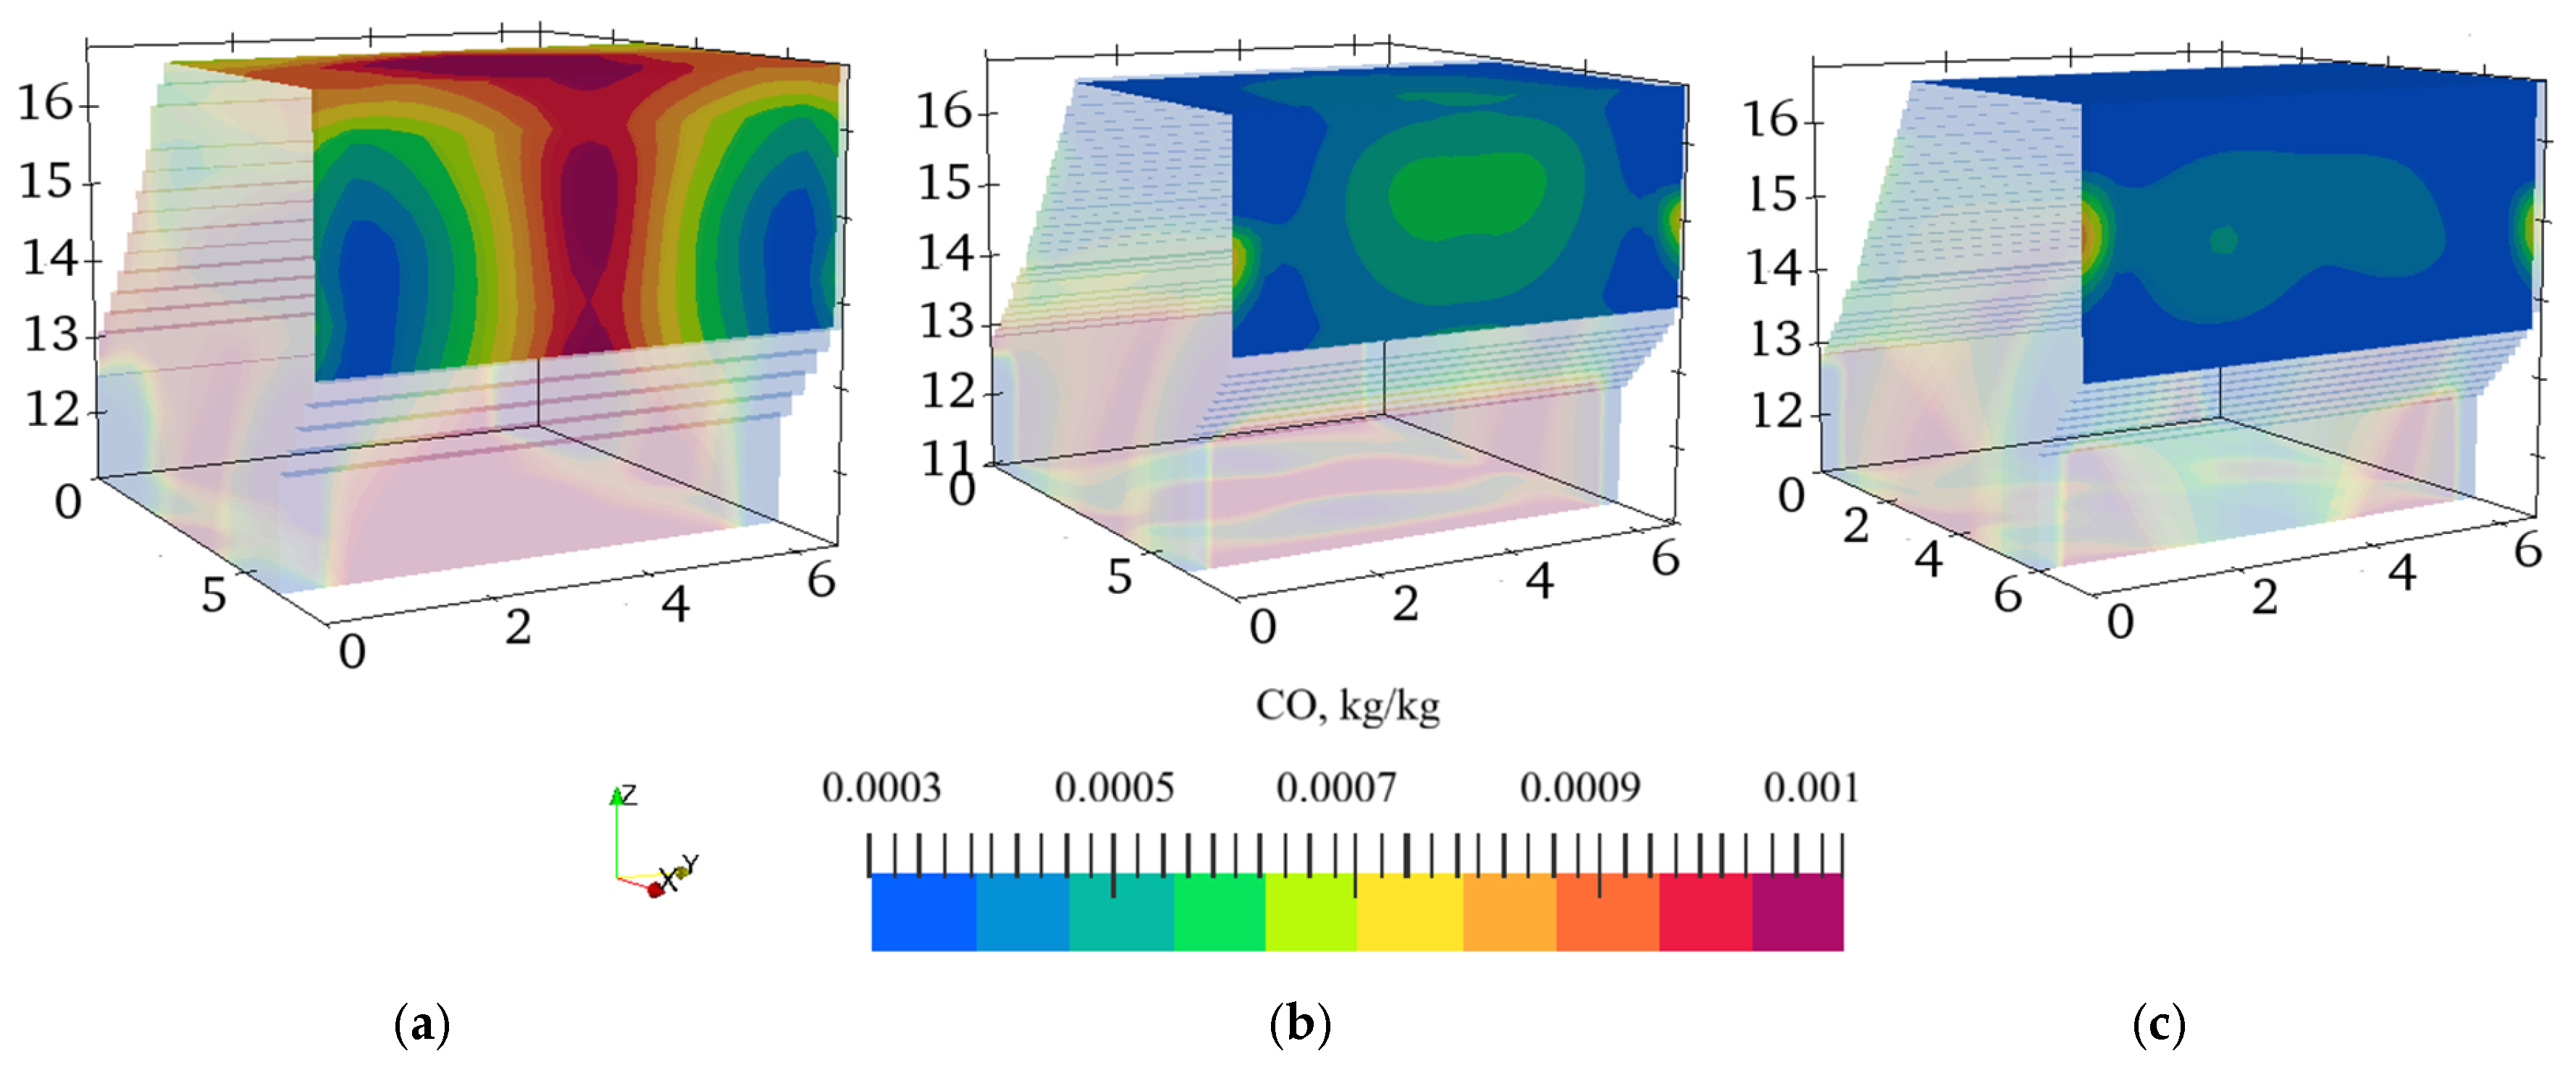
Figure 8 displays the 3D distribution of CO at the BKZ-75 boiler’s outlet for various over-flame air volumes, providing insights into combustion completeness and how staggered air supply influences reducing zones in the upper combustion chamber.
When examining the baseline mode (OFA = 0%, conventional combustion), distinct areas of elevated carbon oxide CO concentrations are observed, primarily localized in the central and upper parts of the outlet cross-section (
Figure 8a). This distribution is due to insufficient oxidizer supply to the afterburning zones of volatile fuel components. The formation of a reducing environment leads to CO accumulation, indicating an insufficient efficiency of oxidation processes.
At OFA = 18% and 30%, the carbon monoxide concentration CO decreases significantly, and the distribution becomes more uniform (
Figure 8b,c). Additional air introduced above the main combustion zone intensifies turbulent mixing and promotes more complete oxidation of CO to CO
2. A decrease in the intensity of local CO concentration maxima indicates an increase in the degree of combustion completion in the region under consideration. In addition, the absence of pronounced zones of elevated CO concentrations indicates that the fuel has undergone the most complete afterburning and that the aerodynamic regime in the combustion chamber has been optimized. Uniform distribution of the oxidizer ensures effective suppression of reducing zones, significantly reducing the likelihood of CO formation.
Below,
Figure 9 shows the calculated concentration fields of nitrogen oxide (NO) at the BKZ-75 boiler combustion chamber outlet for three air supply options through OFA injectors. The resulting spatial distributions allow us to evaluate the impact of staggered air supply on the formation and reduction of nitrogen oxides (NOₓ) in the upper zones of the combustion chamber.
The analysis of the figure indicates that without additional air (
Figure 9a), NO oxide concentrations reach their peak, approximately 380–388 mg/Nm
3, with an average of 368.08 mg/Nm
3. The distribution pattern features prominent zones of high NO levels in the upper part of the cross-section, a symmetrical structure with two local maxima, and stable hot spots where the thermal mechanism of NO formation is most active.
The absence of a cold air supply causes the temperature in the afterburning zone to stay high, with almost no reduction processes taking place. This leads to a typical scenario of “hard” single-stage combustion—characterized by maximum thermal NO formation.
In
Figure 9b, supplying 18% of the above-flare air results in a 22–25% reduction in NO concentration relative to the baseline, yielding a range of 272–282 mg/Nm
3 and an average of 277.12 mg/Nm
3. The figure shows that the highest NO values move toward the edges, while the intensity of the central “hot spots” decreases, resulting in a more symmetrical concentration distribution across the outlet cross-section.
The introduction of OFA causes partial cooling of the upper combustion chamber zone and enhances reduction reactions (NO → N
2) due to a localized oxygen deficiency in the main combustion zone. Simultaneously, the contribution of the Zeldovich thermal mechanism decreases. As the supplied air volume increases to OFA = 30% (
Figure 9c), a secondary rise in nitrogen oxide (NO) concentration occurs. With this setup, the NO concentration reaches 298–316 mg/Nm
3, with an average of 303.25 mg/Nm
3.
This behavior results from excess oxygen in the OFA zone, a temperature increases due to the active afterburning of CO and volatiles, and an increased formation of thermal NO in the upper part of the furnace. The distribution pattern clearly reveals large areas of higher concentration in the upper cross-section, indicating excessive secondary air supply when the reduction zone collapses, and nitrogen oxidation processes restart, dominating.
Overall, the results indicate that the ideal range for additional air supply via OFA injectors, which reduces CO and NO emissions while maintaining a stable thermal regime, is approximately 18–20%, with 18% being the optimal value.
Table 6 shows the numerical data for temperature, carbon oxides, and nitrogen concentrations across different modes when OFA varies from 0 to 30%.
3.3. Distribution of Aerodynamic and Heat-Mass Transfer Characteristics Under the Optimal OFA Mode
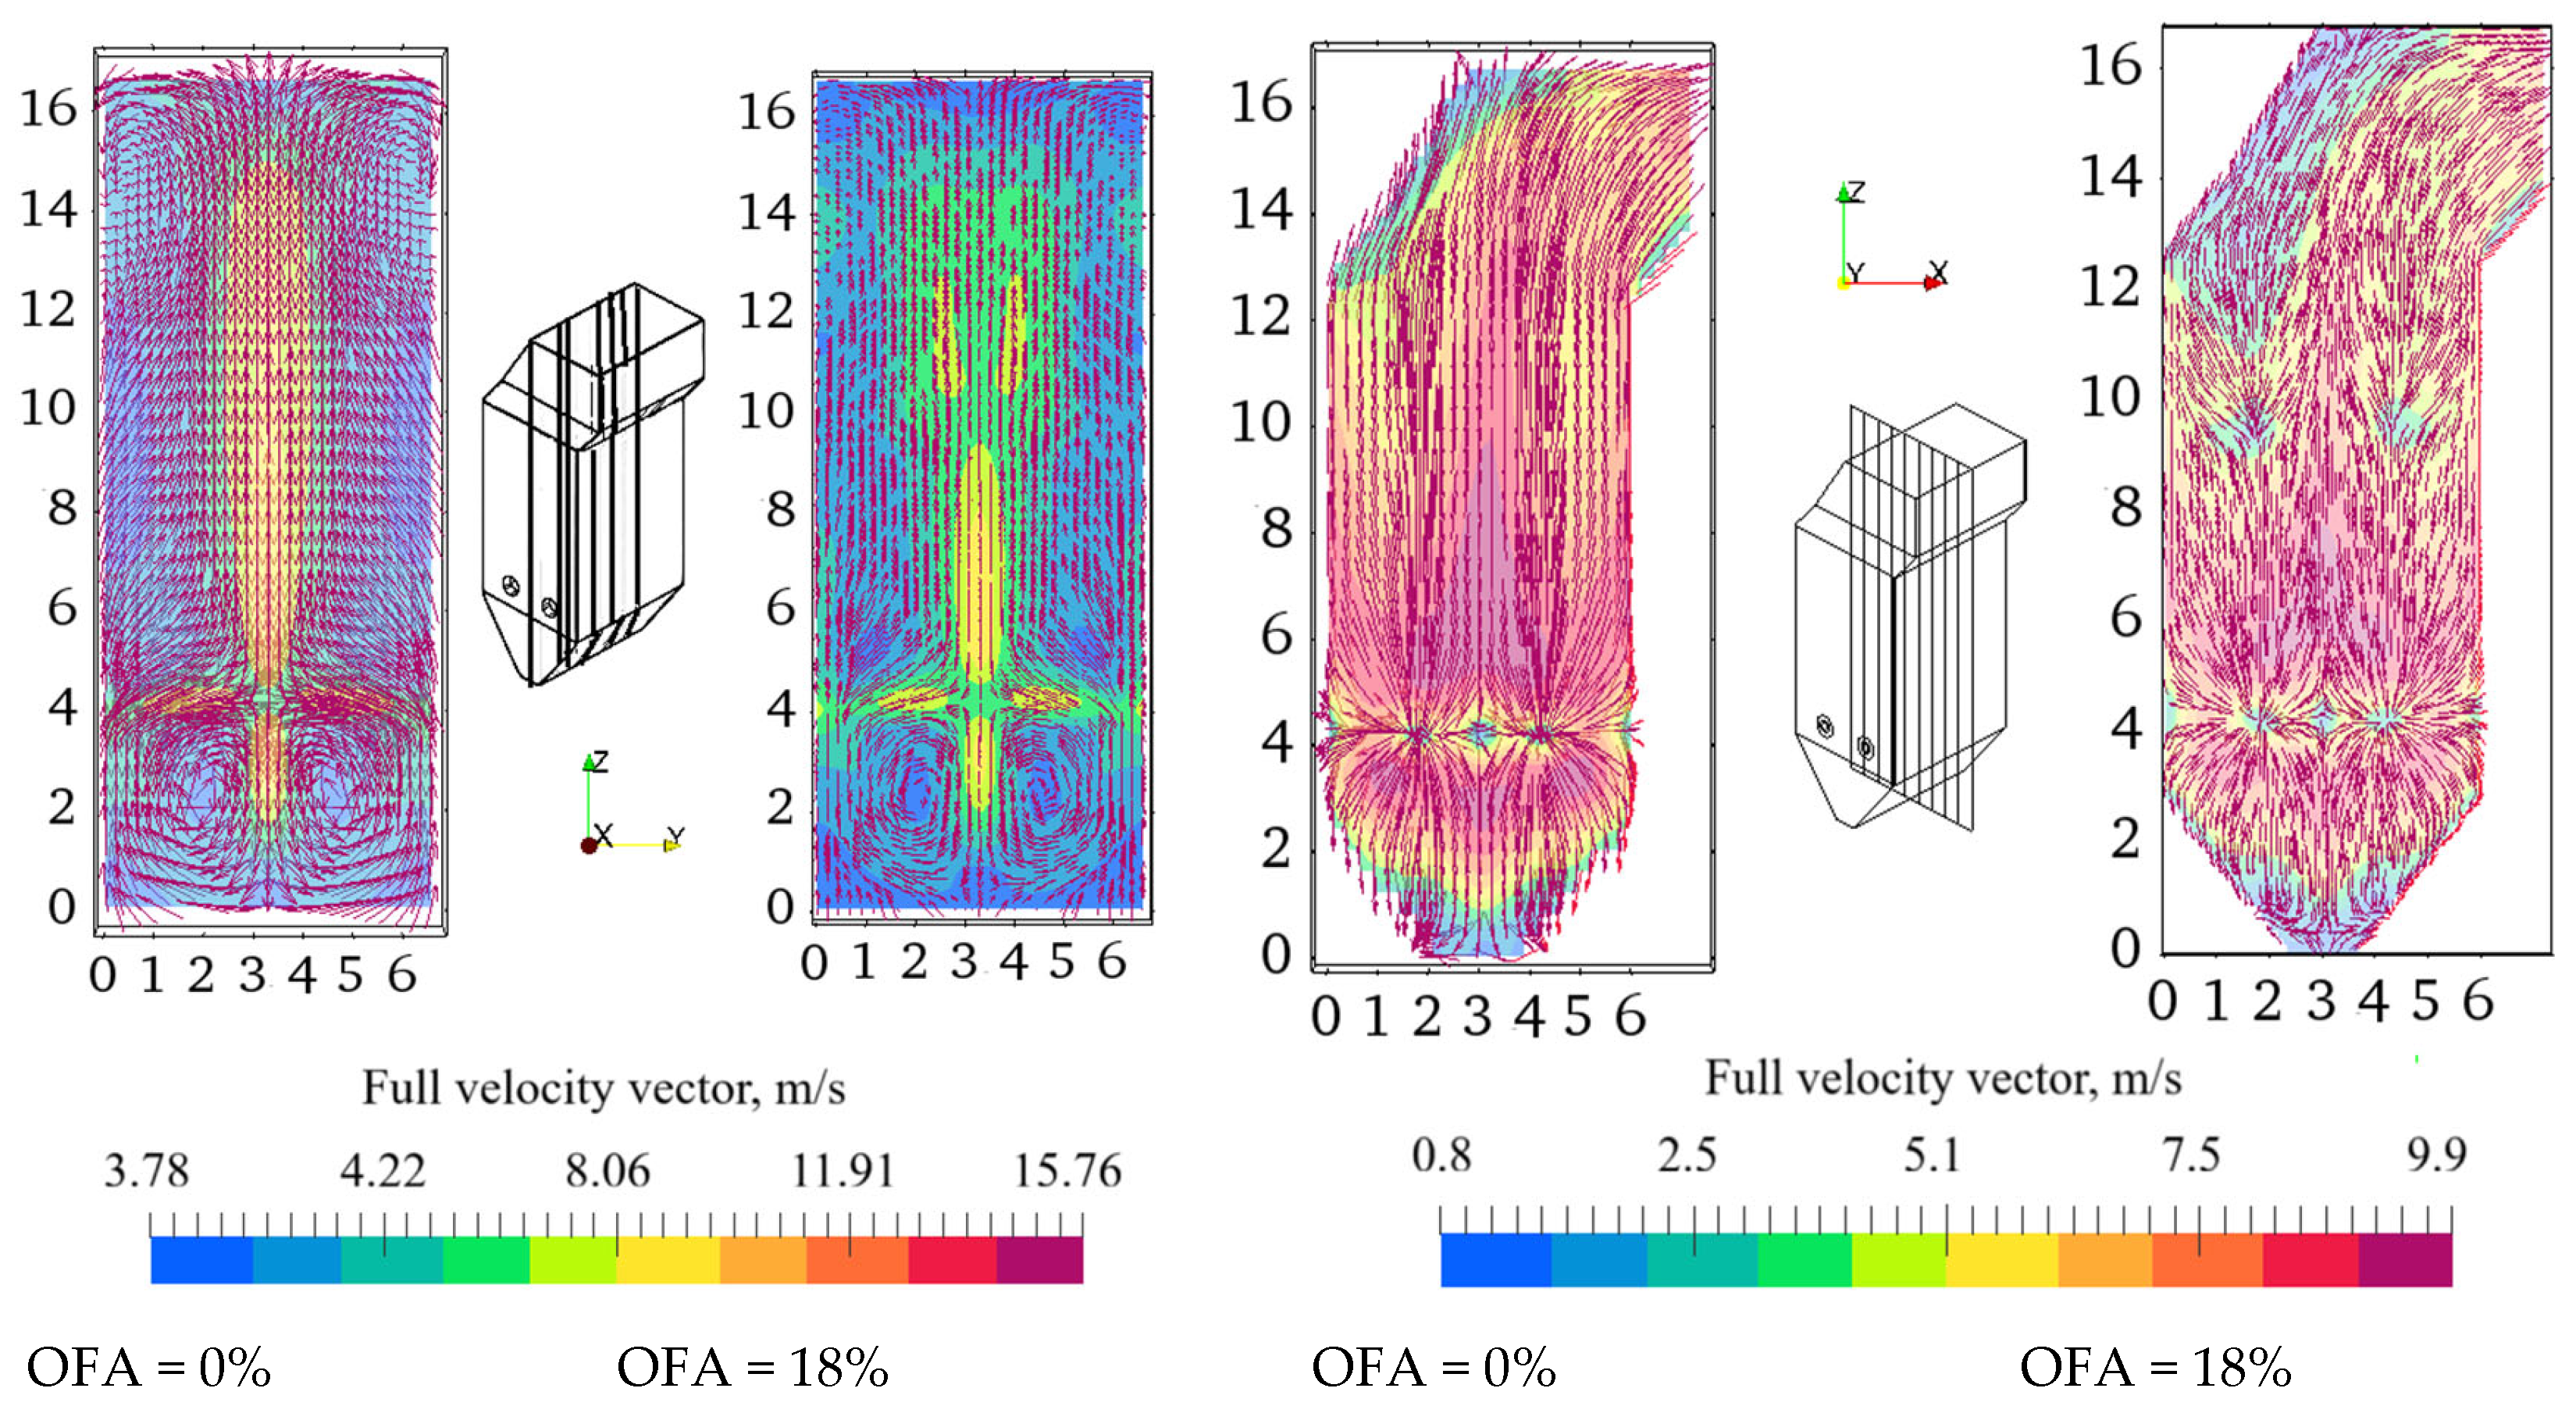
Figure 10 illustrates the total velocity vector field in two key sections of the combustion chamber: the longitudinal section at x = 3 m and the central section at y = 3.3 m, with air supplied through nozzles at OFA of 0% and 18%. In both scenarios (see
Figure 10), the flame core is situated in the center of the chamber, marked by a zone where counter-current jets from opposite burners collide intensely. As the distance from the burners increases, the velocity field becomes more uniform, and the gas flow velocity noticeably decreases toward the furnace outlet window.
When extra air is supplied through the OFA nozzles (18%), the highest overall velocity stays concentrated in the flame core. Still, in the zone around the OFA injectors (h = 9.4 m), there is a localized drop in flow velocity. Once the main burner jets merge with the OFA jets, two symmetrical vertical vortex structures form above the burner, moving toward the center of the furnace. These vortices enhance turbulent mixing, improve oxidizer delivery to the coal dust particles, and facilitate a more complete and uniform fuel combustion burnout.
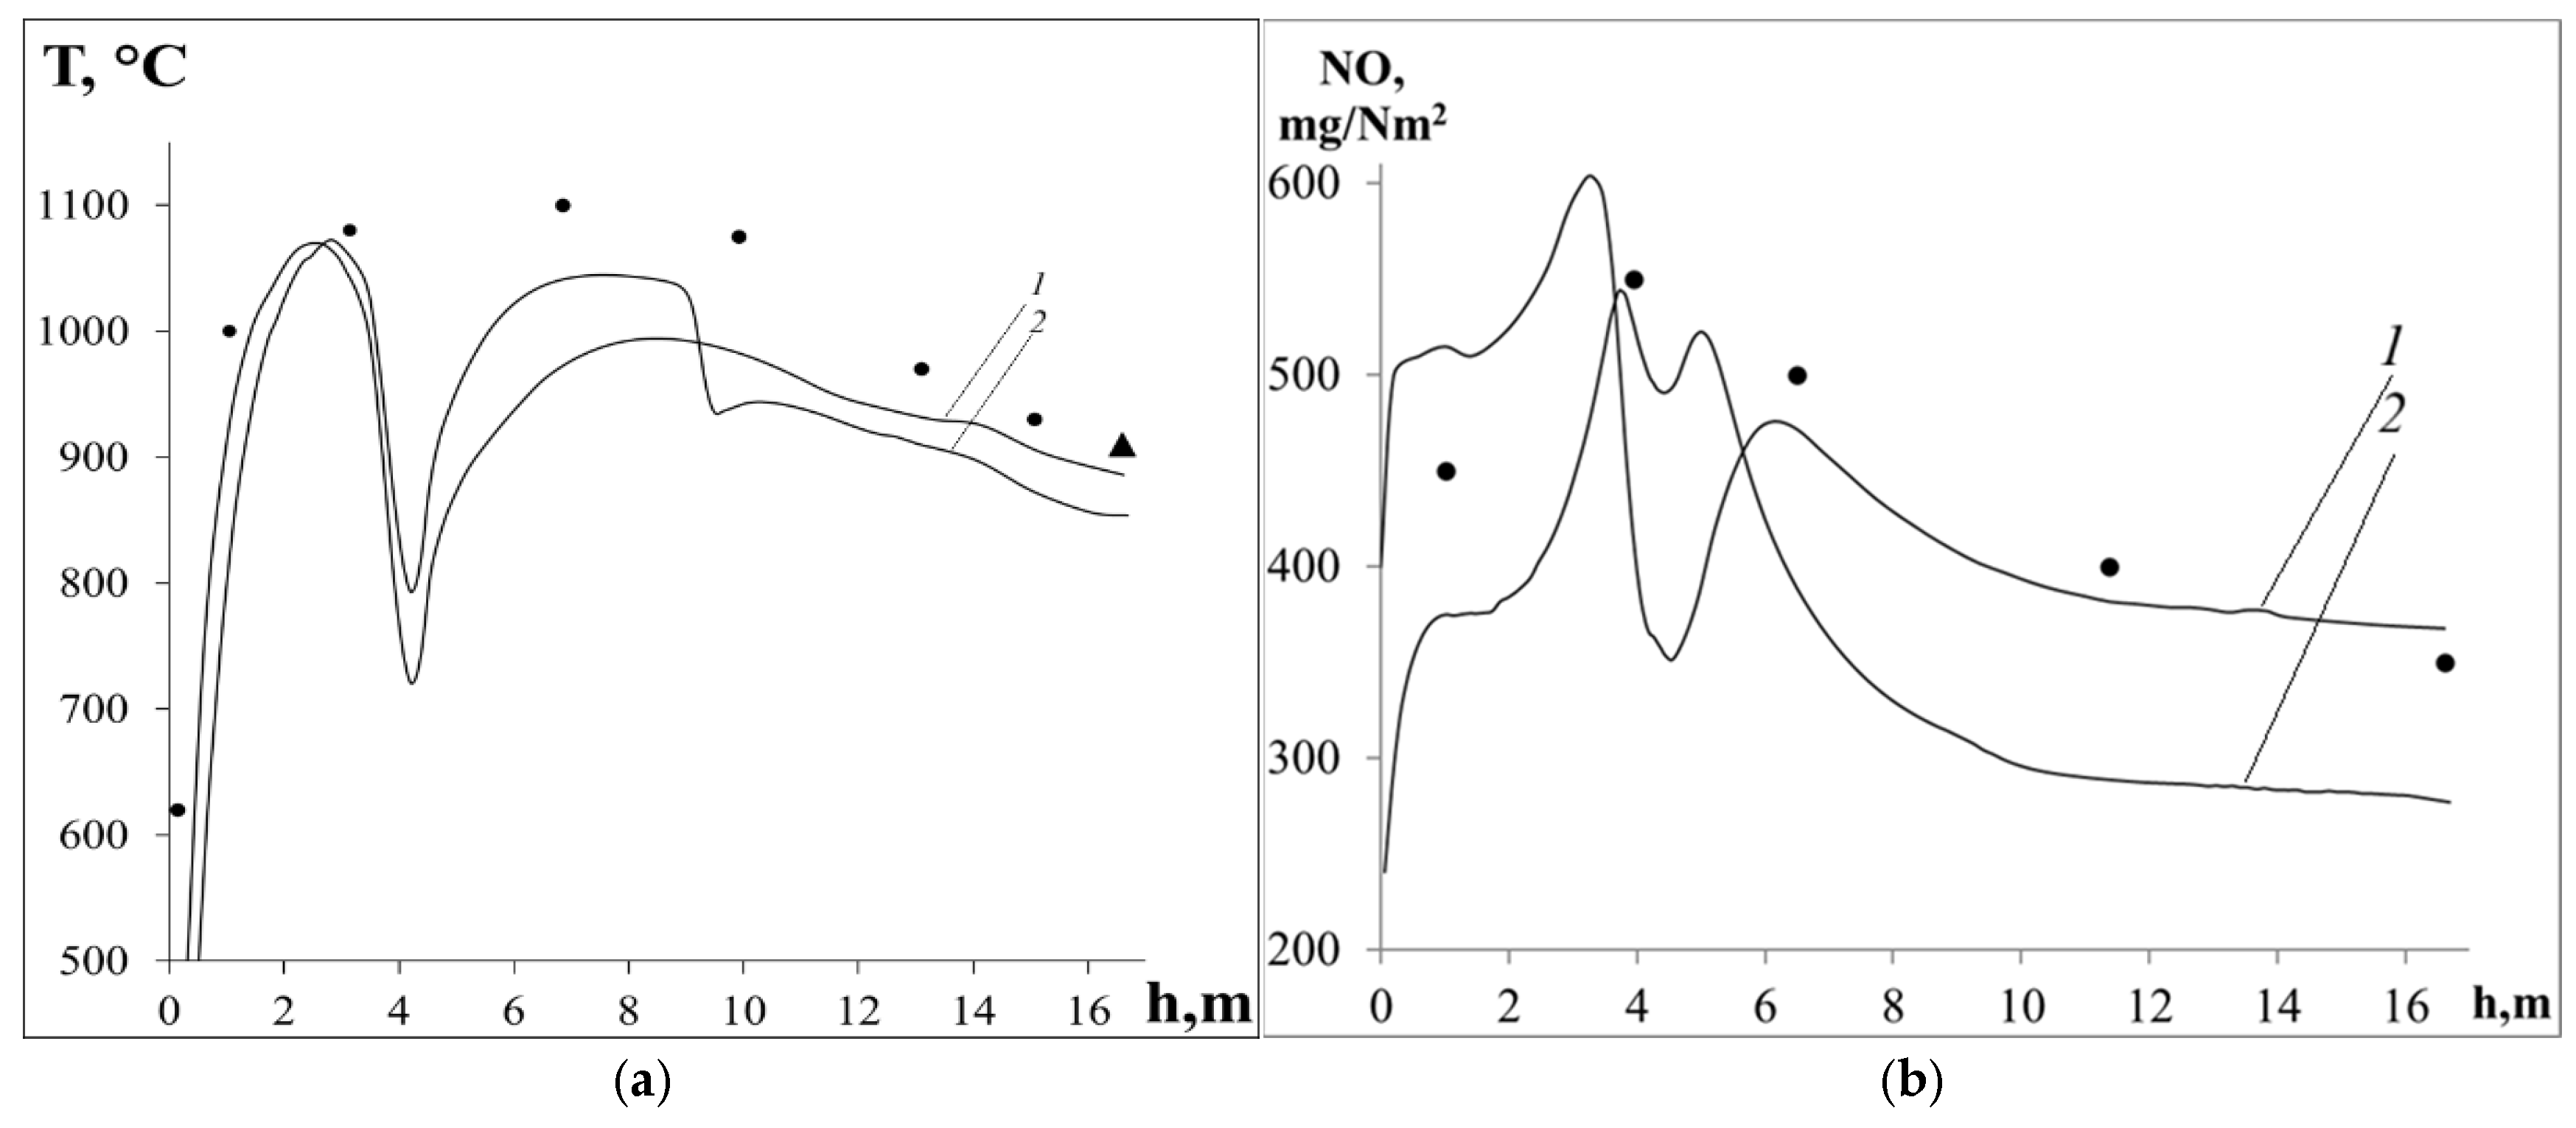
Figure 11 presents two-dimensional graphs illustrating the temperature T (a) and nitrogen oxide (NO) concentration (b) along the height of the combustion chamber, h, for the different operating modes. In
Figure 11a, it is shown that with an OFA level of 18%, the peak temperature within the flame core increases relative to the baseline, and the high-temperature zone expands considerably, resulting in a longer high-temperature core. Near the OFA injectors, curve 2 indicates a localized temperature drop due to the cold jet introduced by the additional air injection.
Above the OFA injectors, the temperature on curve 2 stays higher than on curve 1 almost until the outlet. However, at the combustion chamber outlet, the average temperature when OFA = 18% is lower, at 856.26 °C, compared to 885.79 °C when OFA = 0%. The graph also shows experimental data from full-scale tests at the Shakhtinsk TPP [
31] for the base mode (OFA = 0%) and the calculated outlet temperature from thermal calculations by the Central Boiler and Turbine Institute (CBTI) [
32], which matches well with the numerical results data.
Using direct blast technology with an OFA setting of 18% causes the flame to lengthen noticeably, improves heat distribution along the furnace’s height, and lowers exhaust gas temperature by about 30 °C. This indicates more effective heat transfer to the upper zone and better combustion efficiency within the chamber. Raising the temperature at the flame core while reducing it at the outlet speeds up oxidation reactions, improves mixing, and decreases losses from incomplete combustion. Nonetheless, these adjustments alone do not reduce CO and NOx emissions because higher temperatures can enhance thermal NOx formation, and CO levels may increase in reduction zones due to insufficient combustion after burning.
Reducing NO
x and CO levels at OFA = 18% involves a two-stage combustion process: initially, a reducing zone is formed in the lower furnace, followed by intense oxidative afterburning in the OFA feed area. Analysis of nitrogen oxide distribution (
Figure 11b) reveals that increasing the air supplied through the OFA injectors (OFA = 18%) results in a slight increase in NO
x concentration in the burner zone compared to baseline conditions (OFA = 0%). This rise is due to higher temperatures and more vigorous oxidation of nitrogen-containing fuel components.
At the peak of the OFA injectors, there is a noticeable and steady decrease in NO
x levels, caused by cold air supplied through the injectors and the dilution of combustion gases with excess air. Along the entire furnace height, the highest NO
x concentrations are found in the lower region, known as the active combustion zone, which is typical for all direct-flow furnaces. Additionally, in the base mode, elevated NO
x levels continue until the combustion chamber’s exit. However, two-stage combustion significantly reduces nitrogen oxides near the exit [
33,
34].
The emission reduction mechanism is as follows:
A reducing (oxygen-depleted) environment forms in the lower zone, inhibiting the formation of fuel NOx;
In the OFA injector zone, a moderate-temperature oxidizing region develops, which decreases the thermal production of NOx based on the Zeldovich mechanism.
The two-stage combustion method, with 18% air supplied via OFA injectors, effectively reduces the formation of fuel and thermal nitrogen oxides. This results in notably lower levels of these emissions in the combustion chamber outlet environment.
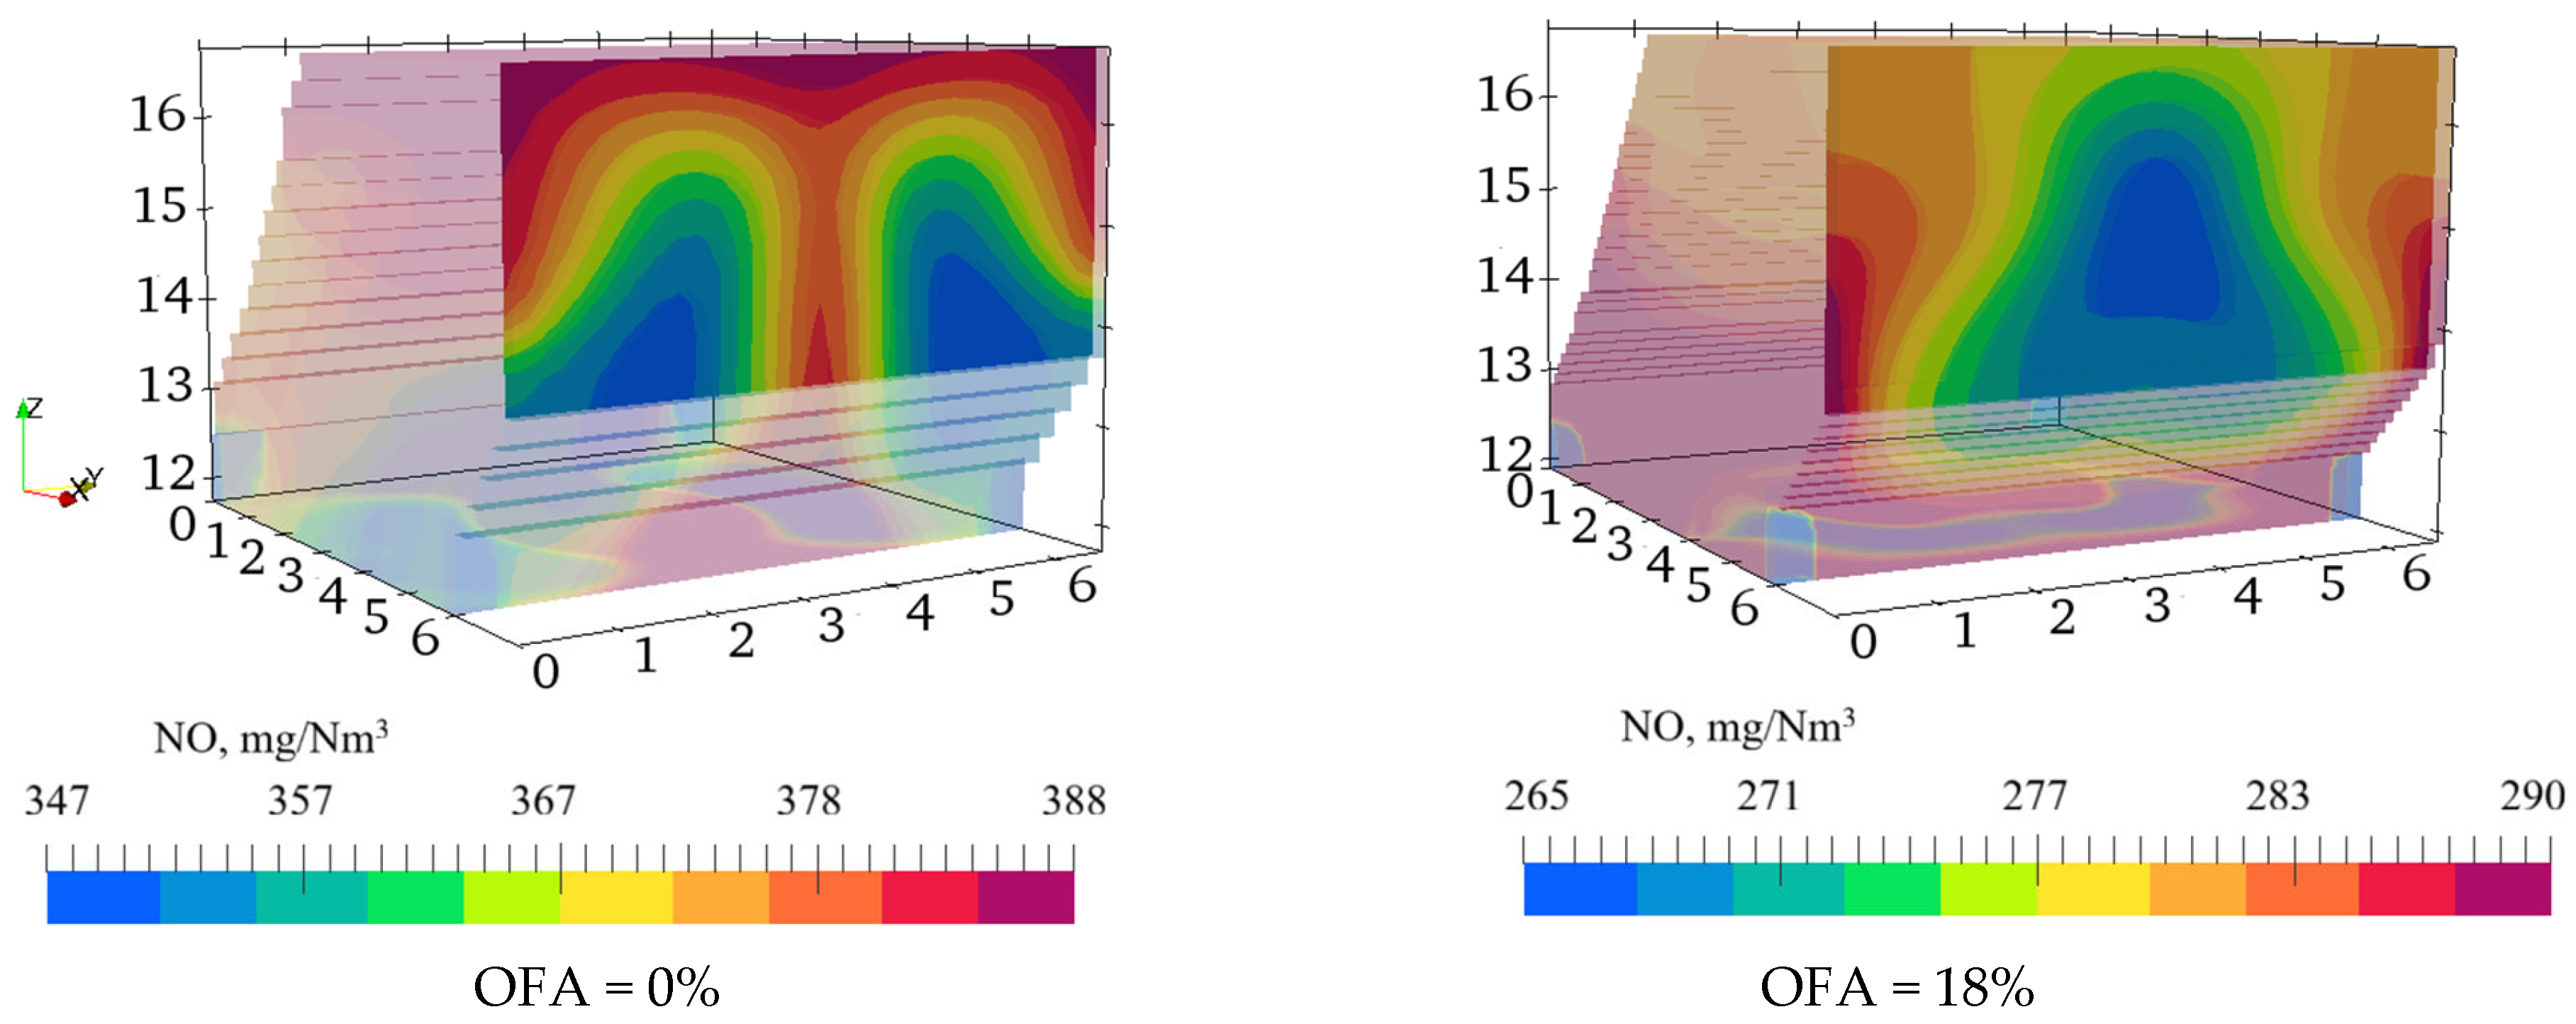
Figure 12 illustrates the three-dimensional distribution of nitrogen oxide (NO) concentrations at the combustion chamber outlet of the BKZ-75 boiler, with different injected air volumes: OFA = 0% (baseline, standard combustion) and OFA = 18%. Analyzing the NO
2 concentrations in the outlet section (refer to
Figure 12) indicates that Overfire Air technology (acute blast) markedly affects this component’s distribution. At OFA = 18%, there is a significant decrease in both the average and maximum NO concentrations compared to the baseline (OFA = 0%).
Despite the significant results obtained, this study has a limitation that should be taken into account when interpreting the findings and their practical application: the optimal parameters for the placement of OFA injectors and the amount of secondary air obtained are specific to the BKZ-75 boiler and the high-ash coal of the Karaganda Basin and cannot be directly extrapolated to other boiler types or fuels without further analysis.
Overall, the identified optimal parameters for implementing OFA technology in the BKZ-75 boiler at the Shakhtinsk TPP can be used in the modernization of existing coal-fired power plants, contributing to improvements in their environmental and energy efficiency. Thus, this work makes a significant contribution to the development of “clean” coal combustion technologies and demonstrates the potential of digital approaches for transitioning the energy sector toward more sustainable and environmentally safe solutions.




 ,
,