Abstract
The paper deals with the design of forward-inclined blades, where “forward inclination” is intended as the design-dependent amount of forward sweep to be incorporated in non-free-vortex blades to restore quasi-2D flow behaviour within the rotor passages. The aim of the work is to assess the effectiveness of this design modification in a 0.5 hub-to-tip ratio fan with radially stacked blades that induce a roughly constant swirl velocity at the rotor exit. To this end, the original blade has been modified by incorporation of a forward sweep amount that translates into a forward-inclined design, defined in accordance with a method suggested by the authors. Both the original and forward-inclined design were preliminary assessed by CFD and finally verified by experiments. The forward-inclined design demonstrated experimentally to improve the pressure rise and efficiency of the original fan in the whole operation range with ca. 10% gain at design operation.
1. Introduction
Forward sweep is a well-acknowledged means to reduce noise emissions and improve both the stall margin and efficiency at design operation of low-speed axial fans with radially stacked blade rotors [1]. These advantages are generally counteracted by a slight decrease in fan pressure rise at design operation [2]. Additional insights from the broader literature further emphasise the aerodynamic potential of forward sweep. Wright and Simmons [3] reported that forward-swept rotors experience an increase in peak total pressure and a shift in the stall margin toward lower flow rates, primarily due to improved boundary-layer behaviour at part-load. Similarly, Yamaguchi et al. [4] showed that forward sweep enhances efficiency and enables a more accurate realisation of the intended radial distribution of flow coefficient and outflow angle in non-free-vortex rotors.
Part-load benefits were also documented in earlier experiments by Mohammad and Raj [5], who found that forward sweep mitigates performance deterioration at low flow rates. Complementary CFD and experimental studies by Beiler and Carolus [6] confirmed that sweep can suppress secondary flows and reduce losses in rotors with non-free-vortex circulation distributions. Moreover, the detailed CFD investigation by Corsini and Rispoli [7] clarified the local flow mechanisms triggered by sweep, particularly tip-region flow reorganisation, which directly affect stall margin and peak pressure behaviour. Finally, Glas [8] demonstrated that even in rotors with mild circulation gradients, a slight forward sweep may yield optimal performance by balancing radial-flow migration and loss generation.
According to the simplified theory of forward sweep for low-speed axial fans suggested by the authors ten years ago [9], each blade of a rotating annular cascade, made of radially stacked aerofoils and designed to leave a spanwise constant swirl component downstream of the trailing edge, behaves aerodynamically as a backward-swept wing. This is because the radial shift in the meridional flow induced in the annular cascade passages by non-free-vortex blade aerodynamic loading mimics the slide of the free-stream along the wingspan induced by backward sweeping of the wing axis. Since the lift reduction associated with backward sweeping of the aeronautical wing axis has a low-speed axial fan counterpart in the pressure rise reduction associated with the obliquity of the meridional flow (relative to the fan blade axis), rotor blades’ forward sweep allows the increase in the fan pressure up to a maximum level. This is theoretically achieved when the obliquity of the meridional flow relative to the blade axis is eliminated. In this case, geometrical forward sweeping should be more appropriately defined as forward inclining, as stated in [10]. True forward sweep and related effects expected on the fan performance [11] are achieved only when the radially stacked design is swept more forward than the forward-inclined design. In [12] the authors demonstrated through experiments that two well aerodynamically designed fans with hub-to-tip ratios equal to 0.28 and 0.4 and radially stacked aerofoil blades can further increase their performance by incorporation of a blade forward sweep angle equal to the obliquity of the conical surface that approximates the most oblique bulk-flow stream surface within the blade passage. On the other hand, the different amounts and types of aerodynamic performance improvement achieved by the two fan designs (either an efficiency increase with no pressure rise modification at design or a pressure rise increase with approximately no efficiency modification) suggested that the amount of forward sweep needed to perfectly compensate for the meridional flow obliquity relative to the blade axis also depends on the tip clearance magnitude, due to the role the latter plays on the meridional flow obliquity. Accordingly, an updated version of the criterion to estimate the meridional flow obliquity was proposed in [13] and therein successfully applied to design a 0.5 hub-to-tip ratio tube-axial fan with constant-swirl blade loading. However, both the validity of the forward-swept blade design method—first formalised in [12] and successively slightly revised in [10]—and the effectiveness of the criterion to estimate the meridional flow obliquity—as updated in [13]—have not yet been assessed for a tube-axial fan design with a hub-to-tip ratio higher than 0.4.
In the present paper, a tube-axial fan with constant-swirl blade loading obtained by radial stacking of 2D aerofoil sections, whose aerodynamic design and experimentally assessed good performance have been documented in [13], has been taken as the benchmark fan for the design of its forward-inclined variant. The preliminary CFD (Computational Fluid Dynamic) predictions of the aerodynamic performance of the two designs have been compared with the experimental tests performed on two 315 mm diameter prototypes manufactured by 3D printing. The final aim is to assess the effectiveness of the forward-inclined blade design in a 0.5 hub-to-tip ratio fan with constant-swirl blade loading.
The present study introduces two main novelties in respect of the present literature. First, it provides the first systematic application of the forward-inclined design, in which the amount of forward sweep is set equal to the design-dependent mean obliquity of the meridional flow, evaluated with the updated criterion that explicitly accounts for tip-clearance, so as to re-establish a quasi-two-dimensional flow in the rotor channels. Compared with the uniformly forward-swept rotors of [12,14], where sweep angle was prescribed on the basis of the earlier formulation, the present design is intentionally forward-inclined (i.e., geometrically swept but aerodynamically unswept), rather than simply forward-swept. The second novelty is that the forward-inclined design method based on the updated formulation is applied and experimentally assessed here on a tube-axial fan with a hub-to-tip ratio equal to 0.5. Previous swept-rotor applications with experimental validation were confined to lower hub-to-tip ratios (up to about 0.4), and the updated formulation had so far only been used to design a constant-swirl fan with unswept blades and hub-to-tip ratio equal to 0.5.
The paper is divided into five sections expanding on the material in [15]. After this Introduction, Section 2 presents the geometry and aerodynamic performance of the baseline 0.5 hub-to-tip ratio tube-axial fan, outlines the CFD model and experimental test rig used, and evaluates an improved CFD model for higher prediction accuracy. Section 3 reviews the method for introducing forward blade sweep in constant-swirl design, explains the rationale behind the forward-inclined blades, defines the updated sweep-angle criterion, and applies the method to design the swept variant. Section 4 compares the global aerodynamic performance of the swept design and the baseline fan using CFD, contrasts the corresponding experimental data, and discusses performance differences in relation to local CFD-predicted flow features. Section 5 summarises the main findings of the work.
2. Instruments and Tools
This section presents the main characteristics of the fan design taken as the benchmark before briefly overviewing the major features of the CFD models and the experimental test rig used in this work. For the sake of generality, the fan pressure (pf as defined by ISO 5801 [16]), total-to-static pressure rise (pfs), and flow rate (qv), at any specified operating condition, are combined in terms of dimensionless performance parameters, namely, the flow rate coefficient (Φ = qv/(ωD3)), the pressure coefficient (Ψ = pf/(ρω2D2)), the aeraulic efficiency (ηaer = qv pf/(Tω)), and the total-to-static efficiency (ηTS = qv pfs/(Tω)), where T, ω, and ρ are the shaft torque, the fan rotational speed, and the air mass density, in that order.
2.1. CS Fan: The Constant-Swirl Benchmark Fan
The constant-swirl (CS) design taken as the benchmark is a 0.5 hub-to-tip ratio (ν) fan with 12 blades featuring a 1.72 Aspect Ratio (AR). The fan rotor was designed to induce a spanwise-constant value of the absolute velocity swirl component. Each rotor blade is obtained by an envelope of eight radially stacked F-Series aerofoil sections with 3.8% camber, 10% thickness to chord ratio, and 3% nose droop, wrapped around cylindrical surfaces coaxial with the rotor axis. Solidity (σ) and stagger (ξ) at each cylindrical surface with dimensionless radius (x = r/Rcasing) are listed in Table 1.

Table 1.
Geometric parameters of the CS fan rotor blading.
The design process of the CS fan is described in detail in [13] as well as the practical engineering motivations that imposed a tip clearance-to-blade height ratio (tc/B) equal to 1.7%. Figure 1a,b show the fan geometrical model and a picture of the 3D-printed rotor, respectively.
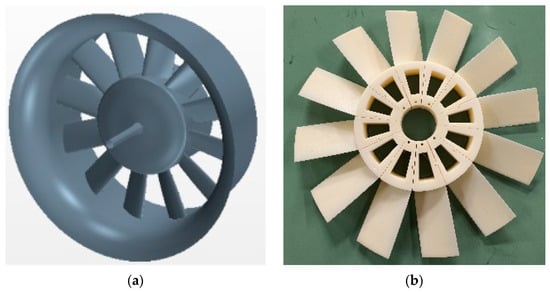
Figure 1.
CS benchmark fan (taken from [8]): (a) geometrical model; (b) 3D-printed rotor.
2.2. SIM CFD Model
The preliminary assessment of the fan aerodynamic design was performed using a reduced-domain single-channel steady-state incompressible-flow CFD model, hereafter referred to as the semi-ideal model (SIM). The model naming focuses on the two features that distinguish it from its revised version presented in Section 2.5.1: (i) the ideally infinite length of the rotor hub and fan casing downstream of the blade’s trailing edge and (ii) the radial equilibrium condition imposed at the exit boundary of the domain. The domain was discretised using a fully structured grid counting approximately 250 k cells and including a near-wall grid refinement that permits achievement of 1 < y+ < 13 on the blade surfaces. The blade tip gap was discretised with 10 cells in the spanwise direction. All computations were performed using the k-ε realisable turbulence model and the “all y+ wall treatment”. Figure 2a,b show the meridional and perspective view of the geometrical domain surface grid, respectively. The details of the model and the grid independence study are thoroughly documented in [13]. This, and all other computations discussed in this work, were solved with the STAR CCM+2302(18.02.008-R8) CFD software.
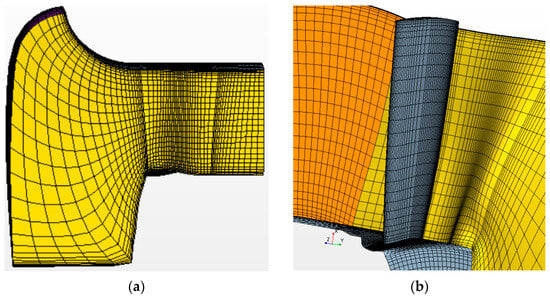
Figure 2.
Surface grid of the CS fan as modelled in the SIM CFD model (taken from [7]): (a) meridional view; (b) perspective view.
2.3. Numerical Assessment of the CS Fan Design
SIM CFD was used to assess the CS fan design. Figure 3 superimposed the design point of the CS fan (green point lines) to the aerodynamic performance curves predicted by CFD at the design rotational speed (i.e., at the design Reynolds number) for the relative tip gap tc/B = 1.7%.
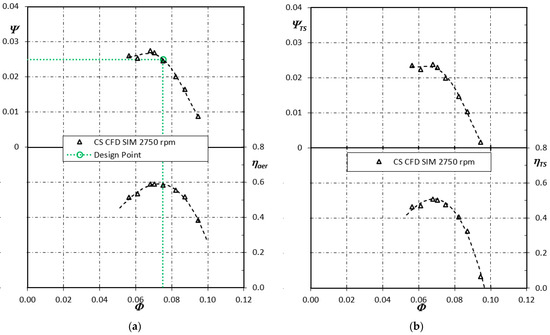
Figure 3.
CS fan aerodynamic performance as predicted by SIM CFD at 2750 rpm (design point is indicated by the green circle marker): (a) curves accounting for the ISO dynamic pressure contribution; (b) curves without ISO dynamic pressure contribution accounted for.
According to the SIM CFD results, the pressure requirement at the design point is perfectly fulfilled by the CS fan design, whereas the target ηaer (not reported in Figure 3) assumed by design as equal to 65% is noticeably higher than the 58% value predicted by CFD. Note that the mismatch between the assumed-by-design and CFD-predicted ηaer was largely expected because of the high tc/B imposed by the issues associated with the small size of the prototype manufactured for the experimental testing, as thoroughly explained in [13].
Figure 4 shows the local absolute velocity components predicted by SIM CFD (markers) for the CS fan in each cell crossed by the exit reference plane (arbitrarily placed 0.036 fan diameters downstream of the blade axis) and the corresponding velocity distributions expected by design (continuous lines). In the figure, each velocity component has been made dimensionless through division by the average axial velocity in the blade annulus. Thus, tangential, radial, and axial velocity distributions are reported in the form of their dimensionless counterparts, i.e., the swirl coefficient (εS), radial velocity ratio (εr), and axial velocity ratio (εA), in that order.
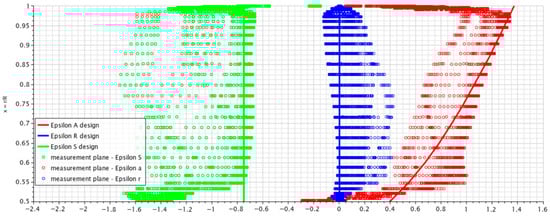
Figure 4.
Dimensionless velocity ratios at design operation (ΦD = 0.075) of the CS fan as expected by design (continuous lines) and predicted by SIM CFD in each cell cut by the reference plane downstream of the rotor exit (markers).
It is worth noting that the εₛ distribution finely approximates the design distribution, except for the region close to the rotor hub. In that zone, the εₐ distribution also departs from the design expectations, showing a very slight negative velocity component. This occurs as a result of a hub flow separation that starts appearing at flow rates moderately higher than those expected by design.
2.4. Test Rig
The fan aerodynamic performance tests were performed using an inlet-chamber fan test rig coupled with a multi-nozzle system for flow rate measurements. The rig (see Figure 5) is suited to test free-inlet free-outlet fan installations and complies with [16], where it is classified as a type A installation rig. All pressure data required by the simplified test procedure provided in the standard were measured using Betz micro-manometers, whereas the high-frequency sampling of the torque sensor signal was used to derive the mechanical power at the shaft as reported in [17]. The whole instrumentation setup and measurement accuracy are reported in [17] and other papers therein referenced.
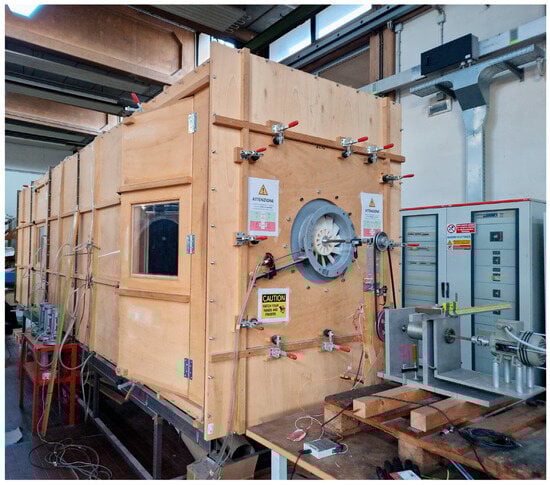
Figure 5.
ISO 5801 type A rig used for the aerodynamic performance tests.
2.5. Experimental Assessment of the SIM CFD Model
Figure 6 compares the CS fan performance experimentally measured at 2250 rpm to the corresponding data predicted by SIM CFD. As for Figure 3, the design point is included as well (green dotted lines). The lower-than-expected value of the design pressure coefficient measured in the experiment is due (in part, at least) to the Reynolds number at which the experimental test was performed, which is lower than the nominal value due to the reduced rotational speed at which the test was performed. Much the same argument holds for the SIM CFD predictions being the computations performed for operation at the same Reynolds number as that of the experiments.
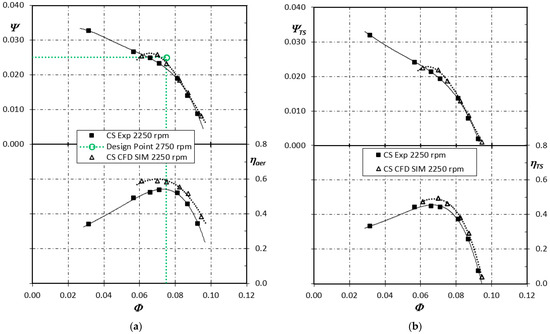
Figure 6.
CS fan aerodynamic performance at 2250 rpm as experimentally measured (filled square markers) and predicted by SIM CFD (triangle empty markers)—the green coloured empty circle marks the design point (2750 rpm): (a) curves accounting for the ISO dynamic pressure contribution; (b) curves without ISO dynamic pressure contribution accounted for.
As already shown in [13], SIM CFD predicts the CS fan pressure curves well at flow rates higher than design but it slightly overestimates both the fan pressure at design and the effect of aerodynamic stall. The lack of prediction reliability close to stall is well expected. This occurs because a steady-state approach cannot capture the local unsteadiness associated with stall. However, the overestimation of ηTS close to design operation, and especially the overestimation of ηaer over the whole operation range, suggests that SIM CFD predicts an oversimplified and idealised local flow field. This, in turn, leads to an underestimation of the actual pressure losses. In fact, recently published work [18] demonstrates that fans’ global aerodynamic performance predicted by CFD models exploiting single-channel steady-state calculations on idealised annular domains (like the one used by the SIM CFD approach—as far as the domain downstream of the rotor exit is concerned) is remarkably affected by the location of the exit reference plane downstream of the rotor and that the fan aerodynamic performance experimentally measured on type A test rigs is overestimated, regardless of the axial extension of the domain. This suggested attempting to revise the SIM CFD as presented in the following subsection.
2.5.1. Revision of SIM CFD: The RGBPM Model
In addition to the accuracy of the physical models on which the simulation approach is based, there are at least two other aspects that can justify the aerodynamic performance overestimation demonstrated by SIM CFD. First, the radial equilibrium imposed at the domain exit as a boundary condition. In fact, the radial equilibrium is the flow condition expected by preliminary design somewhere downstream of an annular cascade (infinitely far under the theoretical frictionless flow assumption). On the other hand, under real operation on an ISO 5801 type A installation, the fan discharges the airflow in a constant-pressure large environment that affects/alters the pressure field ideally expected when radial equilibrium is established in the ideal annular duct downstream of the blades. Second, the actual geometry of the fan, due to the finite length of the hub, imposes a sudden diffusion downstream of the rotor and upstream of the fan exit section, which adds to the abovementioned diffusion occurring downstream of the latter. The effects of both diffusions are neglected in the SIM CFD approach, as for most single-channel CFD calculation approaches applied to turbomachines’ flow. To try overcoming the inaccuracy associated with such approximations, it was attempted here for the first time in the authors’ research activity to use a low-order CFD modelling approach, which was further investigated, evolved, and thoroughly described in [19]. In particular, the stable operation range of the fan was simulated on a single-channel domain with much the same numerical setup and grid refinement as SIM but a slightly different shape. The latter perfectly matches the actual fan geometry—hub and shaft included—and limits its longitudinal extension to the spatial extension of the real fan, i.e., from the bell-mouth entry to the flange at the exit of the fan casing. Moreover, the radial equilibrium condition imposed at the exit section in SIM CFD is replaced here by the constant pressure boundary condition. This alternative modelling approach was referred to as the “prediction step” of the abovementioned “low-order CFD modelling approach” formalised in [19]. This is hereafter referred to as the “Real Geometry and Pressure Boundary Model” (RGPBM), where “real” underlines the differences in domain exit shape and boundary condition with respect to SIM.
Figure 7 compares the aerodynamic performance curves at 2250 rpm as predicted by RGBPM CFD with SIM CFD and experimental data measured at the same rotational speed. The improvement in accuracy achieved with RGBPM CFD is clear and the agreement with experimental data is now definitely visible.
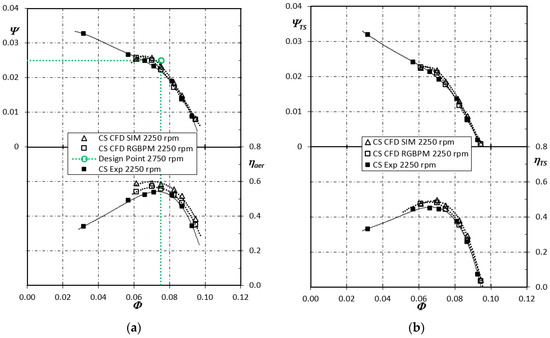
Figure 7.
CS fan aerodynamic performance at 2250 rpm as predicted by RGBPM CFD (empty square markers) vs. SIM CFD prediction (empty triangle markers) and experimental measurements (filled square markers)—the green circle marker indicates the design point (2750 rpm): (a) curves accounting for the ISO dynamic pressure contribution; (b) curves without ISO dynamic pressure contribution accounted for.
A detailed comparison between SIM CFD and RGBPM CFD is reported in Appendix A, where advantages and drawbacks of the two approaches are underlined. In the following sections, due to its higher accuracy in the prediction of ISO 5801 type A fan performance, the RGBPM CFD results will be considered to support the discussion of experimental evidence.
3. Forward-Inclined Design: Concept, Method, and Application
The analogy presented in [9], used to support the formalisation of the simplified theory of forward sweep in fan rotor blades, is graphically summarised in Figure 8. In this figure, the left-side sketches refer to the blade-to-blade view (top) and the meridional view (bottom) of a tube-axial fan. The right-side sketches, instead, refer to the side view (top) and the top view (bottom) of an aeroplane with swept wings. As shown by the sketch in the bottom-left side of the figure, the circulation gradient along the rotor blade axis associated with a non-free-vortex blade loading distribution induces a velocity component aligned with the blade axis. This velocity component results in an oblique path of the meridional flow that crosses the rotor far from the end walls. The local obliquity (γ) of the meridional flow is defined as the angle between the local meridional velocity vector and the rotor axis, and it is affected by the sign and magnitude of the circulation gradient along the radial direction. In order to replicate a similar flow relative to the aeroplane wing shown on the bottom-right of the figure, the axis of the prismatic wing must be locally swept backward by angle λ. Since the wing lifting the aeroplane is flying at the same velocity as the rotor throughflow but in the opposite direction, the magnitude of sweep angle λ must be equal to γ.
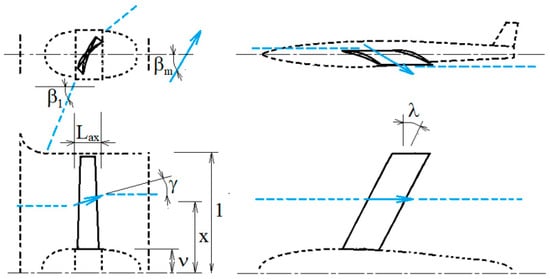
Figure 8.
Graphical representation of the analogy between fan blades implementing the constant-swirl blade loading concept and Busemann’s swept wing (taken from [4]).
This analogy explains why some moderately forward-swept fan rotors with non-free-vortex design documented in the literature were able to achieve a pressure rise higher than their unswept counterpart and, in doing so, seemed to contradict the well-known cos(λ) rule valid for aeronautical wings. In fact, according to the analogy, the aeronautical counterpart of non-free-vortex radially stacked rotor blades is a swept wing. It is not the wing whose axis forms with the aeroplane axis the same right angle as that included between the blade and the rotor axes. Such an interpretation would be expected only on the basis of purely geometrical arguments.
Thus, as reported in the Introduction, and according to the analogy, to achieve the maximum fan pressure increase from a radially stacked non-free-vortex fan rotor design, it is necessary to incorporate on the blade an appropriate amount of sweep. Such an amount shall reset around each blade aerofoil the 2D flow expected by design. Accordingly, a likewise blade design is “geometrically swept” but “aerodynamically unswept” and should be referred to as “inclined” [10].
From the application point of view, fan rotors implementing the constant-swirl blade loading concept are particularly attractive. According to the analogy, and neglecting the end-wall effect, a constant-swirl blade design—realised by means of a unique aerofoil section with a constant chord-length and constant local incidence angle all along the blade span—translates in the untwisted rectangular wing. In fact, the twist of the fan blade is merely a geometrical transformation required to replicate within the rotor reference frame the same relative flow as the untwisted wing. Furthermore, any forward or backward tilt of the rotor’s rectangular blade induces changes in the local incidence at the blade’s leading edge. It also induces changes in the aerofoil shape effective for lift. These changes depend only on the amount of tilt, regardless of the radial coordinate of each blade’s leading-edge point. The same behaviour occurs for any backward or forward tilt of an aeronautical rectangular wing. Thus, as far as the forward-inclined blade design is concerned, the conceptual difficulty of sweep incorporation reduces to estimating an average value of the meridional obliquity Γ of the bulk flow crossing the rotor. The other sweep implementation issues are simply a matter of geometrical transformations, once the sweep magnitude λ has been quantified. To summarise, in the forward-inclined design, λ is set equal to Γ.
Obviously, the higher the σ and the lower the AR of the fan rotor are, the weaker the validity of the analogy with the isolated infinite-AR rectangular wing is. This argument has been considered in simplified form within the criterion to estimate Γ, recently updated in [13] as reported in Equation (1), where Γmax and ΓMW are the maximum and mass-flow-averaged obliquities along the whole blade span.
According to Equation (1), Γ (i.e., λ of forward-inclined designs) depends on the following: the aerodynamic load of the blade (which defines εA(x) through the solution of the radial equilibrium equation at the rotor exit for a fixed εS); the blade AR (which defines γ(x) through the fulfilment of the continuity constraint imposed to any stream tube crossing the blade span from the rotor entrance to its exit—conventionally placed one blade root axial chord-length downstream of the rotor inlet plane); and the tc/B magnitude (which blends the maximum obliquity value expected at a high tc/B with the minimum obliquity value expected at a low tc/B, when the tc/B is in between such two extrema).
FI Fan: The Forward-Inclined Design Version of the CS Benchmark Fan
The FI (Forward-Inclined) fan (as the design with original ID 50I23_12 is named hereafter for the sake of immediacy) was obtained by incorporating into the CS design a forward sweep amount supposed to be appropriate for the achievement of a forward-inclined design in accordance with the above-described method. Table 2 reports the kinematic parameters derived from the solution of the radial equilibrium equation at the rotor exit. It also reports the parameters obtained from the imposition of the continuity constraint across the rotor. These values refer to the eight cylindrical surfaces (IDs) used to wrap the blade-skeleton aerofoil sections in the CS design. Since the CS blade was designed to achieve a spanwise constant εS = 0.75 and fulfil all other requirements for the validity of the simplified forward sweep theory, Table 2 could be used to estimate Γ by discrete approximation of the continuous functions included in Equation (1). According to Table 2 data, Γmax = 26.6°, and the discretised counterpart of Equation (1) yields ΓMW = 12.7° and Γ = 21.6° when tc/B = 1.7%. Such estimates are very good approximations of the numerically calculated Γmax = 26.6°, ΓMW = 16.6°, and Γ = 23°.
Table 2.
Geometric and kinematic parameters of the FI fan rotor blading.
To obtain the forward-inclined design, each aerofoil section ID of the CS blade is therefore (i) rotated around the tangent to the ID cylindrical surface that intersects the radial stacking line at 90° with respect to the rotor axis, until a meridional obliquity of Γ = 23° is achieved and (ii) shifted along the helicoidal path corresponding to the conformal mapping of the aerofoil chord onto the ID cylindrical surface, until a local angle of λ = Γ between the stacking lines of new blade and the blade of the CS design is achieved. The upper frame of Figure 9 provides a representation of the geometrical transformation of the profiles to obtain the forward-inclined blade, while the lower frames show two views of the FI fan, as extracted from its geometrical model and two pictures of the FI 3D-printed prototype mounted on the test rig.
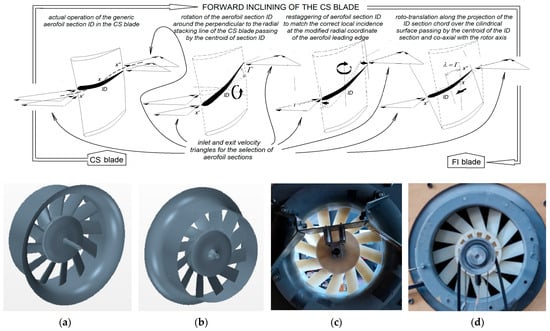
Figure 9.
Upper frame: geometrical transformation to obtain the forward-inclined blade from the CS design (adapted from [6]). Lower frames: views of the FI fan: (a) perspective front—geometrical model; (b) perspective rear—geometrical model; (c) front—3D-printed prototype mounted on the ISO 5801 type A test rig; (d) rear—3D-printed prototype mounted on the ISO 5801 type A test rig.
4. Results
This section reports in the first subsection the numerical assessment of the FI fan performance based on the RGBPM CFD results, before presenting in the second subsection the experimental assessment of the FI fan performance and the discussion of the obtained results.
4.1. CFD Assessment of the FI Fan Performance
Figure 10 reports the aerodynamic performance comparison between FI and CS designs as predicted by the RGBPM CFD model for operation at design rotational speed (2750 rpm). RGBPM CFD predicts the expected capability of blades’ forward inclination to improve both the pressure coefficient and efficiency of the original design over the entire stable operation range of the fan and with no substantial modification of the Φ value at best ηaer operation.
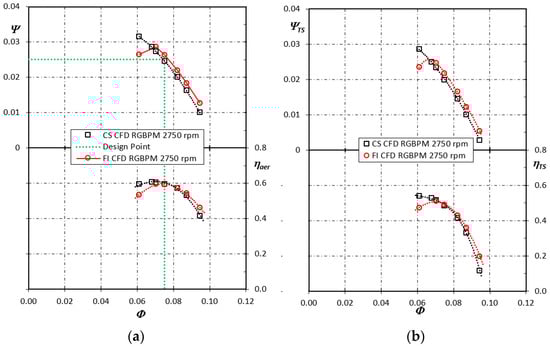
Figure 10.
FI (red markers) and CS (black markers) fan aerodynamic performance at 2750 rpm, as predicted by RGBPM CFD—the green circle marker indicates the design point (2750 rpm): (a) curves accounting for the ISO dynamic pressure contribution; (b) curves without ISO dynamic pressure contribution accounted for.
4.2. Experimental Assessment of the FI Fan Performance
The global aerodynamic performance experimentally measured for the FI design variant is reported in Figure 11 as red-coloured filled-circle markers and compared to that already shown in Figure 6 for the CS design (black-coloured filled-square markers) and with the RGBPM CFD predictions (empty markers).
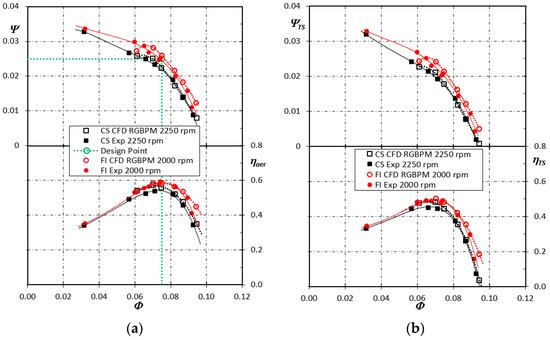
Figure 11.
FI (red circle markers) and CS (black square markers) fan aerodynamic performance at 2000 rpm and 2250 rpm, respectively, as experimentally measured (filled markers) and predicted by RGBPM CFD (empty markers)—the green circle marker indicates the design point (2750 rpm): (a) curves accounting for the ISO dynamic pressure contribution; (b) curves without ISO dynamic pressure contribution accounted for.
The generalised improvement measured for both the pressure and efficiency curves of the FI variant over the CS design is apparent. It also confirms the trends predicted by RGBPM CFD, except for the lower Φ values. In that region, the inability of steady-state CFD computations to make a reliable prediction of the stall operating range has already been highlighted. Focusing on the experimental data, first, at peak efficiency, Ψ and ΨTS gains are approximately equal to 10% and 15%, respectively. Second, the aerodynamic improvements achieved by the FI design in Ψ and ΨTS range from 2.5% (at low Φ) to more than 20% (at high Φ) and from 2.5% (at low Φ) to approximately 40% (at high Φ), respectively. These improvements are accompanied by corresponding improvements in ηaer from approximately 2% to 9% up to 15%—moving from low Φ to peak efficiency to high Φ operations—and improvements in ηTS from approximately 2% to 10% up to 33%—in the same Φ range as for ηaer. Third, from the comparison with the design point operation (green empty marker), it emerges that forward inclination of the blades permits the fulfilment of the target Ψ at design duty (ΦD), notwithstanding the lower Reynolds number operation experimentally tested (ca. 75% of the design value). This evidence could suggest forward inclination of the fan blades as a practical means at an industrial level for compensating the aerodynamic performance penalisation suffered by the smaller machines of a fan series because of their low-Reynolds number operation.
A brief consideration of experimental uncertainties and Reynolds number effects is appropriate to contextualise the measured performance. The instrumentation employed in the ISO 5801 type A test rig is the same as that described and validated in [17], with typical uncertainties on pressure measurements below ±1% and on torque measurements below ±0.5%. These uncertainty levels do not affect the qualitative trends discussed in the paper and only marginally influence the quantitative comparison between the CS and FI rotors. It is also worth noting that the experimental campaigns were conducted at rotational speeds lower than the nominal design speed, resulting in Reynolds numbers approximately 25% lower than design conditions. As previously observed in Figure 6 and consistently with standard fan similarity behaviour, the reduced Reynolds number leads to a modest penalization of both the pressure coefficient and efficiency for the baseline CS fan. Despite this, the FI configuration still demonstrates a clear and robust performance improvement across the entire operating range, indicating that the beneficial effects of forward inclination are not sensitive to the moderate Reynolds number reduction occurring in the tests.
4.3. Discussion
The overall accuracy in the prediction of ISO 5801 type A fan performance demonstrated by RGBPM CFD is helpful to further investigate the reasons for the performance improvements obtained from incorporation of forward inclination in the blade design. Figure 12a,b compare the velocity field (left side of the figure), the stream surfaces (right side of the figure), and the blade surface pressure contours predicted for the CS and FI fans, respectively.
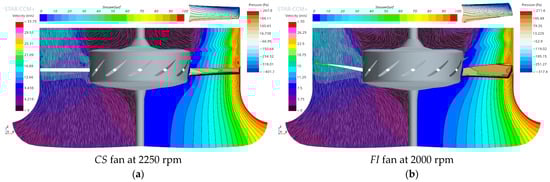
Figure 12.
Meridional view of the velocity field (left), stream surfaces (right), and relative pressure contours on the blade pressure side (bottom) and suction side (top) as predicted by RGBPM CFD at ΦD = 0.075: (a) CS fan at 2250 rpm; (b) FI fan at 2000 rpm. The different extensions of velocity scales and pressure scales correspond to each other based on fan similarity laws.
The qualitative observation shows that the minimum pressure (on the suction side) and maximum pressure (on the pressure side of the blade) are both located towards the blade tip in both fans, as expected for constant-swirl blade loading designs. However, the differential pressure between the pressure side and suction side of the blade is higher in the FI case than in the CS case. This is compatible with the higher value of the fan pressure coefficient achieved by the FI design. Moreover, FI isobars are generally more aligned with the blade axis than CS isobars, especially in the zone close to the leading edge of the blade. This alignment translates into a spanwise-inward extension of the minimum and maximum pressure zones on the suction and pressure sides of the blade surface, respectively. As underlined in [11], the addition of forward sweep (forward inclination here) to controlled vortex design blades with positive spanwise circulation gradient shortens the flow path further away from the end-wall on the blade suction side. This moderates the effect of skin friction and contributes to the efficiency gain obtained here in the FI design.
Other two qualitative points of interest in Figure 12 are that (i) the FI fan features less uniform velocity components downstream of the rotor blades than the CS fan except for the radial one and (ii) the flow separation downstream of the FI rotor extends radially outwards to a higher extent than in the case of the CS rotor. While the discussion of the last item is developed in Appendix A, the quantitative comparison of the dimensionless velocity ratios shown in Figure 13 clearly confirms the following statement: the FI configuration exhibits a steeper radial increase in εA and an overall higher εS. These features account for the larger Ψ values achieved by the forward-inclined blade, since the blade work exchange results from the combined effects of throughflow and tangential velocity components imparted to the fluid.
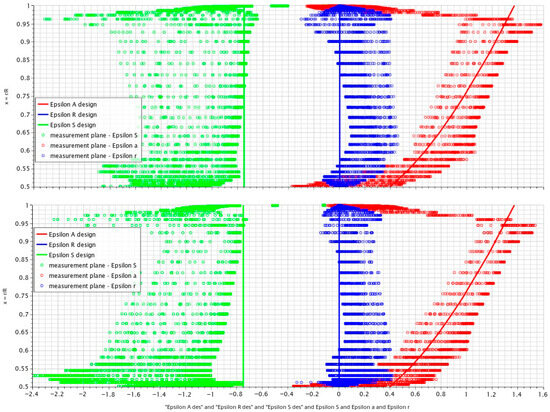
Figure 13.
Dimensionless velocity ratios at ΦD = 0.075 for the CS (top) and FI (bottom) fans as expected by design (continuous lines) and predicted by RGBPM CFD (markers) in each cell cut by the reference plane downstream of the rotor exit.
5. Conclusions
It was proven by experiments that the modification of a 0.5 hub-to-tip ratio fan by forward inclination of its blades designed to induce a roughly constant swirl velocity at the rotor exit remarkably improves the pressure and efficiency curves in the entire fan operation range with approximately 10% gain at design operation.
This experimental result confirms the validity of the forward-swept blade design method suggested by the authors for obtaining forward-inclined blade designs. It also demonstrates that the updated criterion used to estimate the meridional flow obliquity, which is required to apply the amount of sweep necessary to obtain forward-inclined blades, is effective.
In particular, it proves effective for tube-axial fan designs with a hub-to-tip ratio equal to 0.5. The CFD calculations performed to assess the fans’ design and to support the discussion of the experimental evidence confirmed a recent research finding. According to this finding, CFD predictions of the global aerodynamic performance achieved by a fan on an ISO 5801 Type A test rig are not highly reliable. This occurs when such predictions are derived from steady-state single-channel computations performed on idealised annular domains. The present outcomes suggest further investigation into the new low-order CFD modelling approach used here, which still performs single-channel steady-state computations but restricted to a domain including the sole real fan geometry (from bell-mouth to exit flange), where constant static pressure is imposed as a boundary condition at the fan exit.
Author Contributions
Conceptualization, M.M.; methodology, M.M. and P.D.; software, P.D. and M.M.; validation, P.D., S.R. and M.M.; formal analysis, M.M.; investigation, P.D.; resources, S.R. and P.D.; data curation, P.D., S.R. and M.M.; writing—original draft preparation, M.M. and S.R.; writing—review and editing, P.D. and S.R.; visualisation, M.M. and S.R.; supervision, M.M.; project administration, M.M.; funding acquisition, S.R. All authors have read and agreed to the published version of the manuscript.
Funding
This research received no external funding.
Data Availability Statement
The raw data supporting the conclusions of this article will be made available by the authors upon reasonable request to the corresponding author.
Acknowledgments
The authors acknowledge Roberto Losco for the 3D printing of fan prototypes tested in this work.
Conflicts of Interest
The authors declare no conflicts of interest.
Abbreviations
The following abbreviations are used in this manuscript:
| CFD | Computational Fluid Dynamics |
| CS | Constant-Swirl |
| FI | Forward-Inclined |
| RGBPM | Real Geometry and Pressure Boundary Model |
| SIM | Semi-Idealised Model |
Appendix A
Figure A1 compares the shapes of the physical domain considered in the SIM CFD and RGBPM CFD modelling approach. The two domains are perfectly equal from the bell-mouth entrance up to the blade channel exit and differ from each other in the part downstream of the rotor blade only.

Figure A1.
Views of the physical domain and associated computational grid employed to simulate the aerodynamic performance of the CS fan with the two low-order CFD modelling approaches: (a) SIM CFD; (b) RGBPM CFD.
Figure A1.
Views of the physical domain and associated computational grid employed to simulate the aerodynamic performance of the CS fan with the two low-order CFD modelling approaches: (a) SIM CFD; (b) RGBPM CFD.

Figure A2 reports the performance curves—with ISO dynamic pressure contribution included—as predicted by the two CFD modelling approaches at the nominal rotational speed of the rotor. In particular, Figure A2a shows the global aerodynamic performance prediction of SIM CFD, whereas Figure A2b—which is a copy of Figure 10a—shows the corresponding predictions obtained with RGBPM CFD. From the qualitative point of view, the two modelling approaches predict the same trend in the aerodynamic performance curves and differences between the two are mostly quantitative. In particular, RGBPM CFD predicts a slightly higher beneficial effect of blade forward inclining on aerodynamic performance, in better agreement with experimental measurements than SIM CFD predictions. The higher sensitivity of RGBPM CFD to forward inclination of the blades comes from its estimation of CS and FI fan performance, which is lower and higher, respectively, than the corresponding estimation of SIM CFD.

Figure A2.
CS (black-coloured markers) and FI (red-coloured markers) fan aerodynamic performance at 2250 rpm and 2000 rpm, respectively (ISO dynamic pressure contribution is accounted for), as predicted by the two low-order modelling approaches: (a) SIM CFD; (b) RGBPM CFD.
Figure A2.
CS (black-coloured markers) and FI (red-coloured markers) fan aerodynamic performance at 2250 rpm and 2000 rpm, respectively (ISO dynamic pressure contribution is accounted for), as predicted by the two low-order modelling approaches: (a) SIM CFD; (b) RGBPM CFD.

Further insights can be extracted from Figure A3, which compares the spanwise distributions of the dimensionless velocity ratios at the exit reference plane of the CS and FI rotors in operation at ΦD as predicted by the two modelling approaches.

Figure A3.
Dimensionless velocity ratios at ΦD = 0.075 for the CS and FI fans as expected by design (continuous lines) and predicted by SIM CFD and RGBPM CFD (markers) in each cell cut by the reference plane downstream of the rotor exit for operation at the rotational speed settled in the experiments: (a) CS distributions predicted by SIM CFD at 2250 rpm; (b) FI distributions predicted by SIM CFD at 2000 rpm; (c) CS distributions predicted by RGBPM CFD at 2250 rpm; (d) FI distributions predicted by RGBPM CFD at 2000 rpm.

In general, both modelling approaches describe the same qualitative differences in velocity distributions between the two fan designs. In particular: (i) the εS of the FI fan (green markers in Figure A3b,d) is slightly higher (on average) and less uniform than that of the CS fan (green markers in Figure A3a,c); (ii) the εA of the FI fan (red markers in Figure A3b,d) is slightly less uniform and more biassed towards higher radii than that of the CS fan (green markers in Figure A3a,c); (iii) the εR of the FI fan (blue markers in Figure A3b,d) is lower (on average) and more uniform than that of the CS fan (red markers in Figure A3a,c). Occurrences (i) and (ii) contribute to more work performed by the FI blades and correspondingly higher fan pressure of the FI fan, as predicted by both modelling approaches. Thus, it is concluded that there are no reasons to prefer RGBPM CFD to SIM CFD as far as the preliminary assessment of a theoretical design concept is concerned. In fact, this justifies why RGBPM CFD was completely omitted in [15], where all comments related to conceptual aerodynamic design aspects were supported by SIM CFD only. On the other hand, the same occurrence (iii) manifests to a different extent in the results of the two modelling approaches. In fact, it clearly appears that the local εR magnitude predicted by RGBPM CFD (blue markers in Figure A3c,d) is higher than that predicted by SIM CFD (blue markers in Figure A3a,b) regardless of the fan design. This suggests that the different shape of the domain considered in the two modelling approaches plays a role mostly in the magnitude of the radial velocity at the rotor exit. Figure A4 compares the meridional flow field as predicted by RGBPM CFD for the CS and FI fans in operation at the nominal flow rate coefficient (see Figure A4c,d)—already shown in Figure 13—to the corresponding flow fields as predicted by SIM CFD for the CS fan (see Figure A4a) and FI fan (see Figure A4b), respectively.

Figure A4.
Meridional view of the velocity field (left), stream surfaces (right), and relative pressure contours on the blade pressure side (bottom) and suction side (top) as predicted by the two CFD modelling approaches at ΦD = 0.075: (a) CS fan in operation at 2250 rpm (SIM CFD); (b) FI fan at 2000 rpm (SIM CFD); (c) CS fan in operation at 2250 rpm (RGBPM CFD); (d) FI fan at 2000 rpm (RGPBM CFD). The different extensions of velocity scales and pressure scales correspond to each other based on fan similarity laws.

The comparison confirms the reasoning presented in Section 2.5.1 as a basis for the proposal of RGBPM CFD, namely that the hub with infinite length downstream of the rotor blades and the radial equilibrium condition at the domain exit, both provided in the SIM CFD approach, limit the flow separation from the hub surface (the former) and the outward migration of the meridional flow before the exit section of a fan discharging into an open environment (the latter). This makes evident the advantage of RGBPM CFD over SIM CFD as far as predictions of aerodynamic performance expected from ISO 5801 type A fan testing are concerned.
References
- Beiler, M.G.; Carolus, T.H. Computation and measurement of the flow in axial flow fans with skewed blades. ASME J. Turbomach. 1999, 121, 59–66. [Google Scholar] [CrossRef]
- Vad, J. Aerodynamic effects of blade sweep and skew in low-speed axial flow rotors at the design flow rate: An overview. Proc. IMechE Part A J. Power Energy 2008, 222, 69–85. [Google Scholar] [CrossRef]
- Wright, T.; Simmons, W.E. Blade sweep for low-speed axial fans. ASME J. Turbomach. 1990, 112, 151–158. [Google Scholar] [CrossRef]
- Yamaguchi, N.; Tominaga, T.; Hattori, S.; Mitsuhashi, T. Secondary-loss reduction by forward-skewing of axial compressor rotor blading. In Proceedings of the Yokohama International Gas Turbine Congress, Yokohama, Japan, 27 October–1 November 1991; pp. II.61–II.68. [Google Scholar]
- Mohammad, K.P.; Prithvi Raj, D. Investigation on axial flow fan impellers with forward swept blades. ASME J. Fluids Eng. 1977, 99, 543–547. [Google Scholar] [CrossRef]
- Beiler, M.G. Untersuchung der dreidimensionalen Strömung Durch Axialventilatoren Mit Gekrümmten Schaufeln. Doctoral Dissertation, Universität–GH–Siegen, Düsseldorf, Germany, 1996. [Google Scholar]
- Corsini, A.; Rispoli, F. Using sweep to extend the stall-free operational range in axial fan rotors. Proc. IMechE Part A: J. Power Energy 2004, 218, 129–139. [Google Scholar] [CrossRef]
- Glas, W. Optimierung Gepfeilter Pumpenschaufeln Mit Evolutionären Algorithmen. Ph.D. Thesis, Technical University of Graz, Institute for Hydraulic Fluid Machinery, Graz, Austria, 2000. [Google Scholar]
- Masi, M.; Lazzaretto, A. A simplified theory to justify forward sweep in low hub-to-tip ratio axial fan. In Proceedings of the ASME Turbo Expo 2015, Montréal, QC, Canada, 15–19 June 2015. [Google Scholar]
- Masi, M.; Lazzaretto, A. The design of tube-axial fans with forward inclined blades—Part II. La Termotec. 2021, 8, 68–72. (In Italian) [Google Scholar]
- Vad, J. Forward blade sweep applied to low-speed axial fan rotors of controlled vortex design: An overview. ASME J. Eng. Gas Turbines Power 2013, 135, 1–9. [Google Scholar] [CrossRef]
- Masi, M.; Lazzaretto, A. A New Practical Approach to the Design of Industrial Axial Fans: Part II—Forward-Swept Blades with Low Hub-to-Tip Ratio. In Proceedings of the ASME Turbo Expo 2019, Phoenix, AZ, USA, 17–21 June 2019. [Google Scholar]
- Masi, M.; Danieli, P.; Dal Cin, E.; Bregolin, E. Effects of different blade loading strategies applied to low-speed tube-axial fans. J. Glob. Power Propuls. Soc. 2025, 9, 173–191. [Google Scholar] [CrossRef] [PubMed]
- Masi, M.; Lazzaretto, A.; Castegnaro, S. Effectiveness of Blade Forward Sweep in a Small Industrial Tube-Axial Fan. In Proceedings of the Conference Paper Fan 2018, Darmstadt, Germany, 18–20 April 2018. [Google Scholar]
- Masi, M.; Danieli, P.; Rech, S. Design of Forward-Inclined Blades for a 0.5 Hub-to-Tip Ratio Tube-Axial Fan. In Proceedings of the FAN 2025—8th International Conference on Fan Noise, Aerodynamics, Applications and Systems, Antibes Juan-les-Pins, France, 9–11 April 2025. [Google Scholar]
- ISO 5801:2007; Industrial Fans—Performance Testing Using Standardized Airways. ISO—International Organization for Standard: Geneva, Switzerland, 2007.
- Masi, M.; Lazzaretto, A.; Danieli, P.; Bettanini, C. Design of a small axial-flow fan with 0.2 hub-to-tip ratio. In Proceedings of the FAN 2022—7th International Conference on Fan Noise, Aerodynamics, Applications and Systems, Senlis, France, 27–29 June 2022. [Google Scholar]
- Boshoff, F.D.; van der Spuy, S.J.; Pretorious, J.P.; Meyer, C.J. Investigation into the predicted performance of a cooling fan for an sCO2 concentrated solar power plant. Proc. IMechE Part A J. Power Energy 2024, 238, 788–799. [Google Scholar] [CrossRef]
- Masi, M.; Danieli, P. Assessment of a New 0.2 Hub-To-Tip Ratio Propeller Fan Design with Rigid-Body Blade Loading. ASME J. Eng. Gas Turbines Power 2026, 148, 021008. [Google Scholar] [CrossRef]


Disclaimer/Publisher’s Note: The statements, opinions and data contained in all publications are solely those of the individual author(s) and contributor(s) and not of MDPI and/or the editor(s). MDPI and/or the editor(s) disclaim responsibility for any injury to people or property resulting from any ideas, methods, instructions or products referred to in the content. |
© 2026 by the authors. Licensee MDPI, Basel, Switzerland. This article is an open access article distributed under the terms and conditions of the Creative Commons Attribution (CC BY) license.