Abstract
This article presents an analysis of the impact of photovoltaic (PV) sources on the effectiveness and selectivity of earth fault protection in a 6 kV industrial distribution network. Simulations were conducted in the ATP-EMTP environment using a model of a generalized, real industrial network with an isolated neutral point. This model was based on data from real-world cases of earth faults with varying resistance. This study’s main objective was to determine how the power generated by PV sources affects the time and spectral waveforms of currents and zero-sequence voltages, in addition to the network’s overall response to disturbances. The results provide a quantitative assessment of the impact of distributed generation on the operational security of industrial power grids and form a basis for developing recommendations for coordinating protection in power systems integrated with renewable energy sources.
1. Introduction
The dynamic development of renewable energy sources, particularly photovoltaics, is driving significant changes in the operation of medium-voltage power grids [1,2,3,4,5,6]. The increasing share of distributed generation is leading to a reversal of the traditional direction of power flow, increased voltage variability and the emergence of higher current harmonics [7,8]. These phenomena, although desirable from the perspective of energy transition and decarbonization, can negatively affect the stability and resilience of distribution systems, especially in grids with a specific neutral-point configuration [8,9,10].
Systems with an isolated transformer neutral point are used in many medium-voltage industrial networks, particularly in large manufacturing plants [1,8,11]. Their primary advantage lies in their ability to continue operation after a single earth fault, as the fault current is limited to a low capacitive level [12]. However, networks of this type are also characterized by complex earth fault phenomena and strict requirements for protection automation. In such conditions, the reliable operation of earth fault protection, including overcurrent (I0>) and admittance (Y0>) protection, is fundamental to ensuring the safety and continuity of power supply [3,4,5,6,7,8].
The inclusion of local photovoltaic sources in these networks causes significant changes in the active and reactive power balance, as well as in the parameters of zero-sequence currents and voltages [13,14,15,16,17]. As a result, the selectivity of protections may be disrupted, and the resistance of the network to disturbances may deteriorate, especially during high-resistance short circuits. Accurate modeling of these phenomena requires the use of simulation tools that enable dynamic analysis of transient systems. One of the most commonly used computational environments of this type is ATP-EMTP (Alternative Transients Program-Electromagnetic Transients Program), which allows for accurate representation of both linear and non-linear elements of power grids, including converter sources [18,19].
The literature on this subject [13,14,20,21] has extensively analyzed the impact of photovoltaic integration on the stability and quality of voltage in low and medium-voltage networks. However, the issues of earth fault protection and the resilience of systems with an isolated neutral point in the presence of PV have been addressed much less frequently. A few studies [22] have indicated that dynamic power changes on the PV source side can modify zero-sequence waveforms, making it difficult for protection devices to correctly distinguish between fault conditions.
EMTP/ATP models are most commonly used to analyze transient electromagnetic phenomena and the impact of converters on the grid. The literature [9,10,15,23,24] contains studies on the modeling of PV components and inverters in EMTP/ATP (models of a single PV module diode, MPPT, DC/DC and DC/AC blocks, as well as simplified IBR/GRID-FOLLOWING models suitable for time-domain studies). Both detailed models (for local disturbance studies) and equivalent models for system studies are useful. In the context of ATP, some studies have implemented inverter models and validated them experimentally [15,16,17].
This paper presents the results of simulation studies conducted in the ATP-EMTP environment to examine the impact of photovoltaic sources on the immunity and selectivity of earth fault protection in a 6 kV industrial distribution network. The analyzed system is a generalized example of a real industrial network with a topology inspired by the structure of large systems with an isolated neutral point. The network model was developed on the basis of real data, including cases of earth faults with different resistances.
These studies aim to determine the impact of the share of photovoltaic power on:
- time and spectral waveforms of currents and zero-sequence voltages,
- the effectiveness and selectivity of earth fault protection,
- the overall resistance of the network to earth faults.
The results obtained enable a quantitative assessment of the impact of distributed generation on the operational security of industrial networks with an isolated neutral point and also provide a basis for formulating recommendations for the coordination of protection devices in systems integrated with renewable energy sources.
2. Materials and Methods
2.1. Description of the Analyzed Network
The analyzed power system is an example of a 6 kV industrial distribution network with an isolated neutral point, powered by a 110/6 kV transformer with a capacity of 202.6 MVA. The network’s topology was developed based on data from a large industrial plant in Poland (Zofiówka coal mine, Jastrzębie Zdrój, Poland) and is typical of the structure used in extensive industrial installations (Figure 1). The network comprises:
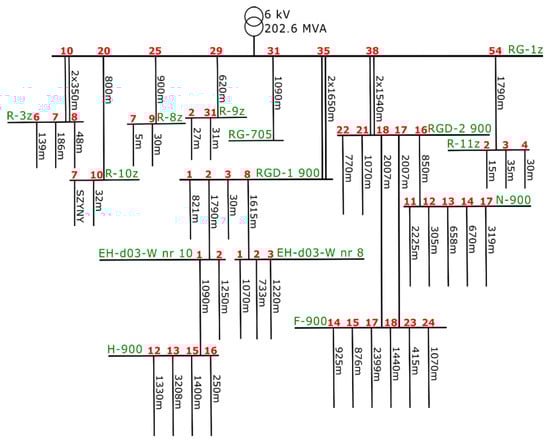
Figure 1.
Diagram showing the network configuration for the analyzed phenomena based on the network from the Zofiówka coal mine on 19 July 2020 and 24 October 2020.
- 14 switchboards, including one main switchboard,
- cable lines ranging from several dozen to several thousand meters in length,
- an earth fault current of 70.1 A,
- 32 receivers in the form of three-phase induction motors with power ratings ranging from 20 to 705 kW.
In the analyzed medium-voltage network with an isolated neutral point, the ground fault current loop is primarily closed by the distributed ground capacitances of the operational power lines/cables and the parasitic capacitances of power station equipment. As a result, during a single ground fault, the fault current is predominantly capacitive, and its value depends upon the total network-to-ground capacitance, rather than the intentional neutral grounding impedance.
This network was treated as a general representation of a medium-voltage industrial distribution system rather than a model of a specific mining system. Its topology and electrical parameters reflect the typical operating conditions of large industrial plants powered from 110/6 kV transformers, where detecting and analyzing earth faults in networks with an isolated neutral point remains a significant problem. Using a real network for reference allows for highly realistic analyses and direct comparisons between the model’s behavior and measured operational data.
The simulated waveforms of zero currents and voltages were compared with measurement records at selected locations in the network in terms of both the conformity of the waveform shapes and the voltage and current values.
2.2. Justification for Choosing the ATP-EMTP Environment
One of the most important elements of the experimental design was the selection of a numerical simulation model of the network required for the subsequent analysis. To this end, it was necessary to select a programming environment that would enable a range of different measurement and simulation activities to be carried out. One of the principal considerations in the selection of the program was the extensive body of evidence accumulated over the past three decades demonstrating that simulation results produced by EMTP-based software have been repeatedly and comprehensively validated against measurement data. The complexity of industrial distribution networks motivated the definition of the following criteria in the selection of the simulation program:
- the ability to model an extensive power grid consisting of a large number of nodes and branches;
- a wide selection of cable line models;
- the ability to use multiple voltage sources simultaneously, as well as sources containing higher harmonics;
- the ability to save results in a format that allows them to be analyzed in external calculation programs such as MATLAB or Microsoft Excel.
The ATP-EMTP simulation environment was ultimately selected due to its numerous benefits. This included the large community of developers and users associated with the software, which was anticipated to enable discussion of the results with a broad international community.
Furthermore, an important argument in favor of choosing the ATP-EMTP environment is its utility in modeling power networks consisting of a large number of nodes and branches. The program also includes several built-in cable line models (Noda, jMarti, Π) [18,25,26,27,28,29,30], which allow for the selection of the most appropriate model for a given task. ATP-EMTP also allows for the use of multiple voltage sources simultaneously and sources consisting of higher harmonics.
The maximum parameters of the analyzed network (number of nodes—6000, number of branches—10,000, number of sources—900) are sufficient to recreate more complex industrial medium-voltage networks. ATP-EMTP also allows for the calculation of line parameters based on geometric and material data, which is particularly useful for complex networks.
It is further worth noting the ease of use of the entire ATP-EMTP environment. The basic tool for creating and editing input data is a text editor, and the ATPDRAW program allows for graphical editing of these data. After creating a network model and entering the input data, the program saves it with the extension *.dat or .atp. The main part of the package (the TPBIGx.EXE program) is run in a DOS command window. Its purpose is to process the input data (.dat or *.atp) and perform simulation calculations. The simulation results are saved in *.pl4 format and can be easily analyzed in the built-in PLOTXY program. In addition, ATP-EMTP provides the PL4TOMAT program, which allows for the conversion of results from *.pl4 format to *.mat format. This format allows for the simulation results to be read by MATLAB v. R2020a, which has much broader capabilities for analyzing results than the built-in PLOTXY program. It is worth noting that ATP-EMTP is one of the most popular programs for simulating electrical power supply systems, and its development is still active. In addition, ATP-EMTP complies with international norms and industry standards, making it an indispensable tool for the design and analysis of electrical power systems.
2.3. Selection of Cable Line Model and Earth Fault for Verification of Modelled Network Compliance with Actual Network
The development of the network model in the ATP-EMTP environment hinged on the selection of an appropriate cable line model that would ensure accurate representation of transient phenomena accompanying earth faults. Therefore, a comparative analysis of two models available in the program was carried out: the classic Π model and the zCable model developed by J. Marti [27,28]. Both models take into account the transverse and longitudinal parameters of cable lines, but differ in their representation of interphase couplings and frequency dependencies.
The suitability of the individual models was assessed using a simplified test system (Figure 2 and Figure 3), which consisted of a 6 kV bus network with an isolated neutral point and three branches with lengths of 1000 m, 350 m and 100 m, made of YHKGYFtlyn 3 × 185 mm2 cables [31,32]. The unit earth fault current of this cable was 2.83 A/km. In each case, a metallic earth fault occurring at the end of one of the branches was simulated. The earth fault current values obtained in the simulations were compared with the results of the theoretical calculations.
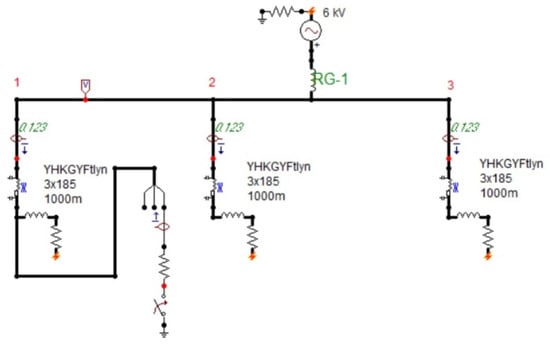
Figure 2.
Model of a simple network with an isolated neutral point of a single-sided 6 kV busbar. Example of a Π model simulated in the ATP-EMTP program for a metallic ground fault occurring at the end of field no. 1. The length of each branch in the presented example is 1000 m.
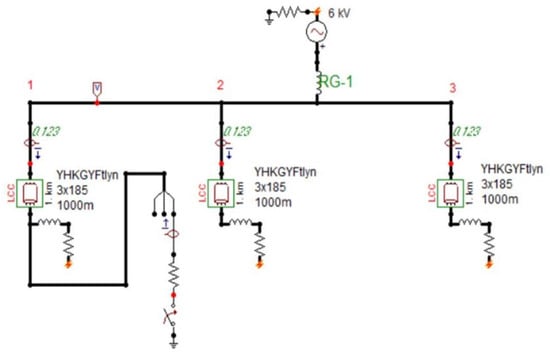
Figure 3.
Model of a simple network with an isolated neutral point of a single-sided 6 kV busbar. Example of a zCable model simulated in the ATP-EMTP program for metallic grounding occurring at the end of field no. 1. The length of each branch in the presented example is 1000 m.
The results obtained showed very good agreement between both the models and the calculated values (differences < 8%) (Table 1). Additionally, it was noted that the zCable model better reproduced wave phenomena and reduced the share of higher harmonics in the transient state, while the Π model was characterized by greater numerical stability and also allowed for the modeling of shorter cable sections, which is important in the case of complex industrial networks. These properties, coupled with the numerical errors of the zCable model at cable lengths below 500 m, motivated the adoption of the Π model for further analysis as a compromise between the accuracy of representation and stability of calculations.

Table 1.
Comparison of simulation results with calculation results for a 6 kV network with an isolated neutral point, a three-branch busbar, single-sided power supply, with the same cables and the same branch lengths.
Next, a ground fault model was selected for use in the process of verifying the conformity of the network model with reality. The literature [33,34,35] distinguishes between two basic types of ground fault models in networks with an isolated neutral point:
- a resistive short-circuit model with variable resistance, enabling analysis of dynamic processes accompanying low-resistance short circuits (Figure 4a), and
- a short-circuit model with two fixed resistances switched semi-periodically, used for high-resistance short circuits in which there is asymmetry between the positive and negative voltage half-cycles (Figure 4b).

Figure 4.
Ground fault models used: (a) for low-resistance faults, (b) for high-resistance faults.
Comparison of the simulated and actual networks incorporated both earth fault models, which were selected according to the type of fault that occurred. In cases where the earth fault resistance did not correspond with either a low-resistance or a high-resistance fault, an alternative model was applied, consisting of two time-varying resistances switched semi-periodically (Figure 5). This approach combined the characteristics of both ground fault models. The diodes force the branch with R1 to conduct during the positive half-cycle of the voltage, while the branch with R2 conducts during the negative half-cycle. In this way, the model reproduces the observed asymmetry between the positive and negative half-cycles. The variable resistance over time R1 and R2 takes into account the non-linearity of the current-voltage characteristics of the ground fault model, which is itself non-linear. In the model, it is assumed that both resistances are functions that vary over time, identified by the Monte Carlo fitting method.
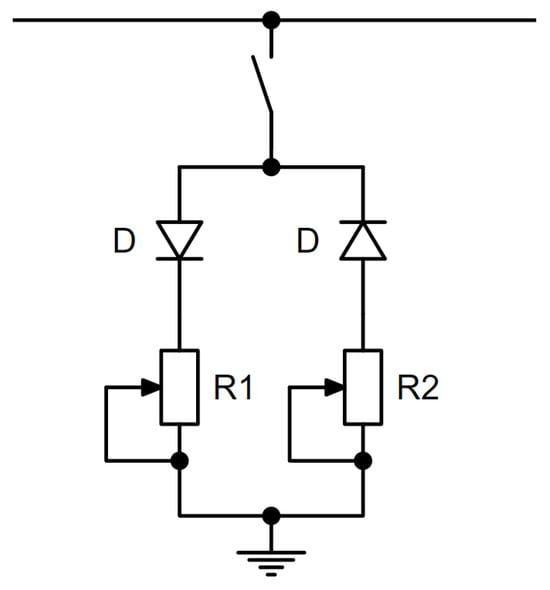
Figure 5.
The earth fault model as two time-varying resistances switched semi-periodically.
2.4. Analysis of Selected Cases to Verify the Correctness of the Simulation Model
After adopting the above criteria, this study focused on a 6 kV industrial distribution network with an isolated neutral point from the Zofiówka coal mine. Verification of the network model in the ATP-EMTP environment was carried out by analyzing three ground fault event scenarios recorded in the actual network:
- Case no. 1: high-resistance short circuit with variable resistance in line RGD-2 p. 22 at 495 m,
- Case no. 2: metallic short circuit in line RGD-2 p. 22 at 495 m,
- Case no. 3: high-resistance short circuit with variable resistance in line H-900 p.16 at 200 m.
For consistency, the types of ground faults in the cases discussed were preliminarily classified using the following indicators:
- the effective value of the zero component voltage U0 as an approximation of the fault resistance level,
- characteristics of 3I0 waveforms in individual fields, in particular half-cycle asymmetry and degree of variability over time in the 80 ms observation window.
High-resistance faults are characterized by a relatively low U0 value and pronounced half-cycle asymmetry; metallic/low-resistance faults are characterized by U0 close to the rated phase voltage and almost symmetrical waveforms; short circuits with variable resistance are characterized by gradual changes in amplitude and asymmetry over time.
2.4.1. High-Resistance Short Circuit in Line RGD-2 p. 22 at 495 m
The first of the events used to validate the model occurred on 19 July 2020 at 03:19:22 in field 22 of the RGD-2 switchgear (the twenty-second feeder bay), located at a depth of 900 m. The line where the damage occurred was made of YHKGXSekyn 3 × 70 mm2 cable [31], and the ground fault location was approximately 495 m from the beginning of the cable. The nature of the recorded currents and voltages indicated a high-resistance short circuit, typical of insulation damage where there is no complete dielectric breakdown. Operational analysis confirmed that the incident was likely attributable to the aging of the cable insulation, which subsequently led to a local weakening of its dielectric properties.
The earth fault protection devices operated correctly, and the line was immediately switched off. After a short time, the electrical protection automation re-energized the circuit, which led to the reappearance of the earth fault (analyzed as case no. 2). Data for the analyzed event were obtained from five multiMUZ-2 and multi-MUZ-3 field controllers [36,37] controllers located in the RG-1z (bays 25 and 38) and RGD-2 (bays 18, 21 and 22) switchgear bays. The recorded waveforms included zero-sequence currents (3·I0) with a sampling frequency of 1 kHz (Figure 6). The effective value of the zero-sequence voltage obtained from the control room (approx. 28% of the rated phase voltage) clearly indicates that the event was of a high-resistance nature.
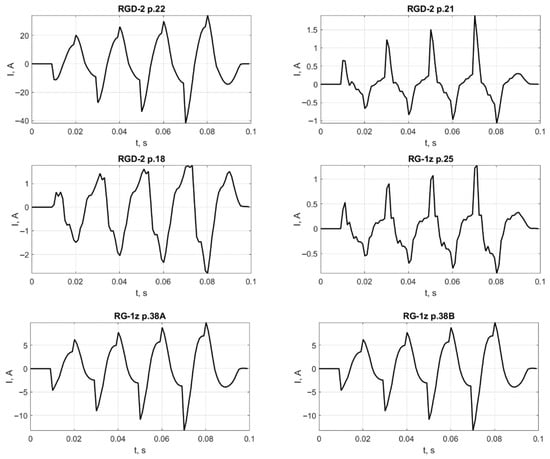
Figure 6.
3I0 current waveforms recorded by measuring equipment. The sampling frequency was 1000 Hz. Short circuit duration: 80 ms.
Analysis of the recorded waveforms (Figure 6) revealed asymmetry between the positive and negative half-cycles of current I0 and its gradual increase over time. Therefore, the short-circuit resistance models shown in Figure 4 were rejected, and instead, a short-circuit model with two half-periodically switched resistances varying over time (Figure 5) was adopted, which better reflects the observed asymmetry and short-term current peaks occurring when the voltage U0 passes through zero.
The parameters of the earth fault model were matched to the measurement data using an optimization procedure based on the Monte Carlo method and minimization of the absolute error (MAE) between the simulated and recorded waveforms [38,39]. The measurement data were subjected to quadratic interpolation, which made it possible to maintain the dynamics of the signals at a simulation sampling frequency of Δt = 10−8 s. Four models were compared: one with constant resistance (model no. 1), one with two constant resistances switched semi-periodically (model no. 2), one with time-varying resistance (model no. 3) and one with two time-varying resistances switched semi-periodically (model no. 4). The results for the optimal resistance values of each model are presented in Table 2.
Table 2.
The value of the deviation of average currents in I0 in individual fields for selected earth fault current models, which were optimized using the least absolute error method for case no. 1.
Table 2 shows the accuracy of the analyzed short-circuit models by comparing the average absolute deviations (ΔI) of the zero current component, calculated for multiple measurement points in the network. The model for which the lowest ΔI values were obtained in all analyzed fields was considered to be the most representative of the actual recordings and was used in further validation stages.
The example waveforms shown in Figure 7 and Figure 8, comparing the recorded waveforms with the results of the simulations, show that the proposed model for the analyzed case closely reflects the actual shape of the short-circuit current waveform. It can be seen that in lines that are not directly related to the short-circuit location, the noise appearing in the calculation results was significantly greater than in lines related to ground faults. The observed oscillations are largely related to the fact that the Π model of a cable line is a model with a very large number of nodes and branches that can resonate with each other [27,28,29,30,40,41,42]. Nevertheless, for a line in which a short circuit has occurred, the impact of such oscillations is negligible.
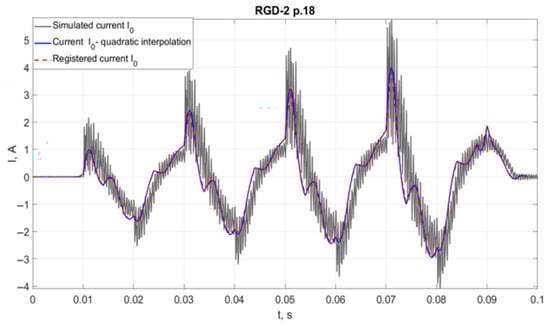
Figure 7.
Current waveforms 3I0 over time for field 18 in the RGD-2 switchgear for the short circuit discussed in case no. 1. The characteristic curve shows the recorded data, quadratic interpolation of the recorded data, and the waveform resulting from the simulation for the resulting short-circuit resistance model.
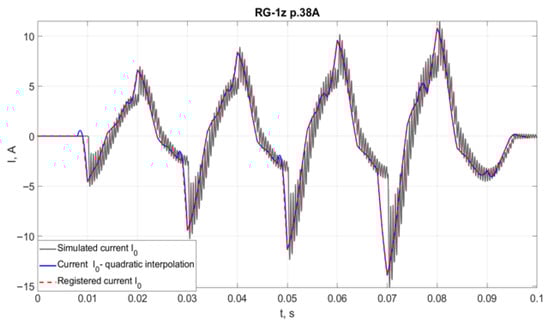
Figure 8.
Current waveforms 3I0 over time for field 38 A (one of two parallel lines) in switchgear RG-1z for the short circuit discussed in case no. 1. The characteristic curve shows the recorded data, quadratic interpolation of the recorded data, and the waveform resulting from the simulation for the resulting short-circuit resistance model.
2.4.2. Metal Short Circuit in Line RGD-2 p. 22 at 495 m
The second of the analyzed events took place on 19 July 2020 at 5:37:54 and also occurred in field 22 of the RGD-2 switchgear, which was located at a depth of 900 m. As in the previous case, the power line was made of YHKGXSekyn 3 × 70 mm2 cable, and the ground fault location was approximately 495 m from the beginning of the line. The characteristics of the recorded current and voltage waveforms clearly indicated a low-resistance short circuit, closely resembling a metallic fault. The probable cause of the damage was further degradation of the cable insulation caused by the earlier high-resistance grounding described in case no. 1.
The earth fault protection devices operated correctly, immediately switching off the damaged line. After a short time, the automatic restoration system re-energized the field, which, in the presence of a low-resistance short circuit, could have resulted in a significant increase in short-circuit current and energy. Consequently, at approximately 7:30 a.m., a three-phase short circuit to earth occurred, confirming the validity of the analysis of previous single earth fault events. The recording data came from four field controllers: multiMUZ-3 (fields 29 and 38 of the RG-1z switchgear) and multiMUZ-2 (fields 21 and 22 of the RGD-2 switchgear). The first signal confirming the low nature of the short-circuit resistance was the effective value of the zero-sequence voltage U0, which reached 99% of the rated phase voltage. In addition, a rapid increase in the instantaneous values of the current 3·I0 was recorded at the moment of short-circuit initiation.
The analysis adopted a short-circuit model with a constant, low resistance Rf, which was fitted using the Monte Carlo method with minimization of the absolute error (MAE) between the simulation data and the recorded signals. The assumption of a constant short-circuit resistance Rf in this case is justified because the recorded waveforms showed characteristics of a low-resistance ground fault similar to a metallic one. In particular, no clear half-period asymmetry of the zero current component or unambiguous variability of the short-circuit path over time was observed in the analyzed 80 ms time window. Under such conditions, the short circuit can be modeled with good approximation as a resistive element with constant resistance. As in case no. 1, the measurement data were subjected to quadratic interpolation to preserve non-linear changes in waveforms over time.
The obtained values of average deviations ΔI in individual fields are presented in Table 3. Based on these values, the optimal short-circuit resistance was determined to be Rf = 1.82 Ω, which accurately reflects the actual nature of low-resistance grounding.
Table 3.
Value of the deviation of average currents in I0 in individual fields for the constant resistance earth fault model, which were optimized using the least absolute error method for case no. 2.
Figure 9 presents the recorded and simulated waveforms for field 22 of the RGD-2 switchgear, demonstrating the alignment between the models and the real system.
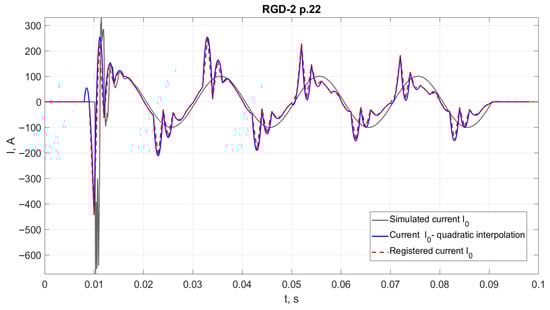
Figure 9.
Current waveforms 3I0 over time for field 22 in the RGD-2 switchgear for the short circuit discussed in case no. 2. The characteristic curve shows the recorded data, quadratic interpolation of the recorded data, and the waveform resulting from the simulation for the resulting short-circuit resistance model.
An analysis of the absolute error between the measured and simulated signals showed that the differences did not exceed 5% in fields directly related to the short-circuit location. The low-resistance earth fault model used in the ATP-EMTP environment with a high level of accuracy reflects the actual course of the fault, providing a reference point for subsequent analyses of the impact of PV integration on grid resilience.
2.4.3. High-Resistance Short Circuit with Variable Resistance in Line H-900 p.16 at 200 m
The third case analyzed, unrelated to the previous events, occurred on 24 October 2020 at 19:06:18 in field 16 of line H-900, approximately 200 m from the beginning of the YHKGXSekyn 3 × 50 mm2 cable. The nature of the recorded waveforms indicated a high-resistance short circuit with variable resistance over time, which made the analysis of this case particularly interesting from the point of view of ground fault dynamics in industrial networks with an isolated neutral point. Subsequent visual inspection of the cable revealed local damage to the sheath, suggesting that mechanical damage may have been the cause of the earth fault. At the time of the incident, the earth fault protection operated correctly, immediately disconnecting the line. After reclosing, unlike in previous cases, no further faults were recorded, indicating the transient nature of the phenomenon.
The registration data came from five multiMUZ-2 field controllers located in fields 2 and 8 of the RGD-1 switchgear and fields 13, 15 and 16 of the H-900 switchgear. Analysis of the recorded 3I0 currents revealed half-cycle asymmetry and a gradual change in amplitude, characteristic of variable resistance earth faults.
In order to map the phenomenon, the same short-circuit model was used that achieved the best fit in case no. 1: a model with two time-varying resistances switched semi-periodically. The model parameters were adjusted using the Monte Carlo method with minimization of the absolute error (MAE) relative to the quadratically interpolated measurement data. Results analogous to those in the previous cases are presented in Table 4 and Figure 10.
Table 4.
The value of the deviation of average currents in I0 in individual fields for the grounding model with two time-varying resistances switched semi-periodically, which were optimized using the least absolute error method for case no. 3.
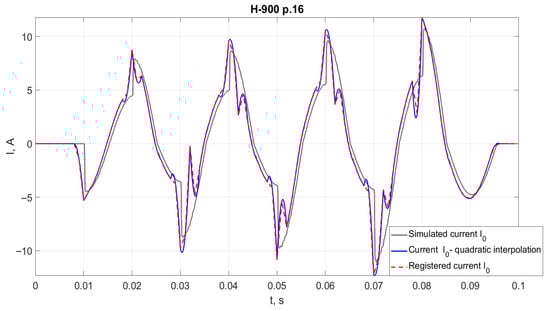
Figure 10.
Current waveforms 3I0 over time for field 16 in switchgear H-900 for the short circuit discussed in case no. 3. The characteristic curve shows the recorded data, quadratic interpolation of the recorded data, and the waveform resulting from the simulation for the resulting short circuit resistance model.
The results obtained showed very good agreement between the recorded and simulated waveforms, especially in fields directly related to the short-circuit location. The oscillations observed in more distant nodes can be attributed to resonance effects resulting from the Π cable line model used.
2.5. Integration of a Photovoltaic Source into a Modelled Network
The validated model for the actual industrial network was extended to the inclusion of renewable energy sources by introducing a photovoltaic (PV) source into the analyzed system. Active power percentages of 1%, 2%, 5%, 10%, 20%, 50%, and 100% of the connection power of the entire network were considered. This approach enabled the assessment of the impact of the connected PV source on the flow of currents and voltages in the network, as well as changes in measured resistance in response to disturbances, particularly in the case of earth faults. The PV source was connected to the RG-1 switchgear via a DC/AC converter modeled as a three-phase controlled voltage source and a 300 m long YHKGXSekyn 3 × 185 mm2 cable. This system was modeled in the ATP-EMTP environment as a voltage source with a set amplitude and phase and configured to enable adjustment of the output voltage level and the active and reactive power. The PV interface is treated as a three-wire connection to the grid, without a shared or grounded neutral point on the AC side, i.e., without a dedicated channel for injecting zero-sequence current. As a result, the PV unit’s contribution to ground fault current is limited and indirect, mainly through changes in voltage at nodes and power flow conditions (i.e., changes in the observable quantities U0 and Y0).
The analyses considered several variants of the voltage generated by the PV source: 5%, 10% and 15% above the rated voltage. These cases were designed to reflect typical operating conditions of actual PV installations, where, under full sunlight or with limited power consumption capacity, there is typically a local increase in voltage at the connection point. Taking these levels into account also allows for the analysis of the impact of PV voltage on reactive power flow and short-circuit conditions in a network with an isolated neutral point.
The analyses were carried out in two stages. The first stage was a steady-state analysis. This involved an assessment of the impact of the connected PV source on the effective values of voltages and currents at selected points in the network, varying in terms of the distance between the consumer and the sources and the power of the motors.
The second stage focused on the disturbance state, analyzing the behavior of the network during earth faults at different levels of PV power.
In particular, this study focused on whether the presence of photovoltaic sources affected the values of zero-sequence currents and voltages and whether it could hinder the detection of earth faults in medium-voltage networks with an isolated neutral point.
This is important because in such networks, earth fault currents are low, and the introduction of PV sources may further change the potential distribution and directions of capacitive current flows.
3. Results and Discussion
A steady-state power flow analysis was performed to determine the impact of a connected photovoltaic (PV) source on the operating parameters of an industrial medium-voltage power grid (6 kV, isolated neutral point system). Simulations were performed in the ATP-EMTP environment for seven variants of PV source power share in relation to the grid connection power: 1%, 2%, 5%, 10%, 20%, 50% and 100%. Additionally, to reflect the voltage variability that occurs at the terminals of a photovoltaic inverter under real operating conditions, three cases were considered in which the PV source voltage was 5%, 10%, and 15% above the rated value.
3.1. Analysis of Steady-State Results
The analysis was carried out for four representative points in the network, corresponding to actual motor receivers with varying power ratings and locations relative to the main power distribution board. These points reflect both receivers located close to the switchboard and those located at the ends of long cable sections, making it possible to capture the impact of distance and motor power on voltage and current fluctuations:
- EH-d03 W No. 10 p2—210 kW motor, located 4690 m from the main switchboard,
- R-3z p6—180 kW motor, located 489 m from the main switchboard,
- H-900 p15—120 kW motor, located 4350 m from the main switchboard,
- R-11z p2—600 kW motor, located 1805 m from the main switchboard.
For each point, voltage, current and apparent power curves were calculated and presented as a function of the relative power of the PV source in relation to the connected power, at three values of voltage generated by the PV. The results are summarized in Figure 11, Figure 12, Figure 13 and Figure 14.
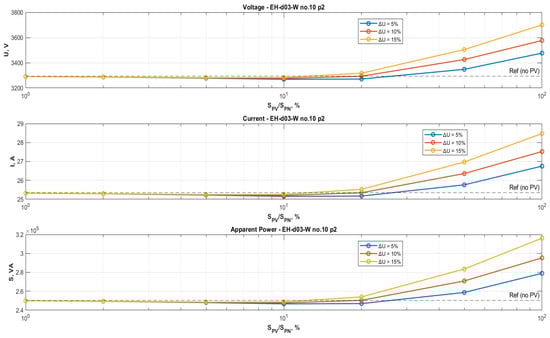
Figure 11.
Dependence of voltage, current and apparent power on the relative power of the PV source for point EH-d03 W no. 10 p2 (210 kW motor, 4690 m from the main switchboard).
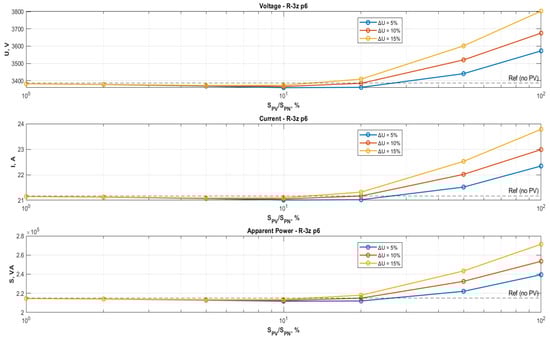
Figure 12.
Dependence of voltage, current and apparent power on the relative power of the PV source for point R-3z p6 (180 kW motor, 489 m from the main switchboard).
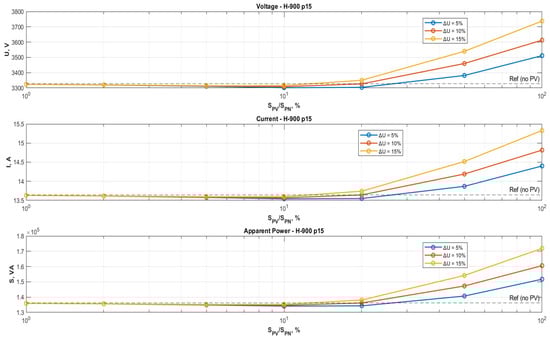
Figure 13.
Dependence of voltage, current and apparent power on the relative power of the PV source for point H-900 p15 (120 kW motor, 4350 m from the main switchboard).
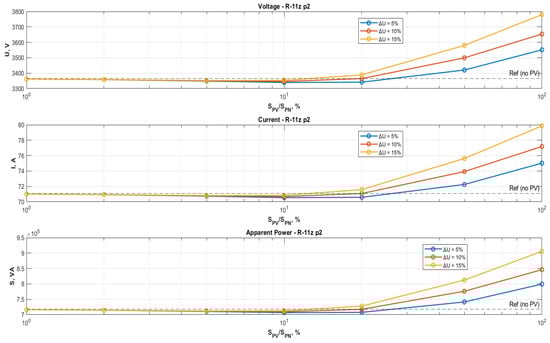
Figure 14.
Dependence of voltage, current and apparent power on the relative power of the PV source for point R-11z p2 (600 kW motor, 1805 m from the main switchboard).
The results indicate that for low PV source power values (up to 10%), the impact of distributed generation on voltage and current levels at the tested points was insignificant. Phase voltage values throughout the network remained close to the reference state (without PV), and changes in currents and apparent power did not exceed a few per cent.
Significant voltage deviations were only observed in the motor supply areas above the 20% threshold. These deviations were particularly noticeable at higher PV source voltages (+10% and +15%). As the share of PV increased, voltages at distant points in the grid rose almost linearly, reaching an increase of almost 15% relative to the reference value in a situation where the power of the PV installation was equal to the power of the power grid (SPV/SPN = 100%).
The increase in voltage simultaneously leads to an increase in phase currents and apparent power in the supply circuits. The largest increase in these parameters was recorded at points closer to the main switchboard (R-3z p6 and R-11z p2), where the apparent power increased by up to 20% compared to the reference state. This is due to lower line impedances and a stronger reverse effect of the power fed in by the PV. At more distant points (EH-d03 W No. 10 p2 and H-900 p15), the impact of the PV source was more limited, and changes in voltage and current were suppressed by the higher impedance of the cables. For these receivers, a 15% increase in voltage at the PV source resulted in only a 6–8% increase in local voltage, confirming that line length has a significant impact on voltage stability.
It is also worth noting that as the PV power increases, the phase angle of apparent power changes. In the analyzed cases, PV operated with a power factor cosφ ≈ 1, which means no reactive compensation. In practice, PV connection can cause local reverse reactive power flows, leading to increased voltage in neighboring fields. This phenomenon is particularly undesirable in industrial networks, where voltage stability is critical for the operation of drives.
The observed trends result directly from the relationships describing the voltage drop in radial distribution networks. In the case of local active power injection by a photovoltaic source, the active component of the longitudinal voltage drop effectively changes sign, leading to an increase in voltage, the value of which depends on the equivalent impedance of the path between the connection point and the higher-level power source. As a result, nodes located electrically closer to the main switchgear, characterized by lower line impedance, show greater sensitivity of currents and apparent power to changes in PV generation, while distant nodes are partially decoupled due to higher cable impedance. Additionally, due to the operation of the PV source at a power factor cos φ close to 1, without reactive power control support, there is no voltage suppression mechanism in the grid, which contributes to greater voltage fluctuations at high PV generation levels.
From the point of view of permissible voltage deviations (±10% of the nominal value), the critical PV power level is approximately 50% of the connection capacity of the remaining power grid. Above this value, with a simultaneous increase in PV voltage of 10–15%, local voltages exceed the permissible limit, which may require the use of an inverter reactive power control system or automatic active power limitation.
The results confirm that distributed photovoltaic generation, even with a moderate share of power, can significantly affect the voltage distribution and load on network components with an isolated neutral point. These effects are strongly dependent on the location of the PV source and the parameters of the receivers.
3.2. Analysis of Results in a Steady State
An analysis of the behavior of the system in a transient state during earth faults was performed to investigate the impact of a connected photovoltaic (PV) source on transient phenomena in a 6 kV industrial network with an isolated neutral point. The reference point was case no. 2, described in Section 2.4.2: a low-resistance ground fault (Rf = 1.82 Ω) in line RGD-2 p.22.
The choice of this event is justified by its nature; a low-resistance short circuit is characterized by high zero-sequence currents and high voltage dynamics, which makes it a good reference point for assessing the impact of PV sources on the sensitivity and selectivity of protection systems.
The analysis utilized actual data from four fields (RG-1z p.29 and p.38A, and RGD-2 p.21 and p.22), for which simulation models had previously been developed in the ATP-EMTP environment. A node corresponding to the connection of the PV source was added to each case. Cases were analyzed in which the PV source power was 1%, 10% and 100% of the grid connection power, and the PV output voltage was 5%, 10% or 15% higher than the rated voltage.
In order to assess the impact of the PV source on the effectiveness of earth fault detection, the admittance criterion Y0> was used, defined as the ratio of the effective values of the zero component of current and voltage:
Y0 = I0/U0,
Admittance protection (Y0>) allows for the selective detection of earth faults by observing the increase in admittance at the fault location. These are increasingly being considered as an alternative to classic zero-current (I0>) and zero-voltage (U0>) protections, especially in industrial and mining networks, where short response times and resistance to load asymmetry are crucial.
The study assumed an integration time of t = 80 ms, i.e., four main voltage periods, and also investigated the effect of changing the start time of the measurement on the resulting value of Y0. The simulations assumed full synchronization with zero-voltage protection, which activates the admittance function after detecting the appearance of voltage U0. The comparison results are presented in Table 5.
Table 5.
Comparison of calculated Y0 values for recorded waveforms and simulated waveforms. Comparison for situations without PV and with PV for selected situations.
The synchronization of the admittance protection (Y0>) with the zero-voltage protection (U0>) is a key element enabling their practical application in industrial medium-voltage networks with an isolated neutral point. In such a system, the zero-voltage protection initiates the admittance measurement process, and the Y0 value is calculated continuously after the zero-sequence voltage drop is detected. This raises the challenge of selecting the setting value for such protection. A formula that is typically applied for this purpose in other types of networks was utilized [43,44]:
where kb is the safety factor (1.2), ICLi is the capacitive current of the protected ith line, and U0max is the maximum effective value of the zero voltage component. Coefficient ΔY0μ is the admittance measurement error (which is between 0.6 and 0.8 mS for Ferranti circuits), and was assumed to be 0.8.
Equation (2) allows us to determine the minimum sensitivity threshold of the protection device, ensuring that excitation occurs only in the damaged branch and not in neighboring lines. This results from the current distribution in networks with an isolated neutral point: in healthy lines, the zero-sequence current is dominated by the line’s own capacitive current, i.e., I0i ≈ ICLi, while in a damaged line, the zero-sequence current corresponds to the return of the capacitive currents of the other lines. Therefore, selecting Y0set above the maximum value of the quotient ICLi/U0max for a healthy line (taking into account the safety margin kb and measurement uncertainty ΔY0μ) prevents tripping in adjacent lines, while allowing tripping in the damaged section.
An analysis of the admittance values presented in Table 5 clearly shows that even in the presence of a PV source with a power equal to 100% of the connection power and for a PV voltage 15% higher than the rated voltage, the Y0> protection would only operate in the RGD-2 p.22 field—i.e., exactly where the actual earth fault occurred.
In all other fields (RG-1z p.29, RG-1z p.38A, RGD-2 p.21), the Y0 values remained below the Y0 set threshold value, which suggests no risk of unwanted excitation. The differences between the grid without PV and with PV did not exceed 10% for PV power ≤10%, while for a 100% PV share, the increase was visible but did not exceed the threshold in undamaged fields.
The results obtained confirm that even a moderate share of photovoltaic generation in industrial medium-voltage networks with an isolated neutral point can affect both steady-state operating conditions and the characteristics of earth fault phenomena. In the steady state, the observed increase in voltages at distant points in the network is consistent with the trends described in the literature, which pointed to the possibility of local exceedances of permissible voltage levels in the presence of distributed PV sources. In this study, this effect became significant for PV power above 20% of the grid connection power and for voltages generated 10–15% higher than the rated values. The results suggest that exceeding a 50% PV share may lead to exceeding the permissible voltage deviations (±10%) at some points, especially those located closer to the main switchgear.
The impact of PV sources is more complex in the context of earth fault protection. The introduction of a PV source causes local changes in the direction of capacitive currents and modifies the values of zero-sequence current and voltage components. However, analysis of the admittance results (Y0) shows that even with a high PV share (100%) and increased source voltage, the Y0 values in the undamaged fields remained below the Y0 set threshold value, which indicates that the selectivity of the protection is maintained. In the field where a short circuit occurred (RGD-2 p.22), the protection would also have operated correctly. This confirms that the use of a coordinated system of admittance (Y0>) and zero-voltage (U0>) protection is also possible in the presence of distributed generation, provided that the settings and time synchronization are selected appropriately.
A comparison of the simulation results with actual data indicates very good agreement between the zero-sequence current and voltage waveforms, confirming the correctness of the developed model. However, it is worth noting that with a high share of PV in the grid, oscillations resulting from resonances between transformers and cable capacitances may occur, which may affect the measurement of zero components; this case requires further research.
Given the observed increase in voltage with a high share of PV sources, mitigation measures based on inverter voltage control functions (e.g., dynamic reactive power support) and active power control with voltage reduction (MPPT limitation at overvoltage) seem promising and will be investigated in future work.
4. Conclusions
The article presents the development and verification of a 6 kV industrial network model with an isolated neutral point, taking into account the impact of photovoltaic source integration on network operation and earth fault protection. Analyses performed in the ATP-EMTP environment allowed for the assessment of the behavior of the system in the event of earth faults and variable PV generation.
The main conclusions from the research are as follows:
- The developed and verified model accurately reflects actual earth fault phenomena, as confirmed by three measurement events.
- The integration of PV sources affects the voltage level in the grid. Significant changes occur above a 20% share of PV power, and exceeding 50% may lead to a violation of permissible voltage deviations.
- Admittance protections (Y0>) maintain their selectivity and effectiveness even at high levels of PV generation, provided that they are properly synchronized with zero-voltage protection (U0>).
- In the presence of PV, no increase in the risk of false protection operations was observed; however, fluctuations in Y0 values were identified at distant points in the grid, resulting from cable-transformer resonances.
- The integration of PV sources into industrial networks with an isolated neutral point is possible without compromising the effectiveness of earth fault protection, provided that the PV share does not exceed 50% of the connection capacity and appropriate voltage regulation mechanisms are used.
Further research plans to analyze the impact of dynamic reactive power control and voltage regulation on the PV inverter side will enable the development of optimal strategies for the cooperation of PV sources with MV grids with an isolated neutral point.
Author Contributions
Conceptualization, K.N. and K.K.; methodology, K.K.; software, K.K.; validation, K.N.; formal analysis, K.N. and K.K.; investigation, K.K.; resources, K.N.; data curation, K.K.; writing—original draft preparation, K.N. and K.K.; writing—review and editing, K.N.; visualization, K.N. and K.K.; project administration, K.N. All authors have read and agreed to the published version of the manuscript.
Funding
This research received no external funding.
Data Availability Statement
The original contributions presented in this study are included in the article. Further inquiries can be directed to the corresponding author.
Conflicts of Interest
The authors declare no conflicts of interest.
References
- Nohacova, L.; Vykuka, R.; Zak, F.; Kropacek, V. Electrical Distribution Networks with Isolated Neutral Point—The Value of the Capacitive Earthfault Current and Impact on the Operation of These Networks. 2015, pp. 73–76. Available online: https://www.researchgate.net/publication/284747183_Electrical_distribution_networks_with_isolated_neutral_point_-_The_value_of_the_capacitive_earthfault_current_and_impact_on_the_operation_of_these_networks (accessed on 10 September 2025).
- Filipović-Grčić, B.; Stipetic, N.; Milardić, V.; Uglešić, I. The Insulation of Medium Voltage Networks with Isolated Neutral. 2018. Available online: https://www.researchgate.net/publication/323832142_The_insulation_of_medium_voltage_networks_with_isolated_neutral (accessed on 9 September 2025).
- Talaga, M.; Halinka, A. Selective Detection of Earthfaults in Medium Voltage Networks of Industrial Plants—Part I. Prz. Elektrotech. 2014, 90, 20–23. [Google Scholar]
- Talaga, M.; Halinka, A. Selective Detection of Earthfaults in Medium Voltage Networks of Industrial Plants—Part II. Prz. Elektrotech. 2014, 90, 24–27. [Google Scholar]
- Emanuel, A.E.; Cyganski, D.; Orr, J.A.; Shiller, S.; Gulacheński, A.M. High-Impedance Fault Arcing on Sandy Soil in 15 kV Distribution Feeders. IEEE Trans. Power Deliv. 1990, 5, 676–686. [Google Scholar] [CrossRef]
- Johns, A.T.; Aggarwal, R.K.; Song, Y.H. Improved Techniques for Modeling Fault Arcs on Faulted EHV Transmission Systems. IEE Proc. Gener. Transm. Distrib. 1994, 141, 148–154. [Google Scholar] [CrossRef]
- Djuric, M.B.; Terzija, V.V. New Approach to the Arcing Faults Detection for Fast Autoreclosure in Transmission Systems. IEEE Trans. Power Deliv. 1995, 10, 1793–1798. [Google Scholar] [CrossRef]
- Kuliński, K.; Heyduk, A. Ground Fault in Medium-Voltage Networks with Isolated Neutral: Spectral and Wavelet Analysis in ATP-EMTP. Energies 2024, 17, 1532. [Google Scholar] [CrossRef]
- Yamashika, H.; Syafii, S. Characteristics of symmetrical components for high impedance faults in distribution networks with photovoltaic inverters. Indones. J. Electr. Eng. Comput. Sci. 2024, 33, 727–735. [Google Scholar] [CrossRef]
- Feng, R.; Xiao, Y.; Liu, F.; Ye, W.; Yao, Y.; Wang, Q.; Zhao, Y.; Shu, X. A Novel Protection Scheme for Inverse-time Overcurrent Protection of High Proportion Distributed Photovoltaic Clusters Based on Improved Grey Wolf Optimizer. J. Eng. 2025, 2025, 1–19. [Google Scholar] [CrossRef]
- Mäki, K.; Repo, S.; Järventausta, P. Impacts of Distributed Generation on Earth Fault Protection in Isolated Neutral Distribution Systems. In Proceedings of the 19th International Conference and Exhibition on Electricity Distribution, Vienna, Austria, 21–24 May 2007. [Google Scholar]
- Azuara Grande, L.S.; Granizo, R.; Arnaltes, S. Wavelet Analysis to Detect Ground Faults in Electrical Power Systems with Full Penetration of Converter Interface Generation. Electronics 2023, 12, 1085. [Google Scholar] [CrossRef]
- Li, Y.; Qi, J.; Chen, S.; Xu, Y.; Xing, Z.; Wei, Y. Modeling and Simulation of Photovoltaic Power Generation System Based on ATP-EMTP. In Proceedings of the 4th International Conference on Green Energy and Power Systems, Hangzhou, China, 11–13 April 2025; pp. 699–703. [Google Scholar]
- Hoang, T.; Tran, Q.; Bésanger, Y. An Advanced Protection Scheme for Medium-Voltage Distribution Networks with Low-Voltage Microgrids with High PV Penetration. Int. J. Electr. Power Energy Syst. 2022, 139, 107988. [Google Scholar] [CrossRef]
- Thanasaksiri, T. Simulation of PV System Using EMTP-ATPDraw. In Proceedings of the 16th International Conference on Electrical Engineering/Electronics, Computer, Telecommunications and Information Technology (ECTI-CON), Pattaya, Thailand, 10–13 July 2019; pp. 282–285. [Google Scholar]
- Silva, L.; Guimarães, G.; Oliveira, T.; Rezende, J.; Santos, R.; Piccini, A. Modelling of a Multipurpose Photovoltaic Generator Block Using ATP-EMTP. IEEE Lat. Am. Trans. 2019, 17, 203–209. [Google Scholar]
- Han, Y. Nonlinear Stability Analysis of Digital Controlled Single-Phase Standalone Inverter. In Modeling and Control of Power Electronic Converters for Microgrid Applications; Springer: New York, NY, USA, 2021. [Google Scholar]
- Electromagnetic Transients Program (EMTP), Rule Book. Available online: www.eeug.org (accessed on 21 September 2025).
- Dommel, H.W. Electromagnetic Transients Program: Reference Manual (EMTP Theory Book); Bonneville Power Administration: Portland, OR, USA, 1986. [Google Scholar]
- Alasali, F.; Itradat, A.; Ghalyon, S.; Abudayyeh, M.; El-Naily, N.; Hayajneh, A.; AlMajali, A. Smart Grid Resilience for Grid-Connected PV and Protection Systems under Cyber Threats. Smart Cities 2023, 7, 51–77. [Google Scholar] [CrossRef]
- Yuan, S.; Wen, B.; Zhang, J.; Li, Z. State-Space Average Model of a Three-Level PV Inverter for Transient Short-Circuit Analysis. IET Gener. Transm. Distrib. 2024, 18, 1855–1870. [Google Scholar] [CrossRef]
- Li, Z.; Lu, J.; Zhu, Y.; Jiang, W. Ground-Fault Characteristics of Grid-Connected PV Stations with Neutral Grounding Resistance. Energies 2017, 10, 1910. [Google Scholar] [CrossRef]
- Saleh, S.; Kanukollu, S.; Al-Durra, A. Phaselet Transform-Based Ground Fault Protection for Grid-Connected PV Systems. IEEE Trans. Ind. Appl. 2023, 59, 5398–5410. [Google Scholar] [CrossRef]
- Kermani, B.; Shariatinasab, R.; Khorshidi, M.; He, J. Risk Analysis of Lightning-Related Transients in PV Systems. IEEE Trans. Power Deliv. 2025, 40, 618–629. [Google Scholar] [CrossRef]
- Dommel, H.W. Nonlinear and Time-Varying Elements in Digital Simulation of Electromagnetic Transients. IEEE Trans. Power Appar. Syst. 1971, PAS-90, 2561–2567. [Google Scholar] [CrossRef]
- Meyer, W.S.; Dommel, H.W. Numerical Modelling of Frequency-Dependent Transmission-Line Parameters in an Electromagnetic Transients Program. IEEE Trans. Power Appar. Syst. 1974, PAS-93, 1401–1409. [Google Scholar] [CrossRef]
- Marti, J.R. Accurate Modelling of Frequency-Dependent Transmission Lines in Electromagnetic Transient Simulations. IEEE Trans. Power Appar. Syst. 1982, PAS-101, 147–155. [Google Scholar] [CrossRef]
- Marti, L. Simulation of Transients in Underground Cables with Frequency-Dependent Modal Transformation Matrix. IEEE Trans. Power Deliv. 1988, 3, 1099–1110. [Google Scholar] [CrossRef]
- Noda, T.; Nagaoka, N.; Ametani, A. Further Improvements to a Phase-Domain ARMA Line Model. IEEE Trans. Power Deliv. 1997, 12, 1327–1332. [Google Scholar] [CrossRef]
- Noda, T.; Nagaoka, N.; Ametani, A. Phase-Domain Modeling of Frequency-Dependent Transmission Lines Using an ARMA Model. IEEE Trans. Power Deliv. 1996, 11, 401–411. [Google Scholar] [CrossRef]
- Tele-Fonika Kable. Katalog Kabli i Przewodów Oponowych. Cable and Wiring Catalog. Available online: https://www.tele-fonika.com/informacje-prasowe/katalogi (accessed on 25 September 2025).
- Haginomori, E.; Koshiduka, T.; Arai, J.; Ikeda, H. Power System Transient Analysis: Theory and Practice Using Simulation Programs (ATP/EMTP); Wiley: Hoboken, NJ, USA, 2016. [Google Scholar]
- Lee, K.M.; Park, C.W. Ground Fault Detection Using Hybrid Method in IT System LVDC Microgrid. Energies 2020, 13, 2606. [Google Scholar] [CrossRef]
- Zamanan, N.; Sykulski, J. The Evolution of High Impedance Fault Modeling. In Proceedings of the 16th International Conference on Harmonics and Quality of Power (ICHQP), Bucharest, Romania, 25–28 May 2014; pp. 77–81. [Google Scholar]
- Li, B.; Du, X.; Miao, J.; Wang, H.; Ma, Y.; Li, Z. Arc Grounding Fault Monitoring and Fire Prediction Method Based on EEMD and Reconstruction. Electronics 2022, 11, 2159. [Google Scholar] [CrossRef]
- Field Controller multiMUZ-2, Catalog Card. Available online: https://www.scribd.com/document/873336303/multiMUZ-2 (accessed on 1 October 2025).
- Field Controller multiMUZ-3, Catalog Card. Available online: https://www.elektrobudowa.com.pl/store/files/KsWXHz5GgXERv20CAo67ZnRro00VRmvYowJYDEVx.pdf (accessed on 1 October 2025).
- Hastings, W.K. Monte Carlo Sampling Methods Using Markov Chains and Their Applications. Biometrika 1970, 57, 97–109. [Google Scholar] [CrossRef]
- Jerrum, M.; Sinclair, A. The Markov Chain Monte Carlo Method: An Approach to Approximate Counting and Integration. In Approximation Algorithms for NP-Hard Problems; Hochbaum, D., Ed.; PWS; Course Technology Ptr: Boston, MA, USA, 1996. [Google Scholar]
- Dommel, H.W. Digital Computer Solution of Electromagnetic Transients in Single- and Multiphase Networks. IEEE Trans. Power Appar. Syst. 1969, PAS-88, 388–399. [Google Scholar] [CrossRef]
- Muñoz, D.; González, E.; Piñeros, J.; Zapata, L. Simplified Inverter-Based Generation Model for Protection and Short-Term Stability Studies. TecnoLógicas 2022, 55. [Google Scholar] [CrossRef]
- Pothisarn, C.; Patcharoen, T.; Srisuksai, P.; Ngaopitakkul, A.; Kunakorn, A.; Ananwattanaporn, S. Application of Neutral Grounding Resistor in High Voltage PV Substation. In Proceedings of the 2025 IEEE Industry Applications Society Annual Meeting (IAS), Taipei, Taiwan, 15–20 June 2025; pp. 1–6. [Google Scholar]
- Lorenc, J.; Hoppel, W. Technical Methods Supporting Operation of Earth-Fault Protections in Medium Voltage Networks. Prz. Elektrotech. 2009, 85, 241–248. [Google Scholar]
- Lorenc, J.; Hoppel, W. Contemporary Solutions of Earth-Fault Protection in Medium Voltage Networks with a Non-Solidly Earthed Neutral. Autom. Elektr. Zakłócenia 2013, 14, 18–43. [Google Scholar]
Disclaimer/Publisher’s Note: The statements, opinions and data contained in all publications are solely those of the individual author(s) and contributor(s) and not of MDPI and/or the editor(s). MDPI and/or the editor(s) disclaim responsibility for any injury to people or property resulting from any ideas, methods, instructions or products referred to in the content. |
© 2025 by the authors. Licensee MDPI, Basel, Switzerland. This article is an open access article distributed under the terms and conditions of the Creative Commons Attribution (CC BY) license.