Abstract
This study evaluates the operational performance and carbon emissions of an air-source heat pump (ASHP) system based on a one-year field monitoring campaign conducted at a single-family detached house in Gongju, South Korea. The system, equipped with a 9 kW air-to-water ASHP, supplied both space heating (SH) and domestic hot water (DHW), achieving average coefficients of performance (COPs) of 2.27 for SH and 2.06 for DHW. To estimate nominal COPs, a bi-quadratic regression model was developed using manufacturer catalog data and compared against field measurements. The analysis revealed a significant performance decline during winter: a paired t-test using 7119 samples confirmed a statistically significant discrepancy under low-temperature conditions. Annual CO2-equivalent (CO2eq) emissions were also evaluated. Under current grid emission factors, the ASHP system emitted 1532 kgCO2eq—approximately 8.6% more than a condensing gas boiler (1411 kgCO2eq), primarily due to winter performance degradation and the relatively high carbon intensity of electricity. These findings underscore the importance of incorporating actual operating conditions, seasonal variability, and the national electricity emission factor when assessing ASHP performance and life cycle climate performance (LCCP).
1. Introduction
1.1. Research Background
Globally, the transition of residential heating systems from fossil fuel-based technologies to low-carbon alternatives has emerged as a key strategy in addressing the climate crisis. Air-source heat pumps (ASHPs) have emerged as a promising solution, offering both high energy efficiency and significant reductions in greenhouse gas (GHG) emissions. For instance, conventional gas boilers emit approximately 0.241 kgCO2-equivalent (CO2eq) per kWh of heat, while ASHPs emit only about 0.111 kgCO2eq, indicating a potential reduction of roughly 54% [1,2].
In Europe, approximately 19.8 million ASHPs have been deployed, reportedly replacing 40 billion cubic meters of natural gas annually and reducing carbon emissions by around 52.5 million tons. These results highlight the scalability of ASHPs in building decarbonization [3]. As of 2023, the global heat pump market was valued at approximately USD 86.10 billion and is expected to expand at a compound annual growth rate (CAGR) of 10.88%, reaching USD 203.42 billion by 2032. The residential segment alone is expected to account for USD 10.8 billion by 2032 [4,5]. In South Korea, the ASHP market recorded approximately USD 1.29 billion in revenue in 2024 and is projected to reach USD 2.07 billion by 2030 (CAGR: 8.3%) [6]. However, due to the residential sector’s high dependency on fossil fuels such as city gas and oil, the adoption of ASHPs is still in its early stage.
The Korean government has established ambitious targets to reduce GHG emissions from the building sector by 88% by 2050 relative to 2018 levels, as set forth in the “2050 Carbon Neutrality Strategy” and the “2030 Nationally Determined Contribution (NDC)” [7]. High-efficiency heating systems are thus considered a key mitigation measure [8]. In particular, radiant floor heating, which is widely applied in Korean residences, makes air-to-water ASHPs well-suited from both a structural and technical perspective.
Nevertheless, unlike successful deployment cases in Europe and North America, the reliable and efficient operation of ASHPs under Korea’s distinct four-season climate remains insufficiently validated. Outdoor temperatures in winter often drop below −10 °C, and ASHP performance is highly sensitive to outdoor conditions. Consequently, a significant discrepancy may exist between rated and actual performance. This highlights the necessity for empirical, long-term performance evaluations under actual operating conditions.
1.2. Literature Review and Research Gap
Previous studies have consistently shown that the performance of air-source heat pumps (ASHPs) varies significantly depending on factors such as outdoor air temperature, supply water temperature for space heating (SH) and domestic hot water (DHW), system capacity, and control strategy. Miara et al. [9] conducted a large-scale monitoring study on 110 residential heat pump systems in Germany, among which 18 ASHP-only systems exhibited average seasonal performance factors (SPFs) of 2.9 for SH and 2.3 for combined SH and DHW. The study reported that performance degradation under low outdoor temperatures was primarily driven by auxiliary heating and circulation-related losses. Based on direct power measurements using separate electricity meters for individual components, circulation losses—including the heat-source loop pump and circulation pump—accounted for an average COP reduction of 0.39, while auxiliary heating contributed an additional reduction of 0.06. In relative terms, circulation losses represented approximately 87% of the total degradation, with auxiliary heating accounting for the remaining 13%. Similarly, Bayer and Pruckner [10] utilized a digital twin of a German city to simulate retrofitting more than 1300 residential buildings with ASHPs. They assessed CO2 reductions and cost-effectiveness under three retrofit scenarios: ASHP-only, ASHP + photovoltaic (PV), and ASHP + PV + battery energy storage system (BESS). Their simulations showed that annual CO2 reductions from heating retrofits alone ranged from 18.6% (in 2021) to 45.9% (in 2020), depending on weather and grid conditions. When combined with PV and battery systems, building-level reductions increased to between 31.2% and 43.6%. Economically, the ASHP + PV combination was found to be optimal for most buildings. This study underscored the importance of weather-aligned SPF models and realistic component sizing using city-wide geospatial and energy data.
System configuration and control strategies have also been shown to significantly impact ASHP performance. Sun et al. [11] experimentally evaluated an ASHP system coupled with radiant floor heating in Hotan, China, under a warm-temperate arid climate. The system achieved average COPs of 2.13 (low-temperature, high-humidity), 2.24 (typical), and 2.46 (high-temperature, low-humidity). These results confirmed that COP improves with ambient temperature but declines with relative humidity, with an optimal humidity level of approximately 61% at −5 °C. This study highlighted the significance of climate-specific humidity control but did not evaluate carbon emissions or compare measured and rated COPs, limiting their broader applicability. Building on this, Wu et al. [12] conducted a field experiment in Beijing to evaluate an ASHP integrated with a water storage tank using a time-shifted operation strategy. Over a 78-day winter period (−9.3 °C to 11.3 °C), the system achieved a seasonal COP (SCOP) of 2.95 compared to 2.34 under continuous operation, indicating a 26.1% improvement in system-level performance for space heating. This comparison was based on overall system SPF values, explicitly accounting for circulation-related losses and auxiliary heating operation rather than the performance of the ASHP unit alone. On the coldest day, the COP improved by 14.0%, while defrosting accounted for only 0.3% of total electricity use. Although the system maintained stable indoor temperatures, the study did not explicitly evaluate user thermal comfort or control feedback.
In parallel, simulation-based assessments have been widely used to evaluate the energy performance and environmental impacts of ASHPs. Carutasiu and Necula [13] simulated the retrofit of a typical Romanian residential building using a hybrid ASHP system with solar thermal and PV integration. Thermal demand was reduced by 57% through improved insulation, and 81% of the total heating load was supplied by the ASHP. The SPF increased from 3.14 to 3.82 with solar collector support; however, 25% of the peak heating load remained unmet, suggesting the need for backup heating systems. Schraer [14] conducted a high-resolution simulation across 522,000 residential heating blocks in the United States, evaluating emissions and economic impacts of replacing natural gas (NG) and electric resistance (ER) systems with ASHPs. Results showed that 99.7% of heating demand could be met with lower emissions, and 36.9% of households could achieve both carbon and cost savings under current grid conditions. Under future grid decarbonization scenarios, emissions could be reduced by up to 129 MtCO2 per year with net savings of $10.9 billion. Similarly, Berardi and Jones [15] used EnergyPlus simulations of detached homes in Toronto, Vancouver, and Quebec City to assess ASHP performance under both current and future climate conditions (2030–2041 and 2056–2075). By the 2056–2075 period, ASHPs covered 100% of heating demand in Vancouver, 78% in Toronto, and 56% in Quebec City. GHG intensity declined to 0.5 kgCO2eq/m2 in Quebec, 2.3 kgCO2eq/m2 in Toronto, and 1.1 kgCO2eq/m2 in Vancouver under present climate scenarios.
Life cycle assessment (LCA) studies have added important perspectives on long-term environmental impacts. Khan et al. [16] performed a cradle-to-grave LCA of a 6 kW domestic ASHP in Ireland using a field-measured SCOP of 2.49, resulting in a total global warming potential (GWP) of 35.8 tCO2eq over a 17-year service life. The study reported that 95% of total emissions originated from the operational phase, while the remaining 5% consisted primarily of emissions from the production stage (approximately 4.6%) and the end-of-life stage (approximately 0.4%). Refrigerant leakage was not explicitly included due to the large uncertainty associated with leakage rates and the lack of standardized empirical data. When the rated SCOP of 3.26 was used instead of the field-measured value, the estimated GWP was reduced by approximately 20%, highlighting the critical importance of performance validation based on real operating conditions. Lin et al. [17] compared five ASHP configurations in China, including ASHP-only, ASHP-gas, and ASHP-solar hybrids. Their simulation found that operational emissions accounted for 70.5% of total life cycle emissions. The ASHP-gas configuration had the lowest annual emissions (25.7 tCO2/year), although refrigerant leakage was not considered.
Further insights into real-world performance have been provided by field monitoring under cold climate conditions. Zhang et al. [18] investigated an ASHP system in Harbin, China, where winter temperatures ranged from −20.9 °C to −10.4 °C. Despite these low temperatures, the system maintained indoor air at 19.8–24.2 °C with COPs between 1.04 and 2.44. Minimal frost formation occurred due to low relative humidity (27–37%), and the study identified maintaining a ΔT of ≤41 °C between indoor and outdoor air as essential to achieving acceptable COPs. Nardi et al. [19] monitored an air-to-water ASHP in a bank office in northern Italy and reported a seasonal COP of 2.42 during one heating season (October 2019 to April 2020). Their analysis emphasized the importance of data synchronization, signal filtering, and instrumentation accuracy. Liu et al. [20] compared ASHP performance in two small office buildings in Shenyang, China, where COPs differed significantly based on building certification: 3.27 in the green-certified building versus 1.55 in the energy-saving building. Mismatches between system output and building load, along with transmission and distribution losses (29%), were identified as primary inefficiency factors.
While these studies have greatly advanced understanding of ASHP performance, several important research gaps remain. First, there is limited field-based evidence from four-season climates such as South Korea’s, which features both extremely cold and hot weather conditions. Second, statistically validated comparisons between rated and real-world COPs are scarce, leaving uncertainty about catalog data reliability. Third, few studies assess carbon emissions in the context of future electricity grid decarbonization pathways, reducing their policy relevance. These gaps highlight the need for empirical performance evaluations that reflect seasonal climate variation, apply advanced control strategies, and integrate evolving national energy system characteristics to guide sustainable ASHP deployment.
1.3. Purpose of the Study and Paper Structure
This study presents a comprehensive, year-long field evaluation of an air-to-water ASHP system operating under Korea’s distinct four-season climate, with outdoor temperatures ranging from −19.0 °C to 39.4 °C. The primary objectives of the research are as follows:
- To assess the seasonal performance of the ASHP in both SH and DHW modes, using high-resolution data collected over one year.
- To develop a manufacturer-based COP prediction model using bi-quadratic regression derived from catalog data, and to quantify the performance gap between rated and in situ operation through statistical validation of more than 7100 paired data samples.
- To quantify and compare the annual CO2-equivalent (CO2eq) emissions of ASHP and condensing gas boiler systems under current and projected national electricity carbon intensities (2030, 2036, and 2050), thereby identifying critical policy thresholds for the deployment of ASHPs.
The structure of this paper is as follows: Section 2 describes the monitored residential site and ASHP system configuration, including the data acquisition framework. Section 3 explains the COP modeling methodology. Section 4 presents in situ performance results across winter, shoulder, and summer seasons. Section 5 compares carbon emissions of the ASHP and a reference condensing gas boiler system under various electricity grid scenarios. Finally, Section 6 summarizes the key findings and discusses their implications for energy policy and decarbonization strategies. Although this study examines a single residential building and applies a commonly used bi-quadratic regression model, its novelty lies in the use of a high-resolution, year-long field dataset. More than 7100 one-minute measurements enable a statistically robust comparison between rated and measured COP across seasonal operating conditions. In addition, the integration of measured performance data with current and future national electricity carbon intensity scenarios extends the relevance of this single-case study to policy-oriented assessment. Nomenclature is shown in Table 1.

Table 1.
Nomenclature table.
2. Overview of the Monitored House
2.1. Climatic Characteristics
The monitoring site is located in Gongju, Chungcheongnam-do, South Korea, which features a distinct four-season inland climate. Outdoor temperature data were continuously collected over a one-year period from December 2023 to November 2024. As illustrated in Figure 1, the hourly average outdoor temperature ranged from −19.0 °C to 39.4 °C, with an annual mean of approximately 10.6 °C. This annual mean temperature is representative of inland regions in central South Korea, including the Daejeon–Gongju area, which typically exhibit a continental climate with annual mean temperatures around 10 °C. Accordingly, the monitored climatic conditions are appropriate for assessing seasonal variations in ASHP performance under real-world operating conditions and are comparable to those reported in international field studies conducted in cold and mixed climates.
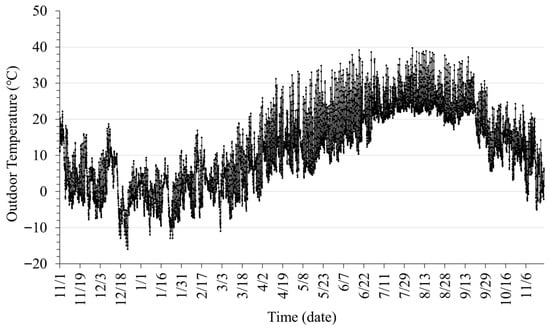
Figure 1.
Hourly outdoor temperature profile at the monitoring site in Gongju, South Korea.
2.2. System Configuration
The monitored building is a two-story detached house with a total floor area of 166.3 m2 and a building footprint of 113.5 m2, occupied by two residents. Radiant floor heating is installed on the first floor (approximately 94.5 m2), while the second floor is a non-heated zone. Table 2 summarized the thermal transmittance (U-value) of the building envelope components.
Table 2.
Thermal transmittance (U-value) of the building envelope.
Figure 2 illustrates the configuration of the integrated SH and DHW system, consisting of a 9 kW air-to-water ASHP unit, a 300 L thermal storage tank, and underfloor heating pipes. The system operates under a domestic hot water (DHW) priority control strategy. When DHW demand occurs, space heating (SH) operation is suspended and the system switches to DHW mode until the DHW setpoint is satisfied. After completion of DHW heating, the system automatically returns to SH operation if heating demand remains. This control strategy ensures reliable DHW supply and influences short-term variations in leaving water temperature and system COP during winter operation.

Figure 2.
Configuration diagram of the integrated SH and DHW ASHP system.
2.3. Measurement and Remote Monitoring System
To ensure accurate analysis of the ASHP’s operational performance, a high-resolution remote monitoring system was implemented at the site. The system includes seven temperature sensors, two flow meters, and one power meter, as illustrated in Figure 2. Table 3 presents the technical specifications of the primary sensors used in the monitoring system.
Table 3.
Technical specifications of installed sensors used in performance monitoring.
Real-time data are transmitted to an edge server with a time-series database (TSDB), ensuring stable storage and uninterrupted operation. Historical data can be accessed and analyzed via a web-based front-end interface. High-resolution performance data were collected at one-minute intervals throughout the entire monitoring period (December 2023 to November 2024), supporting robust empirical evaluation of the ASHP system.
3. ASHP Performance Modeling
3.1. Definition of COP
The coefficient of performance (COP) quantifies ASHP efficiency as the ratio of heat supply to electrical input. In this study, the system includes an integrated circulation pump, and thus the COP was calculated using the total power consumption of the compressor, pump, and fan. Instantaneous and average COPs were calculated using the following equations:
where Qt is the heat supply at time t and Pt is the corresponding total power consumption.
The total electrical power consumption (Pt) was calculated by summing up the power used by all major components:
The heat supply (Qt) was calculated as follows:
where is the water mass flow rate (kg/s), is the specific heat capacity of water (kJ/kg·K), is the leaving water temperature, and is the entering water temperature.
3.2. Catalog-Based Performance Modeling
To assess the gap between rated and in situ performance, a predictive COP model was developed using manufacturer-provided catalog data. These data specify COP values under varying combinations of outdoor air temperature () and leaving water temperature (), ranging from −15 °C to 35 °C and 30 °C to 45 °C, respectively. A bi-quadratic regression analysis was performed using these two variables as independent predictors, resulting in the following model:
where to are regression coefficients.
Table 4 presents the estimated coefficients of the bi-quadratic model along with their corresponding p-values. All coefficients were highly significant (p < 0.001), and the model achieved a Root Mean Square Error (RMSE) of 0.237, indicating a good fit. This model was subsequently applied to quantify the performance gap between catalog-rated and measured COP values.
Table 4.
Regression coefficients and statistical significance (p-values) for catalog-based COP prediction.
4. In Situ Performance Evaluation of ASHP
4.1. Measurement Uncertainty and COP Validity
To ensure the validity of field-measured COP values, measurement uncertainty was quantified separately for SH and DHW operating modes. The analysis considered the precision specifications of all sensors used in the monitoring system, as summarized in Table 2. Since the COP is calculated from the measured heat output (Qt) and power consumption (Pt), the relative uncertainty of the COP was propagated from the independent measurement uncertainties of these variables using the root-sum-square (RSS) method, as expressed in Equation (6):
where ΔQ and P represent the measurement uncertainties of heat output and power input, respectively.
This uncertainty propagation approach is widely adopted in experimental and field-based evaluations of heat pump performance and has been applied in recent studies, including Khan et al. (2025) [21]. To ensure a conservative uncertainty assessment under the most demanding operating conditions, the uncertainty analysis was intentionally limited to a representative winter period. To reflect representative low-temperature operating conditions, the uncertainty analysis was conducted using 20 days of winter operation data (20 December 2023–8 January 2024) for both SH and DHW modes. Given the distinct supply temperature settings, operational schedules, and control algorithms between the two modes, uncertainty propagation was performed separately for SH and DHW. As a result, the relative uncertainties of the calculated COP were ±4.73% for SH and ±5.37% for DHW. Accordingly, the 95% confidence intervals for the average COPs were 1.95 [1.93–1.97] for SH and 1.62 [1.59–1.65] for DHW.
4.2. Winter Performance Analysis
The winter season represents a critical operating period for ASHPs due to low outdoor temperatures and increased heating demand. This section analyzes the SH and DHW performance based on the same 20-day dataset used in Section 4.1. During this period, outdoor temperatures ranged from approximately −19 °C to 7 °C, providing a suitable environment for ASHP performance evaluation.
Figure 3 shows variations in LWT by operation mode. The average LWT was 40.2 °C for SH (range: 23.7–52.1 °C) and 44.3 °C for DHW (range: 22.1–56.6 °C). These variations resulted from setpoint differences and the entry of stagnant cold water during system activation, causing temporary drops in LWT, followed by gradual increases as heating progresses. The total heat supplied during the winter analysis period was 926.9 kWh for SH and 197.1 kWh for DHW, with SH accounting for approximately 82% of the total.
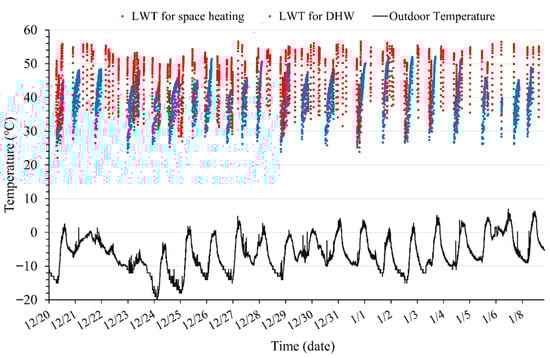
Figure 3.
Distribution of leaving water temperature (LWT) by operating mode (SH vs. DHW) during the winter period (20 December–8 January).
The COP is highly sensitive to changes in outdoor temperature and LWT, showing a wide operational range under real conditions. Figure 4 and Figure 5 show the distribution of instantaneous COP values with respect to outdoor temperature and LWT for SH and DHW, respectively. The SH mode yielded a COP range of 0.9 to 3.7, while DHW mode ranged from 0.85 to 2.91. The lower COP observed during DHW operation is attributed to the higher supply temperature. A clear trend was identified: higher outdoor temperatures lead to increased COP, while higher LWTs result in lower COP. This behavior can be explained by the increased pressure differences between the evaporator and condenser under low outdoor temperature and elevated LWTs, which increases compressor load and reduces system efficiency [22,23]. Overall, the winter performance degradation observed in both SH and DHW modes reflects the combined effects of low outdoor temperatures, elevated LWT, and increased auxiliary energy consumption. Although component-level energy contributions could not be quantitatively separated due to field measurement limitations, these interacting factors consistently explain the wide COP variation and reduced average performance observed during the winter season. Compared with previous field-based studies of residential ASHP systems, the measured winter COP values in this study fall within the lower end of the range typically reported for cold and temperate climates (approximately 2.0–3.0). This positioning reflects the combined influence of low outdoor temperatures, elevated leaving water temperatures, and auxiliary energy consumption under real operating conditions.
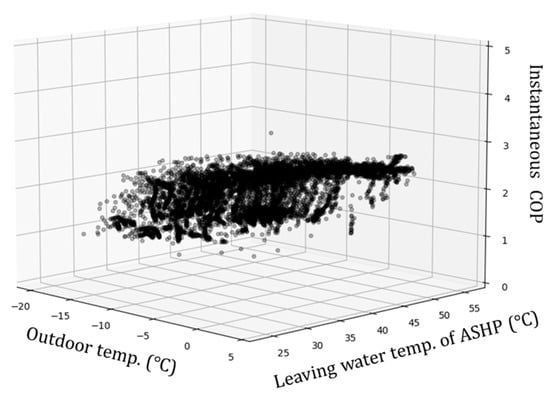
Figure 4.
Instantaneous COP distribution in SH mode during the winter period (20 December–8 January).
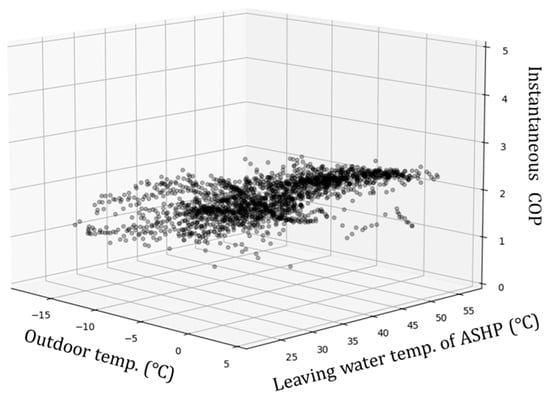
Figure 5.
Instantaneous COP distribution in DHW mode during the winter period (20 December–8 January).
4.3. Non-Winter Performance Analysis
During the non-winter season, higher outdoor temperatures contribute to improved ASHP performance. This section analyzes data from the summer period (17 August–5 September 2024) and shoulder season (19 October–7 November 2024) to assess the efficiency characteristics relative to winter conditions.
For DHW operation in summer, the average outdoor temperature was approximately 27.4 °C (range: 13.7–38.0 °C), with average LWT and return temperatures of 47.0 °C and 40.8 °C, respectively. The average COP reached 4.01, representing a 2.5-fold improvement over the winter period. This enhancement is attributed to reduced compressor load and improved cycle efficiency due to elevated evaporation temperatures. Figure 6 illustrates the variation in instantaneous COP with respect to outdoor temperature and LWT.
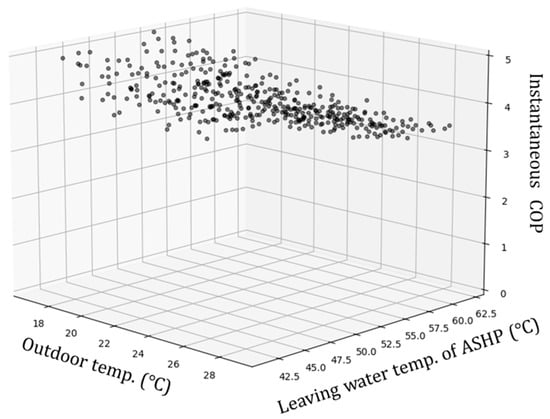
Figure 6.
Instantaneous COP distribution in DHW mode during the summer period (17 August–5 September).
In the shoulder season, SH was operated under outdoor temperatures ranging from −1.2 °C to 22.8 °C, with LWT values between 34.5 °C and 40.3 °C. The average COP for SH was 3.48, significantly higher than the winter average of 1.95. Figure 7 presents the heating performance during this period.
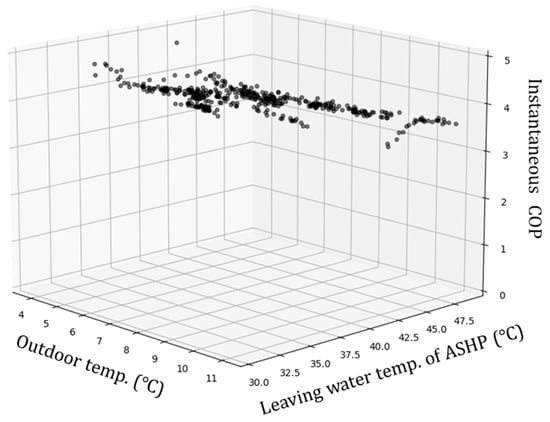
Figure 7.
Instantaneous COP distribution in SH mode during shoulder season (19 October–7 November).
Meanwhile, the average COP for DHW during the shoulder season was 3.40—slightly lower than in summer but approximately 2.1 times higher than in winter (1.60). Figure 8 shows the corresponding DHW performance. These results confirm that rising outdoor temperatures increase evaporation temperatures and reduce compressor pressure ratios, structurally improving ASHP performance.
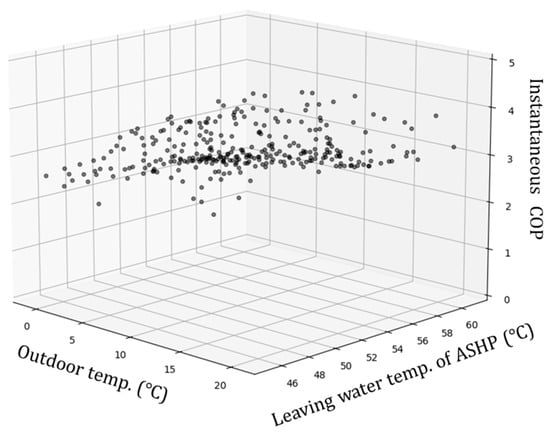
Figure 8.
Instantaneous COP distribution in DHW mode during shoulder season (19 October–7 November).
4.4. Annual Heat Supply and COP Summary
Table 5 summarizes the monthly heat supply and average COP values for SH and DHW, together with the corresponding ASHP electricity consumption, over the one-year period from December 2023 to November 2024. Months marked as “0” (June–September) indicate that no heat supply occurred, although monitoring continued. The annual total heat supplied was 5498.0 kWh for SH and 1621.6 kWh for DHW, indicating that approximately 77% of the total thermal energy was used for SH.
Table 5.
Monthly heat supply and average COP for SH and DHW (December 2023–November 2024).
Average monthly COPs closely followed outdoor temperature trends. In December (−5.6 °C) and January (−4.5 °C), the coldest months, SH COPs were 1.92 and 2.03, respectively, and DHW COPs were also relatively low at 1.72 and 1.86. As outdoor temperatures rose, system efficiency improved. In May and August, DHW COPs peaked at 3.27 and 3.47, respectively. The annual average COPs were calculated as 2.27 for SH and 2.06 for DHW, empirically confirming the seasonal performance variability of the ASHP.
4.5. Comparison of Predicted and Measured COP
This section assesses performance degradation under varying operating conditions by comparing measured COP values with those predicted by the catalog-based regression model. The regression-based rated COP serves as a reference line for this analysis.
Using the same 20-day winter dataset (20 December 2023–8 January 2024) as in Section 4.2, the predicted COP (Figure 9) averaged 2.37, while the measured COP (Figure 10) averaged 1.95, corresponding to an average performance drop of approximately 18%. This degradation was evaluated over a leaving water temperature (LWT) range of approximately 23–52 °C and was found to vary substantially with LWT, ranging from about 1.3% at low LWT to up to 38.8% at high LWT. A paired t-test was conducted with 7141 sample pairs, resulting in a mean difference of 0.426, a t-value of 72.89, and a p-value of 0.000 (<0.05), confirming a statistically significant difference. The effect size (Cohen’s d) was 0.86, indicating a large effect. These results suggest that the regression model, based on rated conditions, tends to overestimate performance under actual winter conditions.
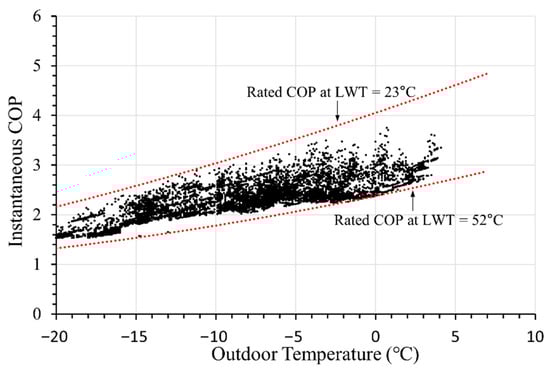
Figure 9.
Predicted COP values based on regression model during the winter period (20 December–8 January).
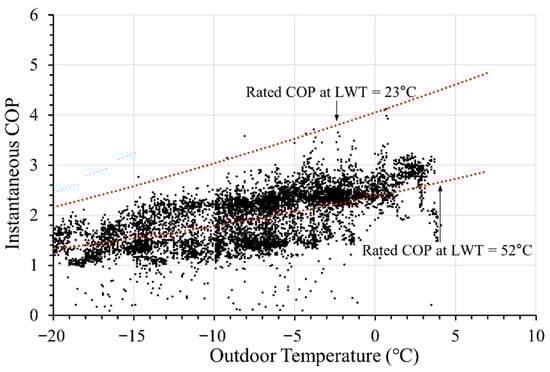
Figure 10.
Field-measured COP values during the winter period (20 December–8 January).
In contrast, the shoulder-season heating dataset (19 October–7 November 2024) showed minimal deviation. The predicted and measured COPs (Figure 11 and Figure 12) averaged 3.51 and 3.48, respectively, with a mean difference of just 0.03. A paired t-test with 658 samples yielded a t-value of 0.94 and a p-value of 0.348, indicating no statistically significant difference. The effect size (Cohen’s d) was only 0.037, classified as very small.
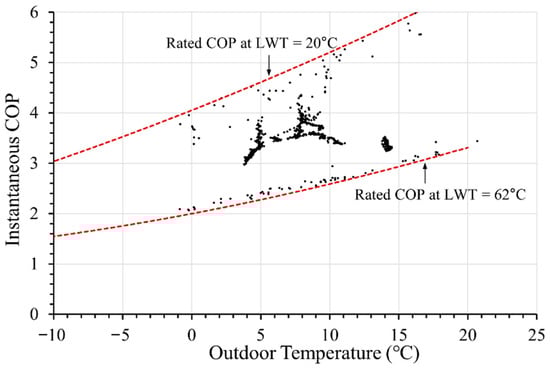
Figure 11.
Predicted COP values based on regression model during the shoulder season (19 October–7 November).
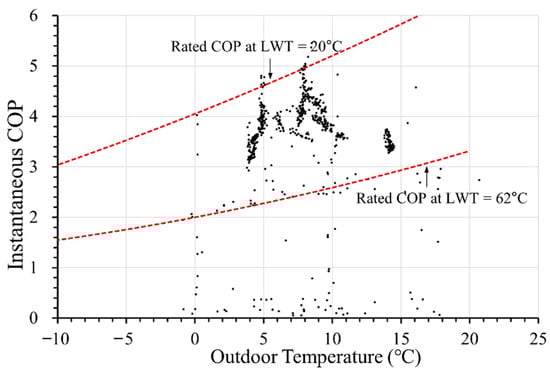
Figure 12.
Field-measured COP values during the shoulder season (19 October–7 November).
The findings indicate that differences between predicted and measured performance may result from factors not accounted for in the regression model, such as deviations from standard temperature conditions, local climate variability, potential differences in relative humidity, which were not explicitly considered in the regression model, and pipe insulation quality [24]. Under cold winter conditions, these factors appear to reduce in situ COP and create noticeable deviations from model predictions.
5. Carbon Emission Performance of ASHP
5.1. Emission Analysis Under Current Conditions
This section compares the GHG emissions of a condensing gas boiler and an air-source heat pump (ASHP) based on an equivalent amount of heat supplied. Therefore, the annual kgCO2eq emissions were calculated by applying the emission factors of the respective energy sources to each system’s annual energy consumption, as shown in Equations (7) and (8) below. This emission analysis focuses exclusively on the operational phase, and refrigerant-related emissions were excluded due to the large uncertainty associated with leakage rates and service conditions in residential ASHP systems.
where denotes the volume of city gas consumed (Nm3), is the net calorific value of city gas (kWh/Nm3), is the emission factor for city gas (kgCO2eq/kWh), GWP is the global warming potential (dimensionless; typically 1 for CO2), is the electricity consumption (kWh), and is the emission factor for electricity (kgCO2eq/kWh).
LCCP (Life Cycle Climate Performance) generally encompasses direct emissions, including refrigerant leakage [25]. However, in this study, only indirect emissions resulting from energy consumption were systematically assessed. Direct emissions such as refrigerant leakage were excluded due to substantial uncertainties arising from wide variability in leakage rates, refrigerant types, system maintenance conditions, and assumed operating lifetimes, as also noted by Ali Khan et al. [16]. For systems using high-GWP refrigerants such as R-410A or R-32, annual leakage rates of 1–3% can contribute up to 10–30% of total life cycle emissions under upper-bound scenarios, highlighting the need for sensitivity analyses in future studies.
Given this focus on indirect emissions, the present analysis employed CO2eq metrics that integrate the global warming potentials (GWPs) of various greenhouse gases, including CO2, CH4, and N2O. The CO2eq emission factors for each energy source (Table 6) were applied based on secondary (site) energy use. In particular, for electricity, the emission factor used reflects losses from generation to end-user consumption, incorporating transmission and distribution losses [26,27].
Table 6.
CO2eq emission factors for LNG-based city gas and electricity.
Table 7 summarizes the analysis assumptions for the condensing gas boiler. The gross calorific value (GCV) of city gas was applied in accordance with the national standard, and the system efficiency was set at 92%, reflecting typical operating conditions [28,29]
Table 7.
Assumed operational parameters for the reference condensing gas boiler analysis.
Figure 13 compares the monthly CO2eq emissions of the ASHP and the condensing gas boiler. Based on the annual cumulative emissions, the ASHP recorded 1532 kgCO2eq, while the condensing gas boiler emitted 1411 kgCO2eq—indicating that the heat pump produced approximately 8.6% higher emissions. Notably, during the winter months—January (2.1), February (2.3), November (2.4), and December (2.2), when the COP fell below 2.5, the ASHP’s emissions exceeded those of the gas boiler by more than 20%.
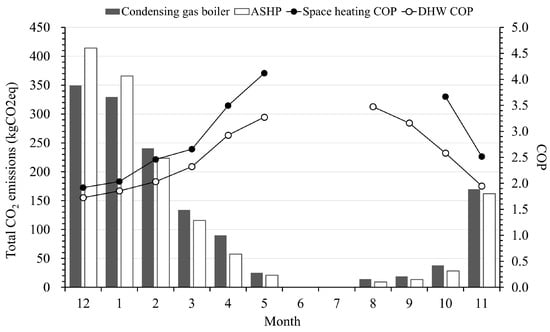
Figure 13.
Monthly CO2eq emissions from ASHP and a condensing gas boiler system (2024 baseline).
This result can be attributed to two main factors. First, the measured COP values were lower than the catalog-rated COPs, with performance degradation particularly pronounced under low outdoor temperature conditions in winter. Second, the CO2eq emission factor for electricity (0.4781 kgCO2eq/kWh) is approximately 2.4 times higher than that of city gas. As a result, when delivering the same amount of thermal energy, the structural characteristics of the system inherently lead to higher indirect emissions from the heat pump.
5.2. Scenario-Based Emission Analysis Under Projected Grid Decarbonization
Building on the previous emission analysis, this section assesses the long-term carbon reduction potential of ASHPs through scenario-based annual CO2 emission projections. The scenarios are based on projected grid CO2 emission factors for 2030, 2036, and 2050 (see Table 8), starting from the 2024 baseline (0.4781 kgCO2eq/kWh). These projected values reflect major policy milestones such as Korea’s 2030 Nationally Determined Contribution (NDC), the 10th Basic Plan for Electricity Supply and Demand (targeting 30% renewable energy by 2036), and the 2050 Carbon Neutrality Strategy, as outlined in national decarbonization plans.
Table 8.
Projected electricity CO2eq emission factors under national decarbonization scenarios.
Figure 14 presents the comparative CO2 emissions of the ASHP and a condensing gas boiler under each scenario. The baseline analysis (2024) shows that ASHPs currently emit more CO2 than condensing gas boilers due to both degraded winter performance and the higher emission intensity of electricity. However, as the grid becomes cleaner:
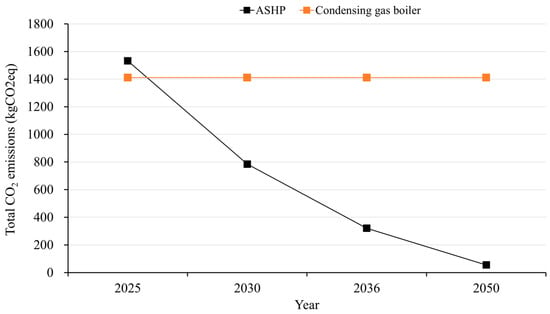
Figure 14.
Projected annual CO2eq emissions under Korea’s grid decarbonization scenarios (2024–2050).
- -
- By 2030, ASHP emissions drop to 785 kgCO2eq, already lower than the condensing gas boiler (1411 kgCO2eq).
- -
- In 2036, emissions are further reduced to 321 kgCO2eq.
- -
- By 2050, emissions fall to just 55 kgCO2eq, achieving a 96.1% reduction compared to the condensing gas boiler.
Notably, the analysis identifies a critical threshold emission factor of approximately 0.4402 kgCO2eq/kWh—below which ASHPs become more carbon-efficient than condensing gas boilers, even without performance enhancements. The findings underscore the strategic importance of synchronizing ASHP deployment with national grid decarbonization milestones. To maximize environmental benefits, policy incentives and technology rollout strategies should be coordinated with projected reductions in power-sector emission intensity.
6. Conclusions
This study evaluated the operational performance and carbon emissions of an air-source heat pump (ASHP) system installed in a detached house in Gongju, South Korea, based on a year-long field monitoring campaign. The system, equipped with a 9 kW air-to-water ASHP, provided both space heating (SH) and domestic hot water (DHW), with measured coefficients of performance (COPs) averaging 2.27 for SH and 2.06 for DHW. A comparison between catalog-based and field-measured COPs revealed a marked performance degradation during winter operation. Statistical analysis verified that the deviation was significant under low-temperature conditions, highlighting the importance of using actual operating data when assessing ASHP performance. Annual CO2-equivalent (CO2eq) emissions were also analyzed. Under current grid emission factors, the ASHP system emitted 1532 kgCO2eq—approximately 8.6% more than a condensing gas boiler. This was primarily due to COP degradation during cold weather and the relatively high carbon intensity of electricity. However, forward-looking scenario analysis indicated that ASHPs could outperform gas boilers in terms of emissions by 2036 or earlier, depending on national grid decarbonization progress. These findings underline the need to contextualize life cycle climate performance (LCCP) assessments based on seasonal dynamics and grid emissions, rather than static catalog data.
Future work should improve the LCCP framework by incorporating direct refrigerant emissions, which may account for a non-trivial share of life cycle impacts under typical leakage conditions. Additionally, extended monitoring under diverse climatic conditions, housing typologies, and user behaviors is needed to generalize findings and support robust ASHP deployment strategies. Overall, this study provides timely insights for designing climate mitigation policies that promote the use of ASHPs while recognizing the importance of actual field performance and grid emission factors.
Author Contributions
Conceptualization, S.-S.L., J.-H.K. and U.-C.S.; Methodology, S.-S.L. and H.-W.L.; Software, S.-S.L. and H.-W.L.; Formal analysis, S.-S.L. and U.-C.S.; Investigation, J.-H.K.; Data curation, J.-H.K. and H.-W.L.; Writing—original draft, S.-S.L.; Writing—review & editing, J.-H.K. and U.-C.S.; Visualization, J.-H.K.; Project administration, U.-C.S. All authors have read and agreed to the published version of the manuscript.
Funding
This research was supported by the Korea Institute of Energy Technology Evaluation and Planning (KETEP) grant funded by the Ministry of Trade, Industry and Energy of the Republic of Korea (No. 20220810100020).
Data Availability Statement
The original contributions presented in this study are included in the article. Further inquiries can be directed to the corresponding author.
Acknowledgments
The authors acknowledge the assistance of an AI-based language model (ChatGPT-5.2, OpenAI) in translating and refining the English language of the manuscript.
Conflicts of Interest
Author Song-Seop Lee was employed by the Korea Conformity Laboratories and Hee-Won Lim was employed by the Dyson Shpere Inc. The remaining authors declare that the research was conducted in the absence of any commercial or financial relationships that could be construed as a potential conflict of interest.
References
- International Energy Agency (IEA). The Future of Heat Pumps: World Energy Outlook Special Report; International Energy Agency: Paris, France, 2022; Available online: https://www.iea.org/reports/the-future-of-heat-pumps (accessed on 7 May 2025).
- Sevindik, S.; Spataru, C.; Domenech Aparisi, T.; Bleischwitz, R. A comparative environmental assessment of heat pumps and gas boilers towards a circular economy in the UK. Energies 2021, 14, 3027. [Google Scholar] [CrossRef]
- European Heat Pump Association (EHPA). European Heat Pump Market and Statistics Report 2023; EHPA: Brussels, Belgium, 2023; Available online: https://www.ehpa.org/news-and-resources/publications/european-heat-pump-market-and-statistics-report-2023/ (accessed on 7 May 2025).
- Fortune Business Insights. Heat Pump Market Size, Growth, Global Industry Report, 2032. 2024. Available online: https://www.fortunebusinessinsights.com/industry-reports/heat-pump-market-100920 (accessed on 7 May 2025).
- Global Market Insights. Residential Heat Pump Water Heater Market Size Report-2032. 2024. Available online: https://www.gminsights.com/industry-analysis/residential-heat-pump-water-heater-market (accessed on 7 May 2025).
- Grand View Research. South Korea Heat Pump Market Size & Outlook, 2024–2030. 2024. Available online: https://www.grandviewresearch.com/horizon/outlook/heat-pump-market/south-korea (accessed on 7 May 2025).
- Carbon Neutrality and Green Growth Commission. Nationally Determined Contribution (NDC) of Korea for 2030; Government of the Republic of Korea: Seoul, Republic of Korea, 2023. [Google Scholar]
- Construction Economy Research Institute of Korea (CERIK). Strategic Roadmap for Achieving Carbon Neutrality in the Construction Sector; Construction Economy Research Institute of Korea: Seoul, Republic of Korea, 2021. [Google Scholar]
- Miara, M.; Günther, D.; Kramer, T.; Oltersdorf, T.; Wapler, J. Heat Pump Efficiency—Analysis and Evaluation of Heat Pump Efficiency in Real-Life Conditions; Fraunhofer Institute for Solar Energy Systems ISE: Freiburg im Breisgau, Germany, 2011. [Google Scholar]
- Bayer, D.R.; Pruckner, M. Data-driven heat pump retrofit analysis in residential buildings: Carbon emission reductions and economic viability. Appl. Energy 2024, 373, 123823. [Google Scholar] [CrossRef]
- Sun, Z.; Ren, T.; Wang, Y.; Fu, H.; Chen, X.; Jiao, F.; Li, J.; Liang, D.; Zhang, J.; Hou, S. Experimental study on the application of air-source heat pump in a warm-temperate extreme-arid-desert climate zone. Case Stud. Therm. Eng. 2023, 42, 102723. [Google Scholar] [CrossRef]
- Wu, P.; Wang, Z.; Li, X.; Xu, Z.; Yang, Y.; Yang, Q. Energy-saving analysis of air source heat pump integrated with a water storage tank for heating applications. Build. Environ. 2020, 180, 107029. [Google Scholar] [CrossRef]
- Carutasiu, M.-B.; Necula, H. Assessing the impact of air-source heat pumps in a residential building’s retrofit process. Buildings 2024, 14, 3708. [Google Scholar] [CrossRef]
- Schraer, J. The Economic and Emissions Reduction Potential of Air Source Heat Pumps as a Replacement for Natural Gas and Electric Resistance Space Heating in the Contiguous United States. Master’s Thesis, Western Washington University, Bellingham, WA, USA, 2023. Available online: https://cedar.wwu.edu/wwuet/1158 (accessed on 7 May 2025).
- Berardi, U.; Jones, S. The efficiency and GHG emissions of air source heat pumps under future climate scenarios across Canada. Energy Build. 2022, 262, 112000. [Google Scholar] [CrossRef]
- Khan, S.A.; O’Hegarty, R.; Finn, D.; Kinnane, O. Environmental footprint analysis of domestic air source heat pumps. Resour. Conserv. Recycl. Adv. 2024, 22, 200217. [Google Scholar] [CrossRef]
- Lin, Z.; Li, X.; Lin, M.; Zhang, T.; Guo, Q.; Rao, Y.; Liang, L. Analysis of carbon emission associated with composite air source heat pumps in buildings. Case Stud. Therm. Eng. 2025, 69, 106033. [Google Scholar] [CrossRef]
- Zhang, Y.; Ma, Q.; Li, B.; Fan, X.; Fu, Z. Application of an air source heat pump (ASHP) for heating in Harbin, the coldest provincial capital of China. Energy Build. 2017, 138, 96–103. [Google Scholar] [CrossRef]
- Nardi, I.; Lavinia, C.; Iatauro, D.; Calabrese, N. Field study on heat pump monitoring: Challenges and opportunities. E3S Web Conf. 2021, 312, 04002. [Google Scholar] [CrossRef]
- Liu, X.; Zhou, Q.; Huang, K.; Wu, Y.; Liang, C.; Cao, H.; Wei, J. Operating characteristics and evaluation of air source heat pumps in cold regions during heating season in China. Energy Built Environ. 2025, 6, 645–654. [Google Scholar] [CrossRef]
- Khan, A.; Alkhatib, A.; Pfeiffer, T.; Bradshaw, C.R. Hot gas bypass, economized, compressor load stand development and experimental data collection for flammable, low-GWP refrigerants. Int. J. Refrig. 2025, 179, 342–358. [Google Scholar] [CrossRef]
- Fraunhofer ISE. Field Testing of Heat Pumps: Performance and Experience; IEA HPP Annex 48; Fraunhofer ISE: Freiburg, Germany, 2021. [Google Scholar]
- IEA Heat Pump Centre. Analysis of Field Measurements for Heat Pumps: Performance and Recommendations; Annex 48 Final Report; IEA Heat Pump Centre: Borås, Sweden, 2014. [Google Scholar]
- O’Hegarty, R.; Kinnane, O.; Lennon, D.; Colclough, S. Air-to-water heat pumps: Review and analysis of the performance gap between in-use and product rated performance. Renew. Sustain. Energy Rev. 2022, 155, 111887. [Google Scholar] [CrossRef]
- International Institute of Refrigeration (IIR). Guideline for Life Cycle Climate Performance (LCCP); International Institute of Refrigeration: Paris, France, 2016. [Google Scholar]
- Ministry of Trade, Industry and Energy (MOTIE). Energy Act Enforcement Rules, Table 4: Methods for Calculating Greenhouse Gas Emissions; Korea Law Information Center: Sejong-si, Republic of Korea, 2023; Available online: https://www.law.go.kr (accessed on 7 May 2025). (In Korean)
- Korea Energy Agency. Emission Factors and Calorific Values by Energy Source; Energy Saving Information System (TIPS): Hong Kong, China, 2022; Available online: https://tips.energy.or.kr/carbon/Ggas_tatistics03.do (accessed on 7 May 2025). (In Korean)
- Energy News. Condensing Boilers Achieve Over 92% Efficiency, Reducing Gas Consumption by Up to 28.4%. Energy News, 15 March 2023. (In Korean) [Google Scholar]
- Korea Energy Agency. Energy Efficiency Label and Standard Program: Application Scope, Testing Methods, and Efficiency Standards for Certified Gas Boilers; Korea Energy Agency: Ulsan, Republic of Korea, 2023; Available online: https://eep.energy.or.kr (accessed on 7 May 2025). (In Korean)
Disclaimer/Publisher’s Note: The statements, opinions and data contained in all publications are solely those of the individual author(s) and contributor(s) and not of MDPI and/or the editor(s). MDPI and/or the editor(s) disclaim responsibility for any injury to people or property resulting from any ideas, methods, instructions or products referred to in the content. |
© 2025 by the authors. Licensee MDPI, Basel, Switzerland. This article is an open access article distributed under the terms and conditions of the Creative Commons Attribution (CC BY) license.