Article

A Day-Ahead Wind Power Dynamic Explainable Prediction Method Based on SHAP Analysis and Mixture of Experts


by
Hao Zhang
1,
Guoyuan Qin
2,*,
Xiangyan Chen
1,
Linhai Lu
2,
Ziliang Zhang
1 and
Jiajiong Song
2
1
Science and Technology Research Institute, China Three Gorges Corporation, Beijing 101199, China
2
State Key Laboratory of Advanced Electromagnetic Technology, School of Electrical and Electronic Engineering, Huazhong University of Science and Technology, Wuhan 430074, China
*
Author to whom correspondence should be addressed.
Energies 2026, 19(1), 124; https://doi.org/10.3390/en19010124
Submission received: 12 November 2025 / Revised: 13 December 2025 / Accepted: 16 December 2025 / Published: 25 December 2025
(This article belongs to the Topic Advances in Wind Energy Technology: 2nd Edition)

Abstract

Traditional single-prediction models often exhibit limitations in meeting wind power prediction requirements in complex operational scenarios. Furthermore, the inherent “black-box” nature of deep learning models leads to limited interpretability of predictions, hindering effective support for grid dispatch planning. To address these issues, this study proposes a novel day-ahead wind power prediction method, referred to as SHapley Additive exPlanations (SHAP)–Mixture of Experts (MoE), which integrates SHAP into an MoE framework. Here, SHAP is employed for interpretability purposes. This study innovatively transforms SHAP analysis into prior knowledge to guide the decision-making of the MoE gating network and proposes a two-layer dynamic interpretation mechanism based on the collaborative analysis of gating weights and SHAP values. This approach clarifies key meteorological factors and the model’s advantageous scenarios, while quantifying the uncertainty among multiple expert decisions. Firstly, each expert model was pre-trained, and its parameters were frozen to construct a candidate expert pool. Secondly, the SHAP vectors for each pre-trained expert were computed over all sample features to characterize their decision-making logic under varying scenarios. Thirdly, an augmented feature set was constructed by fusing the original meteorological features with SHAP attribution matrices from all experts; this set was used to train the gating network within the MoE framework. Finally, for new input samples, each frozen expert model generates a prediction along with its corresponding SHAP vector, and the gating network aggregates these predictions to produce the final forecast. The proposed method was validated using operational data from an offshore wind farm located in southeastern China. Compared with the best individual expert model and traditional ensemble forecasting models, the proposed method reduces the Root Mean Square Error (RMSE) by 0.23% to 4.92%. Furthermore, the method elucidates the influence of key features on each expert’s decisions, offering insights into how the gating network adaptively selects experts based on the input features and expert-specific characteristics across different scenarios.

1. Introduction

In recent years, the accelerated implementation of new energy policies has driven the steady expansion of the installed capacity of wind power. However, large-scale utilization of wind energy is constrained by the intermittency and volatility of wind resources [1,2,3]. High-accuracy wind power prediction technology can enable the safe and stable operation of power grids and supply critical data for electricity market transactions, thereby yielding significant economic benefits [4,5,6].
Feature analysis methods enhance the accuracy of wind power prediction models by studying the impact of multiple meteorological factors, such as wind speed, wind direction, and temperature, on the prediction results [7,8]. The existing literature contains preliminary research on wind power prediction methods based on feature analysis. Reference [9] proposed a method that uses feature extraction techniques to select key features from Numerical Weather Prediction (NWP) and historical wind power generation data for wind power prediction modeling. Reference [10] introduced a multilayer deep feature selection framework based on principal component analysis, Granger causality testing, autocorrelation analysis, and recursive feature elimination to determine the most suitable input features for the prediction model. Reference [11] utilized the random forest algorithm to analyze the feature correlations and obtain the optimal feature combination to construct the final input vector. These studies improved the prediction accuracy of models to some extent by introducing feature analysis methods. However, a limitation of these methods is that they struggle to quantitatively characterize the contribution of different features to the prediction results. Compared to the aforementioned feature analysis methods, SHapley Additive exPlanations (SHAP) not only accurately quantifies the positive and negative contributions of features to the prediction results but also provides both global and local feature importance analysis [12,13,14]. Therefore, this study applies SHAP to wind power prediction, aiming to enhance the prediction accuracy while improving the interpretability of the results.
Owing to the complexity and diversity of weather processes, a single wind power prediction model often lacks sufficient generalization capability. Ensemble forecasting, which integrates the prediction results from multiple models, can further enhance the prediction accuracy [15,16]. Therefore, current research has begun to explore multi-model collaborative forecasting methods. Reference [17] proposed a short-term wind power prediction method that selects the optimal candidate prediction model by voting based on high-similarity historical wind processes. Reference [18] proposed a multi-door mixed expert structure composed of five different neural network structures to capture both local and global time-series features effectively. Reference [19] proposed a hybrid model that achieved high-precision wind power prediction by fusing the prediction results at different scales. These studies improved the generalization capability of models by selecting or integrating them for discretized weather processes [20]. However, a limitation of these methods is that they do not adequately consider the complexity of meteorological processes and explainability of the prediction results.
Compared to the aforementioned methods, the Mixture of Experts (MoE) model, which uses a gating network to activate only a subset of experts for specific inputs, provides a new approach for explainable predictions [21,22]. Therefore, this study applies a Mixture of Experts (MoE) method to wind power forecasting. By incorporating a scenario-based dynamic model adaptation mechanism and combining it with the SHAP feature attribution analysis, it establishes a solid foundation for model interpretability analysis.
To address the dual challenges of accuracy and explainability in wind power prediction under complex meteorological conditions, this study proposes a novel method for day-ahead wind power prediction that integrates SHAP analysis with a Mixture of Experts model. The main contributions of this study are as follows:
(1)
A SHAP knowledge-guided and data-driven MoE gating model is proposed. This study innovatively transforms SHAP analysis from a post hoc interpretation tool into prior knowledge that guides the decision-making process of the MOE gating network. An enhanced high-dimensional gating feature matrix is constructed by integrating original numerical weather prediction (NWP) features with expert SHAP attribution results, which reflect the decision-making rationale of each expert model, thereby achieving the transformation from post hoc interpretation to prior guidance. This design enables the gating network to more accurately select the optimal expert model under specific meteorological conditions based on feature contribution information, thereby enhancing both the prediction accuracy and interpretability of the forecasting network.
(2)
A two-layer dynamically interpretable forecasting method is proposed, based on the synergistic analysis of gating expert weights and SHAP attribution. This method aims to dynamically reveal the model’s decision logic across various scenarios and guide subsequent model optimization. At the feature level, analysis of the SHAP feature contribution distribution corresponding to high-weight experts facilitates the identification of key meteorological factors that dominate prediction decisions in specific scenarios, enabling dynamic interpretability analysis of forecasting behavior. At the expert level, analysis of the expert weight distribution output by the SHAP attribution-based gating network across different scenarios enables the delineation of expert “trust boundaries,” thereby clarifying the strengths and weaknesses of various model types in specific scenarios. Furthermore, interpretable quantification of the model’s intrinsic uncertainty is achieved through dispersion analysis of the expert weight distribution.

2. Dynamic Explainable Prediction Method Based on SHAP Analysis and Mixture of Experts

2.1. General Framework

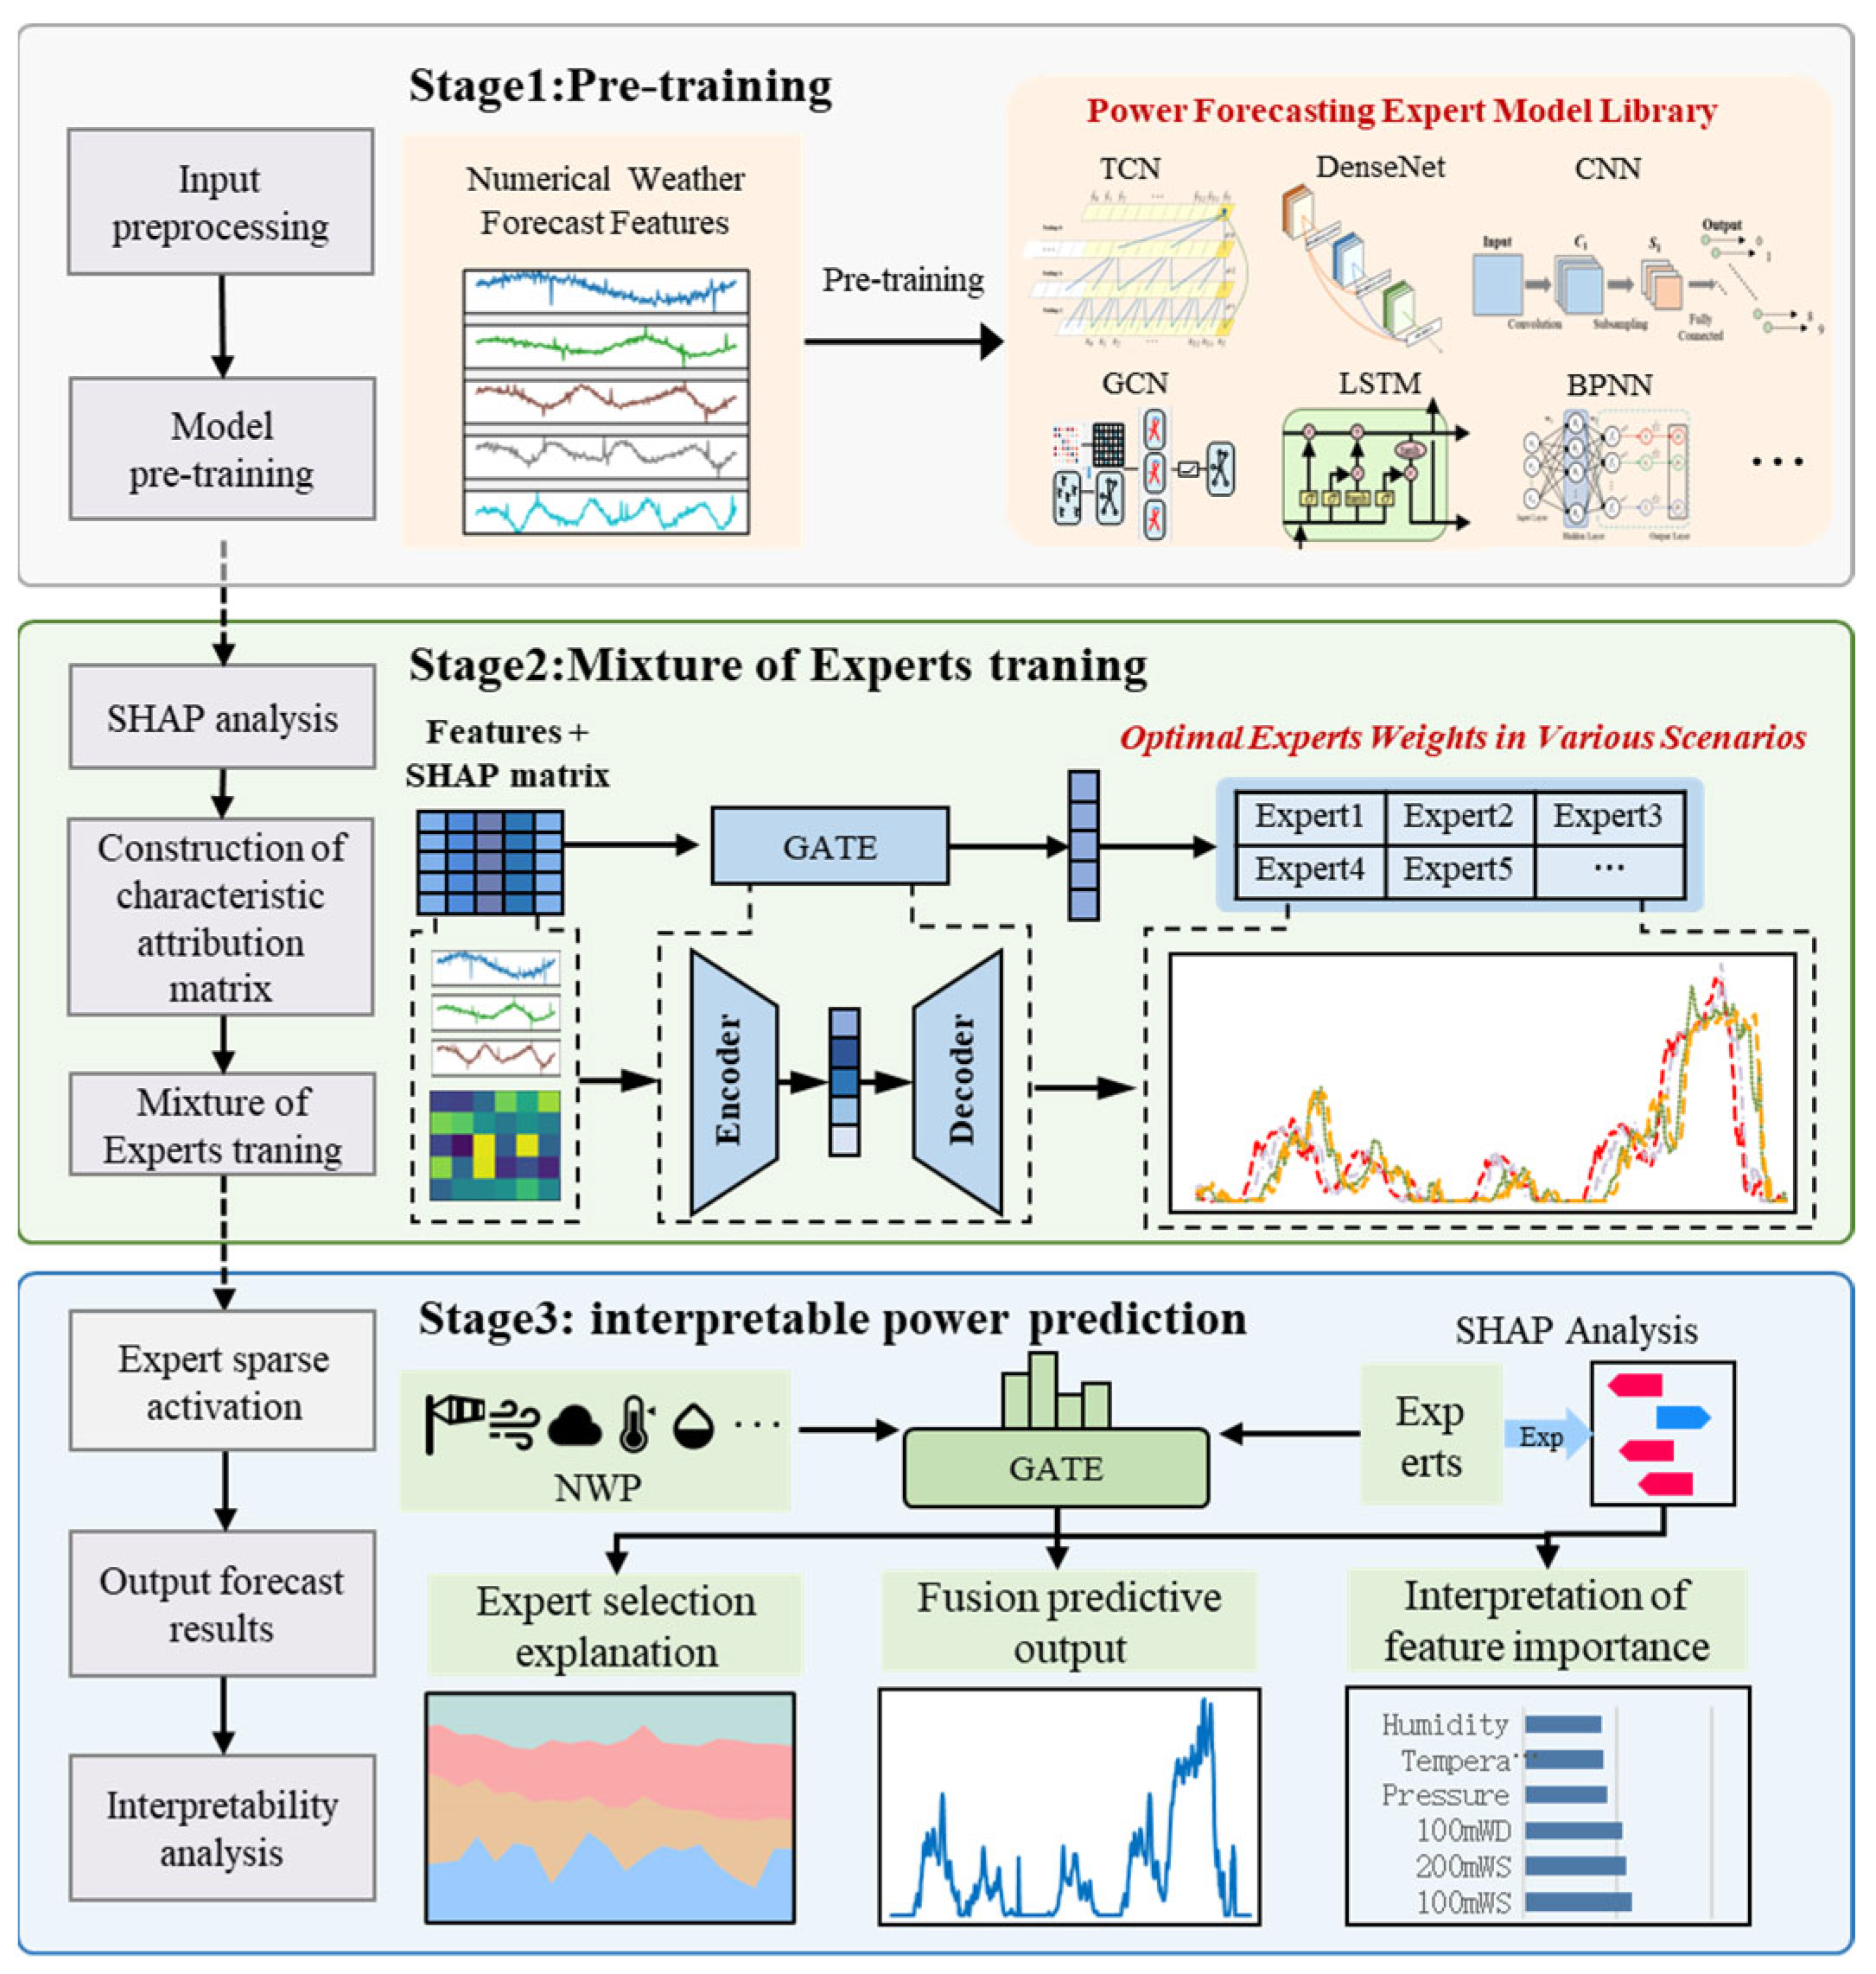
This paper proposes a new method for the dynamic interpretable prediction of wind power based on the fusion of characteristic attribution analysis and a Mixture of Experts system architecture. The overall process is shown in Figure 1 and is divided into three steps.

2.1.1. Step 1: Pre-Training of Candidate Experts

The historical wind power data and numerical weather prediction data were partitioned into training, validation, and test sets. A group of heterogeneous models established for wind power forecasting was selected as candidate experts. Each expert was individually trained, and the hyperparameters were optimized using the training set. After pre-training, the parameters of all expert models are frozen, forming a pool of candidate experts in the MoE framework, denoted as E 1 , E 2 , E 3 , …, E K , where K is the total number of experts.

2.1.2. Step 2: SHAP Attribution Analysis and Mixture of Experts Model Training

For each sample in the validation set, the corresponding SHAP value vector, φ i k , is computed using each pre-trained expert. This vector has the same dimensionality as the input features, where each element φ i k j represents the magnitude and direction of the contribution of the j-th feature to the prediction result of expert E k on sample x i . The SHAP values from all samples and experts collectively form an attribution information matrix, which is utilized to reveal the decision mechanisms of different experts across various samples. Subsequently, the gating network was trained using both the attribution information matrix and original meteorological features.

2.1.3. Step 3: Explainable Wind Power Prediction

For new samples from the test set, each expert model first generated independent power predictions and computed the corresponding SHAP value vectors. These new samples, along with their attribution matrices, were then fed into the trained gating network to aggregate the predictions from all experts. Finally, fine-grained attribution analysis was conducted by leveraging the SHAP results and weight matrix of the gating network. This analysis investigates how input features guide the gating network’s expert selection, clarifying the model’s reliance on specific experts under the given conditions. It further assesses the contribution of each expert to the final prediction output using the assigned gating weights.

2.2. SHAP Knowledge-Guided Mixture of Experts Gating Model

Wind power prediction performance is highly dependent on multidimensional, heterogeneous input features, such as meteorological conditions, spatiotemporal evolution patterns, and the operational status of wind turbine equipment. However, different features contribute to the prediction results in a highly nonlinear and time-varying manner under various operational conditions (such as extreme weather, seasonal transitions, or equipment aging stages). This results in traditional black-box models struggling to balance prediction accuracy with decision transparency. To enhance both the generalization ability and interpretability of the model, this study introduces SHapley Additive exPlanation (SHAP) values as prior knowledge of feature importance, embedding them into the model architecture design.
SHAP, grounded in Shapley values from cooperative game theory, offers a theoretically coherent and locally accurate feature attribution approach by quantifying the marginal contribution of each input feature to the prediction outcome of an individual sample. Its output not only elucidates the decision-making rationale of the model for a specific instance but also serves as structured prior knowledge that encapsulates the causal relationship between features and predictions. In contrast to traditional gradient- or perturbation-based interpretability methods, SHAP demonstrates superior robustness and fairness, particularly in complex nonlinear models. It is particularly well suited for high-dimensional, non-stationary, and strongly coupled time-series modeling tasks, such as wind power prediction.
Φ k = S N \ { i } S ! N S 1 ! N ! f S i f S
In Equation (1), Φ k represents the SHAP value of feature i ; N, the set of all features; S N \ { i } , a subset S of the feature set N that does not contain feature i ; and f , the original prediction model, whose function value corresponds to the model’s prediction output when feature set S is present. The positive or negative nature of SHAP values determines the direction of influence of feature vectors on the prediction target, while the magnitude of their absolute values reflects the intensity of this influence.
Within the SHAP framework, the output of a prediction model for input x containing N features (i.e., f x ) can be explained using linear function g.
f x = Φ 0 + i = 1 N Φ i x i
In Equation (2), x represents the input of x transformed by the following mapping function: if feature i is observed, then x i equals 1, and 0 otherwise. Moreover, Φ 0 denotes the base value when all input features are absent.
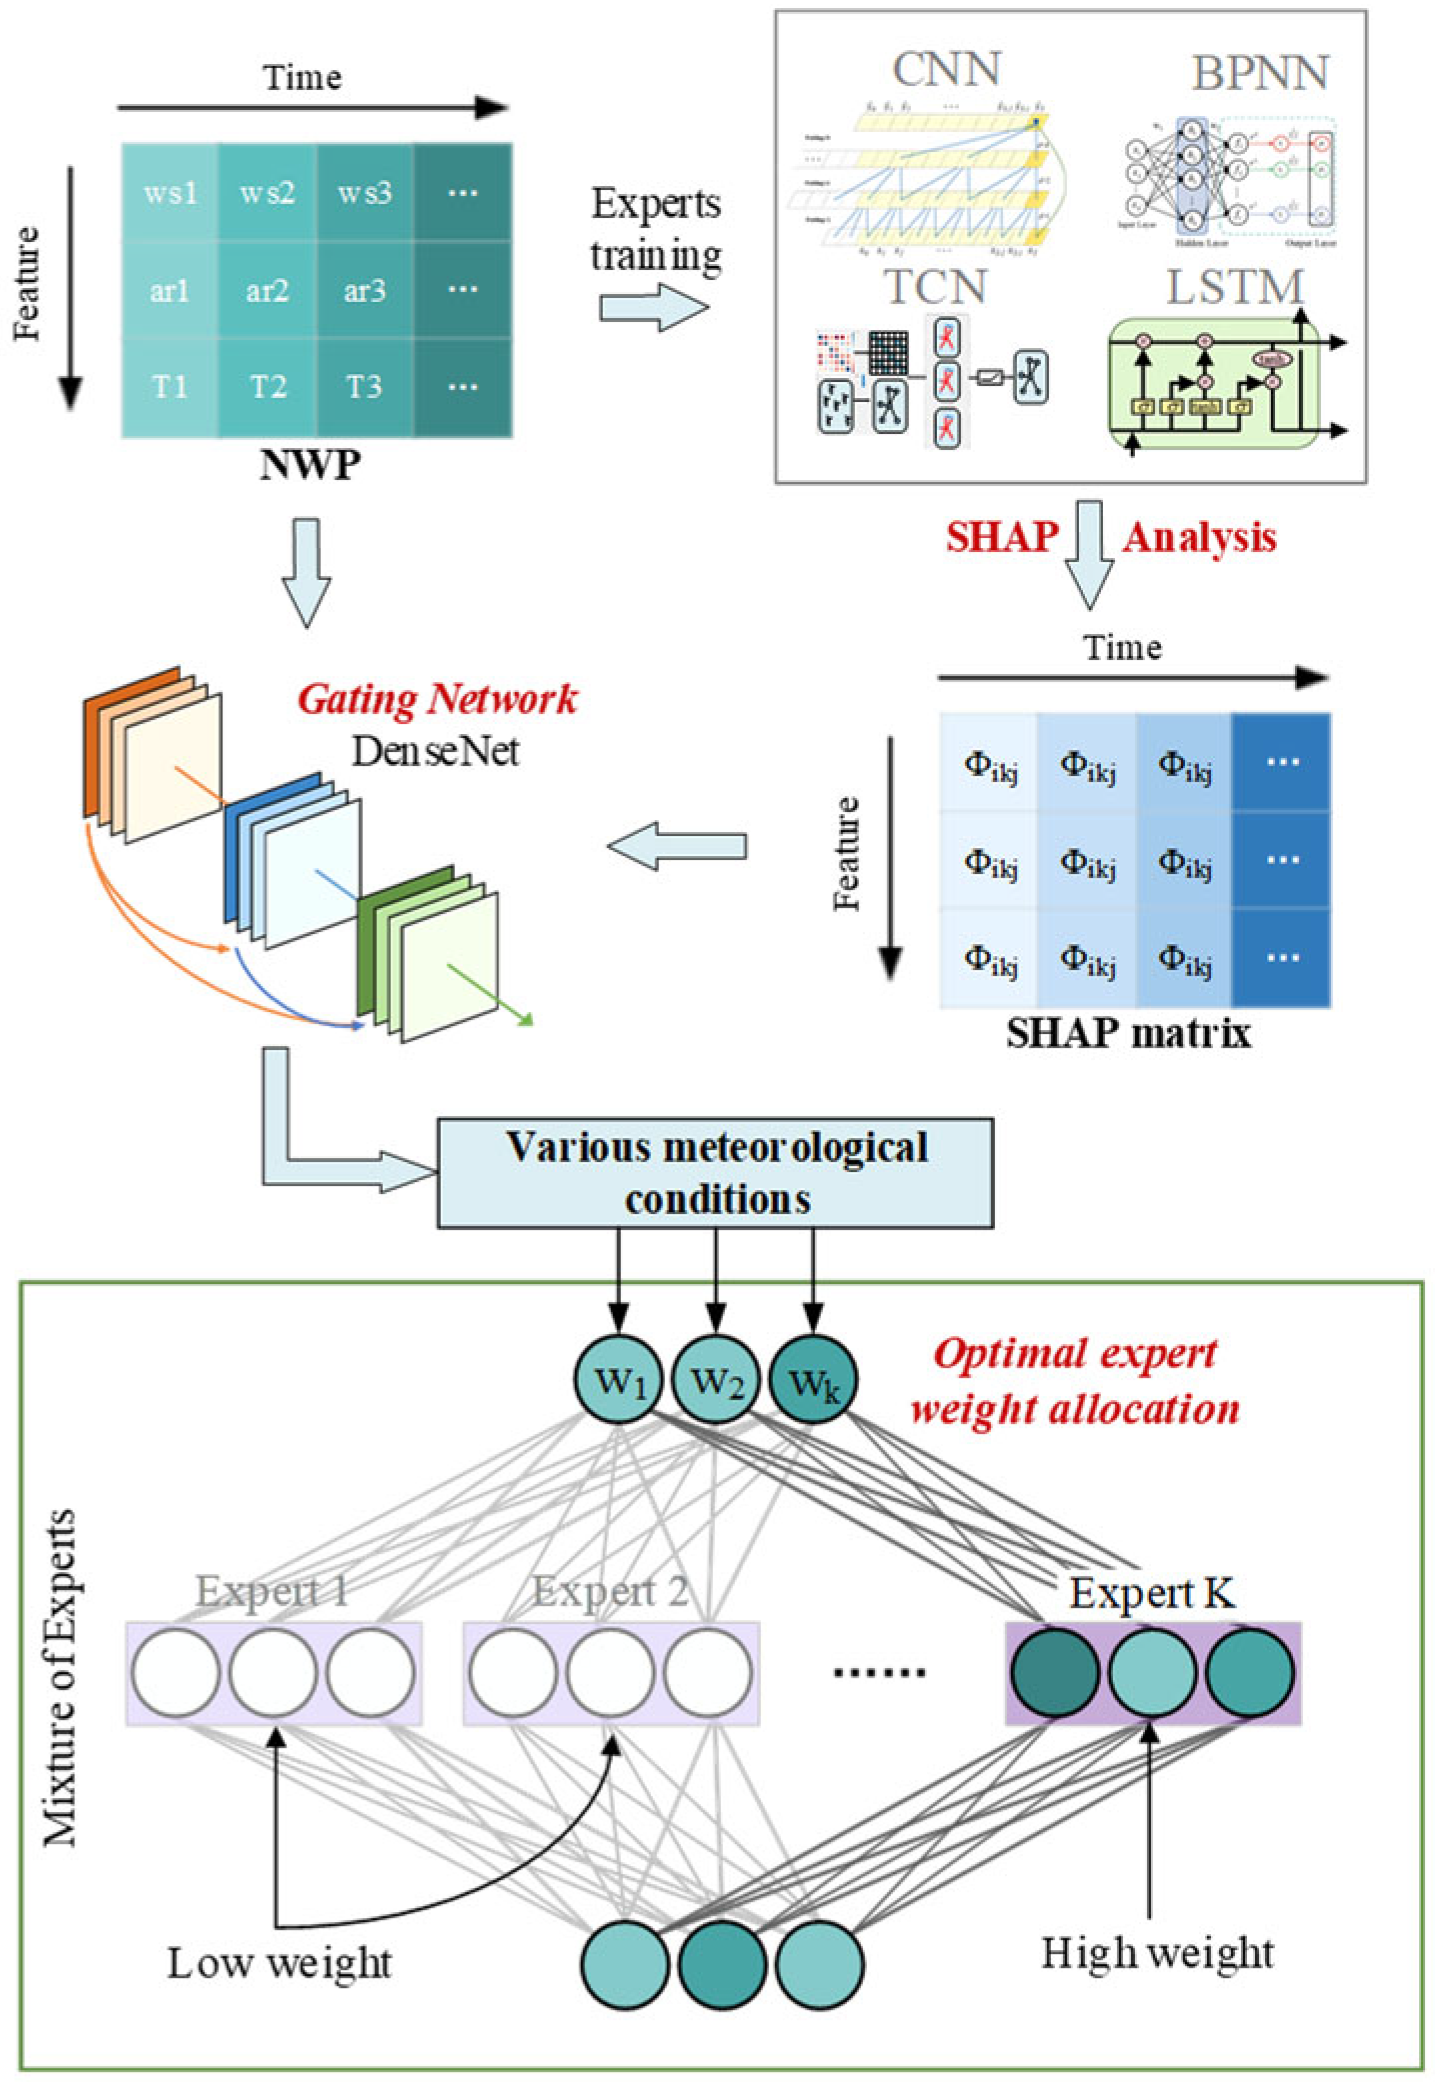
Building on this, this paper proposes the integration of SHAP prior information into the gating mechanism of a Mixture of Experts (MoE) architecture, as illustrated in Figure 2. A traditional MoE model consists of a set of expert networks and a gating network. Each expert network focuses on learning local patterns within the input space, whereas the gating network dynamically generates expert weights based on the current input to achieve soft routing. However, standard gating networks are typically trained from random initialization, and when confronted with issues such as distribution shifts, sample sparsity, or feature redundancy commonly found in wind power data, they are prone to becoming stuck in the local optima. This can result in suboptimal expert specialization and limited model generalization capability.
To overcome the aforementioned limitations, this study incorporates the feature-prediction association structure revealed by SHAP values as a structured prior guidance signal for the gating network. Specifically, during the initial stages of model training, the SHAP feature importance for each input feature, with respect to the output of each expert model, is computed based on historical wind power operational data using a pre-trained expert network, denoted as {E1, E2, E3, …, Ek}.
The expert model receives a third-order tensor X R n × t × d . Specifically, for a dataset containing n samples, each sample is represented by a d-dimensional feature sequence spanning the interval from time step Tt to T. A DeepExplainer module computes the SHAP tensor S R n × t × d , which is perfectly channel-aligned with X . Concatenating S and X along the feature axis yields an augmented attribution tensor, termed the “sample–feature–expert” cube, X a u g R n × t × 2 d . For k expert networks, the individual X a u g tensors are stacked along an additional axis, producing the four-way tensor X e x p R n × t × 2 d × k . This structure can be reshaped or pooled into any format required by downstream layers, allowing the model to process data of varying dimensionality at different stages and thereby accommodate complex task requirements. By fusing this information, the gating network acquires, from the very beginning of training, prior knowledge regarding “which features, under which conditions, should activate which expert” and “which features contribute most to which expert under which conditions.” This prior accelerates convergence and steers the expert networks toward well-delineated responsibilities.
The gating network ultimately generates a weight for each expert. It is typically a neural network with a Softmax function as its output layer, which produces a K-dimensional weight vector g ( x )   =   [ w 1 ,   w 2 ,   ,   w k ] for an input sample x, where k = 1 K w k = 1 . The weight w represents the predicted contribution of expert Eₖ to the current sample x determined by the gating network. The final output of the model is the weighted sum of all expert outputs: y = k = 1 K w k E k ( x ) .
In summary, the proposed framework explicitly models the mapping between “feature importance” and “expert selection” through SHAP priors. While maintaining the flexibility of the MoE model, it enables the model to adaptively respond to the nonstationary dynamic characteristics of wind power sequences under varying meteorological scenarios, thereby enhancing its interpretability and generalization ability in complex renewable energy prediction tasks.

2.3. Prediction Dynamic Interpretability Method Based on Synergistic Analysis of Expert Weights and SHAP Values

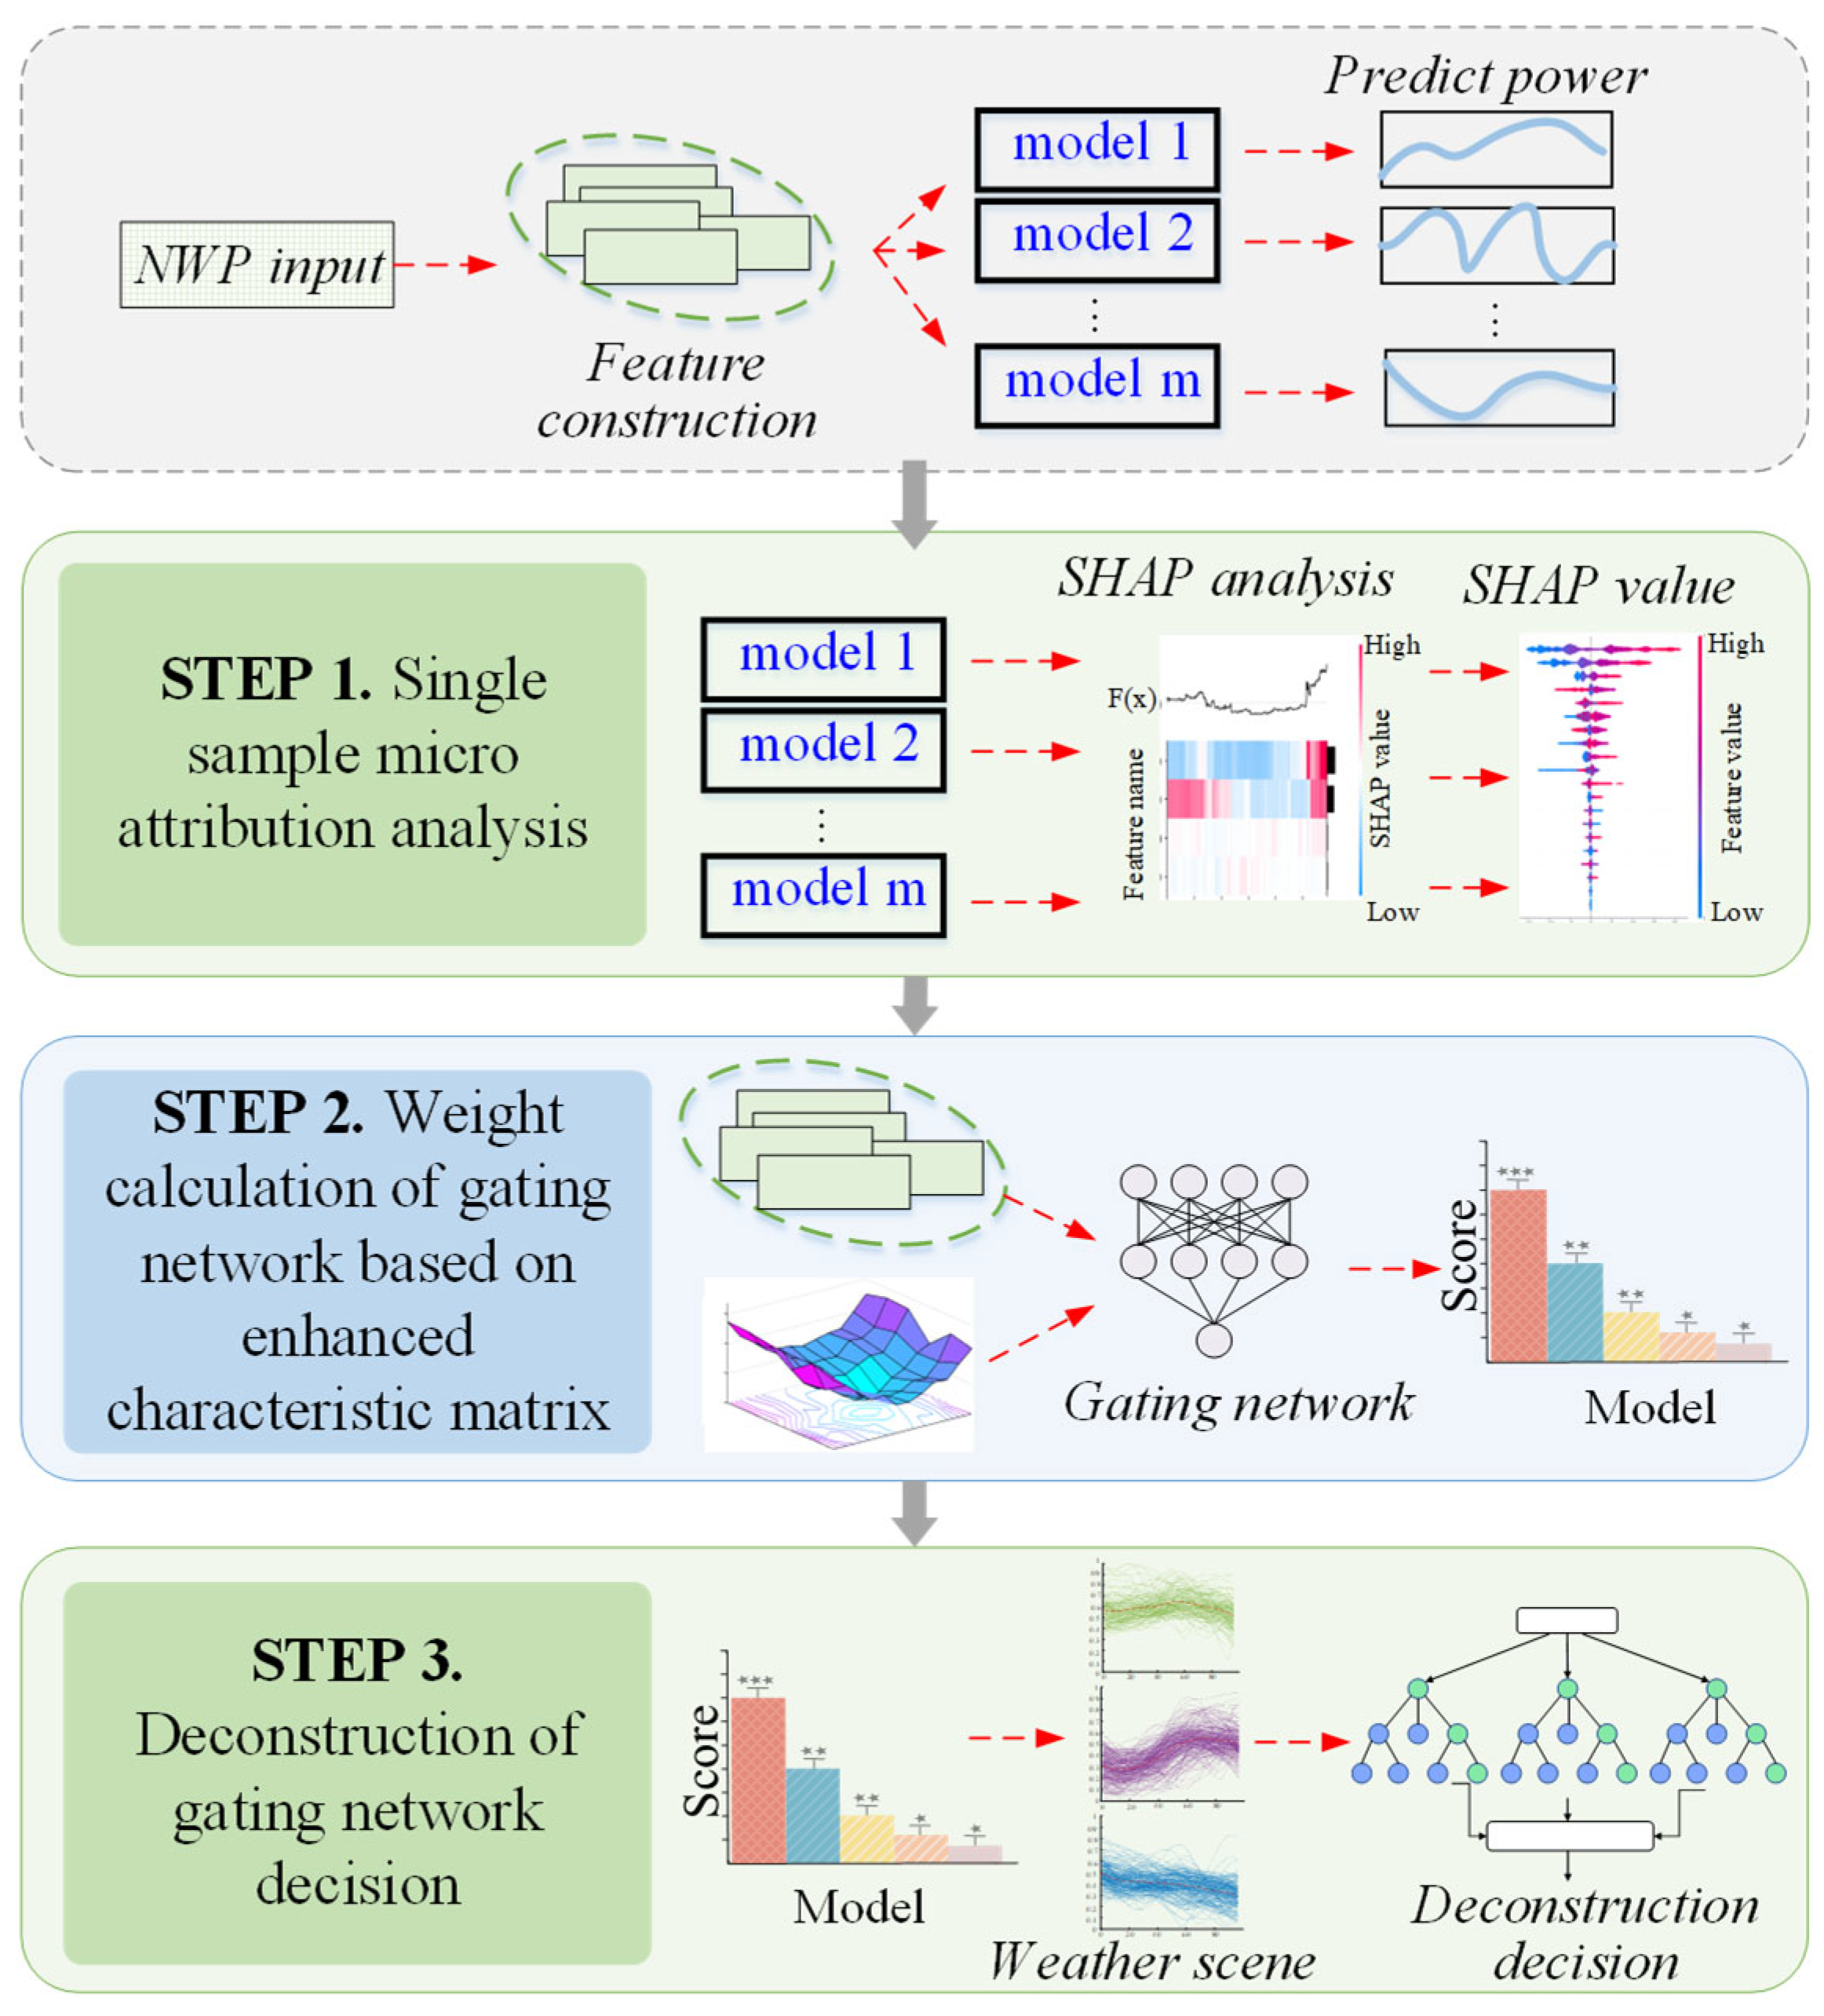
To gain deeper insights into the decision-making logic of the model in specific scenarios, this study introduces a dynamic interpretability approach based on the synergistic analysis of expert weights and SHAP values, as illustrated in Figure 3. By integrating intrinsic model architecture characteristics with explainability signals emerging during training, the proposed method facilitates a multilevel interpretability analysis, traversing from the “global structure” down to “individual sample decisions.”
First, to decipher the decision logic for individual predictions, micro-level attribution analysis was performed per sample at each prediction time point using the SHAP method. This process identifies the specific direction and intensity of the contribution from each input feature (such as wind speed, temperature, and historical power), ultimately providing a clear explanation of the model’s prediction at that particular moment.
Second, the routing decisions of the gating network are pivotal to the model’s capacity for dynamic adaptation across varying operational conditions. To render these decisions interpretable, this study deconstructs the gating network’s internal decision-making logic. Within the proposed SHAP-MoE architecture, the input to the gating network is augmented to include not only the original features but also the SHAP value distribution of the given sample across all pre-trained experts.
Finally, to elucidate the influence of input features on the expert selection of the gating network, this study analyzed the distribution of expert weights generated under diverse wind power scenarios. This analysis revealed the rationale behind the model’s reliance on specific experts under particular conditions. By deconstructing the interaction between raw environmental data and the model’s internal decision logic, this study provides an in-depth interpretation of the model’s behavioral patterns across various operational contexts.

3. Case Study

3.1. Introduction of Dataset and Judging Criteria

The case study was based on data from an offshore wind farm (rated capacity: 400 MW) in southeastern China. The core data include (1) historical operational data from the wind farm with a 15 min resolution and (2) numerical weather prediction data from the ECMWF high-resolution system, providing 16 raw meteorological features, as listed in Table 1. The study period extended from 1 January 2023 to 30 September 2024. After the preprocessing steps (handling missing values and normalizing each feature to [0, 1] using min-max scaling), 562 daily samples were formed. To ensure robustness, five-fold cross-validation was employed to comprehensively evaluate model stability and generalization performance. The forecasting task involved predicting the power output for the next 24 h (96 steps ahead). The model performance was quantified using the Root Mean Square Error (RMSE) and Mean Absolute Error (MAE). The formulae for these metrics are shown in Equation (3).
R M S E = 1 n i = 1 n ( y i f i y m a x ) 2 M A E = 1 n i = 1 n y i f i y m a x
In Equation (3), y i is the actual value of the i-th sample; f i , the predicted value of the i-th sample; and n, the total number of samples.

3.2. Model Parameters and Training

The specific structures of the expert models constructed in this study were configured based on publicly available information. The hyperparameters of the prediction models are summarized in Table 2.
The experiments in this study were implemented on an Ubuntu 24 platform using Python 3.11 and PyTorch 12.6. The model-training hyperparameters employed are listed in Table 3. From a hardware perspective, deep learning models were trained on an NVIDIA RTX 4060 GPU, whereas SHAP was calculated on an Intel(R) Core(TM) i9-10900K CPU. A critical design choice involved the training protocol for the MoE model. To focus the learning on the routing mechanism, the parameters of the expert networks were frozen, and only the DenseNet-based gating network was subjected to parameter updates.
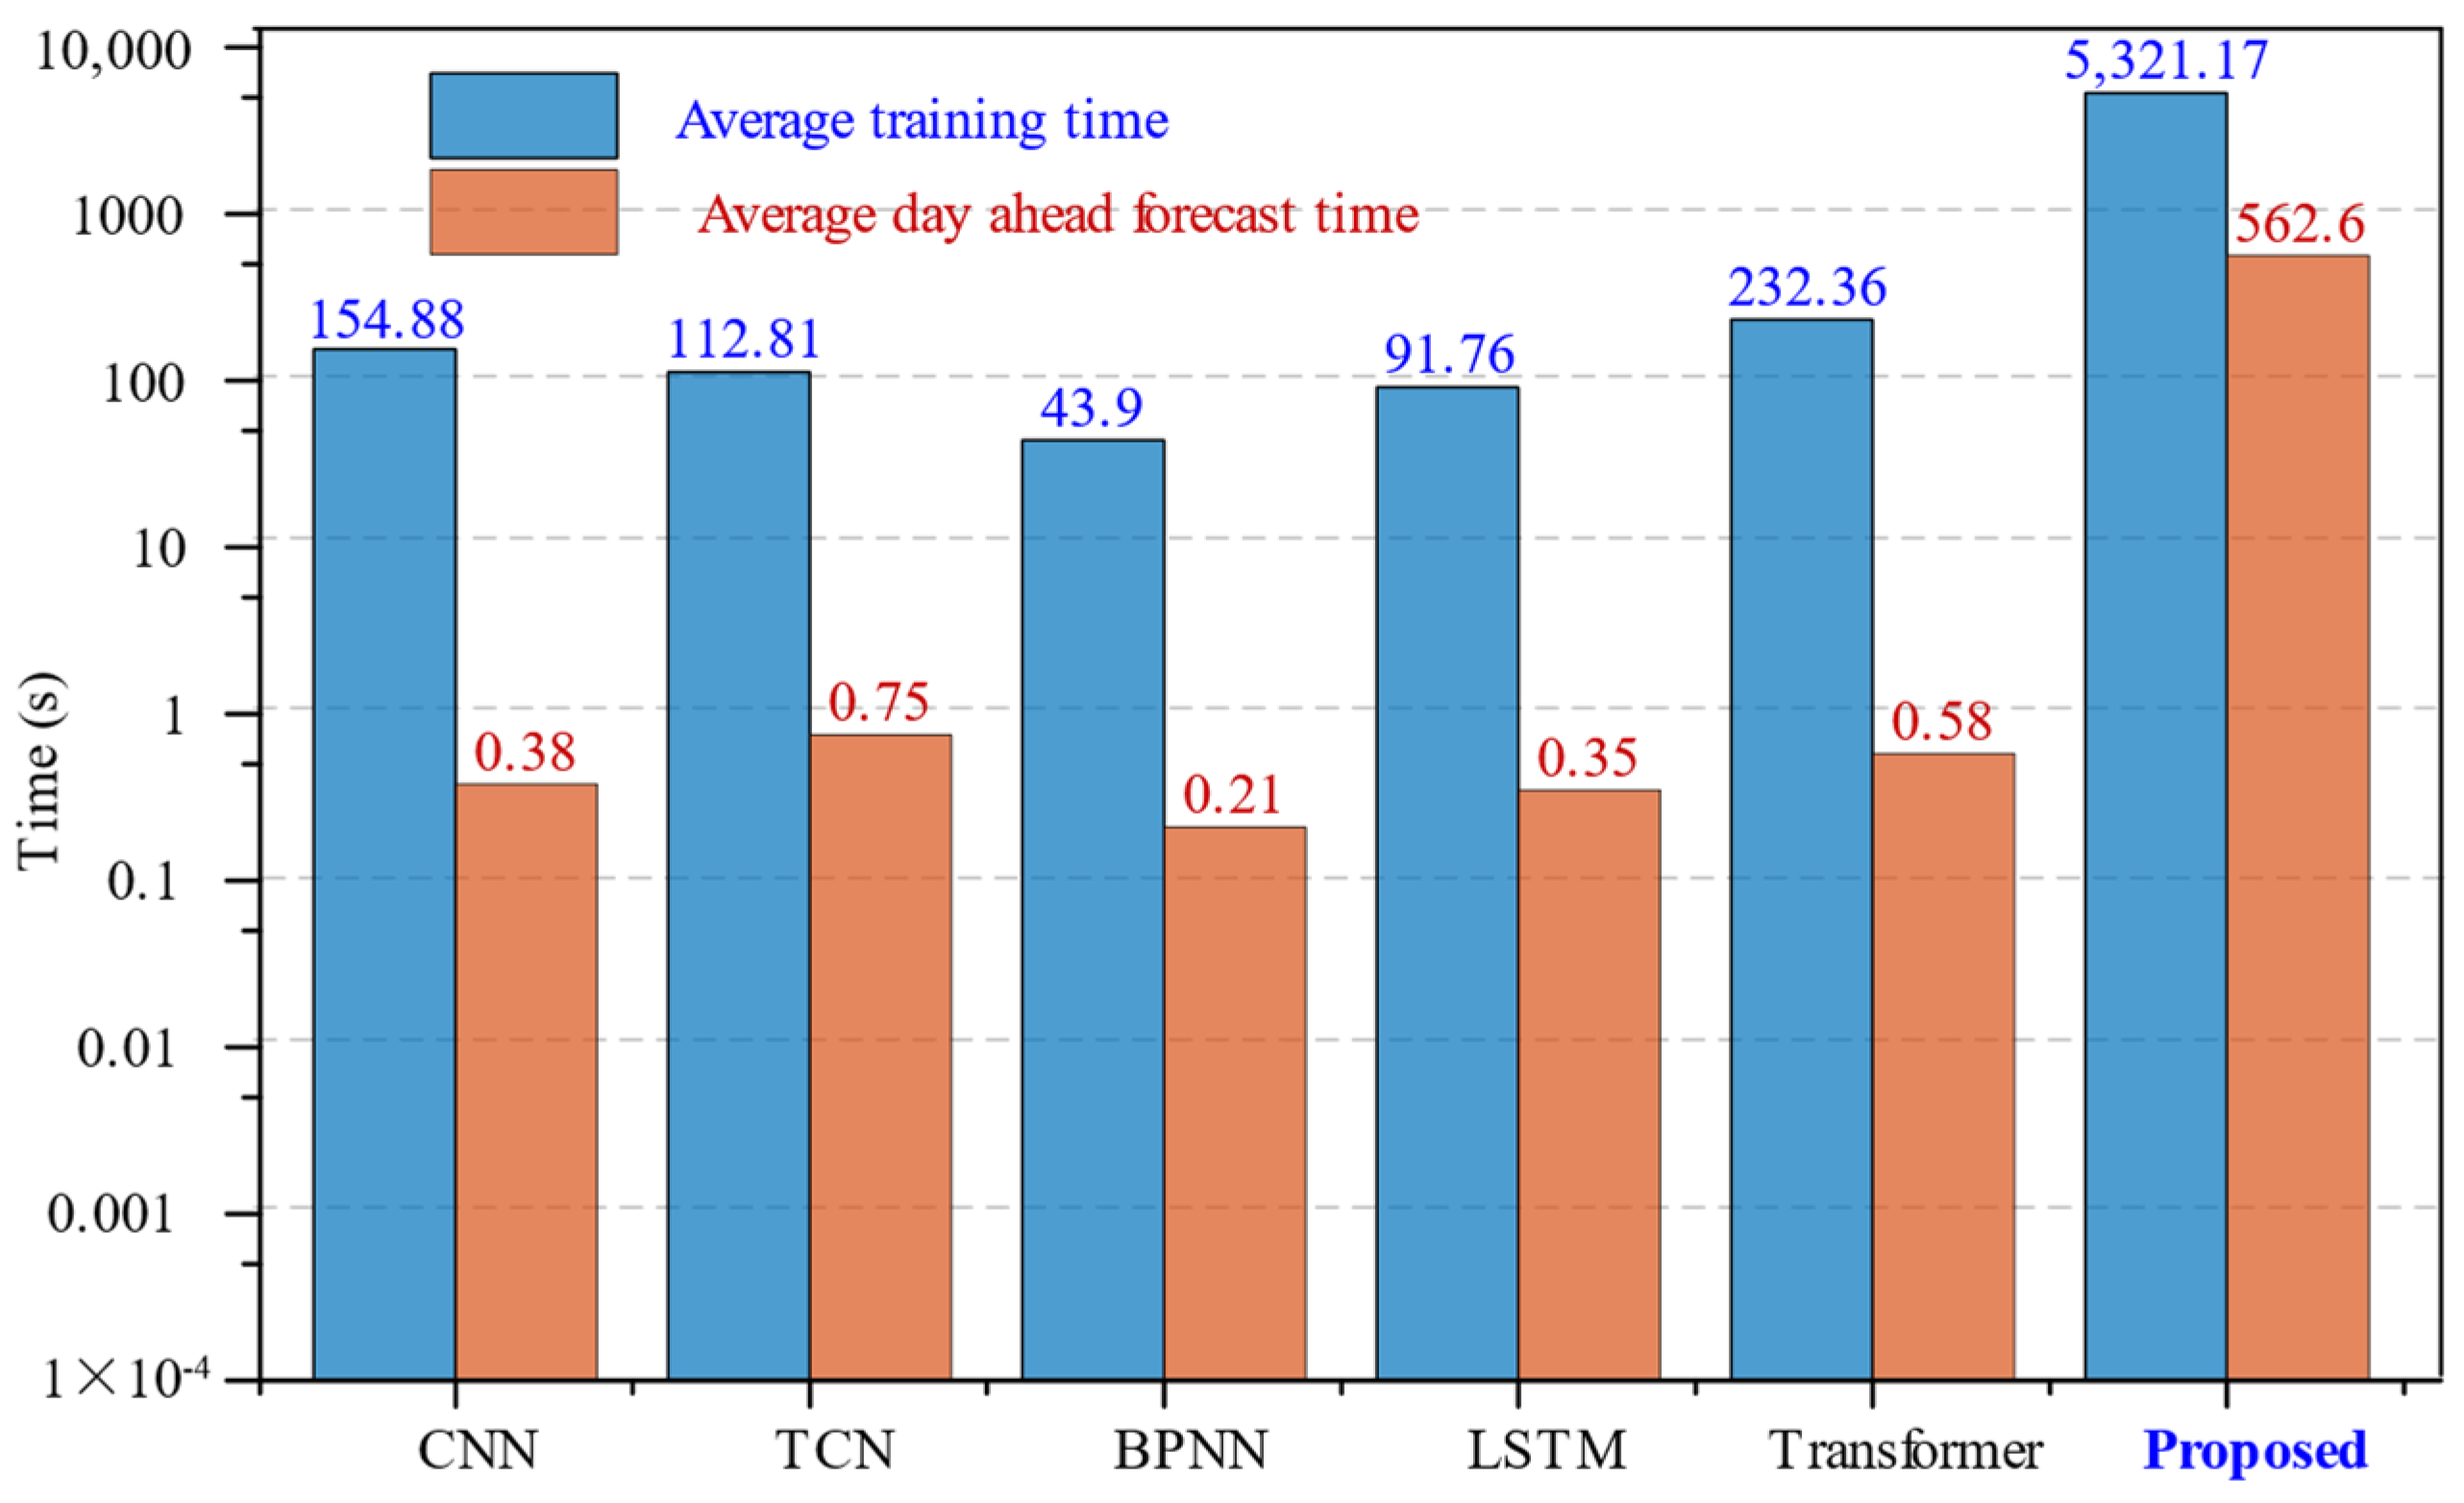
Figure 4 compares the average training and day-ahead prediction times of the proposed model with those of individual expert models using five-fold cross-validation. The proposed model requires longer training time than other models, primarily due to the computation of SHAP values for each expert model before gating network training. However, during each 24 h prediction cycle, the proposed model consistently completes predictions within 15 min, meeting the timeliness requirements of dispatch departments for day-ahead forecasting. The improved prediction accuracy achieved by the proposed method demonstrates its potential for supporting power grid dispatch planning.

3.3. Comparison Between the Proposed Method and the Baseline Expert Model Library

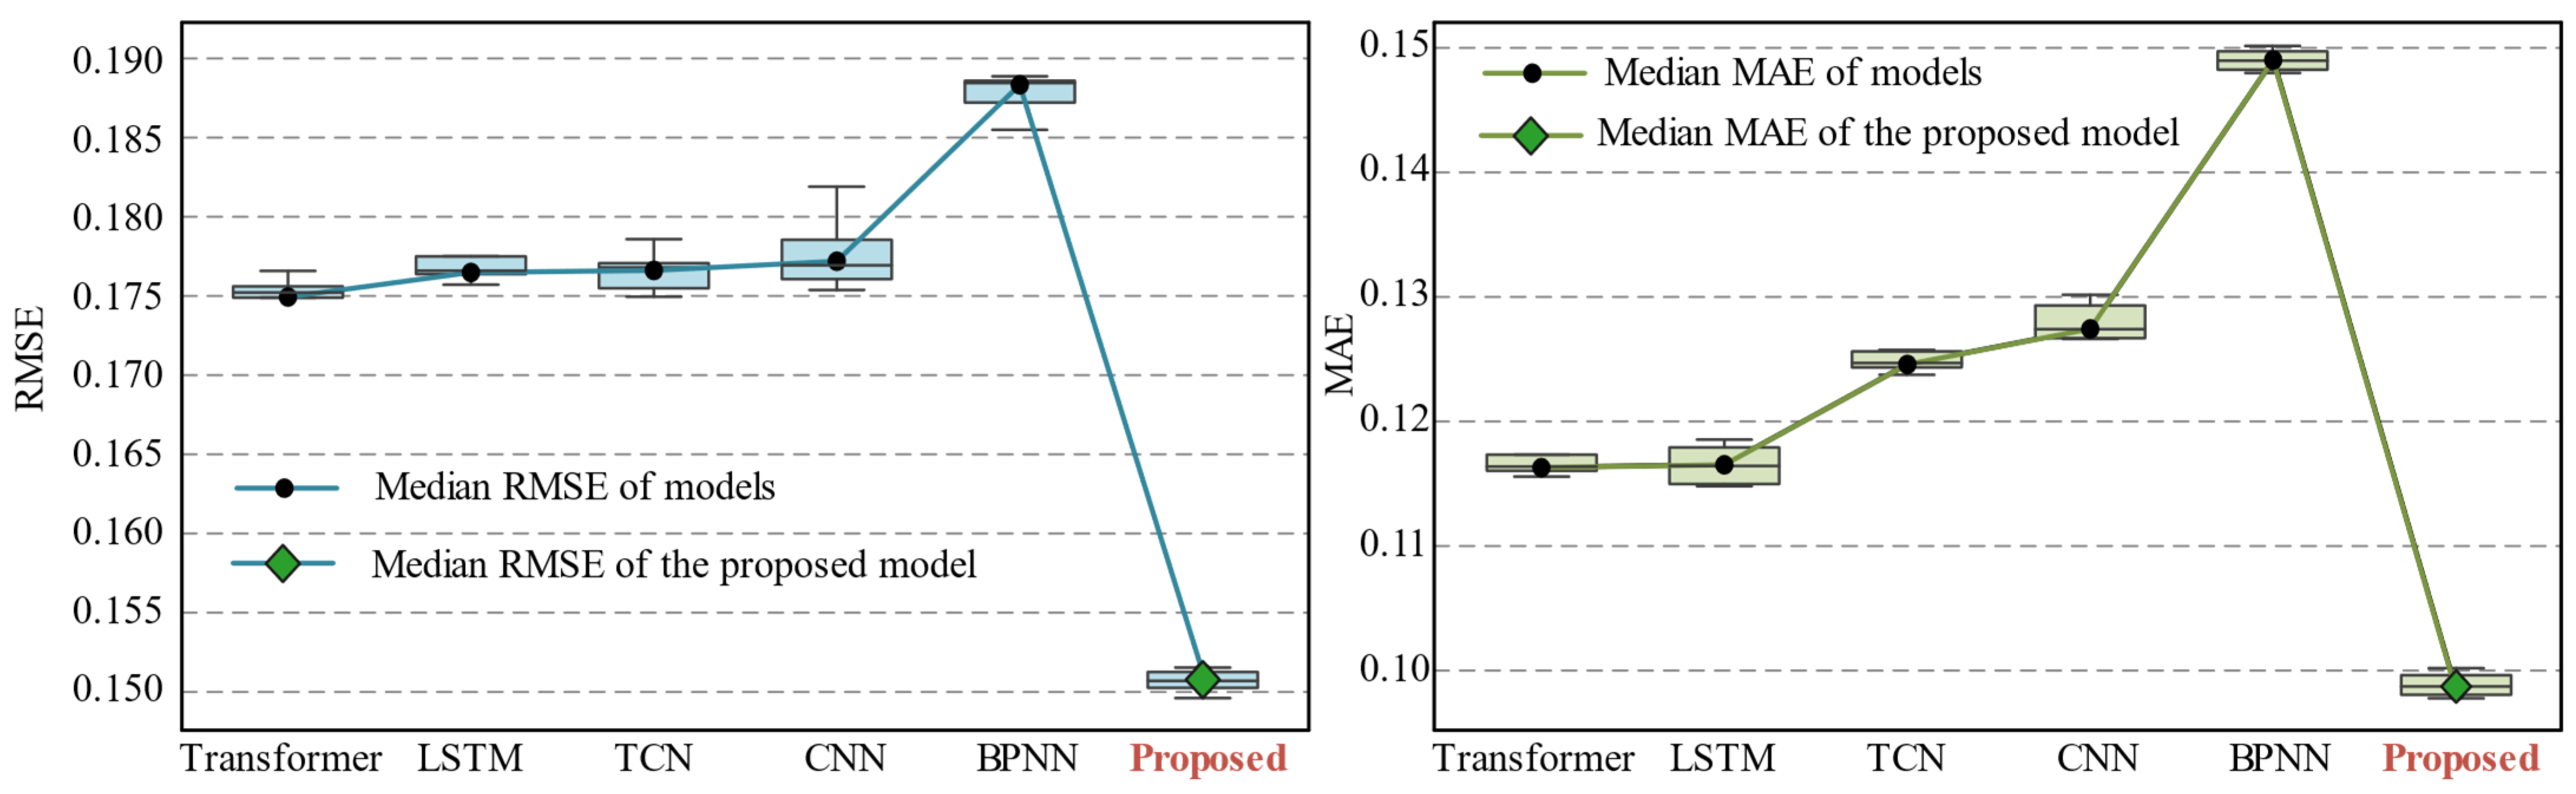
To verify the effectiveness of the proposed prediction approach, it was compared with individual prediction methods from the MoE expert library, including BPNN, CNN, LSTM, TCN, and Transformer. Figure 5 compares the error distribution of the wind power forecasts obtained with different predictive methods under five-fold cross-validation, and the median prediction errors of each method are listed in Table 4.
As presented in Table 4, the proposed SHAP-MoE prediction approach demonstrates superior performance compared with the individual prediction models, achieving reductions of 0.57–4.92% and 0.46–4.94% in the median RMSE and MAE, respectively. These results clearly indicate that the proposed method exhibits an enhanced predictive capability for wind power prediction tasks. Moreover, among the individual models, Transformer achieved the highest prediction accuracy, highlighting its strong capacity for capturing complex temporal dependencies in wind power data.

3.4. Comparison Between the MoE Model and Other Ensemble Learning Methods

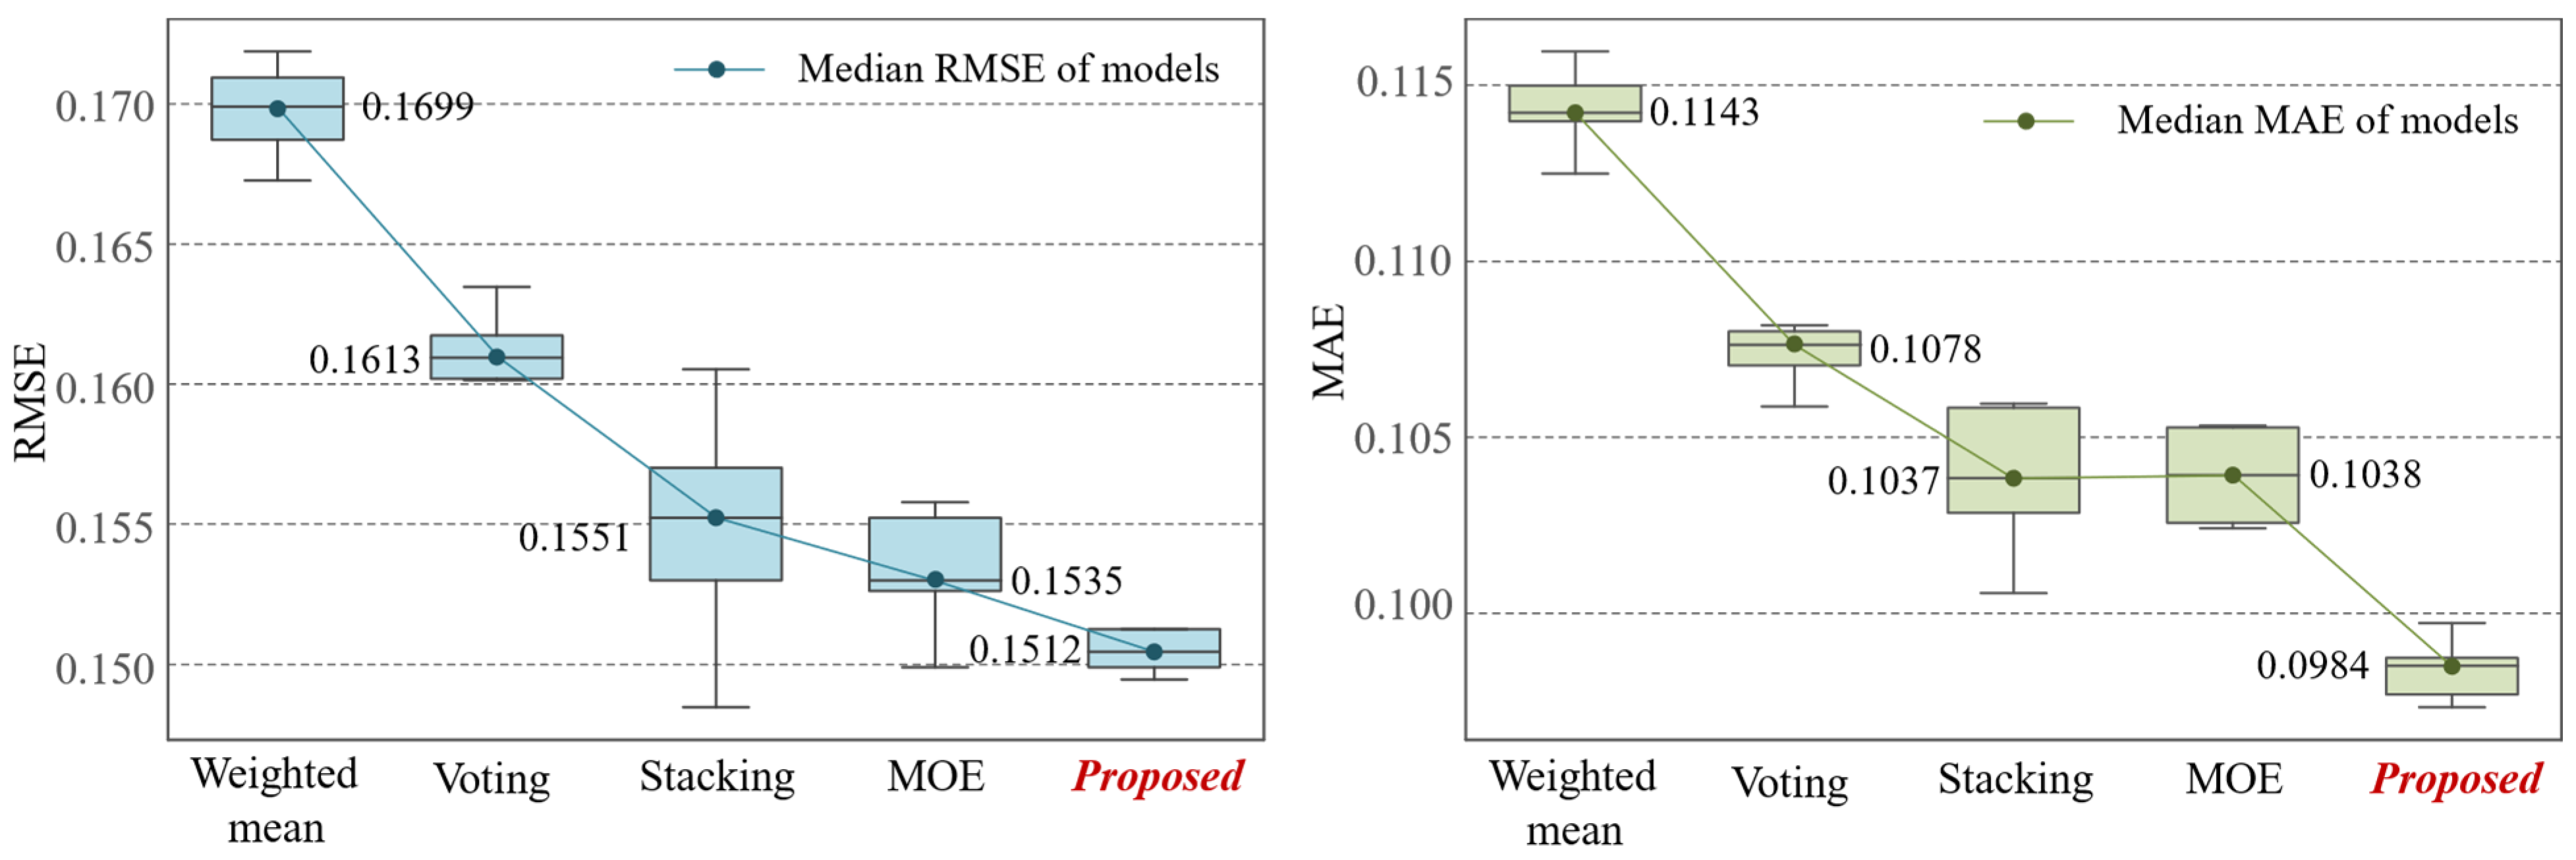
This section compares the proposed dynamic-weight ensemble prediction method with other ensemble prediction approaches, including simple averaging, voting, stacking, and MoE. Figure 6 compares the error distribution of wind power prediction using different models under five-fold cross-validation, and the median prediction errors of each method are listed in Table 5.
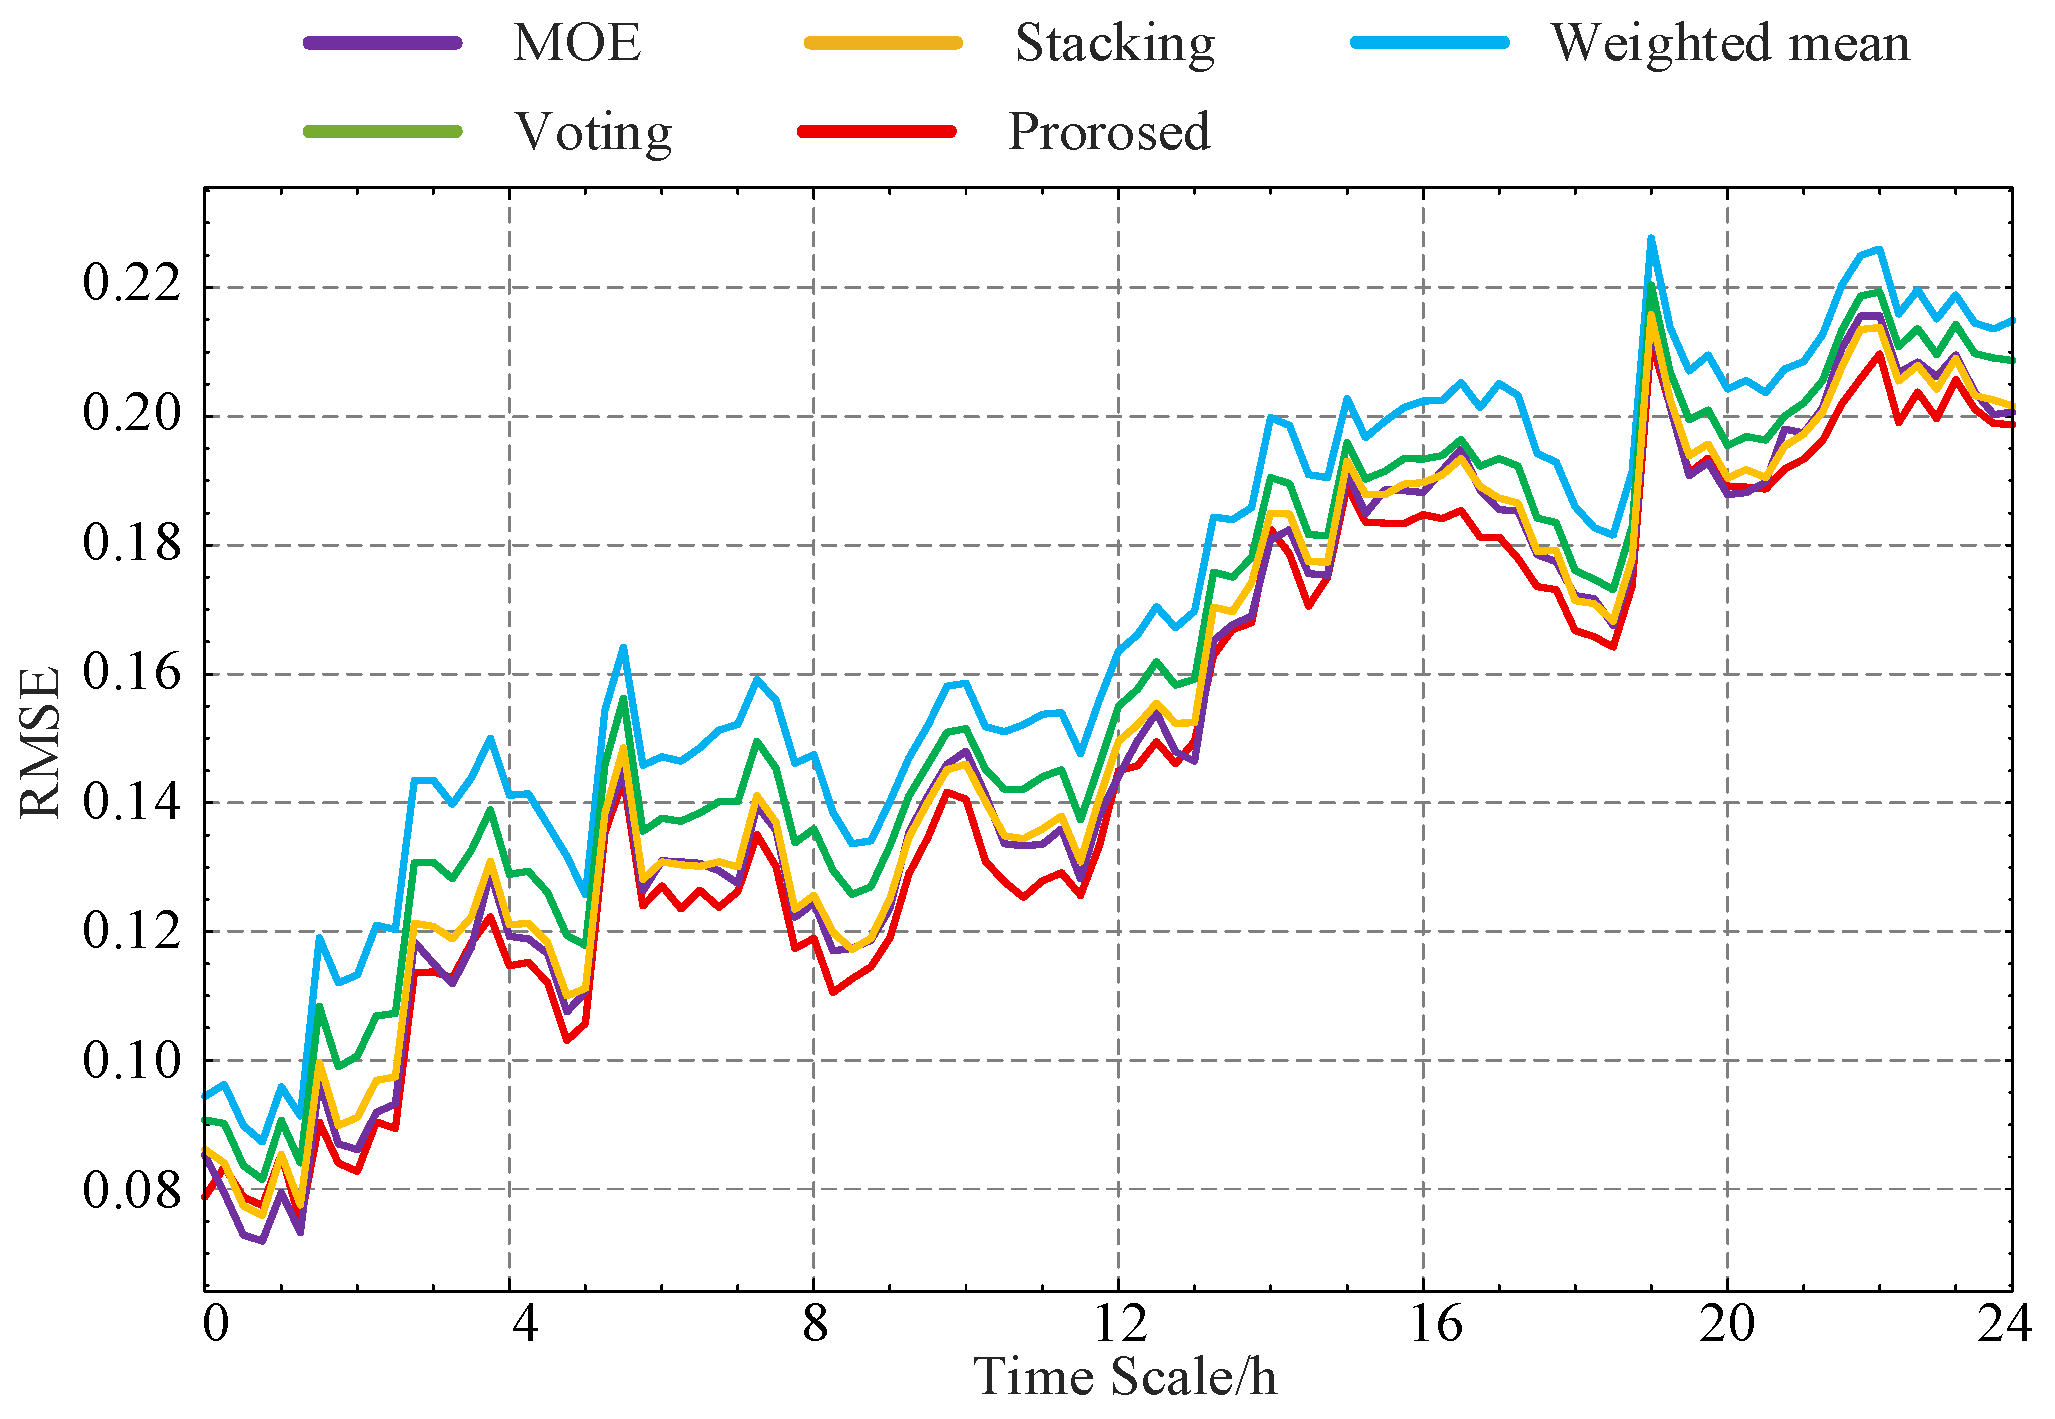
As summarized in Table 5, the proposed SHAP-MoE prediction method achieved a reduction in RMSE ranging from 0.23% to 1.87% and a reduction in MAE from 0.55% to 1.59% compared to traditional ensemble forecasting approaches, confirming its enhanced predictive accuracy. To further assess the robustness of the method, Figure 7 illustrates the time-varying characteristics of day-ahead prediction errors. The SHAP-MoE model consistently maintained the lowest RMSE across most time steps, outperforming both the standard MoE model and the weighted averaging method, which exhibited the highest error magnitude. Furthermore, all models displayed a fluctuating yet increasing error trend as the prediction horizon extended, highlighting the growing uncertainty associated with longer-term wind power forecasts.
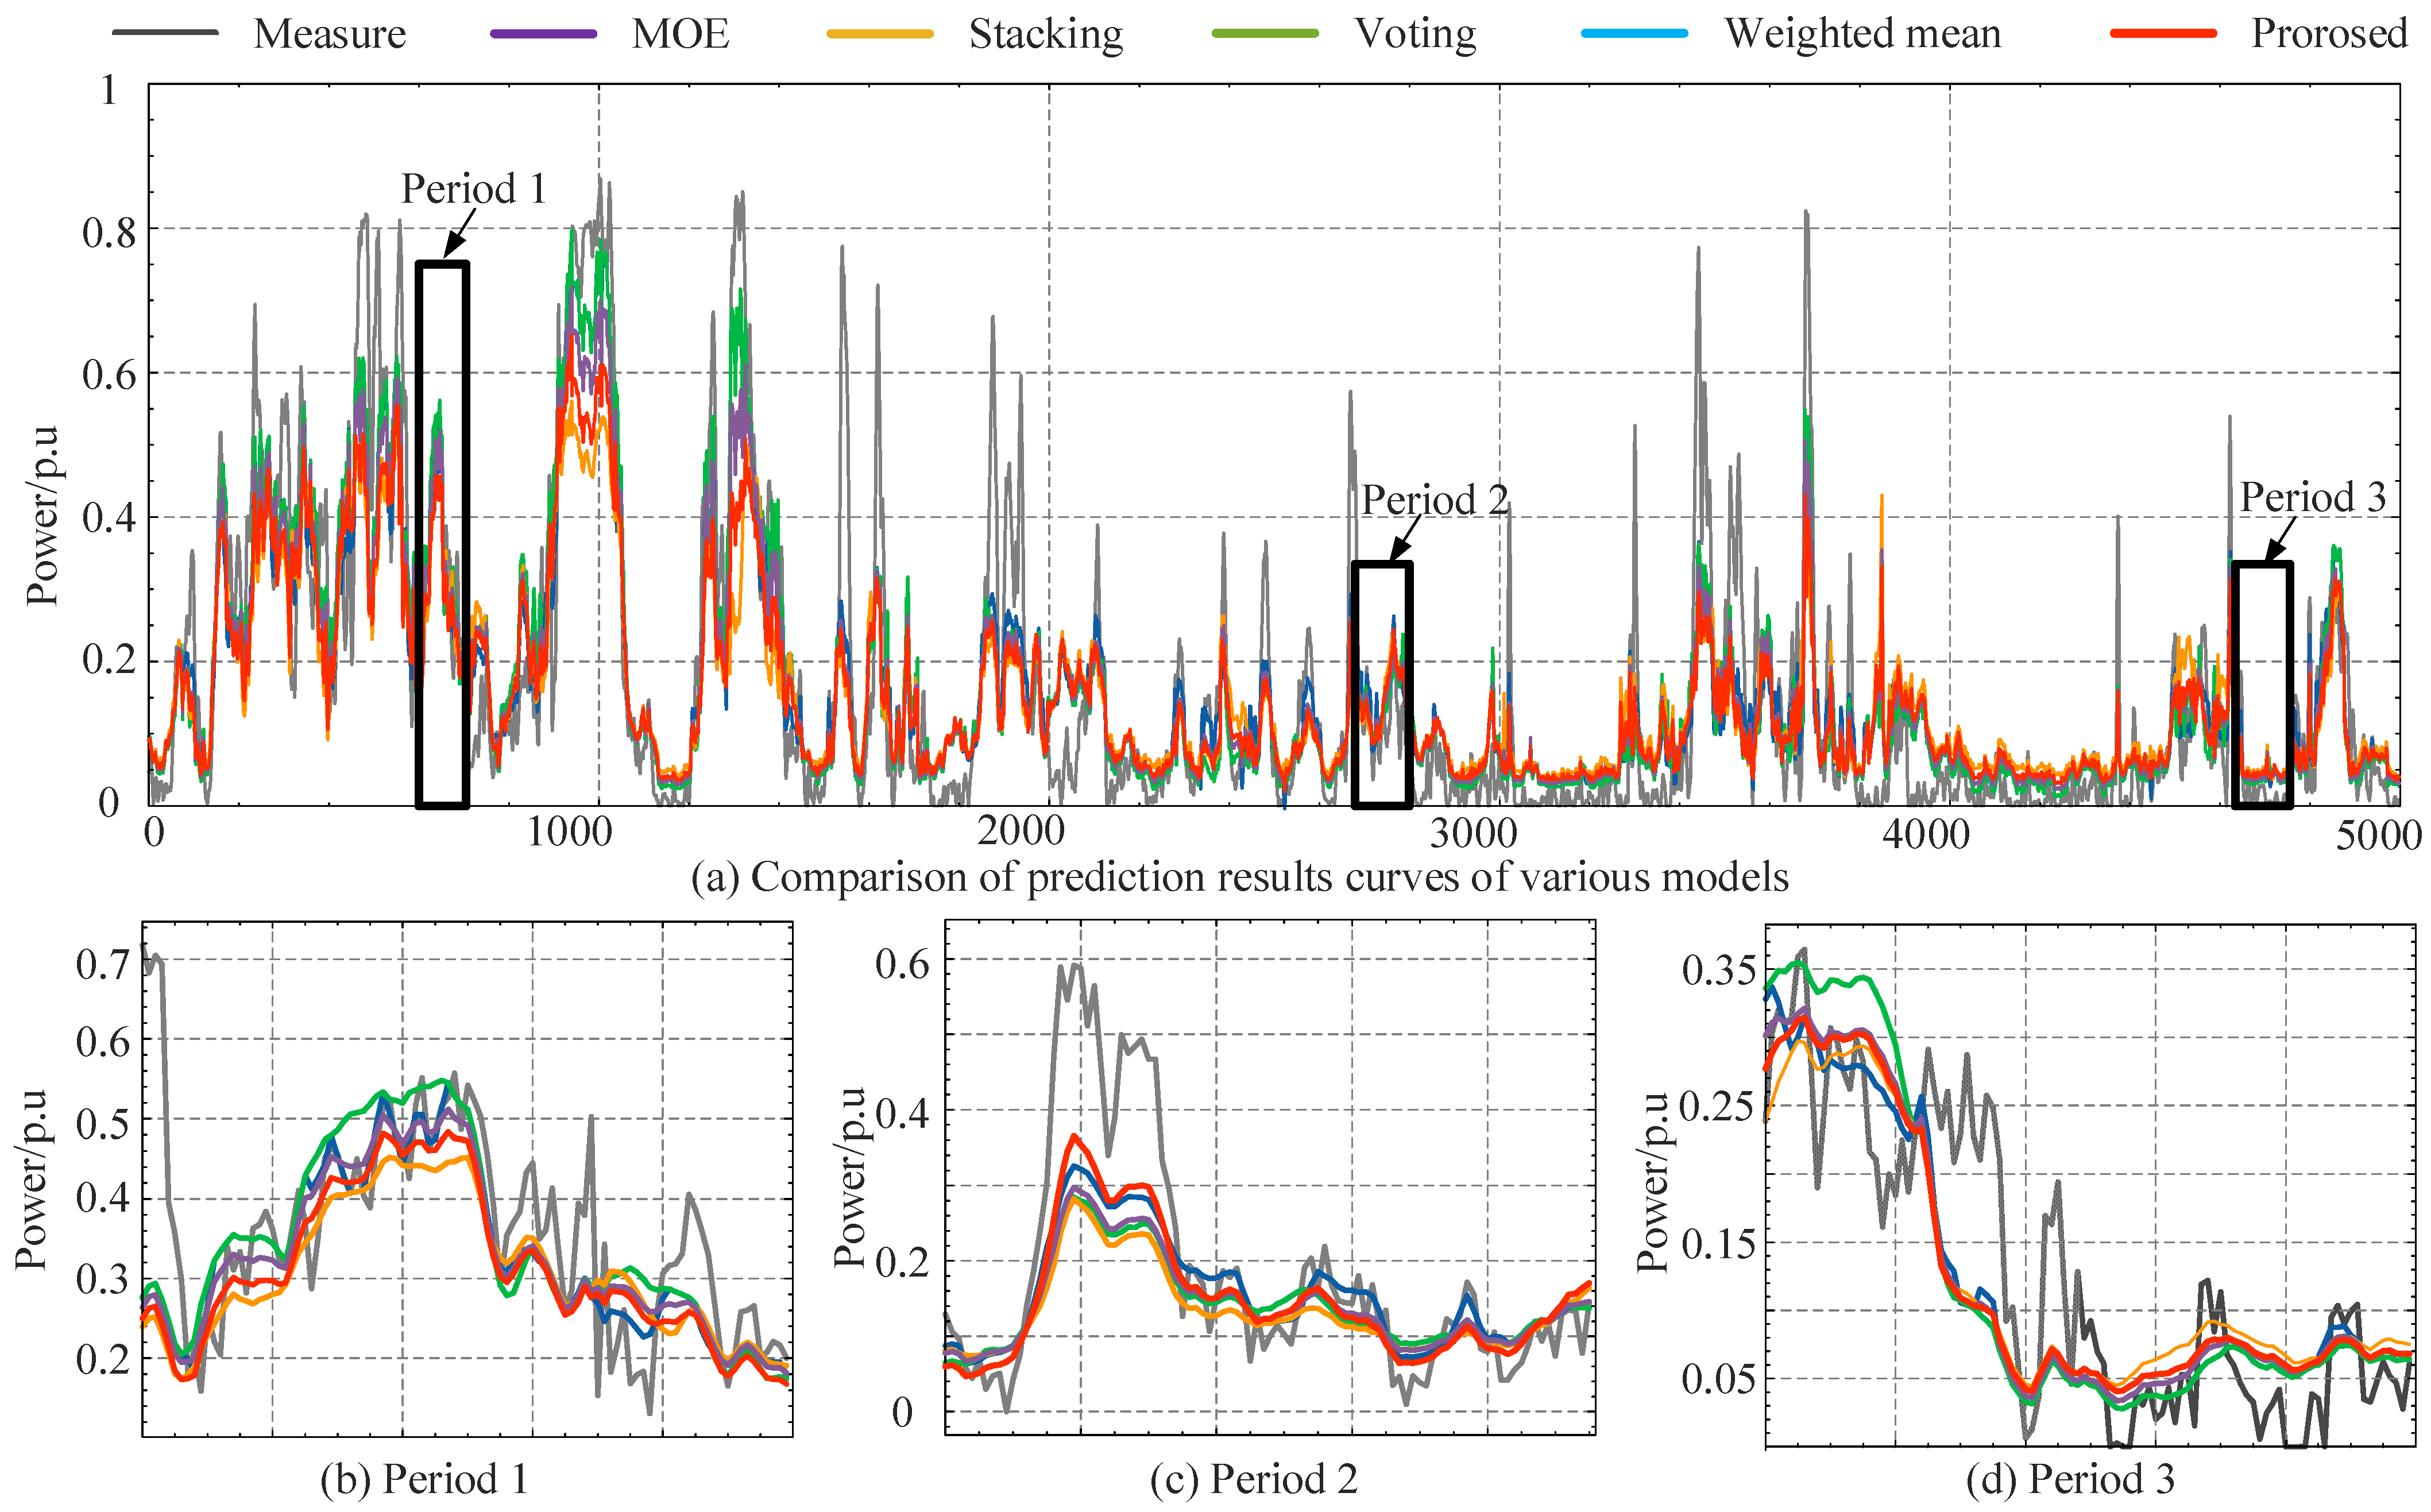
The predicted and actual wind power curves obtained from the proposed method and individual prediction models are presented in Figure 8. Figure 8b–d illustrates detailed comparisons between the proposed approach and other models.
Figure 8 demonstrates that the proposed SHAP-MoE prediction method more accurately captures the variation trends of actual wind power compared with the alternative models, thereby indicating its superior capability to model complex temporal dynamics.

3.5. Interpretability Analysis

Building on the prediction results, an interpretability analysis was conducted to gain deeper insights into the key factors influencing demand variations. This analysis quantifies the contribution of each feature to the model output, providing valuable guidance for further model optimization and practical operational scheduling.
(a)
Global Feature Importance
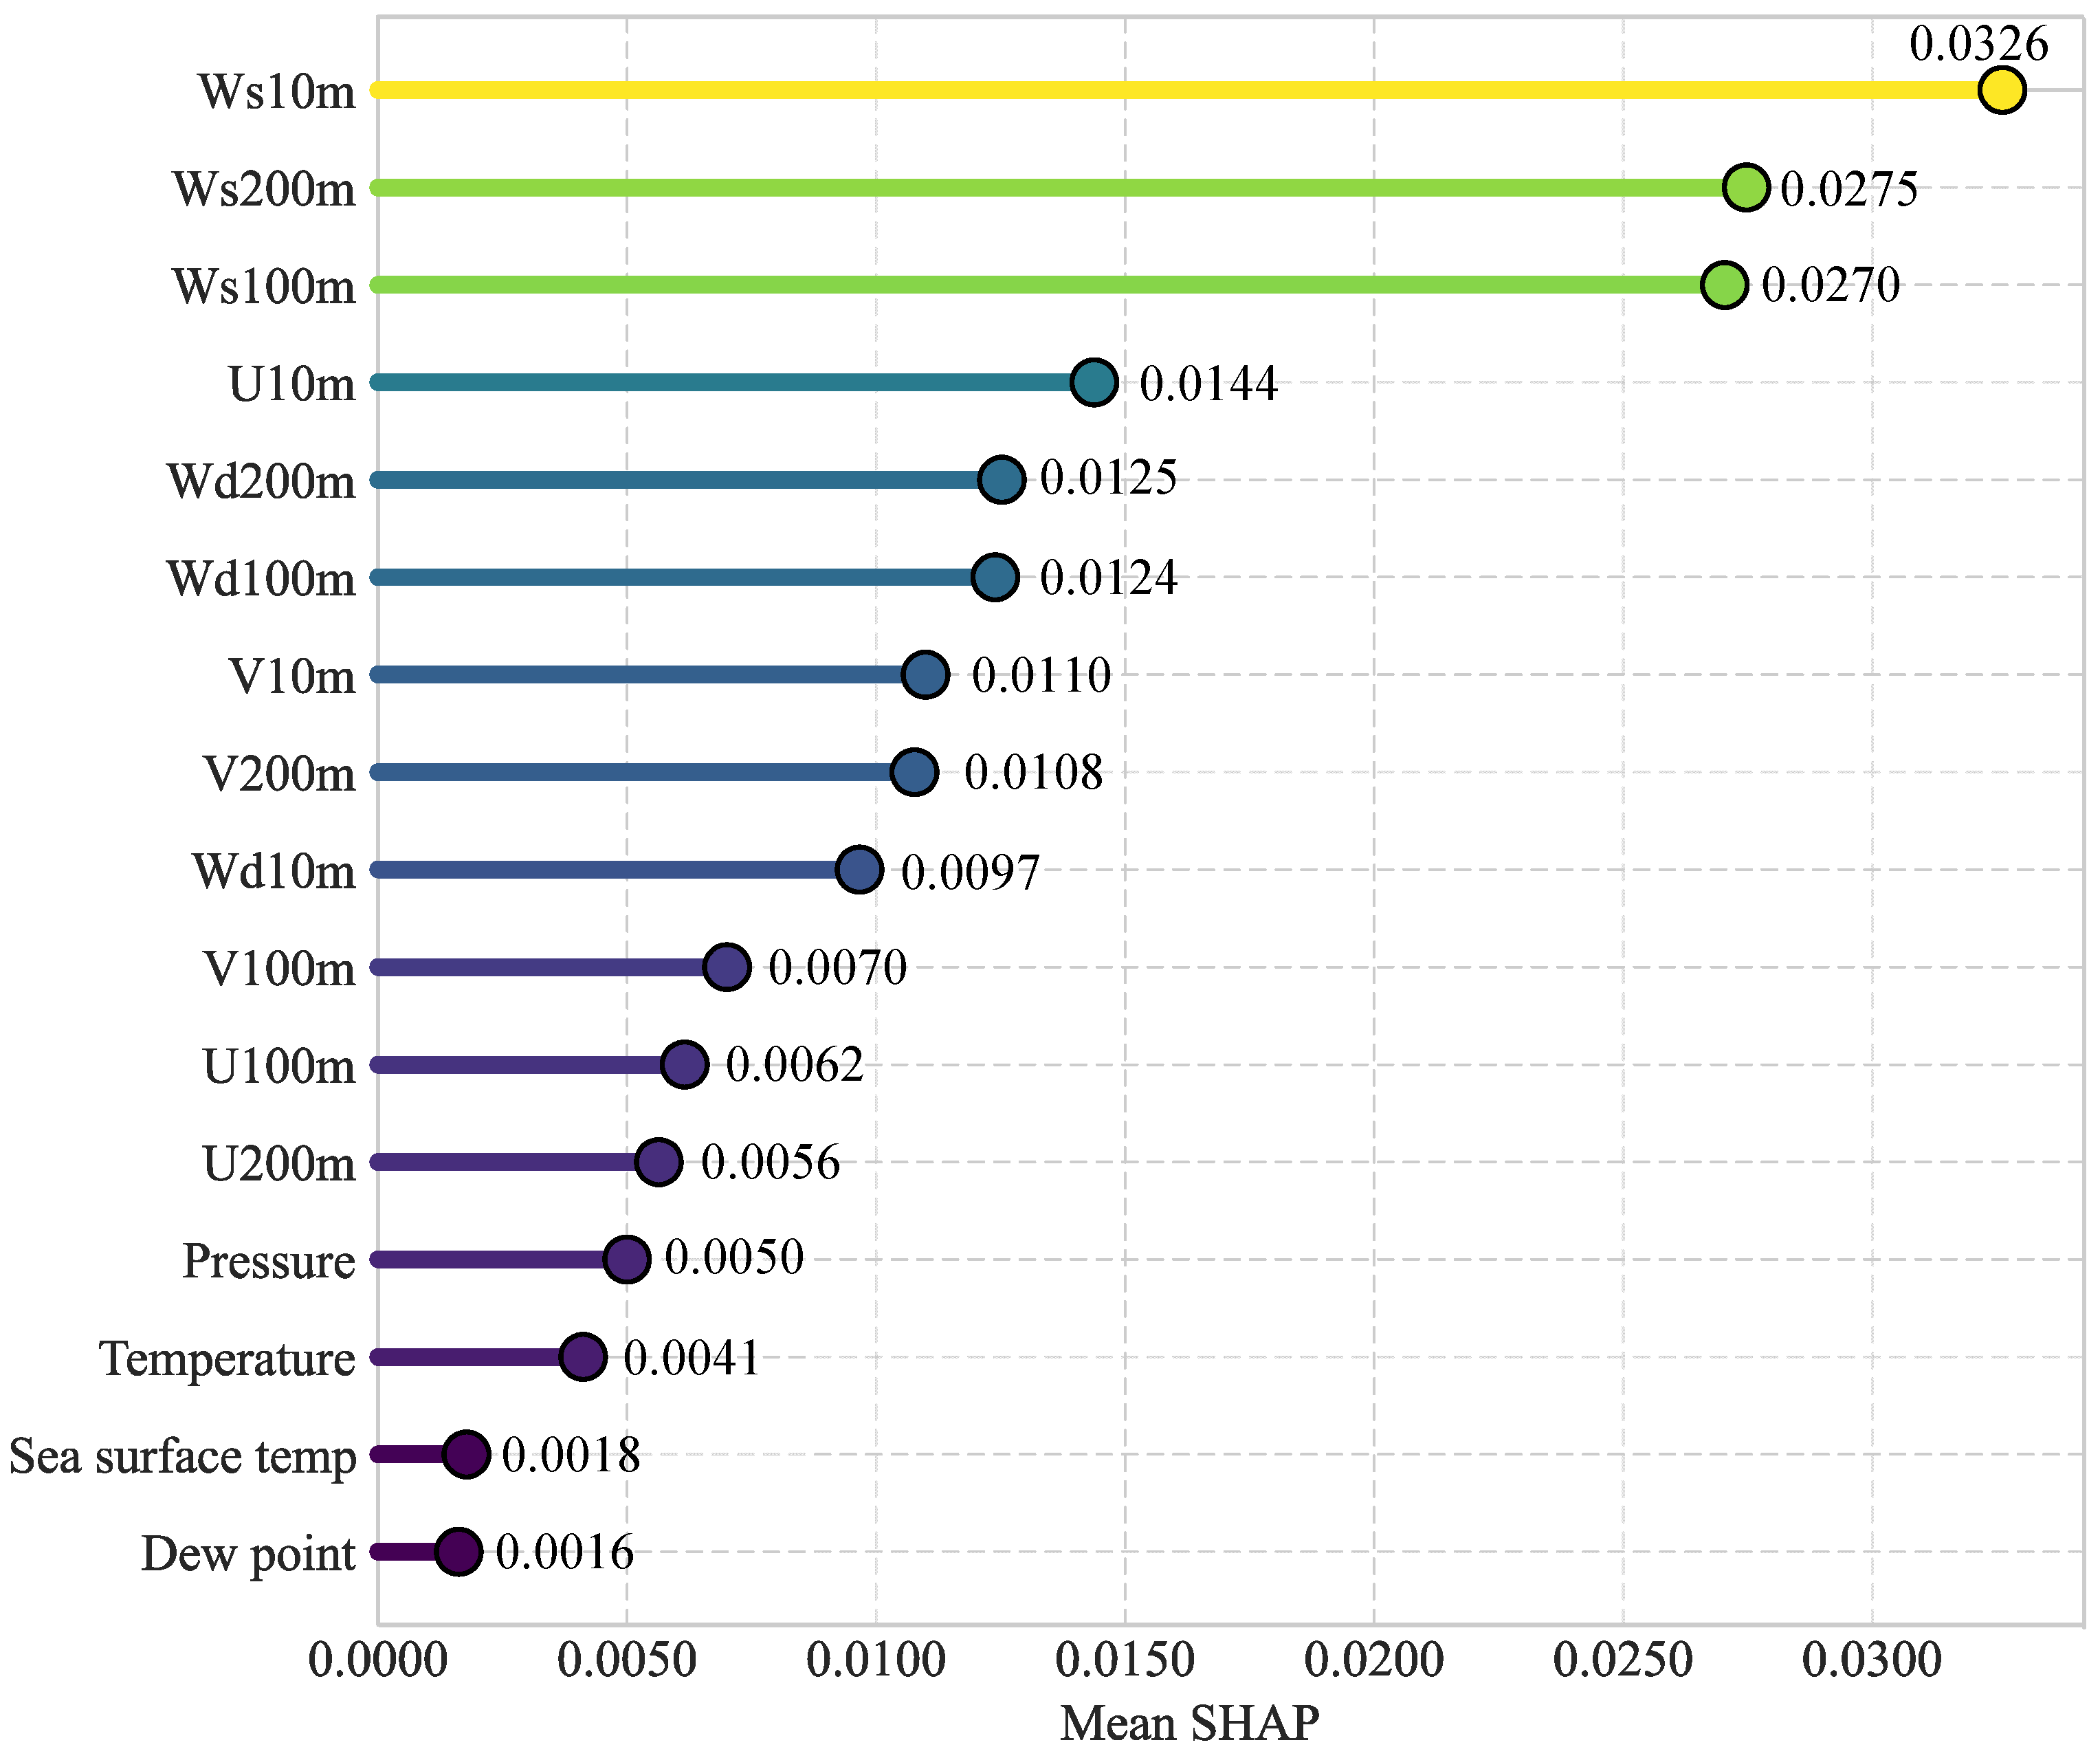
The global feature importance, quantified by the mean absolute SHAP value, measures the overall contribution of each input feature to the model predictions across the entire dataset. Figure 9 shows the average SHAP values of each feature across all MoE expert models.
As illustrated in Figure 9, which aggregates the results from all the evaluated models, wind speed features at various altitudes emerged as the most influential factors. Their mean absolute SHAP values exceeded 0.027, with the 10 m wind speed being the single most impactful predictor. A secondary tier of influential factors comprises wind direction and ultraviolet components of wind speed. In contrast, dew point temperature and sea-level temperature exhibited relatively lower importance. Air pressure and temperature features contribute indirectly to the power output, primarily through their modulatory effects on air density, which subsequently influences the wind energy density available for conversion.
(b)
Differences in Feature Importance Across Models
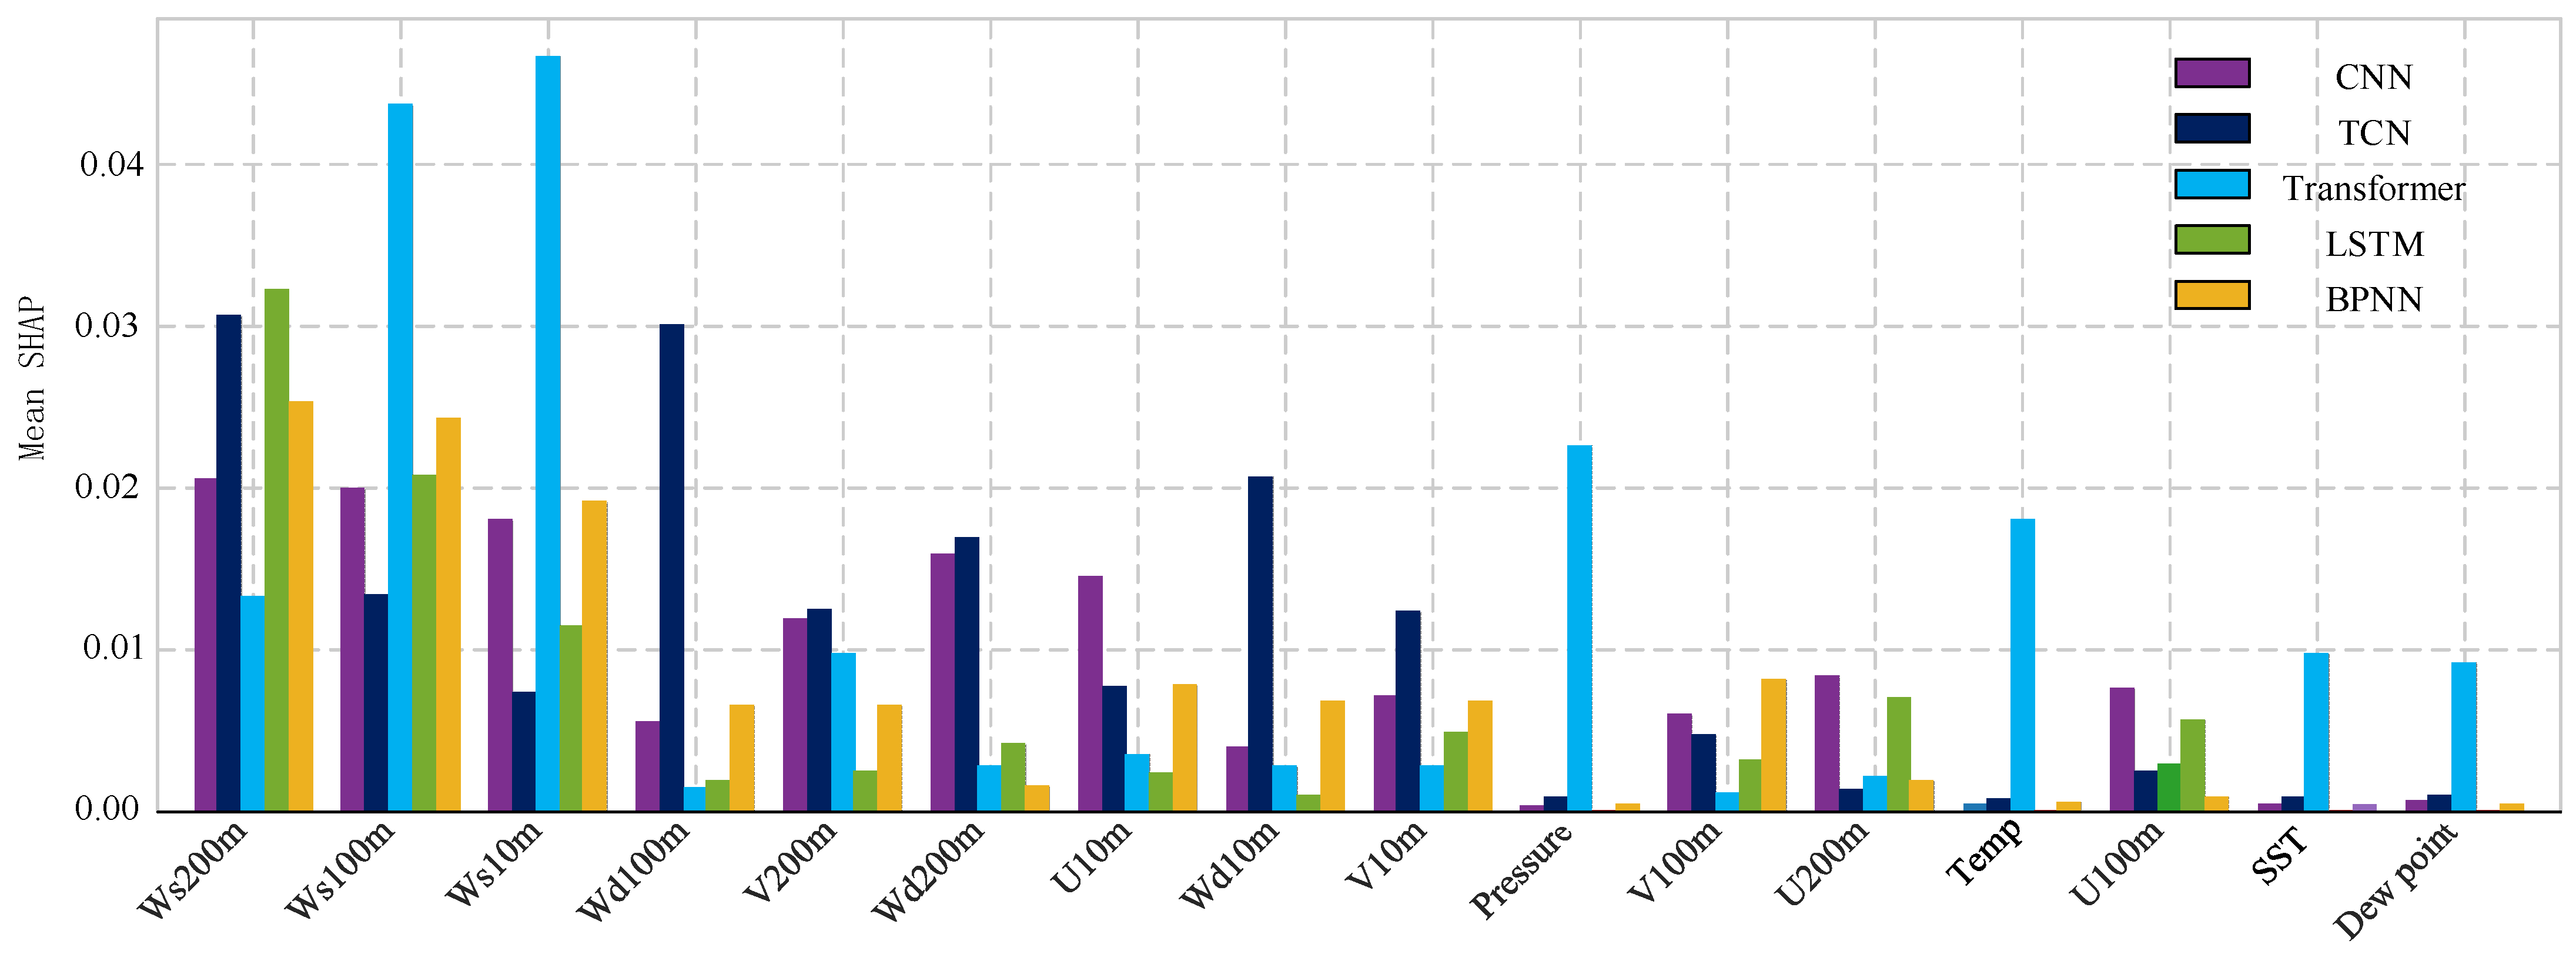
To investigate the nonlinear impact of each factor on the various models, local SHAP values were computed. The distribution of these SHAP values for each feature across the expert models is shown in Figure 10.
As illustrated in Figure 10, wind speed was identified as the most influential predictor across all evaluated models. The Transformer model exhibits high sensitivity to features, such as pressure and temperature, and its high accuracy suggests that it excels in capturing nonlinear relationships. In contrast, the TCN model demonstrates a more balanced focus on features, such as wind speed, wind direction, and U/V components. This structural characteristic facilitates a comprehensive fusion of multi-source meteorological information and avoids overreliance on any single feature type. Consequently, this enhances the model’s physical plausibility and robustness, leading to slightly superior performance in extreme scenarios.
(c)
Model Selection Analysis
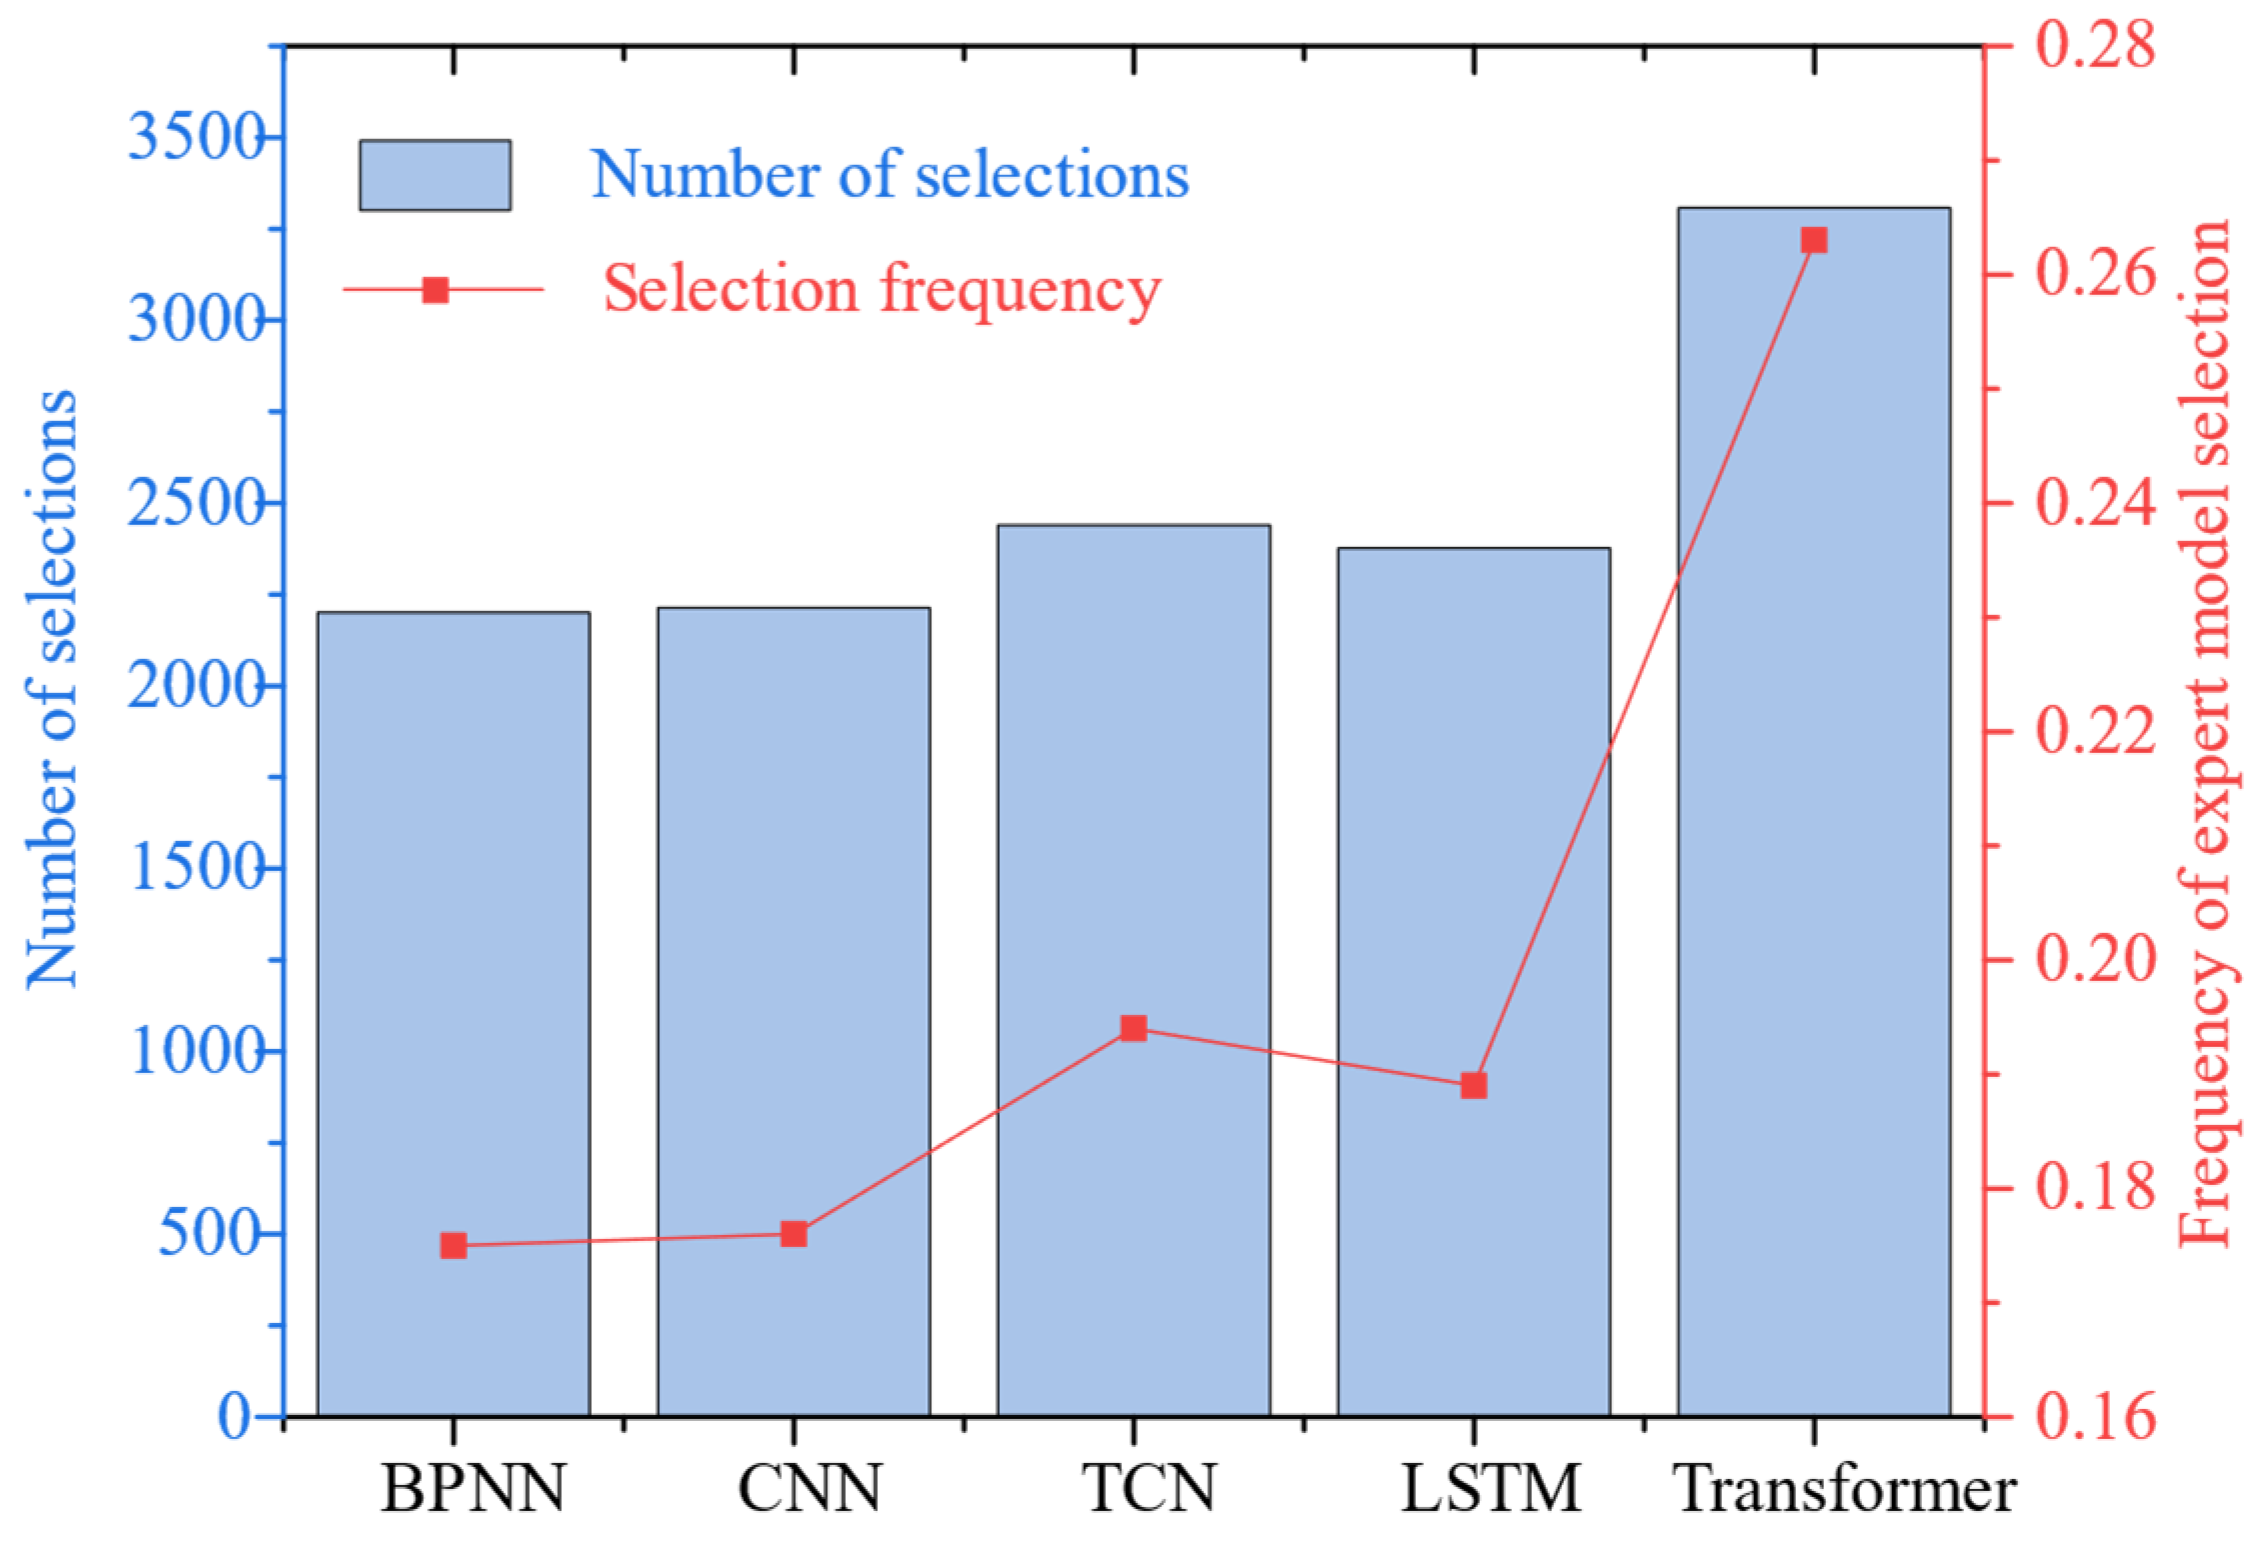
Figure 11 presents the selection frequency of each expert model within the gating network. As illustrated in Figure 11, no single expert dominates the gating network of the SHAP-MoE model; instead, weights are dynamically allocated according to the feature characteristics of each sample. The selection frequencies of the constituent models are generally comparable, with the Transformer model attaining the highest selection frequency of 26.3% owing to its superior predictive accuracy, whereas the remaining models display relatively balanced selection distributions. Although the overall accuracy of the TCN model is lower than that of LSTM, its more evenly distributed feature attention enables superior performance under extreme conditions, resulting in a higher selection frequency than that of LSTM. As detailed in Section 3.4, the scenario-based weighting mechanism employed in SHAP-MoE outperformed direct weighted averaging and other conventional ensemble strategies in terms of prediction accuracy.

4. Conclusions

This study addresses the insufficient predictive accuracy of conventional wind power prediction models by proposing a SHAP-based interpretable day-ahead wind power prediction framework. Based on the case study analyses, the following conclusions were drawn:
(1)
First, compared to five representative single-model architectures, BPNN, CNN, LSTM, TCN, and Transformer, the SHAP-MOE method achieved the lowest prediction error, with RMSE and MAE values of 0.15121 and 0.09836, respectively. Compared to the best-performing single model (transformer), the relative improvements in RMSE and MAE ranged from 0.57% to 4.92% and 0.46% to 4.94%, respectively. These results confirm that dynamically integrating multiple expert models based on input features can produce more accurate and robust predictions than relying on a single architecture.
(2)
The method outperformed widely used ensemble techniques, including weighted averaging, voting, stacking, and standard MOE. Specifically, SHAP-MOE achieved RMSE reductions of 0.23–1.87% and MAE reductions of 0.55–1.59% relative to these baselines. Temporal error analysis further revealed that SHAP-MOE consistently maintained the lowest RMSE over the entire prediction horizon, highlighting its robustness and adaptability in handling the increasing uncertainty associated with longer prediction lead times.
(3)
In addition to the prediction accuracy, the SHAP ensemble also achieved model interpretability. Global feature importance analysis shows that wind speed at different heights, particularly at 10 m, is the primary factor affecting power output, whereas wind direction plays a secondary but significant role. Interpretability analysis also revealed model-specific sensitivities: Transformer demonstrated a stronger ability to capture complex nonlinear interactions between meteorological variables (such as pressure and temperature), partially explaining its superior performance over the base expert model. Meanwhile, the TCN demonstrated more balanced attention in the input features. Although TCN’s overall accuracy is lower than that of the LSTM model, it still exhibited a stronger performance under extreme conditions. Model analysis revealed that expert selection in SHAP-MOE is not dominated by any single model; instead, the mechanism adaptively assigns weights based on the shape-derived relevance of the input features for each prediction instance. During testing, the proposed method selected Transformer more frequently (26.3%) due to their high baseline accuracy, whereas TCN was preferred over LSTM owing to superior robustness under extreme conditions. Unlike the proposed method, static or accuracy-only weighting schemes overlook such nuanced, scenario-dependent model advantages.
In summary, the SHAP-MOE framework effectively improved the accuracy of day-ahead wind power prediction. Its interpretability supports model optimization and enhances the model’s reliability in actual power system operation. Future work will extend this approach to multistep prediction and incorporate the spatial correlation of wind farms.

Author Contributions

Conceptualization, L.L.; Methodology, G.Q. and L.L.; Validation, G.Q.; Investigation, L.L.; Resources, H.Z., X.C. and Z.Z.; Writing—original draft, H.Z., G.Q. and J.S.; Writing—& editing, H.Z., X.C., Z.Z. and J.S.; Project administration, H.Z., X.C. and Z.Z.; Funding acquisition, H.Z., X.C. and Z.Z. All authors have read and agreed to the published version of the manuscript.

Funding

This research was funded by the Scientific Research Project of China Three Gorges Corporation (Contract Number: STRI-HT-202403024).

Data Availability Statement

The data that support the findings of this study are not available due to commercial restrictions, including confidentiality agreements with industry partners.

Conflicts of Interest

Authors Hao Zhang, Xiangyan Chen and Ziliang Zhang were employed by the company Science and Technology Research Institute, China Three Gorges Corporation. The remaining authors declare that the research was conducted in the absence of any commercial or financial relationships that could be construed as a potential conflict of interest.

References

  1. Nguyen, N.; Almasabi, S.; Mitra, J. Impact of Correlation Between Wind Speed and Turbine Availability on Wind Farm Reliability. IEEE Trans. Ind. Appl. 2019, 55, 2392–2400. [Google Scholar] [CrossRef]
  2. Jimmy, G.; McDonald, A.; Carroll, J. Energy Yield and Operations and Maintenance Costs of Parallel Wind Turbine Powertrains. IEEE Trans. Sustain. Energy 2020, 11, 674–681. [Google Scholar] [CrossRef] [Scilit]
  3. Liu, J.; Zang, H.; Ding, T.; Cheng, L.; Wei, Z.; Sun, G. A Principle-Constrained Wind Field Image Generation Framework for Short-Term Wind power prediction. IEEE Trans. Power Syst. 2025, 40, 1790–1801. [Google Scholar] [CrossRef] [Scilit]
  4. Yang, M.; Huang, Y.; Wang, Z.; Wang, B.; Su, X. A Framework of Day-Ahead Wind Supply Power Forecasting by Risk Scenario Perception. IEEE Trans. Sustain. Energy 2025, 16, 1659–1672. [Google Scholar] [CrossRef] [Scilit]
  5. Zhang, H.; Liu, Y.; Yan, J.; Han, S.; Li, L.; Long, Q. Improved Deep Mixture Density Network for Regional Wind Power Probabilistic Forecasting. IEEE Trans. Power Syst. 2020, 35, 2549–2560. [Google Scholar] [CrossRef] [Scilit]
  6. Song, W.; Yan, J.; Han, S.; Zhang, N.; Liu, S.; Ge, C.; Liu, Y. A Self-Supervised Pre-Learning Method for Low Wind power prediction. IEEE Trans. Sustain. Energy 2025, 16, 1723–1736. [Google Scholar] [CrossRef] [Scilit]
  7. Lin, S.; Wang, S.; Xu, X.; Li, R.; Shi, P. GAOformer: An adaptive spatiotemporal feature fusion transformer utilizing GAT and optimizable graph matrixes for offshore wind speed prediction. Energy 2024, 292, 130404. [Google Scholar] [CrossRef] [Scilit]
  8. Wu, Y.-K.; Huang, C.-L.; Wu, S.-H.; Hong, J.-S.; Chang, H.-L. Deterministic and Probabilistic Wind Power Forecasts by Considering Various Atmospheric Models and Feature Engineering Approaches. IEEE Trans. Ind. Appl. 2023, 59, 192–206. [Google Scholar] [CrossRef] [Scilit]
  9. Lu, P.; Ye, L.; Zhao, Y.; Dai, B.; Pei, M.; Li, Z. Feature extraction of meteorological factors for wind power prediction based on variable weight combined method. Renew. Energy 2021, 179, 1925–1939. [Google Scholar] [CrossRef] [Scilit]
  10. Feng, C.; Cui, M.; Hodge, B.-M.; Zhang, J. A data-driven multi-model methodology with deep feature selection for short-term wind forecasting. Appl. Energy 2017, 190, 1245–1257. [Google Scholar] [CrossRef] [Scilit]
  11. Cao, W.; Wang, G.; Liang, X.; Hu, Z. A STAM-LSTM model for wind power prediction with feature selection. Energy 2024, 296, 131030. [Google Scholar] [CrossRef] [Scilit]
  12. Im, S.; Kim, K.; Lee, G.; Lim, H.-J. Development of a Weighted Average Ensemble Model for Predicting Officially Assessed Land Prices Using Grid Map Data and SHAP. IEEE Access 2025, 13, 96251–96260. [Google Scholar] [CrossRef] [Scilit]
  13. Kim, K.J.; Park, J.H.; Min, D.H.; Min, S.G. Data-Driven Optimization of Aspect Ratio in Permanent Magnet Machines Using Deep Learning and SHAP Analysis. IEEE Access 2025, 13, 122164–122174. [Google Scholar] [CrossRef] [Scilit]
  14. Zhao, Z.; Wang, M.; Wei, J.; Cen, X.; Du, S.; Wu, Z.; Liu, H.; Wang, W. Interpretable Machine Learning for Multi-Energy Supply Station Revenue Forecasting: A SHAP-Driven Framework to Accelerate Urban Carbon Neutrality. Energies 2025, 18, 1624. [Google Scholar] [CrossRef] [Scilit]
  15. Suárez-Cetrulo, A.L.; Burnham-King, L.; Haughton, D.; Carbajo, R.S. Wind power prediction using ensemble learning for day-ahead energy trading. Renew. Energy 2022, 191, 685–698. [Google Scholar] [CrossRef] [Scilit]
  16. Ye, L.; Dai, B.; Li, Z.; Pei, M.; Zhao, Y.; Lu, P. An ensemble method for short-term wind power prediction considering error correction strategy. Appl. Energy 2022, 322, 119475. [Google Scholar] [CrossRef] [Scilit]
  17. Yang, Z.; Peng, X.; Song, J.; Duan, R.; Jiang, Y.; Liu, S. Short-Term Wind Power Prediction Based on Multi-Parameters Similarity Wind Process Matching and Weighed-Voting-Based Deep Learning Model Selection. IEEE Trans. Power Syst. 2024, 39, 2129–2142. [Google Scholar] [CrossRef] [Scilit]
  18. Liang, Z.; Chung, C.; Yang, H.; Liang, J.; Zhang, W.; Dong, H.; Zhu, J. A Heterogeneous Multiple-Experts Approach to Low-Frequency Nonintrusive Load Monitoring. IEEE Trans. Smart Grid 2025, 17, 746–765. [Google Scholar] [CrossRef] [Scilit]
  19. Chang, Y.; Yang, H.; Chen, Y.; Zhou, M.; Yang, H.; Wang, Y.; Zhang, Y. A Hybrid Model for Long-Term Wind power prediction Utilizing NWP Subsequence Correction and Multi-Scale Deep Learning Regression Methods. IEEE Trans. Sustain. Energy 2024, 15, 263–275. [Google Scholar] [CrossRef] [Scilit]
  20. Qin, G.; Peng, X.; Yang, Z. Regional Short-Term Wind Power Prediction Based on CEEMDAN-FTC Feature Mapping and EC-TCN-BiLSTM Deep Learning. Wind Energy 2025, 28, e70025. [Google Scholar] [CrossRef] [Scilit]
  21. Cai, W.; Jiang, J.; Wang, F.; Tang, J.; Kim, S.; Huang, J. A Survey on Mixture of Experts in Large Language Models. IEEE Trans. Knowl. Data Eng. 2025, 37, 3896–3915. [Google Scholar] [CrossRef] [Scilit]
  22. Cheng, M.; Zhang, Y.; Liu, C.; Lai, X.; Lu, S.; Zhu, S. PV Mid- and Long-Term Power Prediction Method Based on SDCN-TiDE and Power Reconstruction. In Proceedings of the 2025 10th Asia Conference on Power and Electrical Engineering (ACPEE), Beijing, China, 15–19 April 2025; pp. 263–267. [Google Scholar]
Figure 1. Overall framework of dynamic explainable prediction method based on SHAP analysis and Mixture of Experts.
Energies 19 00124 g001
Figure 2. Mixture of Experts gating model based on SHAP knowledge guidance.
Energies 19 00124 g002
Figure 3. Prediction dynamic interpretability.
Energies 19 00124 g003
Figure 4. Comparison of average training time and average day-ahead prediction time among models in 5-fold cross validation.
Energies 19 00124 g004
Figure 5. Comparison of prediction error among the proposed method and single-prediction methods in 5-fold cross validation.
Energies 19 00124 g005
Figure 6. Comparison of prediction errors between different ensemble prediction methods in 5-fold cross validation.
Energies 19 00124 g006
Figure 7. Forecast median loss statistics.
Energies 19 00124 g007
Figure 8. Schematic of partial prediction results of ensemble prediction average.
Energies 19 00124 g008
Figure 9. Average value of each feature in all expert models.
Energies 19 00124 g009
Figure 10. SHAP value of each feature in each expert model.
Energies 19 00124 g010
Figure 11. Frequency of expert model selection.
Energies 19 00124 g011
Table 1. NWP original feature set.
NumberFeaturesNumberFeatures
1200 m U-component wind speed910 m U-component wind speed
2200 m V-component wind speed1010 m V-component wind speed
3200 m wind speed1110 m wind direction
4200 m wind direction1210 m wind speed
5100 m U-component wind speed13Sea level pressure
6100 m V-component wind speed14Dew point temperature
7100 m wind direction152 m temperature
8100 m wind speed16Sea surface temperature
Table 2. Hyperparameter configuration for predictive models.
Model NameModel DimensionModel Depth
Transformer1284
LSTM256/128/643
CNN644
BPNN2563
TCN1284
Table 3. Model-training hyperparameters.
SuperparameterValue
Batch size64
Epoch100
Learning rate0.001
Dropout rate0.1
Loss functionMSE
OptimizerAdamW
Table 4. Comparison of median prediction error among the proposed method and single-prediction methods.
ModelRMSEMAE
Transformer0.174930.11631
LSTM0.176480.11654
TCN0.176610.1246
CNN0.177190.12745
BPNN0.188330.14905
Proposed0.151210.09836
Table 5. Comparison of median prediction errors of different ensemble prediction methods.
ModelRMSEMAE
Weighted mean0.16990.1143
Voting0.16130.1078
Stacking0.15510.1037
MOE0.15350.1038
Proposed0.15120.0984
Disclaimer/Publisher’s Note: The statements, opinions and data contained in all publications are solely those of the individual author(s) and contributor(s) and not of MDPI and/or the editor(s). MDPI and/or the editor(s) disclaim responsibility for any injury to people or property resulting from any ideas, methods, instructions or products referred to in the content.