Abstract
Cheesemaking is an energy-intensive process that relies heavily on heating and cooling operations traditionally powered by fossil fuels and electricity from the national grid. Reducing this dependence and integrating renewable energy sources are essential to align the sector with European decarbonization targets. This study presents the development of a simulation tool for optimizing the energy management of a cheese production facility by integrating solar, wind, and biomass systems. The model evaluates techno-economic and environmental performance under different climatic conditions and operational scenarios. Experimental validation was carried out using a prototype installed at the Polytechnic Institute of Beja (Portugal), achieving a deviation of only 2.3% in renewable energy contribution between simulated and measured data. Results demonstrate that renewable integration can reduce non-renewable energy consumption, achieving weekly profits up to 0.019 €/kg of cheese and carbon emissions as low as 0.0109 kg CO2e/kg. The proposed approach provides a reliable decision-support tool for small- and medium-scale cheese producers, promoting both environmental sustainability and economic competitiveness in rural regions.
1. Introduction
Global warming and the continued consumption of fossil fuels are accelerating the challenges of climate change and fossil fuel depletion, creating pressure for renewable and sustainable energy conversion [1]. This change is particularly urgent in energy-intensive industrial sectors, where greenhouse gas emissions and energy consumption remain high. In this regard, the food sector contributes heavily to a major share of industrial energy consumption and environmental pressure in Europe. A major component of the dairy industry exemplifies these issues, as cheese production has high thermal and electrical energy demands at the pasteurization, cooling, whey handling, and maturation stages. It underscores the importance of energy efficiency analysis and optimization in cheese-making operations as well as emission reduction and renewable energy usage [2].
1.1. Background
At the European level, the food industry plays a central role in the economy. In 2021, it was the largest manufacturing sector in the European Union (EU), generating EUR 1196 billion in turnover (14.5%) and EUR 249 billion in value added (11.4%) [3]. Despite facing recent challenges like inflation, the sector shows signs of recovery, with turnover increasing by 1% in the first quarter of 2024 compared to the previous quarter [4].
Within this diverse industry, the dairy subsector is particularly significant. It is the third largest subsector by turnover and contributes substantially to the EU’s trade balance, exporting EUR 19 billion in extra-EU exports in 2022/2023 [5,6].
Cheese production is a major segment within the dairy industry. The EU is the world’s largest producer of cow’s milk (156 million tons in 2019), with a substantial portion allocated to cheesemaking; for example, 37% of raw milk was used for cheese and butter production in 2017 [7]. Cheese is also one of the EU’s top agri-food exports, valued at EUR 7.7 billion in 2023 [3], and holds significant cultural and social importance, reflected by an average consumption of 20.9 kg per capita in 2023 [7,8].
In Portugal, the food industry also holds a central role in the national economy, contributing to 13.8% of total industrial sales and employing approximately 20% of the manufacturing workforce in 2016 [6]. The dairy sector alone contributes EUR 1.4 billion in turnover [6].
Although Portugal’s milk production is modest (1.9 million tons in 2017) [7], the cheese sector involves deep cultural and historical significance, preserving traditional methods that date back to Roman times [9,10]. Nationally, around 27% of milk production is allocated to cheese [6], and it remains an essential part of the Portuguese diet, with an average per capita consumption of around 15 kg in 2024 [11]. Furthermore, the sector provides crucial social and territorial support, sustaining rural employment and mitigating depopulation in remote regions [12].
The Portuguese cheese industry, like its European counterparts, is inherently energy intensive. Cheese production involves several stages, including pasteurization, coagulation, whey separation, maturation, and refrigeration, each contributing to the total energy use [13]. Heating and cooling are specifically the most energy intensive in terms of energy requirements. Pasteurization and coagulation energy are usually provided by fossil fuels (natural gas or propane) [14,15], and electricity is used for refrigeration compressors that are needed for cheese ripening and storage [16]. The reliance on non-renewable sources for these core operations highlights a key vulnerability and the primary environmental challenge facing the Portuguese cheesemaking sector.
1.2. Current Landscape of Energy Transition in the Cheesemaking Sector
Policies from European Union and Portuguese Government surrounding energy transition and decarbonization greatly justify the imperative for the cheesemaking sector to use renewable energy sources. At the EU level, Directive (EU) 2023/2413 (known as RED III) sets ambitious targets to increase the share of renewable energy by 2030, mandating that Member States implement policies promoting energy efficiency and renewable energy across all economic sectors [1,17]. This is supported by Regulation (EU) 2018/1999, which establishes a comprehensive framework for integrated monitoring and planning of energy and climate policies.
In alignment with the Paris Agreement, Portugal has committed to achieving carbon neutrality by 2050, a goal defined in the Carbon Neutrality Roadmap 2050 (RNC 2050) [18]. To facilitate this transition within the industrial sector, Decree-Law No. 99/2024 has updated the national regulatory framework, specifically simplifying licensing procedures and encouraging investments in decentralized renewable energy production [19]. This policy drive is further supported by financial and technical programs, such as the Recovery and Resilience Plan (PRR), which funds projects adhering to EU and national objectives for climate action and energy efficiency.
The need for sustainable energy solutions in the Portuguese cheesemaking sector is particularly critical due to the geographic distribution of production. Many facilities are located in rural areas. These locations often rely on expensive or logistically challenging fossil fuel supplies and face high operational electricity costs, which reduces competitiveness [12].
Consequently, implementing on-site renewable solutions offers a multi-faceted strategic advantage [20]:
- Reduced Operational Costs: Generating power locally hedges against volatile energy markets.
- Decarbonization: Directly reducing the sector’s environmental footprint and greenhouse gas emissions.
- Rural Development: Supporting socio-economic stability and resilience in remote regions.
Efforts are ongoing to integrate renewable technologies into cheese production processes. Among the available options, solar energy and wind energy are considered particularly suitable for implementation due to their versatility and relatively low biological and social impacts [21]. Solar energy, in particular, offers the capability to meet general facility needs (e.g., lighting and climate control) and to directly power the energy-intensive operations critical to cheesemaking, such as cheese ripening and refrigeration [10,21].
In Portugal, the integration of renewable energy into the cheesemaking sector is already progressing. Several producers have successfully adopted photovoltaic (PV) systems for self-consumption; for instance, the Portuguese producer Queijaria Lactoceleiro installed a solar plant comprising 253 PV panels [22]. Beyond general electricity generation, research has explored the direct use of renewable energy in energy-intensive processes. A promising example is the application of solar thermal collectors to heat fluid that raises milk temperature to 60–80 °C pasteurization. This method effectively replaces conventional fossil fuel boilers and heat exchangers, directly reducing dependence on non-renewable sources [23,24,25].
Several simulation tools are developed and are implemented to fully realize the potential, economic gains of application for these integration efforts, to provide an overview of their application throughout the food industry. For example:
- Aspen Plus has been used for modeling the thermodynamic and techno-economic performance of industrial processes [26].
- HOMER Pro has been applied to evaluate the feasibility of hybrid photovoltaic-wind systems for dairy farms [27].
- TRNSYS has been employed to analyze the integration of solar thermal systems into dairy operations such as pasteurization and cleaning [28].
These studies demonstrate that simulation tools are valuable for improving food-processing efficiency and integrating renewables. However, existing platforms cannot accurately model the simultaneous heating and cooling demands of small-scale cheesemaking. Therefore, a dedicated tool is necessary to optimize energy performance and reduce the sector’s ecological footprint.
1.3. Objectives and Outcomes
This study is driven by the growing need to modernize and decarbonize the Portuguese cheesemaking industry. Although previous studies have demonstrated the potential of renewable energy integration in food production, practical approaches tailored to small and medium-scale rural cheese units remain scarce.
This paper addresses this gap by developing a simulation model for sustainable energy management, experimentally validated through a prototype implemented at the Polytechnic Institute of Beja, Portugal. The proposed tool integrates solar, wind, and biomass resources to optimize both energy cost and environmental performance, managing the energy flows from renewable generation, storage, and the national electric grid. Through its application to a real cheese production and storage system, the study evaluates the technical feasibility of a renewable-based configuration and establishes the model as a decision-support tool capable of guiding the modernization and decarbonization of traditional cheesemaking facilities.
The proposed solution specifically targets a substantial reduction in fossil fuels consumption during energy-intensive processes such as milk pasteurization, coagulation and cheese ripening. By integrating renewable energy sources, the project aims to reduce non-renewable energy use by at least 40% compared to baseline levels (complete dependency on fossil fuels and energy from the grid), while maintaining the quality standards of traditional cheese production.
Validation under different seasonal scenarios demonstrated that:
- The simulation tool accurately replicates the real operation of the prototype, with less than 2.3% deviation in renewable energy contribution.
- The integration of renewable sources enables a reduction of over 40% in non-renewable energy use, achieving near self-sufficiency under favorable conditions.
- The system achieved weekly profits of up to 0.019 €/kg of cheese and emissions as low as 0.0109 kg CO2e/kg, confirming its economic and environmental viability.
These findings validate the model’s potential as a practical decision-support tool for small and medium-sized dairy units aiming to implement sustainable energy strategies. Additionally, the simulation tool is designed to support the implementation of similar cheesemaking systems in other regions of Portugal, enhancing the regional economy by assisting local producers and promoting sustainable practices that align environmental responsibility with economic competitiveness in the artisanal dairy sector.
2. Model Development and Implementation Methodology
This section presents the modeling and simulation methodology used to analyze the integration of renewable energy systems into cheese production. The approach focuses on the most energy-intensive stages, pasteurization, coagulation, and ripening and on their associated electrical and thermal demands. The proposed methodology combines process modeling, energy flow management, and cost and emissions assessment to evaluate the feasibility of a renewable-based, self-sufficient energy solution for cheese production, particularly in rural and decentralized contexts.
2.1. Problem Description
Pasteurization is a heat treatment applied to milk to eliminate pathogenic microorganisms, such as Mycobacterium tuberculosis, Salmonella spp., E. coli, Campylobacter jejuni e Listeria monocytogenes, thereby reducing public health risks while causing only minor chemical, physical, sensory, and nutritional changes. The main pasteurization methods include low-temperature, long-time (LTLT) and high-temperature, short-time (HTST) treatments. Their effectiveness is typically assessed through alkaline phosphatase inactivation, while lactoperoxidase activity confirms that overheating has not occurred. When milk is not immediately pasteurized, it should first undergo thermization to reduce psychrotrophic microorganisms before storage at 4 °C, helping prevent bacterial growth and preserve cheese quality [29]. Table 1 presents the different pasteurization methods and their characteristics.

Table 1.
Main pasteurization methods [15].
After pasteurization, milk undergoes coagulation, during which a coagulant is added depending on the type of cheese being produced. For example, cheeses from the Serpa (Portuguese region) use an aqueous solution of cardoon flower (Cynara cardunculus L.) as the coagulant [30]. Coagulation usually involves heating combined with acidification. The resulting curd is then separated from the whey, shaped, and salted [15].
The ripening process drives biochemical changes that shape texture, aroma, and flavor, enhancing the cheese’s sensory characteristics. Depending on the type of cheese, the ripening chamber’s temperature and humidity are adjusted to achieve specific environmental conditions. Lower ripening temperatures are particularly important, as they slow bacterial growth and biochemical activity [15,30].
Quantifying energy consumption of cheese production is a complex task. Although the production process generally follows similar steps, variations exist between plants. Factors such as geographic location, facility size and age, and the type of cheese produced significantly affect energy demand. In Europe, Xu et al. [31] reported specific energy consumption (SEC) values ranging from 2.1 to 68.2 MJ/kg of cheese. Nunes et al. [32] in a study of 31 Portuguese cheese plants confirmed substantially variations in energy use, with greater differences between industrial-scale and artisanal production. Regarding the distribution of energy use, Xu et al. [31] found that pasteurization, coagulation, and ripening are the most energy-intensive stages, accounting for 17–26%, 7–14%, and 12–32% of total energy consumption, respectively. A summary of reported energy consumption values from various studies is presented in Table 2.
Table 2.
Summary of energy consumption in cheese production from different studies.
2.2. Portuguese Case Study
This study focuses on the main stages of cheese production associated with the highest energy demand, both electrical and thermal, namely pasteurization, coagulation, and ripening. Other production steps were assumed to be performed manually, and were therefore considered negligible in terms of energy consumption.
A case analysis was conducted based on a renewable energy prototype installed at the Polytechnic Institute of Beja. In this experimental setup, solar energy was selected as the primary renewable source to meet both electrical and thermal needs, given its strong feasibility for integration into cheesemaking facilities. Wind energy was also included due to its high potential in coastal regions [38]. Additionally, biomass derived from olive pits and pellets produced from agricultural and industrial residues was considered, taking advantage of the proximity of many cheese factories to agro-industries suppliers of reusable biomass.
The renewable energy sources were allocated to specific cheese production processes. During pasteurization, thermal energy is primarily provided by a heat exchanger in the system’s condensing unit, which recovers waste heat from the refrigeration cycle and transfers it to water that subsequently heats the milk. To reach the required 63 °C, for the low-temperature, long-time (LTLT) pasteurization method, adopted in this study a pellet fueled boiler supplements the total energy demand.
During coagulation, thermal energy from two solar collectors installed on the roof of the facility is used to reach and maintain the milk at 32 °C. Given the lower energy demand compared with pasteurization, and the proven efficiency of solar thermal systems, solar thermal energy alone was deemed sufficient for this stage without backup support.
For ripening, electricity is required to control both temperature and humidity inside the ripening chamber. This demand is met through ten photovoltaic panels and a wind turbine, with surplus energy stored in a battery system for later use. The electrical grid serves as a backup source when renewable generation is insufficient.
To further improve efficiency, phase change materials (PCMs) were integrated inside the ripening chamber. Due to their high latent heat storage capacity, PCMs absorb and release thermal energy during phase transitions, acting as passive thermal stabilizers [39]. Their inclusion helps maintain the chamber’s temperatures stable, reduce the compressor workload, and lower the overall systems energy demand.
A prototype of the renewable energy system for cheese production was implemented at the Polytechnic Institute of Beja, as shown in Figure 1. The main equipment and specifications are summarized in Table 3.
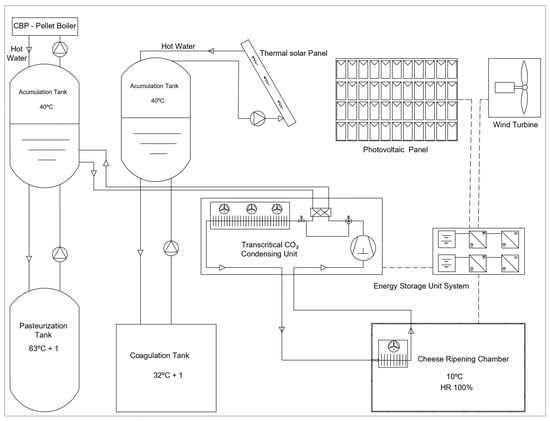
Figure 1.
Schematic representation of the integrated renewable energy system for cheese production and conservation analyzed in this study.
Table 3.
List of equipment used in the prototype installation at the Polytechnic Institute of Beja.
2.3. Simulation Tool’s Algorithm
The simulation program was developed with an hourly time-step, corresponding to the smallest interval for which both energy production and consumption data were available. It was designed to evaluate weekly operation scenarios, by assessing the feasibility of the proposed prototype as a self-sufficient energy solution for cheesemaking units located in remote areas.
The development of the simulation program was based on three equally important components: the electrical system, the pasteurization process, and the coagulation process. Each component modeled to simulate energy management required to meet the respective cheese production demands, using locally generated renewable energy, stored energy, or, depending on the energy type, grid electricity or thermal energy from biomass.
The algorithm of the simulation, outlined in the flowchart of Figure 2, starts with the input of key operational parameters, including electricity cost (defined by contracted power and tariff scheme), feed-in-tariff for surplus electricity, and biomass pellets cost for thermal energy supply.
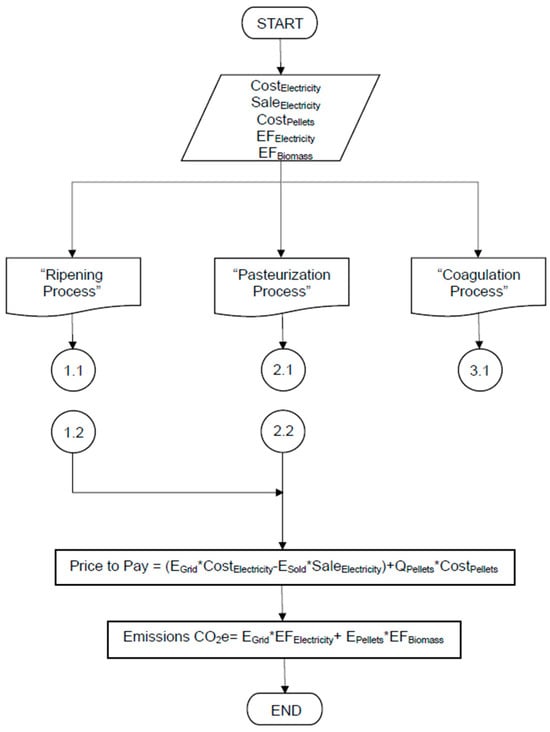
Figure 2.
Main flowchart of the simulation program algorithm.
To determine electricity cost, the applicable tariff structure for the cheesemaking unit was first established through an initial characterization of its consumption profile. This characterization allowed for the correct section of the contracted and the appropriate tariff structures available from electricity providers.
The apparent power was calculated according to the following formulation:
where S represents the apparent power (kVA), P the active power (kW), and cos φ the power factor.
S = P/cos φ,
To determine the apparent power, the hourly electricity consumption profile was analyzed, identifying a maximum hourly demand of 1.8 kWh, corresponding to an active power of 1.8 kW. Since no specific information on the power factor was available for the prototype, a typical industrial value of 0.8 was assumed [40]. Based on these parameters, the apparent power was calculated using Equation (1), resulting in 2.25 kVA.
A 20% safety margin was applied to account for potential consumption fluctuations, resulting in an adjusted apparent power of 2.7 kVA. Comparing this value with the power categories offered by Portugal electricity providers, the closest contracted value was 3.45 kVA, which was therefore adopted for the system under study.
To determine the applicable electricity tariff, the corresponding voltage level had to be identified, as tariffs are structured based on this classification [41]. According to national regulation, distribution levels are categorized as Low Voltage (≤1 kV), Medium Voltage (1–45 kV), High Voltage (45–110 kV), and Very High Voltage (>110 kW). For Low Voltage consumers, an additional distinction is made between Normal Low Voltage (BTN, ≤41.4 kVA) and Special Low Voltage (BTE, >41.4 kVA).
Since the contracted power of the prototype its below 41.4 kVA and all equipment operates at voltages under 1 kV, the case study falls under the BTN category. Within this segment, tariffs are further differentiated by the number of hourly periods defined [41]: single-rate tariff, with a uniform price across all hours; bi-hourly tariff, distinguishing between off-peak and peak hours; and tri-hourly tariff, with peak, shoulder, and off-peak periods. In addition, seasonal adjustments are applied quarterly to reflect variations in national electricity demand and distribution grid stress.
Based on these conditions, the electricity pricing schemes defined by the Portuguese Energy Services Regulatory Authority (ERSE) [42] were applied to the case study. For the analyzed cheesemaking unit, the cost of active energy (EUR/kWh) was calculated according to the applicable tariff structure presented in Table 4.
Table 4.
Electricity prices applied to the case study for the different tariffs [42].
In addition to estimating the cost of electricity purchased from the national grid, it is also necessary to account for the cost of pellets, required as an auxiliary thermal energy source for pasteurization, when the heat recovered by the desuperheater is insufficient. According to Nunes et al. [43], pellet prices are highly variable, depending on the supplier and subject to seasonal and annual fluctuations. For the simulation program, a reference cost of EUR 366 per ton (0.366 EUR/kg) was adopted based on retail market data reported by Jesus [44].
Renewable self-consumption systems naturally generate surplus electricity, as production may exceed demand during certain hours while the battery remain fully charged. To prevent energy losses, the excess electricity can be exported to the grid. In Portugal, the remuneration depends on the market prices defined by the Iberian Electricity Market Operator (OMIE) and is given by Equation (2).
where RUPAC is the revenue from electricity sold (EUR), Esupplied is the energy supplied (kWh), OMIE is the arithmetic mean of daily closing prices in Portugal (EUR/kWh), and the 0.9 factor accounts for a 10% market access deduction.
RUPAC = Esupplied × OMIE × 0.9,
For this study, OMIE prices were averaged for the weeks of 3 to 9 February 2025 and of 26 May to 1 June 2025, which correspond to the scheduled experimental tests. The applicable prices are presented in Table 5.
Table 5.
OMIE prices for the experimental tests of this study [45].
After the input of the defined parameter, and as illustrated in Figure 2, the simulation tool manages the energy flows across the cheese production processes (1.1—curing/electrical subsystem, 2.1—pasteurization, 3.1—coagulation). This management determines the electricity purchased from the grid and the surplus sold to it (1.2), as well as the biomass pellet consumption (2.2). The specific algorithms for each process component are described in the following sections.
Based on the input parameters and simulation results, Equation (3) is then applied to calculate the net energy cost, enabling the assessment of the associated costs or profits for the cheese production unit under study.
where EGrid is the electricity required from the grid (kWh), CostElectricity the grid electricity price (EUR/kWh), ESold the energy exported to the grid (kWh), SaleElectricity the electricity selling price (EUR/kWh), QPellets the pellet mass required for pasteurization (kg), and CostPellets the pellets price (EUR/kg).
Price to Pay = (EGrid × CostElectricity − ESold × SaleElectricity) + QPellets × CostPellets,
In addition, the simulation estimates the environmental impact of the system by calculating the equivalent CO2 emissions, considering both electricity drawn from the grid and energy provided by the pellet boiler. According to the Portuguese Environment Agency [46], the most recent emission factors are 0.107 kgCO2e/kWh for electricity and 0.032 kgCO2e/kWh for biomass.
where EFElectricity and EFBiomass are the emission factors (kgCO2e/kWh) for electricity and biomass, respectively, and EPellets is the energy provided from the pellets boiler (kWh).
Emissions CO2e = EGrid × EFElectricity+ EPellets × EFBiomass,
2.3.1. Electrical System
Within the program, the component related to the curing process and overall electrical consumption was designed to maximize the use of photovoltaic and wind generation to cover most of the facility’s demand, with priority given to critical loads such as the condensing unit and evaporator. The management strategy also considers the electrical needs of auxiliary equipment and the storage of surplus energy in the battery to guarantee supply during periods of low renewable generation. As illustrated in Figure 3, this component requires input variables such as solar radiation, wind speed, electrical demand, and battery capacity. For simulation purposes, the battery was assumed to be fully discharged at the initial time step.
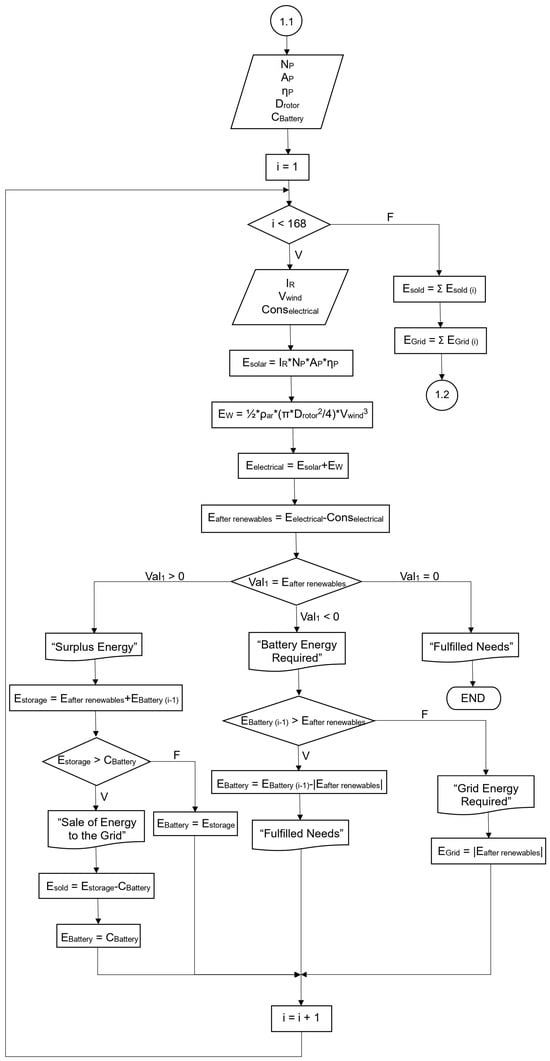
Figure 3.
Flowchart of the algorithm associated with the system’s electrical energy.
Incident radiation data were obtained from the European Commission’s Photovoltaic Geographical Information System (PVGIS) [47]. The SARAH3 database was selected, as recommended for Portugal, and the most recent dataset available (2023) was used. Simulations assumed fixed PV panels, with tilt and azimuth angles optimized through the PVGIS tool. Wind speed data were also retrieved from the PVGIS tool, which provides wind data at 10 m above sea level.
Electricity demand data for the prototype, including the ripening process, were collected from two production weeks (from 3 February to 9 February 2025 and from 26 May to 1 June 2025), using the monitoring system installed on the prototype [48]. The battery has a maximum usable storage capacity of 5.2 kWh.
Once the input parameters were defined, the electricity generated for self-consumption by the photovoltaic system was first estimated using Equation (5).
where Esolar is the solar energy production [Wh], IR the incident solar radiation [Wh/m2], NP the number of modules, AP the module surface area [m2], and ηP the module efficiency.
Esolar = IR × NP × AP × ηP,
The maximum number of PV modules is constrained by the available roof area of the cheesemaking facility; therefore, Esolar is limited by the maximum installable PV area, assuming fixed module orientation and neglecting shading effects and electrical losses. Consequently, Equation (5) provides an upper-bound estimate of photovoltaic energy production under ideal operating conditions.
The wind power generated by the turbine corresponds to the kinetic energy of the airflow crossing the rotor blades, which depends on wind speed, air density (1.225 kg/m3 at sea level), and rotor swept area [49].
where EW is the wind energy production [Wh], ρar is air density [kg/m3], Drotor the rotor diameter [m], and Vwind wind speed [m/s].
EW = ½ × ρar × (π × Drotor2/4) × Vwind3,
Wind energy production is constrained by the turbine’s start-up and cut-out wind speeds. In the case study, the selected wind turbine operates with a start-up wind speed of 3 m/s and a cut-out wind speed of 45 m/s. Moreover, the achievable wind energy output is further limited by the turbine dimensions compatible with the available installation space at the cheesemaking facility.
Based on the calculated photovoltaic and wind energy, the total electrical energy production was determined using Equation (7).
where Eelectrical is the total electrical energy production [Wh], Esolar is the solar energy production [Wh], and EW is the wind energy production [Wh].
Eelectrical = Esolar + EW,
For the curing process and overall electrical consumption, the simulation program first allocates the electricity produced to meet the instantaneous demand. The subsequent energy balance is then determined, calculating either the surplus (when generation exceeds demand) or the deficit (when generation is insufficient). This step assesses energy availability at each time interval and determines the battery storage or grid supply requirements.
where Eafter renewables is the energy balance after the use of energy produced by the photovoltaic panels and wind turbine [Wh], Eelectrical is the total electrical energy production [Wh], and Conselectrical is the electrical energy consumption of the system [Wh].
Eafter renewables = Eelectrical − Conselectrical,
After calculating the energy balance (Equation (8)), a zero result indicates that generation meets demand, with no surplus or deficit, and no further calculation is performed for that time step. A positive balance means that excess electricity from photovoltaic and wind generation is directed to the battery storage for later use. The effective storage capacity is then determined based on the available surplus and the battery’s existing state of charge, as expressed in Equation (9).
where Estorage is the energy available for storage in the battery [Wh], Eafter renewables is the energy balance after the use of energy produced by the photovoltaic panels and wind turbine [Wh], and EBattery (i−1) is the energy stored in the battery in the previous iteration [Wh].
Estorage = Eafter renewables + EBattery (i−1),
It should be noted that the battery has a maximum usable capacity of 5.2 kWh. If the energy calculated from Equation (9) exceeds this limit, the stored energy is capped at 5.2 kWh, and any surplus is directed to the grid, as described in Equation (10).
where Esold is the energy exported to the national grid [Wh], Estorage is the energy available for storage in the battery [Wh], and CBattery is the battery’s maximum usable capacity [Wh].
Esold = Estorage − CBattery,
If the storable energy is lower than the battery’s maximum capacity, the energy effectively stored during that iteration equals the calculated energy (Estorage), thus concluding the step.
Conversely, if the result of Equation (8) is negative, this indicates that renewable sources is insufficient to meet the system’s electrical demand, requiring the use of battery storage. In this case, the program checks whether the available energy in the battery exceeds the absolute value of the energy deficit (Eafter renewables), to prevent full discharge. If the available energy in storage is sufficient, the deficit is supplied by the battery, and the remaining energy stored for the next iteration is computed using Equation (11), completing the time step.
where EBattery is the stored energy available after the use of the battery [Wh], EBattery (i−1) is the energy stored in the battery in the previous iteration [Wh], and Eafter renewables is the energy balance after the use of energy produced by the photovoltaic panels and wind turbine [Wh].
EBattery = EBattery (i−1) − |Eafter renewables|,
However, if the available battery energy is lower than the energy deficit after renewable energy generation, the remaining system demand is supplied by the national grid.
where EGrid is the required electrical energy from the national grid to meet the remaining system demand [Wh], and Eafter renewables is the energy balance after the use of energy produced by the photovoltaic panels and wind turbine [Wh].
EGrid = |Eafter renewables|,
2.3.2. Pasteurization Process
In the simulation of the pasteurization process, the goal is to model its operation using a desuperheater integrated into the refrigeration system of the ripening chamber. The desuperheater heats water stored in an accumulation tank, which is then used to raise and maintain milk temperature. A pellet boiler serves as a backup when the recovered thermal energy is insufficient.
The flowchart in Figure 4 presents the simulation algorithm developed for the pasteurization process. Similar to the electrical subsystem, the modeling starts with the definition of input variables: electrical demand, pasteurization demand, condensing unit COP, tank thermal capacity, pellet lower heating value, and boiler efficiency. In the first iteration, the thermal energy stored in the tank is set to zero.
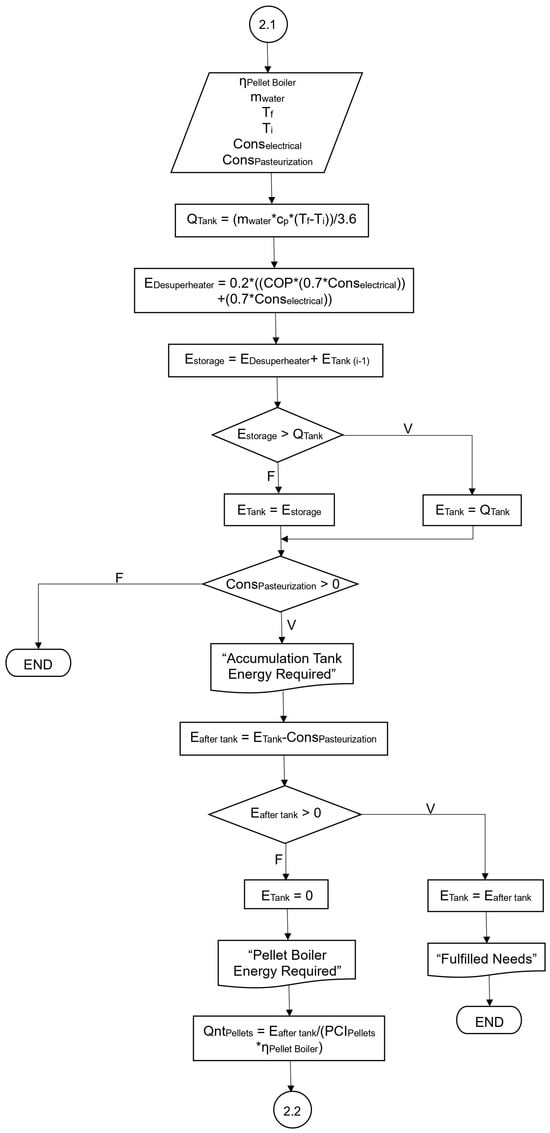
Figure 4.
Flowchart of the algorithm associated with the pasteurization process.
Before modelling this component, the tank’s thermal capacity was estimated using Equation (13), based on the initial and final water temperatures and the specific heat of the fluid (4.186 kJ/kgK for water). For the pasteurization process, targeting a milk temperature of 63 °C (LTLT pasteurization process), the water in the accumulation tank was assumed to reach 70 °C. A water density of 1 kg/L was considered, corresponding to a flow rate equal to the tank capacity (500 L), with an initial water temperature of 15 °C.
where QTank is the maximum thermal energy stored in the accumulation tank [Wh], mwater is the water flow rate [kg/s], cp the specific heat capacity of water [kJ/kgK], Tf the final water temperature in the tank [°C], and Ti the initial water temperature in the tank [°C].
QTank = (mwater × cp × (Tf − Ti))/3.6,
The calculated thermal capacity of the accumulation tank was 31,976.4 Wh, based on the defined temperature range and fluid properties.
Before developing the program component, it was necessary to define the energy consumption of the pasteurization process. As no experimental data were available from the prototype, reference values from the literature were used to ensure reliable simulation inputs.
Average values reported by Ladha-Sabur et al. [2], based on multiple studies and dairy units, were adopted. The total energy demand for cheesemaking was considered to be 5.04 MJ/kg of cheese (≈1.4 kWh/kg). According to Xu et al. [31] and Ladha-Sabur et al. [2] pasteurization accounts for 17–26% of total energy used in a cheesemaking unit. A conservative estimate of 26% was applied in this study, corresponding to 0.364 kWh/kg of cheese.
For the weekly simulation scenario, the operational profile assumes that pasteurization occurs once per day on weekdays at 9 a.m., with no operation during weekends.
After defining these input parameters, the algorithm’s first step, shown in Figure 4, is to determine the thermal energy recovered by the desuperheater. It is assumed that 70% of the system’s total electricity consumption is attributable to the compressor, based on the fact that, compressors account for represent approximately 53% of total electricity use in traditional Portuguese cheese industries [6]. Compressors are therefore identified as the most energy-intensive equipment in cheese production.
The system evaluated in this research differs from conventional multi-stage industrial cheese plants, which include pasteurization, coagulation, and various auxiliary services (e.g., HVAC, lighting) by focusing primarily on the ripening chamber and its essential auxiliary equipment, which results in the compressor representing a proportionally larger share of the total electrical demand, thereby justifying the conservative assumption of a 70% share to accurately reflect the system’s overall energy balance, thus avoiding any underestimation of the compressor’s contribution to the overall energy flow and validating the specialized focus of this study.
It is important to note the key differences between the proposed system and conventional cheese industries. In traditional facilities, total electricity consumption includes auxiliary services such as HVAC, lighting, and external equipment, in addition to multiple production stages of cheese (e.g., pasteurization and coagulation). In contrast, the system analyzed in this study considers only the ripening process and auxiliary devices such as pumps, circulators, sensors, and internal lighting of the ripening chamber. Consequently, the compressor represents a larger share of the total electrical consumption.
Finally, the energy recovered by the desuperheater is assumed to correspond to 20% of the heat released during refrigerant condensation, in line with technical recommendations [50].
where EDesuperheater is the energy recovered by the desuperheater [Wh], COP is the coefficient of performance of the condensing unit water flow rate, and Conselectrical is the electrical energy consumption of the system [Wh].
EDesuperheater = 0.2 × (Qrefrigeration + Qcompressor) = 0.2 × ((COP × (0.7 × Conselectrical)) + (0.7 × Conselectrical)),
With the thermal energy recovered by the desuperheater calculated, the total storable energy in the accumulation tank can be determined, considering both the energy supplied by the desuperheater and the energy previously stored in the tank from prior iterations.
where Estorage is the energy available for storage in the accumulation tank [Wh], EDesuperheater is the energy recovered by the desuperheater [Wh], and ETank (i−1) is the energy stored in the accumulation tank in the previous iteration [Wh].
Estorage = EDesuperheater+ ETank (i−1),
Similar to the electrical subsystem with the battery, the pasteurization subsystem must also account for the maximum energy storage capacity of the accumulation tank. Based on the tank’s capacity, if the value calculated from Equation (15) exceeds 31,976.4 Wh, the energy effectively stored is limited to this maximum value, and any excess is considered wasted. Conversely, if the calculated energy is below 31,976.4 Wh, the stored energy equals the calculated energy.
Subsequently, the analysis of the pasteurization process profile shows that during periods of zero thermal demand, the system only stores energy in the accumulation tank, thus concluding this step. When thermal energy is required for pasteurization, the system prioritizes using the previously stored energy.
During pasteurization (i.e., when thermal consumption is greater than zero), it is necessary to verify whether the available energy in the accumulation tank is sufficient to meet the process requirements.
where Eafter tank is the energy balance after the use of thermal energy stored in the accumulation tank [Wh], ETank is the energy stored in the tank [Wh], and ConsPasteurization is the energy required for the pasteurization process [Wh].
Eafter tank = ETank − ConsPasteurization,
After obtaining the result of Equation (16), two scenarios are considered. If the value is positive, the stored energy is sufficient to meet the thermal demand of the pasteurization process, and the remaining energy becomes the initial condition for the next iteration. Conversely, a negative result indicates depletion of the thermal storage, requiring the pellet boiler to provide the additional energy needed. To determine the minimum pellet consumption, it is necessary to identify the lower heating value of the pellets (16 MJ/kg) and the boiler efficiency (93.1%), as expressed in Equation (17).
where QntPellets is the minimum quantity of pellets required to supply the remaining thermal energy for the pasteurization process [kg], Eafter tank is the energy balance after the use of thermal energy stored in the accumulation tank [Wh], PCIPellets is the lower heating value of the pellets [MJ/kg], and ηPellet Boiler is the pellet boiler efficiency [%].
QntPellets = Eafter tank/((PCIPellets × (106/3600)) × ηPellet Boiler),
2.3.3. Coagulation Process
Finally, in the software module related to milk coagulation, the program simulates the process for the case under study. At this stage, water in the accumulation tank is heated by two solar collectors providing the thermal energy required to maintain a constant milk temperature during coagulation. Figure 5 shows the algorithm developed to represent this process. As in previous program stages, the first step is to define input variables, including solar radiation, the technical parameters of the solar collectors, the energy demand of coagulation, and the maximum thermal storage capacity of the accumulation tank. Similar to the pasteurization module, the first iteration assumes zero thermal energy stored in the accumulation tank.
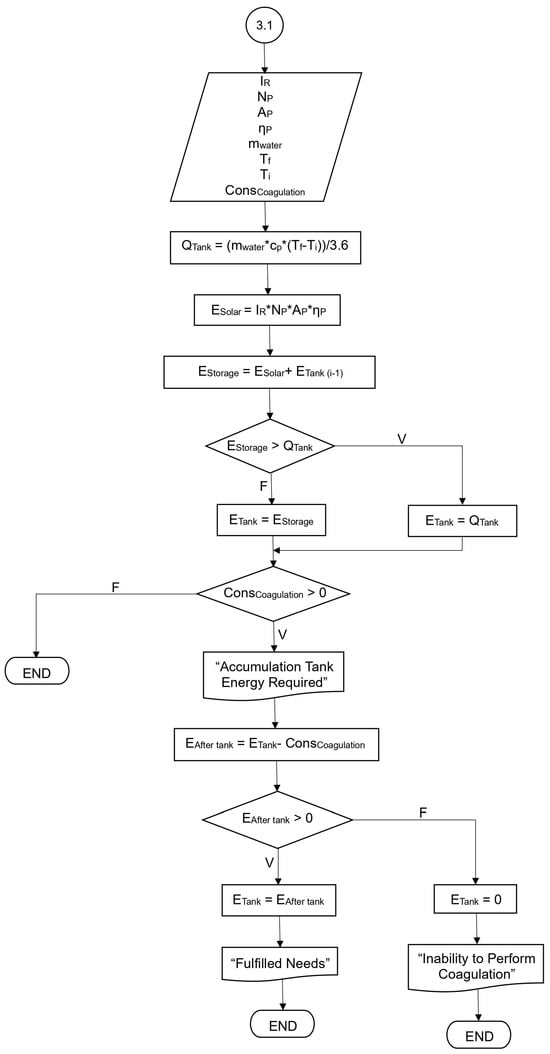
Figure 5.
Flowchart of the algorithm associated with the coagulation process.
Solar radiation data were obtained from the European Commission’s Photovoltaic Geographical Information System (PVGIS) [47]. Based on these inputs parameters, the thermal energy generated for self-consumption by the solar collectors was determined using Equation (5).
The maximum thermal storage capacity of the accumulation tank was estimated using Equation (13), as in the pasteurization module. Since the coagulation temperature is set at 32 °C and maintained for one hour, the water temperature was assumed to reach 40 °C. An initial water temperature of 15 °C and a flow rate equal to the tank’s capacity of 300 L were also considered. The calculated thermal capacity of the tank was 8720.8 Wh, based on the defined temperature range and fluid properties.
The energy demand of the coagulation process was estimated using the same approach applied to pasteurization. Considering a total energy consumption of 5.04 MJ/kg of cheese (≈1.4 kWh/kg) reported by Ladha-Sabur [2], and assuming a conservative scenario in which coagulation accounts for 14% of total energy use [31], the corresponding consumption was set at 0.196 kWh/kg of cheese. For the weekly operation of the system, coagulation was scheduled once per day on weekdays at 11 a.m., with no activity during weekends.
After defining the input parameters, the first step of the algorithm related to the coagulation process (Figure 5) involved calculating the total energy storable in the accumulation tank based on the hourly solar thermal production.
where Estorage is the energy available for storage in the accumulation tank [Wh], Esolar is the thermal solar energy production [Wh], and ETank (i−1) is the energy stored in the accumulation tank in the previous iteration [Wh].
Estorage = ESolar + ETank (i−1),
Subsequently, as in the pasteurization module, the coagulation subsystem must also account for the maximum energy storage capacity of the accumulation tank. Based on the tank’s thermal capacity and the energy calculated from Equation (18), two scenarios are distinguished: (i) if the calculated energy exceeds 8720.8 Wh, the stored energy is limited to the tank’s maximum capacity; (ii) if the calculated energy is lower than 8720.8 Wh, the stored energy equals the total energy obtained from the calculation.
During periods without coagulation, the system accumulates thermal energy in the tank, and the iteration ends. When coagulation occurs and thermal energy is required, the system draws from previously stored energy. To verify that the available stored energy is sufficient to meet the coagulation process demand, the energy balance after the use of the energy stored in the tank is verified using Equation (19).
where Eafter tank is the energy balance after the use of thermal energy stored in the accumulation tank [Wh], ETank is the energy stored in the tank [Wh], and ConsCoagulation is the energy required for the coagulation process [Wh].
Eafter tank = ETank − ConsCoagulation,
The cheese production system analyzed in this study was designed assuming that the two solar collectors can fully meet the thermal energy demand of the coagulation process without a backup system. Therefore, the results of Equation (19) are expected to be positive. In this case, the stored energy for the next iteration equals the calculated value, and the simulation concludes. Conversely, in the unlikely event that the result of Equation (19) is negative, the stored energy is set to zero, and the simulation ends without performing the coagulation process.
2.4. Graphical User Interface of the Simulation Tool
The software application developed based on the previously defined algorithm is organized into five modules: three for data and two for results presentation. The first module allows the users to enter the technical specifications of the equipment used in the prototype cheese production unit under study. At the end of this module, a navigation button enables users to move to the next section. Figure 6 illustrates this interface, presenting as an example the technical specifications of the equipment considered in this study.
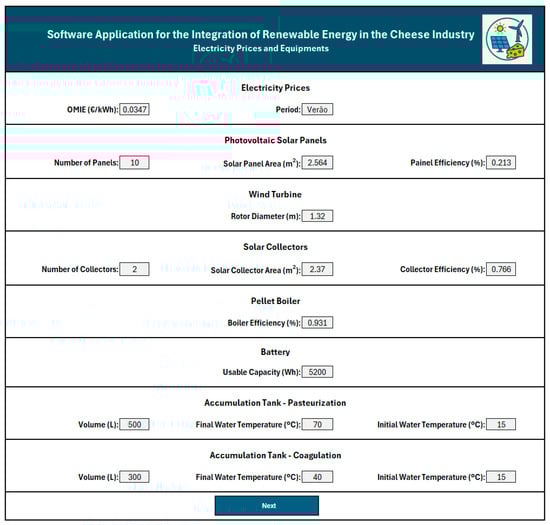
Figure 6.
Program section for entering equipment technical data.
After entering the equipment data, the program moves to a new module in which the user is prompted to provide solar radiation and wind speed datasets corresponding to the weekly period under analysis. Once the data entry is completed, the user proceeds to the next interface by selecting the “Next” button. As an example, Figure 7 presents this module with solar radiation and wind speed values for the week of 26 May to 1 June 2025.
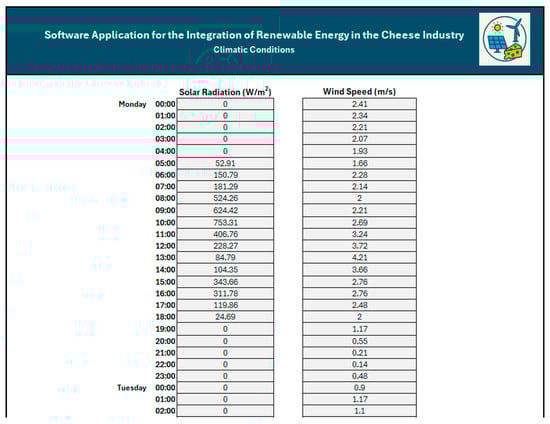
Figure 7.
Program section for entering atmospheric condition data.
Before running the simulation, the user must enter the system’s electrical demand values and the energy loads associated with the pasteurization and coagulation pro-cesses. After defining these parameters, the simulation of the cheese production unit can be initiated by selecting the “Simulate” command. As in the previous section, the data presented in Figure 8 corresponds to the period from 26 May to 1 June 2025.
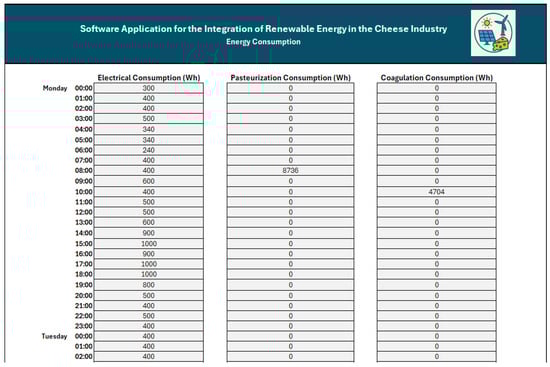
Figure 8.
Program section for input of system energy consumption data.
Once all input parameters for the cheese production unit prototype are entered, the program displays a summary of the main simulation results, including the total weekly operating cost or profit and the ecological footprint of the unit. Figure 9 presents the program interface corresponding to the main system results.
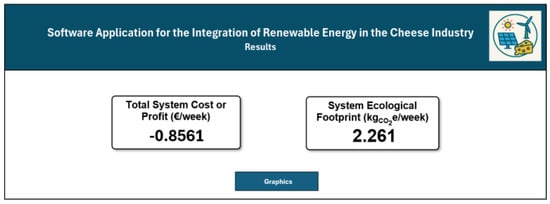
Figure 9.
Program section for the main system results.
For a more detailed analysis of the energy management in the cheese production and storage processes, the user can select the “Graphs” command. This opens a final section (Figure 10) presenting multiple visualizations: electrical system management, thermal energy management of the pasteurization and coagulation processes, and the contribution of renewable energy sources to the system’s electricity supply.
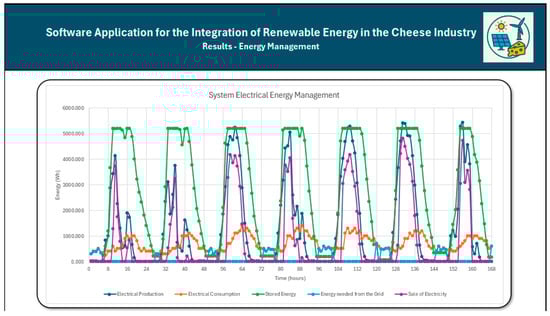
Figure 10.
Program section for the energy management graphs.
3. Results and Discussion
The methodology adopted for this study involves the development of a comprehensive modeling and simulation framework to accurately assess the energy dynamics and renewable energy feasibility of the small-scale cheesemaking system. This framework was designed to model the main energy intensive processes (pasteurization, coagulation, and ripening), track hourly electrical and thermal energy flows, optimize the sizing of hybrid renewable energy components, and evaluate performance across technical, economic, and environmental metrics. For maximum transparency and due to its strong capabilities for time-series data analysis and iterative calculations, the simulation was implemented as a custom program using Microsoft Excel (Office 365/2021, 64-bit), with the core energy balance logic executed via the same software scripts across 8760 annual hourly time steps. The simulation runs were performed on a standard machine (Windows 11 Pro; Intel Core i7-8550U CPU @ 1.8 GHz; 16 GB RAM).
To validate the accuracy and generalizability of this developed simulation framework, several tests were subsequently carried out to evaluate both the program and the cheesemaking prototype under varying environmental and productive conditions. The first test analyzed the real operation of the prototype installed at the Polytechnic Institute of Beja during the week of 26 May to 1 June 2025. A second test was considered at the same location but for the week of 3 to 9 February 2025, representing a different season with distinct climatic and production characteristics.
The simulation results were compared with experimental data collected from the prototype to assess the accuracy of the model’s predictions. Additionally, the program’s estimated energy consumption was compared with values reported for conventional cheesemaking facilities.
3.1. Test 1: Prototype—26 May to 1 June
The first test was conducted at the real location of the prototype, the Polytechnic Institute of Beja, during the week of 26 May to 1 June 2025, with a daily production of 24 kg of cheese, on working days. In this scenario, the thermal energy requirements for pasteurization and coagulation were calculated, as previously described, while electrical consumption data was retrieved through the monitoring system [48]. At the same time, solar radiation and wind speed data to estimate renewable energy production were obtained from the European Commission’s Joint Research Centre [47].
Figure 11 shows the weekly energy management performance of the system, designed to meet the electrical demands of the curing process and other operational loads. The graph presents the power generated by the photovoltaic panels and wind turbine (dark blue line), total system electrical consumption (orange line), battery state of charge (green line), energy drawn from the national grid (light blue line) and excess energy exported to the grid (purple line). Data are displayed on a weekly basis, starting each week at midnight on Monday, following the same format used in the subsequent figures in this chapter.
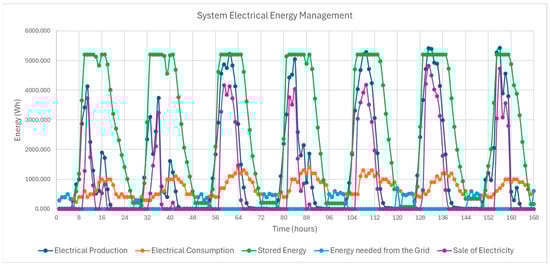
Figure 11.
System’s electrical management for test 1.
The analysis of Figure 11 reveals that the system achieves a high degree of energy self-sufficiency, approaching near-total autonomy. However, some reliance on the national grid remains necessary, particularly during nighttime hours. This dependence is primarily due to the absence of solar irradiance and low wind speeds at night, which limit renewable energy generation.
During the day, the system consistently generates more electricity than it consumes. The surplus is stored in the battery, which reaches its maximum capacity of 5200 Wh daily. Once the battery is fully charged, it’s possible to verify that the excess energy is exported to the grid. At night (from 18:00 to 06:00), when renewable generation is minimal, the stored energy is used to partially cover the system’s demand. These results indicate that increasing storage capacity, either by adding an additional battery or replacing the current one with a higher-capacity battery, could further enhance energy autonomy and reduce, or potentially eliminate, the need for grid electricity.
Figure 12 presents the daily percentage contribution of photovoltaic and wind energy toward meeting the system’s total electrical demand from Monday (Day 1) to Sunday (Day 7). The results confirm a consistently high renewable contribution, with a minimum of 81.5% on Sunday and a maximum of 95.7% on Tuesday.
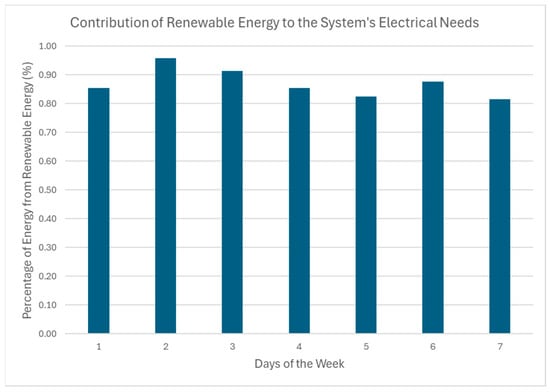
Figure 12.
Contribution of renewable energy to the system’s electrical demands in test 1.
For the pasteurization component of the simulation program, Figure 13 illustrates the energy management for this cheesemaking process. The graph displays the recovered energy from the desuperheater (blue line), thermal energy consumption of the pasteurization process (orange line), energy stored in the thermal storage tank (green line), and the thermal energy supplied by the pellet boiler (red line).
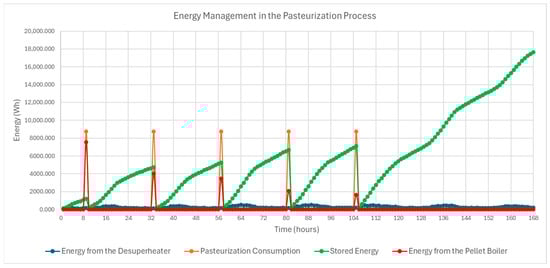
Figure 13.
System’s pasteurization thermal energy management for test 1.
The analysis of Figure 13 indicates that the hourly thermal energy recovered by the desuperheater is relatively limited. However, over the course of each day, this recovered energy accumulates in the storage tank, partially meeting the thermal demand of the pasteurization process.
Despite this contribution, the system’s first week of operation, the stored energy was insufficient to fully meet the thermal requirements of the pasteurization process. Consequently, supplementary heat production from the pellet boiler was essential to ensure uninterrupted operation.
As shown in Figure 13, pasteurization is carried out only on weekdays. This operational schedule enables greater energy accumulation during weekends, potentially reducing reliance on the pellet boiler in the following week.
Figure 14 presents the thermal energy management data for the coagulation process. The graph illustrates weekly variations in the process’s thermal energy demand (orange line), the energy produced by the solar collectors (blue line), and the energy stored in the accumulation tank (green line).
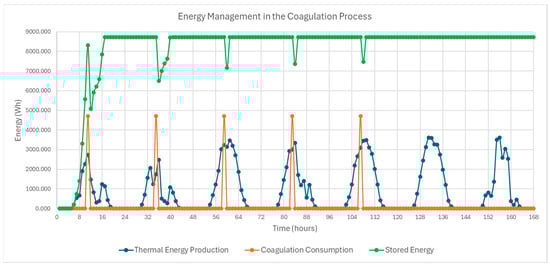
Figure 14.
System’s coagulation thermal energy management for test 1.
The analysis of Figure 14 shows that the thermal energy generated daily by the two solar collectors is sufficient to charge the accumulation tank with enough energy to fully meet the demands of the coagulation process, without interruption throughout all evaluated days. This includes the system’s first day of operation, when no prior energy had been stored.
These results confirm the effectiveness of the proposed solution, which relies solely on two solar collectors to supply the thermal energy requirements of the coagulation process. However, for larger scale industrial cheese production facilities, with higher daily production volumes, system scaling would be necessary. In such cases, increasing the number of solar collectors would be essential to maintain equivalent energy performance.
In addition, the simulation tool calculated electricity costs from the national grid, under different tariff schemes (single, bi-hourly, and tri-hourly), based on the data provided in Table 4. This analysis identified the most cost-effective tariff option and the resulting electricity costs for each tariff scenario are summarized in Table 6.
Table 6.
Costs of grid electricity under different tariffs for test 1.
As shown in Table 6, the difference between the bi-hourly and tri-hourly tariffs is minimal, however the tri-hourly offered the lowest cost and was therefore selected for this analysis.
Using the data from Table 5 and the recorded pellet cost, the program further estimated the overall operating cost (Table 7). The results show that the revenue from electricity sales to the grid exceeded the combined expenses of grid consumption and biomass use, yielding a net profit of EUR 0.8561 for the week of 26 May to 1 June 2025. The system’s associated CO2 emissions for this period were estimated at 2.261 kg CO2e.
Table 7.
Operational cost for test 1.
3.2. Test 2: Prototype—3 to 9 February
This experiment was also conducted at the actual prototype site, located at the Polytechnic Institute of Beja, during the week of 3 to 9 February 2025. During this period, the average daily cheese production on weekdays was 38 kg.
As in the first experiment, this information enabled the determination of the thermal energy demand for pasteurization and coagulation, as well as the collection of electrical consumption data, solar radiation, and wind speed data. Figure 15 presents the results of electrical energy management for this test.
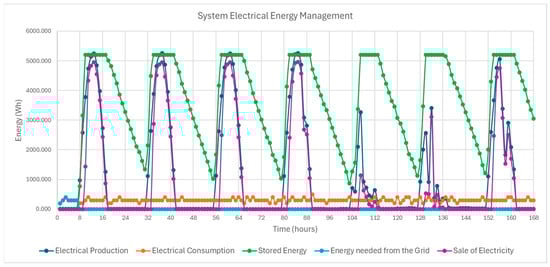
Figure 15.
System’s electrical management for test 2.
Analysis of Figure 15 shows that the system’s electrical consumption during this trial was lower than case 1. This reduction is mainly due to lower ambient temperature recorded during the test period, which decreased the temperature gradient between the interior and exterior of the ripening chamber. Consequently, conductive heat losses were reduced, leading to a lower thermal load on the evaporator and, consequently, reduced compressor power demand.
For most of the period analyzed, the cheese production unit remained energy self-sufficiency, powered by on-site renewable sources (photovoltaic and wind energy).
As in case 1, the battery storage system supplied energy during nighttime hours when solar generation was unavailable. However, in this experiment, the stored was sufficient to meet the system’s demands without fully discharging the battery.
These observations are further supported by Figure 16, which shows that, starting from Tuesday of the analyzed week, renewable energy sources fully covered the system’s electrical load (100% contribution).
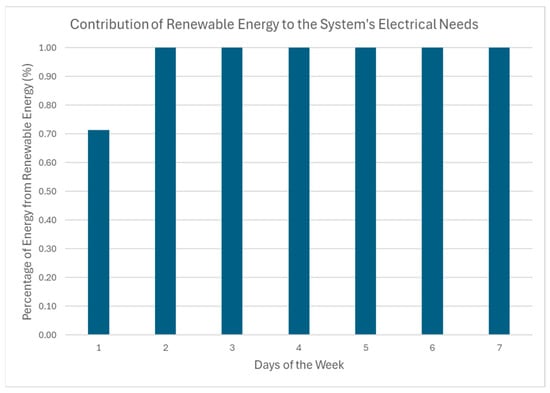
Figure 16.
Contribution of renewable energy to the system’s electrical demands in test 2.
Figure 17 presents the energy management results for the pasteurization process conducted during test 2.
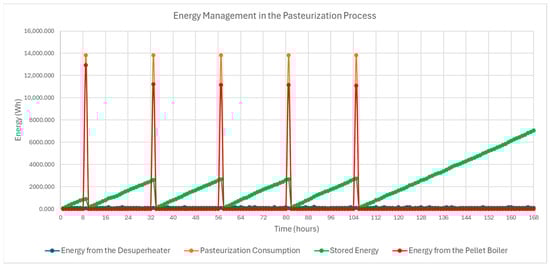
Figure 17.
System’s pasteurization thermal energy management for test 2.
A comparison between the results in Figure 17 and those from case 1 (Figure 13) shows a greater reliance on biomass energy (red line) to meet the pasteurization demands in this trial. This increase is mainly due to higher energy consumption during pasteurization (orange line), driven by the higher cheese production volume (38 kg) recorded during the week. Additionally, as previously discussed in the system’s energy balance, the lower thermal load on the evaporator and reduced compressor power result in less heat being rejected during refrigerant condensation, thereby decreasing the energy recovered by the desuperheater.
This is also reflected in the thermal storage behavior. Unlike in case 1, the amount of energy stored over the weekend is significantly reduced. As a result, it becomes more challenging to rely on stored heat to offset the boiler’s contribution during pasteurization in the following week.
Figure 18 presents the energy management results for the coagulation process during the same test.
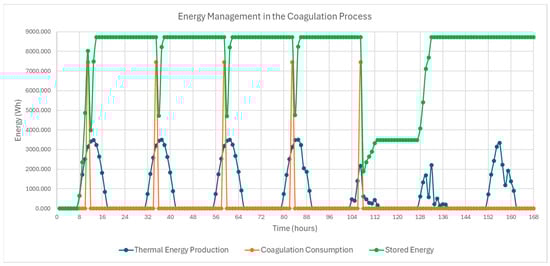
Figure 18.
System’s coagulation thermal energy management for test 2.
Analysis of Figure 18 indicates that, although the coagulation process required more thermal energy in this experiment compared to case 1, due to the increased cheese production, the solar collectors were still sufficient to meet the energy demand throughout the study period. However, the system’s thermal storage capacity for coagulation (8720.8 Wh) approached the total heat demand. This indicates that any future increase in production volume may require both an expansion of thermal storage and the addition of solar collectors to ensure sufficient thermal energy availability.
Regarding electricity costs from the national grid, these are expected to be lower than in case 1, since, as demonstrated in Figure 16, the system operated entirely on locally produced renewable energy. The corresponding grid electricity costs for this test are summarized in Table 8.
Table 8.
Costs of electricity grid under different tariffs for test 2.
As shown in Table 8, the lowest electricity cost from the national grid in this test was achieved using either the bi-hourly or tri-hourly tariff schemes, with values significantly lower than those observed in case 1.
Table 9 presents the feed-in tariff for energy exported to the grid, along with the biomass consumption and the corresponding operational cost of the cheese production unit during this study.
Table 9.
Operational cost for test 2.
A comparison between the operational costs of test 2 (Table 9) and test 1 (Table 7) reveals that, while test 1 yielded a net profit 0f EUR 0.8561, test 2 resulted in a net profit of EUR 3.6055. This positive balance is mainly attributed to the higher renumeration from the energy market price (OMIE), which reached 0.633 EUR/kWh during the studied period (3 to 9 February 2025). This value corresponds to approximately double the revenue from electricity sales in test 1. Although pellet consumption for pasteurization increased, driven by lower heat recovery from the desuperheater and the higher production volume, the system still maintained an overall profit.
The system’s CO2 equivalent emissions for this test were estimated at 2.061 kgCO2e, representing a reduction compared to test 1 (2.261 kgCO2e).
3.3. Comparison with the Prototype and Conventional Cheesemaking Facilities
To assess the practical viability of the cheese production unit under study, a comparative analysis was conducted between the operational costs and carbon footprint of the prototype system and those of selected conventional dairies listed in Table 2.
In modern dairy industries, thermal energy required for pasteurization and coagulation is typically supplied by natural gas, with firewood being used only in specific cases involving traditional or artisanal dairies [15,51]. Therefore, for this comparison, natural gas was considered the primary thermal energy source in conventional scenarios.
According to ERSE [52], the average industrial natural gas price in Portugal during the second half of 2024 was EUR 0.0510/kWh. The corresponding emission factor, as reported by the Portuguese Environment Agency [46], is 0.384 kgCO2e/kWh.
For electricity, the single tariff previously described was applied. In cases where detailed energy breakdowns were unavailable for the traditional dairies listed in Table 2, it was assumed, for simplification purposes, that the entire energy demand was met entirely through electricity.
Based on these assumptions, operational costs and equivalent CO2 emissions were calculated for conventional cheese production facilities. The results are summarized in Table 10, together with data from the two prototype scenarios analyzed.
Table 10.
Summary of operational costs and CO2 emissions for the prototype and traditional dairies.
Analysis of the operational costs and CO2 emissions presented in Table 10 reveals that the prototype consistently outperforms traditional cheese production facilities that do not integrate renewable energy sources.
The results demonstrate that the proposed system, which combines renewable energy for cheese production and preservation, offers significant economic advantages (profitability) as well as environmental benefits (reduced carbon footprint). This indicates strong potential for practical implementation, particularly for being in alignment to EU and Portuguese climate targets, and for promoting cheese production in remote or rural areas with limited access to the national power grid.
Additionally, a comparison was carried out between the experimental results of the prototype and the outputs generated by the simulation tool developed in this study, focusing on the system’s electrical energy management. Although the prototype only monitors electrical parameters, it has been verified that the thermal processes (pasteurization and coagulation) reach the required operational temperatures.
Figure 19 presents the electrical energy management results obtained from the prototype installed at the Polytechnic Institute of Beja for the month of May 2025.
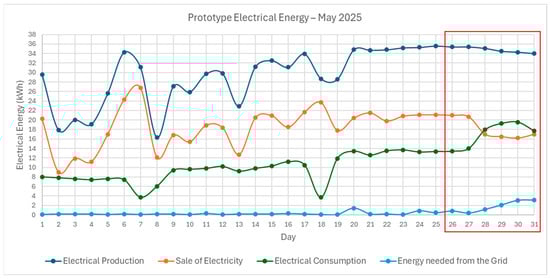
Figure 19.
Electrical energy management of the prototype for May 2025; the red box indicates the analyzed period.
A comparison between the experimental results from the prototype (Figure 19) and the simulation outputs (Figure 11), reveals discrepancies in the amount of renewable energy generated, and consequently, in the energy exported to the grid. These differences can be attributed to the simulation tool relying on historical solar radiation and wind speed data, as more recent records were unavailable. Additionally, the simulation assumes optimized fixed-mount photovoltaic panels orientation and tilt based on recommendations from the European Commission’s Photovoltaic Geographical Information System [47], whereas the prototype used a different installation configuration.
Despite this, the values related to electricity drawn from the national grid are quite consistent between the simulation and the experimental data, as further illustrated in Figure 20. The average, in Figure 20, excludes data from 26 May, as the simulation tool considers this the prototype’s first operational day, without prior battery energy storage, while the experimental data reflects a battery already charged and capable of meeting electrical demands.
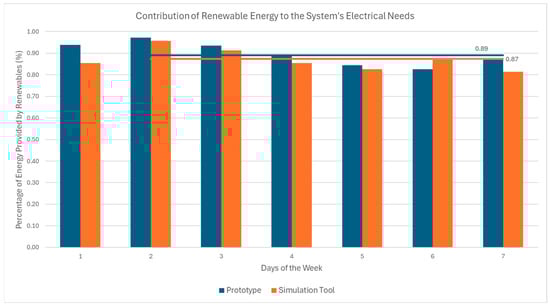
Figure 20.
Comparison of the share of renewable energy in supplying the system’s electrical demand between the prototype and the simulation model.
This comparative analysis indicates that, although the exact values of electrical generation and energy export to the grid cannot be precisely determined, the simulation tool effectively represents the prototype’s electrical energy management. It accurately captures the relative contributions of renewable sources and grid electricity to the cheese production unit’s demand, with a mean error of only 2.3%.
4. Conclusions
Cheese production is a major component of both the Portuguese and European food industries; however, it remains highly energy-intensive and largely dependent on grid electricity and fossil fuels. To address this challenge, a simulation tool was developed to optimize energy management in a cheese production unit integrating renewable energy sources, improving self-sufficiency while ensuring compliance with European and Portuguese energy transition goals. This approach also promotes sustainable cheese production in remote or rural regions with limited grid access.
The simulation tool was designed based on a prototype dairy unit equipped with photovoltaic panels, a wind turbine, solar collectors, and a pellet boiler. Phase Change Materials (PCMs) were also incorporated into the ripening chamber to stabilize temperature conditions. Two operating scenarios were evaluated for the prototype installed at the Polytechnic Institute of Beja, considering different periods of the year.
By simulating the two operating scenarios and subsequently comparing the results with experimental prototype data and values reported for traditional cheesemaking facilities in the literature, it was possible to demonstrate the technical, economic, and environmental performance of the proposed system:
- The prototype achieved full electrical self-sufficiency in winter and nearly reached it in summer, while fully meeting thermal energy requirements.
- The system demonstrated economic viability, generating profit in both scenarios and presenting low CO2 emissions.
- Compared to traditional cheesemaking facilities, the prototype operated with no operational energy costs, reinforcing its economic and environmental advantages.
- The simulation tool proved highly accurate, with only 2.3% deviation from experimental renewable energy data.
- The validated model reliably represents the system’s energy management and can therefore support feasibility assessments for similar renewable-powered cheesemaking units in other regions.
However, there are some limitations associated with the developed simulation tool. The use of Excel for its implementation presents challenges in terms of presenting calculations clearly and limits its applicability to more complex systems. Furthermore, the tool was specifically designed for a particular type of renewable energy integration to allow comparison with the prototype installed in Beja. Consequently, its use is currently restricted to similar renewable-powered cheesemaking units, excluding other forms of renewable energy generation.
Accordingly, future work will focus on expanding the tool to include predictive energy control, scalability to other dairy processes, and long-term optimization of hybrid renewable configurations. Additionally, transitioning to a more suitable software platform could remove existing implementation limitations and enhance the tool’s applicability.
Author Contributions
Conceptualization, J.M. and J.G.; methodology, J.M., J.G. and T.T.; validation, J.M.; formal analysis, J.M. and J.G.; data curation, J.M.; writing—original draft preparation, T.T.; writing—review and editing, J.M., J.G. and T.T.; visualization, J.M.; supervision, J.M. and J.G.; project administration, J.G. and J.M.D.; Funding acquisition, J.M.D. All authors have read and agreed to the published version of the manuscript.
Funding
The present work was co-financed by the EU Recovery and Resilience Plan (RRP), under the project “CASEUS: Combined use of renewAble energy sources to improve energy efficiency in cheeSE indUStry” (RRP-C05-i03-I-000249).
Institutional Review Board Statement
Not applicable.
Informed Consent Statement
Not applicable.
Data Availability Statement
Data is contained within the article.
Acknowledgments
Gratitude is expressed for the valuable administrative and technical contributions provided by colleagues during the development of this work.
Conflicts of Interest
The authors declare no conflicts of interest.
Abbreviations
The following abbreviations are used in this manuscript:
| EU | European Union |
| PDO | Protected Designation of Origin |
| PGI | Protected Geographical Indication |
| LTLT | Low Temperature, Long Time |
| HTST | High Temperature, Short Time |
| UHT | Ultra High Temperature |
| SEC | Specific Energy Consumption |
| LRM | Liters Raw Milk |
| RED III | Renewable Energy Directive |
| CNR | Carbon Neutrality Roadmap |
| PRR | Recovery and Resilience Plan |
| PCM | Phase Change Material |
| BTN | Low Voltage |
| BTE | Extra-Low Voltage |
| ERSE | Energy Services Regulatory Authority |
| OMIE | Iberian Electricity Market Operator |
| CO2 | Carbon Dioxide |
| PVGIS | Photovoltaic Geographical Information System |
| COP | Coefficient of Performance |
| HVAC | Heating, Ventilation, and Air Conditioning |
References
- Diaconescu, M.; Marinas, L.E.; Marinoiu, A.M.; Popescu, M.F.; Diaconescu, M. Towards renewable energy transition: Insights from bibliometric analysis on scholar discourse to policy actions. Energies 2024, 17, 4719. [Google Scholar] [CrossRef]
- Ladha-Sabur, A.; Bakalis, S.; Fryer, P.J.; Lopez-Quiroga, E. Mapping energy consumption in food manufacturing. Trends Food Sci. Technol. 2019, 86, 270–280. [Google Scholar] [CrossRef]
- FoodDrinkEurope. Data & Trends of the EU Food and Drink Industry—2024 Edition; FoodDrinkEurope: Brussels, Belgium, 2024; Available online: https://www.fooddrinkeurope.eu/wp-content/uploads/2025/01/FoodDrinkEurope-Data-Trends-2024.pdf (accessed on 15 October 2025).
- FoodDrinkEurope. Economic Bulletin—Q1 2024; FoodDrinkEurope: Brussels, Belgium, 2024; Available online: https://www.fooddrinkeurope.eu/wp-content/uploads/2024/07/FoodDrinkEurope-Economic-Bulletin-Q1-2024.pdf (accessed on 15 October 2025).
- Eurostat. Key Figures on the European Food Chain—2023 Edition; Publication Office of the European Union: Luxembourg, 2024. [Google Scholar] [CrossRef]
- Nunes, J.; Silva, P.D.; Andrade, L.P.; Gaspar, P.D.; Cuce, P.M.; Cuce, E.; Yilmaz, Y.N. Energy efficiency in Portuguese traditional cheese industries: A comprehensive case study. Energies 2025, 18, 562. [Google Scholar] [CrossRef]
- Bakalis, S.; Malliaroudaki, M.I.; Hospido, A.; Guzman, P. State-of-the Art in Energy Use and Sustainability of the Dairy Industry. Protect, Deliverable D5.1; Horizon 2020 Itn Protect. 2019. Available online: https://ec.europa.eu/research/participants/documents/downloadPublic?documentIds=080166e5cab758ff&appId=PPGMS (accessed on 15 October 2025).
- European Commission. Short-Term Outlook for EU Agricultural Markets in 2023; Directorate-General for Agriculture and Rural Development: Brussels, Belgium, 2023; Available online: https://agriculture.ec.europa.eu/system/files/2023-04/short-term-outlook-spring-2023_en.pdf (accessed on 15 October 2025).
- Araújo-Rodrigues, H.; Tavaria, F.K.; dos Santos, M.T.P.G.; Alvarenga, N.; Pintado, M.M. A review on microbiological and technological aspects of Serpa PDO cheese: An ovine raw milk cheese. Int. Dairy J. 2020, 100, 104561. [Google Scholar] [CrossRef]
- Santos, J.M.; Garcia, J.M.; Dias, J.; Martins, J.C.; Alvarenga, N.; Gonçalves, E.M.; Freitas, D.; Silvério, K.; Fernandes, J.; Gomes, S.; et al. Energy sustainability in the ripening of traditional cheese: Renewable energy sources and internet of things based energy monitoring. Dairy 2025, 6, 63. [Google Scholar] [CrossRef]
- National Institute of Statistics (INE). Human Consumption of Milk and Dairy Products Per Capita; INE: Lisbon, Portugal, 2025; Available online: https://www.ine.pt/xportal/xmain?xpid=INE&xpgid=ine_indicadores&indOcorrCod=0000214&contexto=bd&selTab=tab2&xlang=pt (accessed on 15 October 2025).
- Alvarenga, N.; Gomes, S.; Duarte, M.F.; Martins, A.P.L. The Importance of qualified cheeses within the scope of the CFD4CHEESE Project. In Application of Computational Fluid Mechanics and Remote Monitoring in Traditional Cheese Factories, 1st ed.; Dias, J., Duarte, M.F., Garcia, J., Lidon, F., Alvarenga, N., Carvalho, G., Eds.; Instituto Politécnico de Beja: Beja, Portugal, 2020; pp. 5–38. [Google Scholar]
- Fox, P.F.; Guinee, T.P.; Cogan, T.M.; McSweeney, P.L.H. Fundamentals of Cheese Science, 2nd ed.; Springer: New York, NY, USA, 2017. [Google Scholar] [CrossRef]
- Friso, D.; Bortolini, L.; Tono, F. Exergetic analysis and exergy loss reduction in the milk pasteurization for Italian cheese production. Energies 2020, 13, 750. [Google Scholar] [CrossRef]
- Silvério, K.S.; Freitas, D.; Dias, J.M. Energy footprint of cheese: A critical review of the environmental impact and opportunities for sustainability. Appl. Sci. 2025, 15, 8072. [Google Scholar] [CrossRef]
- Costa, N.R.; Garcia, J. Applying design of experiments to a compression refrigeration cycle. Cogent Eng. 2015, 2, 992216. [Google Scholar] [CrossRef]
- Panny, J.; del Río, P. Renewable energy cooperation in Europe: Taking stock and looking forward. Energy Strateg. Rev. 2025, 61, 101820. [Google Scholar] [CrossRef]
- Presidency of the Council of Ministers. Resolution of the Council of Ministers No. 107/2019: Approves the Roadmap for Carbon Neutrality 2050. Diário da República, 1st Series, No. 123, 1 July 2019. Available online: https://diariodarepublica.pt/dr/detalhe/resolucao-conselho-ministros/107-2019-122777644 (accessed on 16 October 2025).
- Presidency of the Council of Ministers. Decree-Law No. 99/2024: Amends the Regulatory Framework for Renewable Energy. Diário da República, 1st Series, No. 234, 3 December 2024. Available online: https://diariodarepublica.pt/dr/detalhe/decreto-lei/99-2024-898705893 (accessed on 16 October 2025).
- Shi, Z.; Liang, F.; Pezzuolo, A. Renewable energy communities in rural areas: A comprehensive overview of current development, challenges, and emerging trends. J. Clean. Prod. 2024, 484, 144336. [Google Scholar] [CrossRef]
- Solanki, A.; Pal, Y. A comprehensive review to study and implement solar energy in dairy industries. J. Ther. Eng. 2021, 7, 1216–1238. [Google Scholar] [CrossRef]
- Solar Lactoceleiro 450. GoParity: Lisbon, Portugal. Available online: https://goparity.com/project/solar-lactoceleiro-450 (accessed on 16 October 2025).
- Panchal, H.; Patel, R.; Chaudhary, S.; Patel, D.K.; Sathyamurthy, R.; Arunkumar, T. Solar energy utilisation for milk pasteurisation: A comprehensive review. Renew. Sustain. Energy Rev. 2018, 92, 1–8. [Google Scholar] [CrossRef]
- Dabhi, S.K.; Patel, V.R.; Kumar, D.; Gunaprasad, K.; Manjunath, T.C.; Hassan, I.A.I.; Lakkimsetty, N.R.; Shaik, F.; Natrayan, L. Application of solar thermal collectors for milk pasteurization to explore the potential of renewable energy in the dairy sector: Challenges and possibilities. Appl. Chem. Eng. 2024, 7. [Google Scholar] [CrossRef]
- Masera, K.; Tannous, H.; Stojceska, V.; Tassou, S. An investigation of the recent advances of the integration of solar thermal energy systems to the dairy processes. Renew. Sustain. Energy Rev. 2023, 172, 113028. [Google Scholar] [CrossRef]
- Janošovský, J.; Marková, E.; Kačmárová, A.; Variny, M. Green dairy plant: Process simulation and economic analysis of biogas use in milk drying. Processes 2020, 8, 1262. [Google Scholar] [CrossRef]
- Pérez Uc, D.A.; de León Aldaco, S.E.; Aguayo Alquicira, J. Trends in Hybrid Renewable Energy System (HRES) Applications: A Review. Energies 2024, 17, 2578. [Google Scholar] [CrossRef]
- Masera, K.; Stojceska, V.; Tannous, H.; Tassou, S. Technoeconomic and environmental potential of solar thermal energy integration to dairy processes: A case study. SSRN 2024, 4693792. [Google Scholar] [CrossRef]
- Araújo, C.S.; Vimercati, W.C.; Macedo, L.L.; Lima, R.R.; Sant’Ana, C.T.; de Paula, S.C.S.E.; Santos, M.F.; de Souza, H.L.S.; Martins, P.H.A.; Fonseca, H.C.; et al. Thermal Processing of Milk: Thermization, Pasteurization, and UHT. In Food Science and Technology, 1st ed.; Andrade, D.F., de Souza, A.A., Oliveira, E.J., Lopes, J.E.F., Neves, O.F., de Lima, L.C., Filho, N.F., de Oliveira, V.A., Eds.; Poisson: Belo Horizonte, Brazil, 2021; Volume 12, pp. 28–33. [Google Scholar] [CrossRef]
- Dias, J.; Pires, M.C.; Carvalho, G.; Ferreira, P.; Santos, R.; Rodrigues, F.M.; Teixeira, N.; Alvarenga, N. Description of the cheese dairies in the regions of Serpa, Évora, and Azeitão. In Application of Computational Fluid Mechanics and Remote Monitoring in Traditional Cheese Factories, 1st ed.; Dias, J., Duarte, M.F., Garcia, J., Lidon, F., Alvarenga, N., Carvalho, G., Eds.; Instituto Politécnico de Beja: Beja, Portugal, 2020; pp. 39–57. [Google Scholar]
- Xu, T.; Flapper, J.; Kramer, K.J. Characterization of energy use and performance of global cheese processing. Energy 2009, 34, 1993–2000. [Google Scholar] [CrossRef]
- Nunes, J.; Silva, P.D.; Andrade, L.P.; Domingues, C.; Gaspar, P.D. Opportunities for the energy efficiency improvement in the dairy food sector—The case study of Portuguese traditional cheese industries. In Proceedings of the ICR 2015—International Conference on Refrigeration, Yokohama, Japan, 16–22 August 2015. [Google Scholar]
- Andrade, L.P.; Silva, P.D.; Domingues, C.; Gaspar, P.D.; Nunes, J. Energy efficiency in cheese manufacturing industries of Beira Interior. In I Congresso Nacional das Escolas Superiores Agrárias; Instituto Politécnico: Bragança, Portugal, 2015. [Google Scholar]
- van Middelaar, C.E.; Berentsen, P.B.M.; Dolman, M.A.; de Boer, I.J.M. Eco-efficiency in the production chain of Dutch semi-hard cheese. Livest. Sci. 2011, 139, 91–99. [Google Scholar] [CrossRef]
- Gosalvitr, P.; Cuellar-Franca, R.; Smith, R.; Azapagic, A. Energy demand and carbon footprint of cheddar cheese with energy recovery from cheese whey. Energy Procedia 2019, 161, 10–16. [Google Scholar] [CrossRef]
- Berlin, J. Environmental life cycle assessment (LCA) of Swedish semi-hard cheese. Int. Dairy J. 2002, 12, 939–953. [Google Scholar] [CrossRef]
- Riva, A.D.; Burek, J.; Kim, D.; Thoma, G.; Cassandro, M.; De Marchi, M. The environmental analysis of Asiago PDO cheese: A case study from farm gate-to-plant gate. Ital. J. Anim. Sci. 2018, 17, 250–262. [Google Scholar] [CrossRef]
- Sander, L.; Jung, C.; Schindler, D. Global Review on environmental impacts of onshore wind energy in the field of tension between human societies and natural systems. Energies 2024, 17, 3098. [Google Scholar] [CrossRef]
- Mika, Ł.; Radomska, E.; Sztekler, K.; Gołdasz, A.; Zima, W. Review of selected PCMs and their applications in the industry and energy sector. Energies 2025, 18, 1233. [Google Scholar] [CrossRef]
- Popa, G.N.; Diniș, C.M.; Popa, I. Low-cost automatic power factor controller system for three-phase low-voltage capacitor bank regulation. Energies 2024, 17, 1363. [Google Scholar] [CrossRef]
- ERSE—Portuguese Energy Services Regulatory Authority. Tariffs and Prices—Electricity. Available online: https://www.erse.pt/en/activities/market-regulation/tariffs-and-prices-electricity/ (accessed on 23 October 2025).
- ERSE—Portuguese Energy Services Regulatory Authority. Electricity Tariff Tables in Force as of 1st January 2025. Available online: https://www.erse.pt/media/ipboeq4k/s_tarifas_net.xlsx (accessed on 23 October 2025).
- Nunes, L.J.R.; Casau, M.; Dias, M.F. Portuguese wood pellets market: Organization, production and consumption analysis. Resources 2021, 10, 130. [Google Scholar] [CrossRef]
- Jesus, F. Pellets Price: Market Trends and Forecasts. Portal Energia, 19 October 2024. Available online: https://www.portal-energia.com/preco-pellets-tendencias-previsoes-mercado/ (accessed on 16 October 2025).
- OMIE—Iberian Energy Market Operator. Day-Ahead Price. Available online: https://www.omie.es/en/market-results/daily/daily-market/day-ahead-price (accessed on 16 October 2025).
- Portuguese Environment Agency (APA). Electricity Emission Factor—2025. Available online: https://apambiente.pt/sites/default/files/_Clima/Inventarios/20250808/fe_gee_eletricidade_2025_final_apc.pdf (accessed on 16 October 2025).
- European Commission—Joint Research Centre (JRC). Photovoltaic Geographical Information System (PVGIS). Available online: https://re.jrc.ec.europa.eu/pvg_tools/en/ (accessed on 16 October 2025).
- SolaX Power. SolaX Cloud User Center. Available online: https://www.solaxcloud.com/user-center/ (accessed on 16 October 2025).
- Garcia, J.; Semedo, A. Sustainable CO2 refrigeration system for fish cold storage facility using a renewable integrated system with solar, wind and tidal energy for Cape Verde—Analyzing scenarios. Sustainability 2024, 16, 4259. [Google Scholar] [CrossRef]
- SWEP International. Technical Handbook for Refrigerant Applications; SWEP International: Landskrona, Sweden, 2023; Available online: https://echangeur-a-plaques.fr/wp-content/uploads/2023/08/AXINTRA_SWEP_RefrigerantHandbook_EN.pdf (accessed on 16 October 2025).
- Shine, P.; Upton, J.; Sefeedpari, P.; Murphy, M.D. Energy consumption on dairy farms: A review of monitoring, prediction modelling, and analyses. Energies 2020, 13, 1288. [Google Scholar] [CrossRef]
- ERSE—Portuguese Energy Services Regulatory Authority. Gas Bulletin—Eurostat 2024 S2. Available online: https://www.erse.pt/media/jecpa41a/boletim-g%C3%A1s-eurostat_2024s2.pdf (accessed on 23 October 2025).
Disclaimer/Publisher’s Note: The statements, opinions and data contained in all publications are solely those of the individual author(s) and contributor(s) and not of MDPI and/or the editor(s). MDPI and/or the editor(s) disclaim responsibility for any injury to people or property resulting from any ideas, methods, instructions or products referred to in the content. |
© 2025 by the authors. Licensee MDPI, Basel, Switzerland. This article is an open access article distributed under the terms and conditions of the Creative Commons Attribution (CC BY) license.