Abstract
As global water scarcity intensifies, this study proposes a solution by utilizing surplus heat from a diesel generator set to enhance freshwater production through a waste heat recovery (WHR) system. The system is simulated and optimized using Engineering Equation Solver (EES) to improve freshwater production efficiency. Results indicate that the WHR system can produce 13.9 million liters (ML) of freshwater annually, with a payback period of 4.63 years for freshwater alone, confirming strong viability. In addition, the system can generate 160,000 kWh of electricity, which reduces the combined payback period to 2.12 years. Key design constraints include maintaining a minimum exhaust pressure of 100 kPa (absolute) and placing the WHR system along the gen-set’s long side. These requirements demand a compact design with a minimum pinch temperature of 20 K. The system’s main components are aligned with the gen-set, resulting in a total footprint of 60.5 m2 and a system weight of 25 tons, compared with 8.52 m2 and 12.6 tons for the generator.
1. Introduction
The rapid growth of the global population has intensified freshwater scarcity worldwide. Waste heat recovery (WHR) systems offer a potential solution by producing freshwater from sea or brackish water [,,,]. When combined with diesel engines, WHR systems can also mitigate global warming and reduce fuel consumption through simultaneous power and freshwater generation [,,]. Diesel engines, with their significant energy losses and fuel costs, are well-suited for WHR integration [,,,]. Such systems enable the capture of wasted energy, delivering dual outputs—freshwater and additional power—thereby enhancing efficiency and sustainability [,,,].
To reduce social impact, various methods have been developed to address freshwater scarcity, including solar desalination systems []; hybrid adsorption desalination systems integrated with solar PV/T collectors []; hybrid reverse osmosis/adsorption-based distillation systems []; solar dish/Stirling power systems combined with single-effect desalination []; and membrane distillation hybrids []. The freshwater production of the SDSE/RO-ADS system has increased to up to 3000 m3/year, compared to 1700 m3/year for a standalone RO system. Additionally, the daily specific electricity consumption has been reduced from 5.20 to 4.40 kWh/m3. The cost per cubic meter of water for the RO-ADS/SDSE system is USD 1.54, representing a 3.75% reduction compared to the conventional RO system.
In a study conducted by Maheswari et al. [], it is demonstrated that thermal desalination is feasible by harnessing waste heat energy generated from the exhaust of a low-capacity 5 HP diesel engine. The evaporation process in this system does not require an external energy source as it uses waste heat from the engine. It utilizes a condensing unit and a submerged horizontal tube straight-pass evaporator. Performance analysis under various load conditions suggests that 1.8 L per hour of saline water can be desalinated using the exhaust heat, with no observed adverse effects on engine performance. The utilization of wasted exhaust heat significantly reduces thermal pollution and enhances overall efficiency. In another study by Panchal et al., [] research has been conducted on a waste heat recovery system coupled with a low-capacity desalination system. The desalination setup comprises an integrated water-cooled condenser and a single-pass evaporator. Experiments were carried out on a 10 HP diesel engine under different loads. The results indicate the production of 4.2 L per hour of potable water with no discernible impact on the engine performance. According to Wang et al., in a ship diesel engine, only 40–50% of the fuel energy can be converted into mechanical energy, with the rest being lost as heat. This heat is dissipated through cooling water and exhaust gas. A waste heat utilization device designed for a marine diesel engine, which extracts heat from high-temperature exhaust gas, has successfully generated freshwater. The waste heat recovery system not only enhances the efficiency of a marine diesel engine but also lowers maintenance costs by providing additional protection to flanges and valves exposed to high-temperature steam [,,]. In the study conducted by Colak et al., the focus was on assessing the potential for fuel savings and the reduction of CO2 emissions through waste heat recovery, specifically by pre-heating the main engines while in port. The necessity of pre-heating ship engines arises from the requirement for a warm engine in stationary ships at the port, ensuring that engine dimensional tolerances remain within the specification limit. The study employed an energy and exergy analysis, utilizing a waste heat recovery system with a triple heat exchanger arrangement and the exhaust gas from the ship’s diesel generator. Freshwater generation cycles were thoroughly examined. The simulations conducted using Matlab 2021a and Python version 3.14.0 indicated that, even at the diesel generator’s lowest operating load of 25%, the pre-heating of the ship’s main engines was sufficient to generate freshwater, resulting in observed reductions in fuel consumption. The study’s findings concluded that, during a 12 h period at the port, a fuel saving of 0.0853 kg/h could be achieved for every 1 kW in freshwater production. Consequently, approximately 273 kg of CO2 could be reduced for every 1 kW of heat energy obtained [].
In the study by Toelkes (1987), the desalination plant analyzed is located in Ebeye, part of the Marshall Islands []. Waste heat is recovered from a nearby diesel generation station situated adjacent to the plant. The facility employs a low-temperature multi-effect distillation (LT-MED) unit with polyphosphate feed pretreatment. The diesel station operates at an average load of approximately 3.2 MW, powered by two 2.4 MW diesel engines, with a third engine available to meet increased demand. Heat is recovered from various sources, including exhaust gases, jacket cooling water, lubricating oil, and compressed air after-coolers. The paper evaluates both the water production capacity and the power generation potential of the heat recovery system, offering insights into the performance and cost-effectiveness of seawater desalination. Waste heat recovery is facilitated through titanium plate-type heat exchangers, which provide excellent corrosion resistance and effective recovery of low-grade heat. When the diesel engines operate at full capacity, the boilers produce 4700 lbs/hr of steam at 50 psi. Additionally, economizers are integrated to improve thermal efficiency. Performance data were collected at varying generator loads using a single engine. At loads of 1.36 MW and 1.89 MW, the desalination unit achieved water production rates of 18 and 31 cubic meters per hour, respectively.
The study by Michels (1987) provides a detailed analysis of the St. Maarten desalination facility, located in the Caribbean Sea []. The plant utilizes a multiple-effect distillation (MED) process, which results in lower energy consumption compared to the multi-stage flash (MSF) distillation process. Additionally, the MED system requires lower capital investment. The MED process is further enhanced by integration with a vapor compression cycle, known as the ejecto-compression process, which uses a steam jet compressor. This combined approach further reduces both energy consumption and investment costs, making it particularly well-suited for recovering waste heat from diesel generator exhaust gases. The desalination unit also incorporates an automatic control valve that maintains constant boiling pressure, adapting to variations in generator load. This allows steam production to adjust in response to the energy available from the generator, ensuring that the boiler operates at a sufficiently high temperature to prevent condensation on the exhaust gas side. The plant produces approximately 450 cubic meters of distillate per day at a generator load of 2.25 MW, with a specific heat consumption of 55 kcal/kg.
Thermoelectric generators (TEGs) comprise pairs of p-type and n-type semiconductor materials that generate electricity from a temperature gradient—typically between a hot exhaust gas stream and ambient air. Due to their compact size, absence of moving parts, and minimal maintenance requirements, TEGs are well-suited for vehicular applications []. In contrast, waste heat recovery (WHR) systems are larger, heavier, and better suited for stationary power units, ships, and locomotives. Although WHR systems require additional components such as pumps and cooling towers—resulting in higher maintenance costs—they achieve higher thermal efficiencies, often exceeding 10%, compared to the typical 5–8% efficiency of TEGs [,].
This research involves modifying various parameters of the heat exchangers, such as the diameter, thickness, and length of the tubes and shell, to optimize the production of freshwater and additional electricity. Additionally, attention is given to evaluating the space requirements and weight for retrofitting the waste heat recovery (WHR) system, taking into account insights from previous research that highlighted the system’s tendency to be both large and heavy [,]. Care is also taken to manage the exhaust pressure from the WHR system to avoid any additional back pressure. The minimum temperature difference between the hot and cold fluids is maintained at 20 K or more to ensure effective heat transfer. These aspects are often overlooked in various studies. Therefore, it is anticipated that the findings from this study will contribute to the existing knowledge on incorporating WHR systems into internal combustion engines. Beyond these technical considerations, the study methodology includes a comprehensive Cost–Benefit analysis. The overarching goal is to develop a sustainable and efficient waste heat recovery system by minimizing costs and reducing the payback period. The shortcomings of previous research by various authors include the lack of discussion on the dimensions of the heat exchangers, the total space requirements, and the overall weight of the WHR system. This research highlights these aspects and demonstrates their importance for successfully retrofitting WHR systems into diesel generators.
2. Modeling
This research focuses on designing a waste heat recovery system tailored for a 1.1 MW diesel generator set. At the rated power of this generator set, the exhaust flow rate is 3.111 kg/s, at a temperature of 450 °C. The exhaust gas, characterized by these flow rate and temperature values, undergoes a sequence of stages in the WHR system: first passing through the superheater, then entering the boiler, and ultimately reaching the economizer. Finally, exhaust gas is expelled into the atmosphere. The superheated steam at 2 bar is expanded to 1.2 bar in a steam turbine to produce freshwater and additional power or in the expansion valve for the production of freshwater only.
The primary equations essential for calculating the WHR system include overall energy and mass balance, heat transfer, evaporation, condensation, frictional losses, pressure drops, and heat losses. For a comprehensive understanding of these equations, one can refer to the authors’ prior publications [,,]. The solution to all these equations is achieved through simultaneous and iterative processes utilizing the Engineering Equation Solver (EES) software version 10.444-3D. Various parameters of the heat exchangers are given in Appendix A, with the selected design highlighted.
The Rankine cycle is depicted on the temperature–entropy diagram shown in Figure 1, commonly known as the T-s diagram. The processes involved are described as follows:
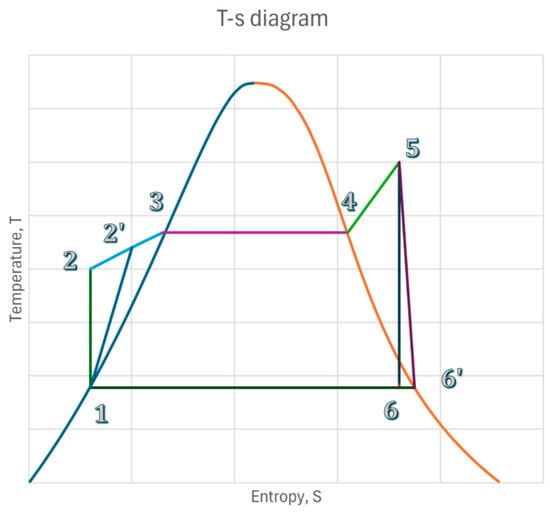
Figure 1.
T-s diagram of Rankine cycle.
- Process 1 to 2: Ideal adiabatic compression;
- Process 1 to 2′: Actual compression;
- Process 2′ to 3: Isobaric heating;
- Process 3 to 4: Constant temperature and pressure boiling;
- Process 4 to 5: Isobaric superheating;
- Process 5 to 6: Ideal expansion;
- Process 5 to 6′: Actual expansion;
- Process 6′ to 1: Constant temperature and pressure condensation.
The WHR system comprises eight components as outlined below, and Figure 2 shows the schematic diagram of the WHR system. The components are
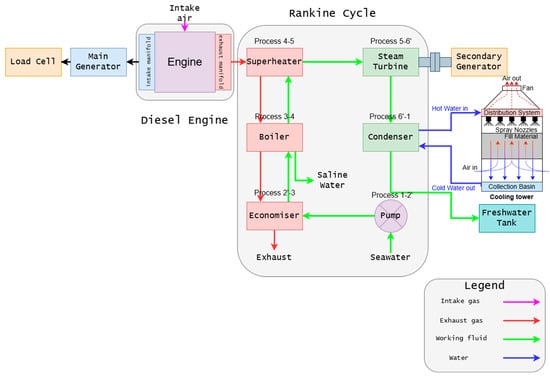
Figure 2.
Schematic diagram of the WHR system.
- Economizer;
- Boiler;
- Superheater;
- Steam expander (or expansion valve);
- Condenser (integrated into a single heat exchanger with a sub-cooler);
- Pumps;
- Cooling tower;
- Freshwater tank.
3. Results and Discussion
In the heat exchangers, increasing the number of tubes divides the exhaust flow among more tubes, thereby reducing the flow velocity in each individual tube. This decrease subsequently reduces the Reynolds and Nusselt numbers, resulting in decreased internal convective heat transfer coefficients. Conversely, design with more tubes increases the fluid velocity inside the shell, which increases the Reynolds and Nusselt numbers, thereby increasing the outside convective heat transfer coefficients. Despite the pipe material’s constant thermal conductivity and consistent fouling of internal and external resistances, the overall heat transfer coefficients decline. A shorter shell length results from a decrease in tube length caused by an increase in the number of tubes, reducing the dominance of internal heat transfer losses. As the engine’s exhaust gas flows through the heat exchangers, maintaining low back pressure is crucial to achieve an exhaust pressure from the WHR system to around 100 kPa absolute or 203.3 kPa gauge pressures. The pinch temperature between the hot and cold fluids inside the heat exchangers is maintained at 20 K or more to facilitate effective heat transfer. The model of the gen-set is CAT 3516, with dimensions of length, width, and height of 4.913 × 1.736 × 1.940 m, respectively, and the overall weight of the gen-set is approximately 12.549 tons. The main heat exchangers are placed along the 5 m side of the diesel-gen-set, arranged in a parallel manner. The aspect ratio, defined as the length of the shell divided by its diameter, is maintained at around 3 to reduce the required space. A 3D layout presented in later sections illustrates the WHR system and the placement of its main components relative to the diesel-gen-set.
3.1. Superheater
Superheating the steam in the superheater to 133.2 °C at a pressure of 2 bar is essential. This precaution is critical to guarantee that the steam remains dry saturated even after the expansion to 1.2 bar (points 5–6′ in Figure 1), preventing condensation in the turbine and potential damage to the blades. The superheater weight experiences an initial increase with the number of tubes, reaching its peak at 37 tubes, and subsequently decreases with additional tubes, as illustrated in Figure 3a. Concurrently, the exhaust pressure in the WHR system increases with an augmented number of tubes, as shown in the same figure. In Figure 3b, the pressure drops in the shell rise, while the pressure losses in the superheater decrease with an increase in the number of tubes. At 2 bar, the overall heat transfer coefficients (Uo) for 7, 19, 37, 61, and 91 tubes are 26.35, 17.77, 10.08, 9.188, and 9.424 (W/m2K), respectively.
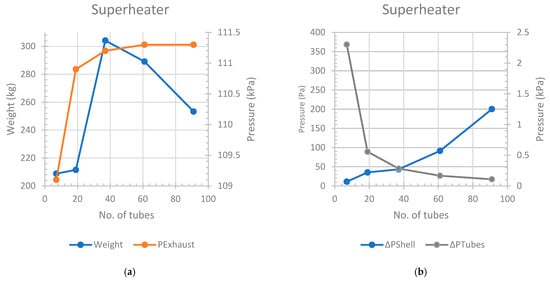
Figure 3.
Superheater. (a) No. of tubes vs. weight and pressure in the superheater (b) No. of tubes vs. ΔPTubes and ΔPShell in the superheater.
Opting for 37 tubes at 2 bar results in a weight of 304.2 kg, an absolute exit pressure of 111.1 kPa from the WHR system, a length of 1.486 m, and an aspect ratio of 2.9. A tube number of 19 for the superheater is excluded due to its aspect ratio reaching 3.971, which surpasses the target of around 3. Although technically feasible, a heat exchanger with 61 superheater tubes requires more vertical space due to its aspect ratio of only 1.601. Additional information, including these values and other pertinent parameters, is provided in Table A1.
The Nusselt and Reynolds numbers of the shell exhibit an increasing trend, rising from 11,324 to 27,924 and from 82.88 to 165.2, respectively. For the chosen 37-tube superheater, the Nusselt number is 111.1, and the Reynolds number is 15,034. Conversely, the tubes’ Nusselt and Reynolds numbers show a decreasing trend from 13,383 to 1028 and from 48.62 to 5.727, respectively, with values of 7.459 and 2531 for the selected 37-tube superheater. Increasing the number of tubes reduces the internal convective heat transfer coefficient but enhances the shell-side convection coefficient. This leads to lower overall heat transfer coefficients and a larger heat exchanger size with higher heat losses, and vice versa.
3.2. Economizer
As shown in Figure 4a, increasing the number of tubes at 2 bar in the economizer leads to a simultaneous rise in both weight and exhaust pressure within the economizer. Figure 4b demonstrates an increase in pressure drop within the shell, coupled with a reduction in pressure drop across the tubes. Table A2 highlights the selection of 721 tubes for the economizer, with corresponding weight, exhaust pressure, length, and aspect ratio values of 10.712 tons, 111.2 kPa absolute pressure, 4.615 m, and 2.835, respectively. Conversely, configurations with 631 tubes exceed the aspect ratio of 3, and those with 817 tubes surpass the weight of a 721-tube economizer with an aspect ratio of 2.535, and are not recommended due to the requirement for increased lateral space and taller vertical height, respectively. The overall heat transfer coefficients (Uo) at 2 bar for 547, 631, 721, 817, and 919 tubes are detailed in Table A2 as 20.67, 19.25, 17.95, 16.74, and 15.64 (W/m2K), respectively. A lower Uo implies a requirement for a larger surface area to transfer the same amount of heat, necessitating an extended tube length and an increased shell length, and resulting in higher heat losses.
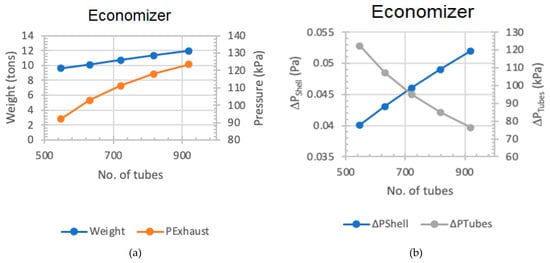
Figure 4.
Economizer. (a) No. of tubes vs. weight and pressure. (b) No. of tubes vs. ΔPTubes and ΔPShell.
For 547, 631, 721, 817, and 919 tubes within the economizer, the Reynolds numbers for the tubes are 12,238, 10,609, 9286, 8195, and 7285, respectively, while the Nusselt numbers for the tubes are 36.22, 32.21, 28.84, 25.96, and 23.48, respectively. A decreasing trend is observed for the Reynolds numbers and Nusselt numbers when the number of tubes increases. This behavior can be explained to gain a clearer understanding behind these values. As the number of tubes within the economizer increases, the exhaust flow is divided into a larger number of tubes, resulting in a reduction in exhaust flow velocity. As a result of this reduced velocity, the Reynolds and Nusselt numbers decrease. This reduced velocity additionally leads to reduced overall convective heat transfer coefficients, Uo.
3.3. Boiler
The economizer supplies the boiler with saline water containing 3.5% salt at 120.2 °C, which corresponds to the saturation temperature at 2 bar. In the boiler, this saline water is evaporated using heat from the exhaust gas after it passes through the superheater. Due to the increased salinity, approximately 16% of the concentrated brine is discharged, while the remaining 84% is converted into steam and directed to the superheater. At 2 bar, the latent heat of vaporization is 2202 kJ/kg.
At 2 bar, Figure 5a illustrates that an increase in the number of tubes corresponds to an increase in both the weight of the boiler and the exhaust pressure from the WHR system. Simultaneously, as illustrated in Figure 5b, an increase in the tube count results in a rise in pressure drops within the shell, accompanied by a decrease in pressure drops across the boiler tubes. Table A3 succinctly summarizes the outcomes at 2 bars, identifying 817 tubes as the optimal number for the boiler. The exit pressure at this configuration is 111.2 kPa absolute, with a length of 4.779 m and an aspect ratio of 2.941. The shell’s Nusselt and Reynolds numbers are 4.779 and 200.6, respectively. For the tubes, the Nusselt number decreases from 22.91 to 16.37, and the Reynolds number decreases from 7967 to 4894. For the chosen 817 tubes, the Nusselt number is 19.53 and the Reynolds number is 6154.
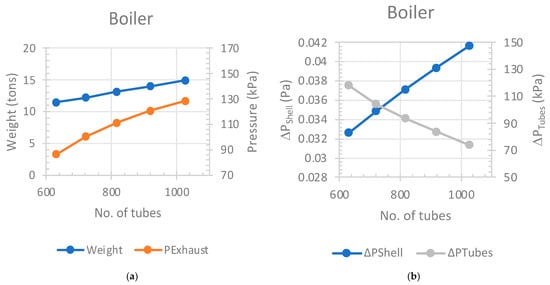
Figure 5.
Boiler. (a) No. of tubes vs. weight and pressure in boiler. (b) No. of tubes vs. ΔPTubes and ΔPShell in boiler.
3.4. Condenser and Sub-Cooler
Figure 6 shows the trend between the number of tubes within the combined condenser and sub-cooler heat exchangers and the total weight. Analysis of the graph indicates a downward trend in overall weight as the number of tubes increases. Therefore, in terms of weight, adding additional tubes to the design decreases the overall weight and consequently reduces manufacturing costs as less material is required. However, an opposing trend is observed when analyzing the number of tubes versus the total power required for the cooling liquid. An increase in the number of tubes negatively impacts the overall system by increasing the power needed to pump the cooling liquid. For 217 tubes, the total power needed for the cooling liquid is 504.2 W. Increasing the number of tubes to 469 results in a power requirement of 505.1 W. Consequently, as the number of tubes increases, overall system efficiency decreases, and annual running costs increase.
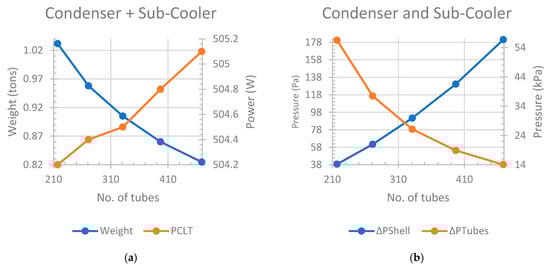
Figure 6.
Condenser and sub-cooler. (a) Number of tubes vs. weight and total power required for cooling liquid. (b) No. of tubes vs. ΔPTubes and ΔPShell.
For the final design, a combined condenser and sub-cooler heat exchanger with 331 tubes is chosen. Although the aspect ratio is 3.5, which is higher than the preferred value of 3, the heat exchanger’s length is 2.07 m, making it fit close to other heat exchangers, and is therefore acceptable. Heat exchangers with 397 tubes (1.70 m in length) and 469 tubes (1.42 m in length) are not chosen because their aspect ratios are below 3, which requires additional vertical space and more power for the cooling liquid. While heat exchangers with 271 and 217 tubes are technically feasible, their aspect ratios are much higher at 4.7 and 6.8, respectively. These heat exchangers also weigh slightly more, at 0.96 and 1.03 tons, respectively, compared to 0.91 tons for the optimally selected design. Therefore, a heat exchanger with 331 tubes adequately meets the criteria.
At an inlet pressure of 2 bar, expanding to 1.2 bar, the WHR system can produce 0.536 kg/s of freshwater, equating to 26.44 kL per day. This results in an annual production of 13.9 ML of freshwater with continuous 24/7 operation. Additionally, the system can generate 22.59 kW of electricity. After accounting for the 4.42 kW used by pumps and the cooling tower, 18.17 kW (or 160,000 kWh annually) can be sold to the main grid.
4. Layout of the WHR System
Figure 7 displays a scaled 3D diagram of the waste heat recovery (WHR) system alongside the diesel generator set. The diesel generator has a footprint of 8.52 m2 with a weight of 12.549 tons, while the WHR system occupies 60.5 m2 and weighs 25 tons. Key components of the WHR system, including the boiler and economizer, are arranged along the longer side of the generator. The superheater, steam turbine, and generator are positioned on top of the diesel generator, while the condenser with the sub-cooler, chimney, and pump are in front of the boiler and generator. The cooling tower is placed outside the room containing the diesel generator and WHR system to facilitate cooling by ambient air.
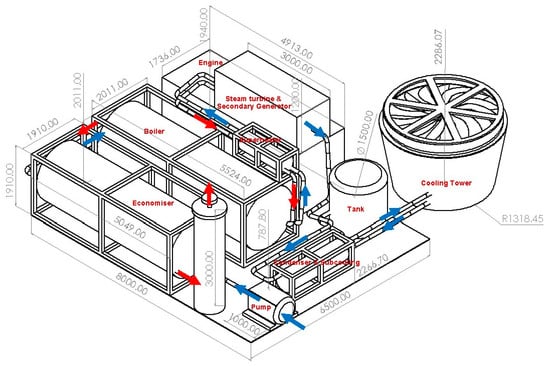
Figure 7.
Layout of the WHR system along with the diesel generator.
5. Cost–Benefit Analysis
Table 1 details the costs of various components of the WHR system at 2 bar for freshwater production only. In this project, a diesel generator operates year-round on ships and in remote areas of Australia. At 2 bar, the WHR system can produce 13.9 ML of freshwater annually when designed solely for freshwater production. For this purpose, the turbine is replaced by an inexpensive USD 1000 expansion valve instead of the costly USD 15,000 steam turbine. However, the USD 18,000 annual cost for running the pumps and cooling tower is added to the operational expenses for freshwater production. Panchal et al. conducted experiments on a 10 HP diesel engine under different loads []. The results indicate the production of 4.2 L of potable water per hour, equivalent to 0.579 L/h/kW, with no discernible impact on engine performance. In this study, the generator set has a capacity of 1.1 MW (1341 HP), which is 14.7 times greater than that of a 10 HP diesel engine. It produces 13.9 ML of water per year, or 1586 L per hour—equivalent to 1.44 L/h/kW. The higher specific yield of 1.44 L/h/kW is attributed to the optimization process.

Table 1.
Specifications and costs of various components of the WHR system for 2 bar using the expansion valve to produce freshwater only.
Table 2 details the costs of various components of the WHR system at 2 bar for freshwater production and additional power production together. For the configuration, the expansion valve is replaced by a steam turbine costing USD 15,000. This configuration results in an annual production of 13.9 ML of freshwater for 24/7 operation. Additionally, the system can generate 22.59 kW of electricity. After deducting the 4.42 kW used by pumps and the cooling tower, 18.17 kW or 160,000 kWh can be sold to the main grid. For combined freshwater and additional power, the steam turbine with a generator is assumed to power these devices, and the running cost of electricity is assumed to be zero.
Table 2.
Specifications and costs of various components of the WHR system for 2 bar using the turbine for the combined production of additional power and freshwater.
To assess the economic viability of the WHR system, Cost–Benefit analyses are conducted. Assuming a 12% interest rate applied to the capital cost, the WHR system is presumed to have a 5-year lifespan. Given the challenges associated with handling highly salinized seawater, maintenance expenses are projected to be approximately 50% of the principal cost (P) [,].
The Capital Recovery Factor (CRF) in Equation (1) is used to calculate the present value of a series of equal annual cash flows as detailed below [,]:
The Sinking Fund Factor (SFF) in Equation (2) is used to calculate the future value of such cash flows as detailed below []:
Component parts such as pipes, heat exchangers, and cooling towers, which are anticipated to have a lifespan of up to 20 years, are considered reusable. On the other hand, items such as control systems, expanders, the expansion valve, and pumps have relatively shorter life spans. The Annual Salvage Value (ASV) is determined by multiplying the Salvage Value (SV), representing 50% of reusable materials, by the Salvage Factor (SFF) as detailed below [,]:
Cooling towers and pumps collectively consume 4.42 kW of electricity which is provided by the WHR system for combined freshwater and additional power production. Therefore, the running cost is assumed to be zero. The Annual Maintenance Cost (AMC) is estimated at 50% of the capital cost (P), considering the challenges associated with managing high salinity water. Consequently, these expenses are combined to calculate the Annual Cost (AC) as detailed below [,]:
Table 3 and Table 4 outline the cost analysis for a desalination plant that produces freshwater only, and combined freshwater and additional power, respectively, by utilizing the exhaust heat from a diesel-gen-set, operating with a 2 bar inlet pressure to a steam turbine. The cost of freshwater is determined by dividing the Annual Cost (AC) by the Annual Yield (AY), resulting in a cost of USD 7.60 per kL (combined). The payback period for water production is approximately 4.63 years, while for combined water and power production, it is around 2.12 years. For freshwater production, the turbine is replaced by an inexpensive USD 1000 expansion valve instead of the expensive steam turbine worth USD 15,000. However, the cost of running the pumps and cooling tower of USD 18,000 is added to the annual running cost for freshwater production only. For combined freshwater and additional power, the steam turbine with a generator is assumed to power these devices, and the running cost of electricity is assumed to be zero.
Table 3.
Cost analysis of the WHR system for 2 bar producing freshwater only.
Table 4.
Cost analysis of the WHR system for 2 bar for combined freshwater and power productions.
6. Conclusions
This paper presents a waste heat recovery (WHR) system integrated with a diesel generator set (gen-set) to produce freshwater from saline or seawater while also generating surplus electricity for sale to the grid. Thermodynamic, fluid, and heat transfer equations are solved concurrently and iteratively using the Engineering Equation Solver (EES). The proposed WHR system can produce 13.9 million liters (ML) of freshwater annually and generate 160,000 kWh of electricity. A cost analysis shows a payback period of 4.63 years for freshwater production alone, which decreases to 2.12 years when electricity generation is included, demonstrating strong economic viability. However, the WHR system is considerably larger and heavier than the diesel gen-set, occupying a footprint of 60.5 m2 and weighing 25 tons, compared with 8.52 m2 and 12.6 tons for the generator. This substantial difference necessitates careful planning during retrofitting, with particular focus on minimizing footprint and optimizing layout. Overall, the system highlights the potential of WHR technology to address water scarcity while enhancing energy efficiency.
The current analysis is based primarily on steady-state simulation data, with limited experimental validation at full scale. The system performance may vary under transient engine loads or fluctuating ambient conditions, which were not considered in this study. Future research will focus on experimental validation of the proposed system under variable load conditions and different salinity levels. Further optimization of the heat exchanger design and control strategy will be explored to enhance overall efficiency.
Author Contributions
Conceptualization, S.B.; Methodology, W.Y.N. and S.B.; Software, W.Y.N. and S.B.; Investigation, W.Y.N., S.B., J.M.F. and H.; Data curation, W.Y.N. and S.B.; Writing—original draft, W.Y.N. and S.B.; Writing—review & editing, J.M.F. and H.; Supervision, S.B., J.M.F. and H.; Project administration, S.B. All authors have read and agreed to the published version of the manuscript.
Funding
This research received no external funding.
Data Availability Statement
The original contributions presented in this study are included in the article. Further inquiries can be directed to the corresponding author.
Conflicts of Interest
The authors declare no conflict of interest.
Appendix A
Table A1.
Scheme 2 bar.
Table A1.
Scheme 2 bar.
| No. of Tubes | Weight | ReTubes | ReShell | NusseltTubes | NusseltShell | Length of Shell | Shell Diameter | Aspect Ratio | Uo | Exhaust Pressure |
|---|---|---|---|---|---|---|---|---|---|---|
| (Tons) | (m) | (W/m2K) | (kPa) | |||||||
| 7 | 0.2088 | 13,383 | 11,324 | 48.62 | 82.88 | 3.029 | 0.3091 | 9.797 | 26.35 | 109.1 |
| 19 | 0.2115 | 4926 | 16,228 | 19.1 | 112.7 | 1.632 | 0.4109 | 3.971 | 17.77 | 110.9 |
| 37 | 0.3042 | 2531 | 15,034 | 7.459 | 111.1 | 1.486 | 0.5126 | 2.9 | 10.08 | 111.2 |
| 61 | 0.2891 | 1534 | 20,018 | 5.67 | 134.1 | 0.9836 | 0.6143 | 1.601 | 9.188 | 111.3 |
| 91 | 0.2533 | 1028 | 27,924 | 5.727 | 165.2 | 0.6374 | 0.7161 | 0.8901 | 9.424 | 111.3 |
Table A2.
Specifications of various components of economizer at 2 bar.
Table A2.
Specifications of various components of economizer at 2 bar.
| No. of Tubes | Weight | ReTubes | ReShell | NusseltTubes | NusseltShell | Length of Shell | Shell Diameter | Aspect Ratio | Uo | Exhaust Pressure |
|---|---|---|---|---|---|---|---|---|---|---|
| (Tons) | (m) | (W/m2K) | (kPa) | |||||||
| 547 | 9.596 | 12,238 | 122.9 | 43.67 | 4.615 | 5.539 | 1.51 | 3.668 | 20.67 | 92.07 |
| 631 | 10.114 | 10,609 | 122.9 | 38.84 | 4.615 | 5.151 | 1.61 | 3.199 | 19.25 | 102.8 |
| 721 | 10.712 | 9286 | 122.9 | 34.76 | 4.615 | 4.849 | 1.71 | 2.835 | 17.95 | 111.2 |
| 817 | 11.333 | 8195 | 122.9 | 31.29 | 4.615 | 4.59 | 1.811 | 2.535 | 16.74 | 117.9 |
| 919 | 11.97 | 7285 | 122.9 | 28.3 | 4.615 | 4.363 | 1.911 | 2.284 | 15.64 | 123.5 |
Table A3.
Specifications of various components of boiler at 2 bar.
Table A3.
Specifications of various components of boiler at 2 bar.
| No. of Tubes | Weight | ReTubes | ReShell | NusseltTubes | NusseltShell | Length of Shell | Shell Diameter | Aspect Ratio | Uo | Exhaust Pressure |
|---|---|---|---|---|---|---|---|---|---|---|
| (Tons) | (m) | (W/m2K) | (kPa) | |||||||
| 631 | 11.483 | 7967 | 200.6 | 22.91 | 4.779 | 5.848 | 1.61 | 3.632 | 22.91 | 86.6 |
| 721 | 12.232 | 6972 | 200.6 | 21.14 | 4.779 | 5.537 | 1.71 | 3.237 | 21.14 | 100.4 |
| 817 | 13.146 | 6154 | 200.6 | 19.53 | 4.779 | 5.324 | 1.811 | 2.941 | 19.53 | 111.2 |
| 919 | 13.97 | 5470 | 200.6 | 18.15 | 4.779 | 5.092 | 1.911 | 2.665 | 18.05 | 120.8 |
| 1027 | 14.907 | 4894 | 200.6 | 16.37 | 4.778 | 4.917 | 2.011 | 2.445 | 16.68 | 128.6 |
Table A4.
Specifications of various components of condenser and sub-cooler at 1.2 bar.
Table A4.
Specifications of various components of condenser and sub-cooler at 1.2 bar.
| No. of Tubes | Weight | ReTubes | ReShell | NusseltTubes | NusseltShell | Length of Shell | Shell Diameter | Aspect Ratio | Uo |
|---|---|---|---|---|---|---|---|---|---|
| (Tons) | (m) | (W/m2K) | |||||||
| 217 | 1.03174 | 11,796 | 3710 | 43.42 | 83.12 | 3.2767 | 0.4813 | 6.808 | 552.6 |
| 271 | 0.95795 | 9445 | 4487 | 35.95 | 93.66 | 2.5608 | 0.5346 | 4.790 | 565 |
| 331 | 0.90506 | 7733 | 5295 | 30.27 | 103.6 | 2.0667 | 0.5878 | 3.516 | 574.6 |
| 397 | 0.86003 | 6447 | 6453 | 25.78 | 113.4 | 1.6976 | 0.6411 | 2.648 | 582.4 |
| 469 | 0.82466 | 5458 | 7050 | 22.16 | 123 | 1.42223 | 0.6943 | 2.048 | 588.9 |
References
- Almasoudi, S.M.; Bassam, J. Desalination technologies and their environmental impacts: A review. Sustain. Chem. One World 2024, 1, 100002. [Google Scholar] [CrossRef]
- Shamet, O.; Lawal, D.U.; AlHariri, A.H.; Antar, M. Performance of different HDH desalination units powered by diesel engine generator waste heat. Process Saf. Environ. Prot. 2023, 179, 651–666. [Google Scholar] [CrossRef]
- Singh, D.; Singh, D.; Mishra, V.; Kushwaha, J.; Dev, R.; Patel, S.K.; Shankar, R.; Giri, B.S. Sustainability issues of solar desalination hybrid systems integrated with heat exchangers for the production of drinking water: A review. Desalination 2023, 566, 116930. [Google Scholar] [CrossRef]
- Osintsev, K.; Aliukov, S.; Kuskarbekova, S.; Tarasova, T.; Karelin, A.; Konchakov, V.; Kornyakova, O. Increasing Thermal Efficiency: Methods, Case Studies, and Integration of Heat Exchangers with Renewable Energy Sources and Heat Pumps for Desalination. Energies 2023, 16, 4930. [Google Scholar] [CrossRef]
- Zhou, X.; Xin, Z.; Tang, W.; Sheng, K.; Wu, Z. Comparative study for waste heat recovery in immersion cooling data centers with district heating and organic Rankine cycle (ORC). Appl. Therm. Eng. 2024, 242, 122479. [Google Scholar] [CrossRef]
- Wang, Y.; Morozyuk, T.; Cao, W. Carbon footprint of seawater desalination technologies: A review. J. Energy Resour. Technol. 2024, 146, 080801. [Google Scholar] [CrossRef]
- Galloni, E. Analysis on the waste heat recovery in a light duty vehicle. Energy 2022, 238, 121696. [Google Scholar] [CrossRef]
- Zhao, Y.; Li, W.; Zhao, X.; Wang, Y.; Luo, D.; Li, Y.; Ge, M. Energy and exergy analysis of a thermoelectric generator system for automotive exhaust waste heat recovery. Appl. Therm. Eng. 2024, 239, 122180. [Google Scholar] [CrossRef]
- Wild, P.; Skoufa, L.; Spencer, N. Renewable hydrogen requirements and impacts for network balancing: A Queensland case study. Econ. Anal. Policy 2024, 81, 452–469. [Google Scholar] [CrossRef]
- Rubaiyat, S.N.H.; Bari, S. Waste heat recovery using shell and tube heat exchanger from the exhaust of an automotive engine. In Proceedings of the 13th Asian Congress of Fluid Mechanics, Dhaka, Bangladesh, 17–21 December 2010; pp. 864–867. [Google Scholar]
- Ng, W.Y.; Christopher, S.; Bari, S. The potential of exhaust waste heat recovery (WHR) from a diesel-gen-set via rankine cycle. In Proceedings of the 2024 International Conference on Electrical, Computer and Energy Technologies (ICECET), Sydney, Australia, 25–27 July 2024; IEEE: Piscataway, NJ, USA, 2024; pp. 1–6. [Google Scholar]
- Fazelpour, F.; Salehi, G.R.; Khoshgard, A.; Aghdoudchaboki, Y. Thermoeconomic assessment of a waste heat recovery system driven by a marine diesel engine for power and freshwater production. Int. J. Exergy 2020, 33, 231–253. [Google Scholar] [CrossRef]
- Douadi, O.; Ravi, R.; Faqir, M.; Essadiqi, E. A conceptual framework for waste heat recovery from compression ignition engines: Technologies, working fluids & heat exchangers. Energy Convers. Manag. X 2022, 16, 100309. [Google Scholar] [CrossRef]
- Christodoulides, P.; Agathokleous, R.; Aresti, L.; Kalogirou, S.A.; Tassou, S.A.; Florides, G.A. Waste heat recovery technologies revisited with emphasis on new solutions, including heat pipes, and case studies. Energies 2022, 15, 384. [Google Scholar] [CrossRef]
- Farhat, O.; Faraj, J.; Hachem, F.; Castelain, C.; Khaled, M. A recent review on waste heat recovery methodologies and applications: Comprehensive review, critical analysis and potential recommendations. Clean. Eng. Technol. 2022, 6, 100387. [Google Scholar] [CrossRef]
- Shalaby, S.; Hammad, F.A.; Zayed, M.E. Current progress in integrated solar desalination systems: Prospects from coupling configurations to energy conversion and desalination processes. Process Saf. Environ. Prot. 2023, 178, 494–510. [Google Scholar] [CrossRef]
- Zayed, M.E.; Ghazy, M.; Shboul, B.; Elkadeem, M.R.; Rehman, S.; Irshad, K.; Abido, M.A.; Menesy, A.S.; Askalany, A.A. Enhanced performance of a hybrid adsorption desalination system integrated with solar PV/T collectors: Experimental investigation and machine learning modeling coupled with manta ray foraging algorithm. Appl. Therm. Eng. 2024, 255, 124023. [Google Scholar] [CrossRef]
- Aboelmaaref, M.M.; Zhao, J.; Zayed, M.E.; Li, Y.; Gu, L.; Askalany, A.A.; Ghazy, M.; Alsaman, A.S.; Ali, E.S. Design and dynamic numerical modeling of a hybrid reverse osmosis/adsorption-based distillation system driven by solar dish Stirling engine for enhanced performance and waste heat recovery. Process Saf. Environ. Prot. 2023, 180, 324–338. [Google Scholar] [CrossRef]
- Alhawsawi, A.; Zayed, M.E.; Moustafa, E.; Banoqitah, E.; Elsheikh, A.H. Hybridizing solar dish Stirling power system with single-effect desalination for sustainable electricity and freshwater co-generation: Mathematical modeling and performance evaluation. Case Stud. Therm. Eng. 2023, 45, 102997. [Google Scholar] [CrossRef]
- Shalaby, S.; Zayed, M.E.; Hammad, F.A.; Menesy, A.S.; Elbar, A.R.A. Recent advances in membrane distillation hybrids for energy-efficient process configurations: Technology categorization, operational parameters identification, and energy recovery strategies. Process Saf. Environ. Prot. 2024, 190, 817–838. [Google Scholar] [CrossRef]
- Maheswari, K.; Murugavel, K.K.; Esakkimuthu, G. Desalination through diesel engine exhaust waste heat. In Proceedings of the 2014 International Conference on Computation of Power, Energy, Information and Communication (ICCPEIC), Chennai, India, 16–17 April 2014; IEEE: Piscataway, NJ, USA; pp. 142–147. [Google Scholar]
- Panchal, H.; Patel, V.; Prajapati, V.; Patel, D.; Patel, H.; Patel, S. Experimental analysis of diesel engine exhaust gas coupled with water desalination for improved potable water production. In ASME International Mechanical Engineering Congress and Exposition; American Society of Mechanical Engineers: New York, NY, USA, 2015; Volume 57502, p. V08BT10A010. [Google Scholar]
- Ouyang, T.; Pan, M.; Tan, X.; Li, L.; Huang, Y.; Mo, C. Power prediction and packed bed heat storage control for marine diesel engine waste heat recovery. Appl. Energy 2024, 357, 122520. [Google Scholar] [CrossRef]
- Lebedevas, S.; Čepaitis, T. Complex Use of the Main Marine Diesel Engine High-and Low-Temperature Waste Heat in the Organic Rankine Cycle. J. Mar. Sci. Eng. 2024, 12, 521. [Google Scholar] [CrossRef]
- Wang, S.; Liu, C.; Zhou, Y. Study on waste heat utilization device of high-temperature freshwater in the modern marine diesel engine. In Proceedings of the IOP Conference Series: Earth and Environmental Science, Paris, France, 7–9 February 2018; IOP Publishing: Bristol, UK, 2018; Volume 111, p. 012009. [Google Scholar]
- Çolak, K.; Ölmez, H.; Saraç, B. Waste heat recovery assessment of triple heat-exchanger usage for ship main engine pre-heating and fresh water generation systems. Proc. Inst. Mech. Eng. Part M J. Eng. Marit. Environ. 2023, 238, 209–230. [Google Scholar] [CrossRef]
- Toelkes, W. The Ebeye desalination project—Total utilization of diesel waste heat. Desalination 1987, 66, 59–68. [Google Scholar] [CrossRef]
- Michels, T.; Murat, F. High performance ejectocompression desalination unit steam fed by a heat recovery boiler using exhaust gases of a diesel generator. Desalination 1987, 66, 69–74. [Google Scholar] [CrossRef]
- Bari, S.; Randhawa, T. Waste Exhaust Heat Recovery in Diesel Engine by Using Optimum Design and Rankine Cycle; Technical Paper 2023-01-0944; SAE International: Warrendale, PA, USA, 2023; pp. 1–12. [Google Scholar]
- Montañés, R.M.; Zotică, C.; Reyes-Lúa, A. Operation and control of compact offshore combined cycles for power generation. Energy 2024, 290, 130315. [Google Scholar] [CrossRef]
- Bari, S. An Experimental Study of a Waste Heat Recovery System Connected to a Diesel-Gen-Set; SAE Technical Paper 2017-01-0123; SAE International: Warrendale, PA, USA, 2017; pp. 1–6. [Google Scholar]
- Kanchibhotla, S.A.; Joshi, S.; Bari, S. Design and Optimization of Exhaust Gas Heat Recovery System Based on Rankine Cycle and Organic Cycles; SAE Technical Paper 2018-01-1369; SAE International: Warrendale, PA, USA, 2018; pp. 1–13. [Google Scholar]
- Joshi, S.; Kanchibhotla, S.A.; Bari, S. Waste Heat Recovery System for a Turbocharged Diesel Generator at Full and Part Load Operating Conditions Using Rankine and Organic Rankine Cycles; SAE Technical Paper 0148-7191; SAE International: Warrendale, PA, USA, 2018. [Google Scholar]
- Bari, S.; Randhawa, T. Optimizing the design of heat exchangers to reduce the cost and maximize the production of freshwater using waste heat from a diesel-gen-set. Int. J. Thermofluids 2022, 14, 100142. [Google Scholar] [CrossRef]
- Panchal, H.N. Life cycle cost analysis of a double-effect solar still. Int. J. Ambient. Energy 2017, 38, 395–399. [Google Scholar] [CrossRef]
- Schoney, R.A. Determining capital recovery charges for tractors and combines in times of inflation. J. ASFMRA 1980, 44, 23–27. [Google Scholar]
- Kumar, R.; Chanda, J.; Elsheikh, A.H.; Ongar, B.; Khidolda, Y.; PraveenKumar, S.; Panchal, H.; Shanmugan, S. Performance improvement of single and double effect solar stills with silver balls/nanofluids for bioactivation: An experimental analysis. Sol. Energy 2023, 259, 452–463. [Google Scholar] [CrossRef]
- Thakur, A.K.; Sathyamurthy, R.; Velraj, R.; Lynch, I.; Saidur, R.; Pandey, A.; Sharshir, S.W.; Ma, Z.; GaneshKumar, P.; Kabeel, A. Sea-water desalination using a desalting unit integrated with a parabolic trough collector and activated carbon pellets as energy storage medium. Desalination 2021, 516, 115217. [Google Scholar] [CrossRef]
- Siddiqui, F.R.; Elminshawy, N.A.; Addas, M.F. Design and performance improvement of a solar desalination system by using solar air heater: Experimental and theoretical approach. Desalination 2016, 399, 78–87. [Google Scholar] [CrossRef]
- Elminshawy, N.A.; Siddiqui, F.R.; Sultan, G.I. Development of a desalination system driven by solar energy and low grade waste heat. Energy Convers. Manag. 2015, 103, 28–35. [Google Scholar] [CrossRef]
Disclaimer/Publisher’s Note: The statements, opinions and data contained in all publications are solely those of the individual author(s) and contributor(s) and not of MDPI and/or the editor(s). MDPI and/or the editor(s) disclaim responsibility for any injury to people or property resulting from any ideas, methods, instructions or products referred to in the content. |
© 2025 by the authors. Licensee MDPI, Basel, Switzerland. This article is an open access article distributed under the terms and conditions of the Creative Commons Attribution (CC BY) license (https://creativecommons.org/licenses/by/4.0/).