Abstract
With continued technological advancements, the sizes of fixed-bottom offshore wind turbines have increased, resulting in increased operational noise levels. In this study, we investigated the underwater radiated noise generated by wind turbine operation along the western coast of the Korean Peninsula using numerical simulations. Using the OpenFAST software, a load analysis of the National Renewable Energy Laboratory 5 MW reference turbine with a jacket substructure was conducted for the various wind speeds defined in Design Load Case 1.2. The load analysis results and gear mesh frequency components were applied as excitation forces in a finite-element-method-based structural–acoustic coupled analysis model to evaluate underwater radiated noise, incorporating the acoustic properties of the seabed along the western coast of the Korean Peninsula and dynamic state of the sea surface. The numerical results were subsequently compared with experimental measurements of the operational noise from wind turbines supported by jacket substructures. The results indicated that, excluding certain frequency bands, the spectral levels were similar across the frequency spectrum.
1. Introduction
With the accelerating global transition toward renewable energy, the importance of wind power has steadily increased. Notably, offshore wind power has attracted significant scholarly interest in recent years, which can be attributed to the advantages of stronger wind conditions and lower noise pollution concerns for humans, compared with onshore sites [,]. However, underwater noise radiating from offshore wind turbines is recognized as a significant environmental concern related to the development and operation of offshore wind farms, as this noise has been reported to cause behavioral changes in marine organisms [,,].
As of 2022, Asia accounted for approximately 90% of global aquaculture production, with China, Indonesia, India, Vietnam, Bangladesh, the Philippines, and Republic of Korea contributing 86.2% of the total output []. By 2024, coastal aquaculture in the Republic of Korea accounted for approximately 62% of the nation’s total fishery production [].
In typical aquaculture facilities, space is confined by nets or walls, making farmed fish particularly vulnerable to underwater noise. Studies on the impact of underwater radiated noise from wind turbines on marine ecosystems have primarily focused on species inhabiting European and Western waters. However, given that the ecological and commercial values of marine species vary depending on the geographical environment, research reflecting regional characteristics is essential. Consequently, studies focusing on species inhabiting Asian waters have increased in recent years []. It is crucial to investigate the impact of the operational noise from wind turbines on marine ecosystems in Asian regions, particularly along the coast of the Republic of Korea. Although experimental studies have been conducted to quantify the noise levels at offshore wind farms in Korean waters, such approaches are inherently limited by significant time and cost requirements [].
Early research on the underwater noise radiation of wind turbines primarily focused on mitigating the noise generated by pile driving during the construction phase [,]. However, as turbines have become larger and wind farm scales have expanded, an increase in underwater radiated noise during operation has led to an increasing number of related studies []. During turbine operation, continuous mechanical vibrations, as well as structural vibrations induced by waves, propagate through the substructure into the water, resulting in underwater radiated noise [].
According to previous studies that analyzed underwater radiated noise under various operating conditions, the spectral characteristics of operational underwater noise are closely associated with variations in the rotor and generator rotational speeds driven by changes in wind velocity [,,]. Consequently, numerical studies on underwater radiated noise from wind turbines have generally considered rotor rotational components and drivetrain vibrations induced by rotor rotation as excitation sources [].
Fixed-bottom offshore wind turbines are typically installed at water depths of approximately 50 m, and numerous studies have adopted 50 m as the reference depth for modeling [,]. However, the Yellow Sea, which is located between China and the Korean Peninsula, is a shallow marginal sea with an average depth of 44 m and maximum depth of approximately 80 m []. Offshore wind farms in the Republic of Korea are installed at depths ranging from 7 to 30 m, which necessitates applying shallower water conditions than those typically considered in previous studies []. In such shallow water, frequent reflections of soundwaves occur at both the seabed and sea surface. Therefore, to predict the far-field underwater radiated noise from offshore wind turbines accurately, it is essential to consider the interactions of soundwaves with both the seabed and sea surface []. A map of the target area considered in this study is presented in Figure 1.
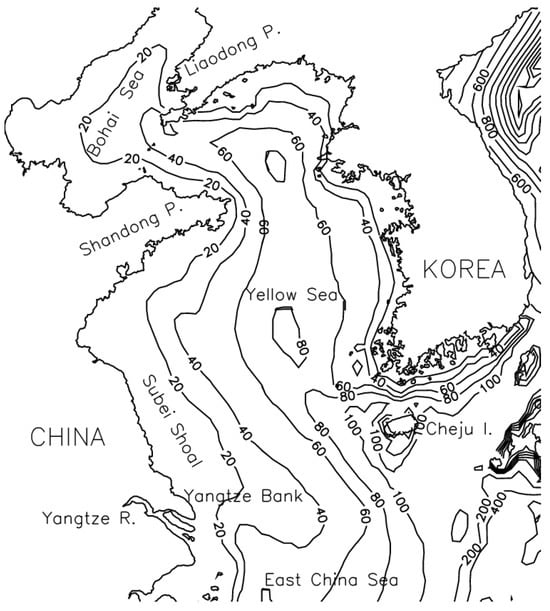
Figure 1.
Yellow Sea and model topography [].
In numerical simulations of such conditions, a pressure-release boundary condition is typically applied at the sea surface, assuming the total reflection of soundwaves due to the large impedance contrast between seawater and air. Although calm sea surface conditions do not pose significant issues, increased wind speeds intensify ocean–atmosphere interactions, leading to higher levels of surface roughness and bubble formation. Under such conditions, the accurate long-range prediction and mid-range frequency of underwater sound fields requires the consideration of both surface bubbles and surface roughness [].
Therefore, the objective of this study is to develop a systematic methodology for predicting underwater radiated noise that accounts for regional environmental characteristics with accurate and efficient source modeling. In particular, the proposed methodology focuses on acoustic boundary conditions and characterization of excitation sources required for frequency response analysis. Generally, accurate characterization of excitation sources is essential for underwater noise prediction. To achieve this, dynamic simulations of wind turbines are often performed using various commercial CFD and multibody dynamics software packages. However, such approaches involve high licensing costs and limited accessibility. To overcome these challenges, this study utilizes only the output data from open-source integrated wind turbine load analysis software, OpenFAST, to define the excitation sources of underwater radiated noise. In addition, a frequency response analysis methodology based on the OpenFAST–FEM framework was developed by incorporating boundary conditions that reflect regional environmental properties.
Accordingly, in this study, underwater radiated noise from offshore wind turbines in the Yellow Sea region was numerically analyzed by considering changes in acoustic impedance reflecting local seabed properties and dynamic air–sea interactions induced by varying wind speeds. Integrated load analyses were conducted using the open-source software OpenFAST for the National Renewable Energy Laboratory (NREL) 5 MW turbine model with a jacket substructure under varying wind speeds. For underwater radiated noise analysis, the integrated load analysis data obtained from OpenFAST were applied to FEM. For structural–acoustic coupled noise radiation analysis, acoustic impedances representing the seabed properties of the western Korean coast and wind-dependent dynamic response of the sea surface were extracted and applied as boundary conditions. A structural–acoustic coupled numerical analysis was then conducted within a cylindrical domain of 180 m and the resulting outcomes were examined.
2. Target Model and Environmental Conditions
In this study, the NREL 5 MW reference wind turbine proposed by Jonkman et al. [] was considered. Its specifications and properties are listed in Table 1. The substructure was modeled using the OC4 jacket structure proposed by Popko et al. []. To simplify the numerical model, the nacelle and rotor were represented as concentrated masses, with a correction applied for the 2 m offset between the top of the tower and nacelle center. The overall configuration of the final analytical model, consisting of a tower, transition piece, and jacket, is presented in Figure 2.

Table 1.
Specifications of the 5 MW wind turbine [].
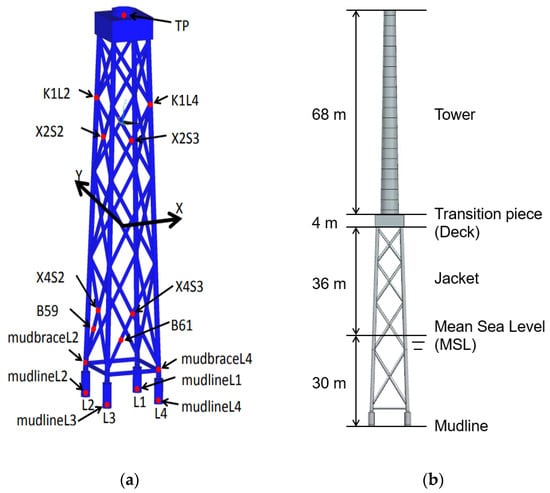
Figure 2.
(a) Jacket substructure proposed by Popko et al. []. (b) Simplified domain of a fixed offshore wind turbine considering a concentrated nacelle mass.
The analysis of the structural loads and responses of wind turbines under various environmental conditions encountered during actual operation is essential. The load scenarios induced by environmental factors are referred to as Design Load Cases (DLCs), and a systematic evaluation of wind turbine loads can be conducted through DLC analysis. The environmental conditions analyzed in this study correspond to the underwater radiated noise generated during the normal operation of the wind turbine. Therefore, DLC 1.2 was selected as the analysis target. The environmental conditions for this DLC are summarized in Table 2, and the corresponding meteorological conditions are listed in Table 3. Oh et al. [] reported the annual average wind speed in the Korean Southwest Sea to be 6.7 to 6.9 m/s, while Shi et al. [] reported an average wind speed of 6.87 m/s and gust speed of 9.24 m/s for the same region. In this study, four wind speeds of 5, 9, 15, and 25 m/s were selected to analyze the underwater sound fields under average and extreme wind conditions in the coastal waters of the Republic of Korea.
Table 2.
Target DLC and related information for analysis.
Table 3.
Meteorological conditions for DLC 1.2 based on target wind speeds 1.
Shi et al. [] set the mean sea level at 33 m to simulate the environment of the South Korean Sea. We adopted a similar value of 30 m based on the compilation presented by Song et al. [].
3. Characterization of Excitation Sources
3.1. Development and Validation of an Integrated Load Analysis System for Offshore Wind Turbines
To analyze offshore wind turbines, it is essential to reproduce their dynamic responses to wind and wave loads accurately. Pangerc et al. [] demonstrated that the underwater radiated noise from operating offshore wind turbines is influenced by rotor rotation and tower vibrations induced by variations in wind speed. Therefore, in this study, the open-source integrated wind turbine load analysis software OpenFAST 4.0.4 was employed to track and characterize the excitations of the underwater substructure induced by rotor rotation and wave action. Load analyses were conducted and the resulting tower dynamic responses under varying wind speeds were applied to our numerical model.
For the simulation of a fixed-bottom offshore wind turbine, we utilized six submodules in OpenFAST: ServoDyn, ElastoDyn, SubDyn, InflowWind, AeroDyn, and HydroDyn. The coordinate systems and input parameters of five modules, excluding ServoDyn, were appropriately adjusted to a water depth of 30 m.
The AeroDyn module was used to calculate aerodynamic loads using the data provided by the InflowWind module to compute the aerodynamic forces of the turbine. In this study, the blade element momentum method implemented in AeroDyn was used. The HydroDyn module was employed to calculate the hydrodynamic loads induced by the waves on the substructure. HydroDyn performs dynamic load analysis on the substructure nodes based on the input sea state information. The interactions among the various OpenFAST modules are illustrated in Figure 3.
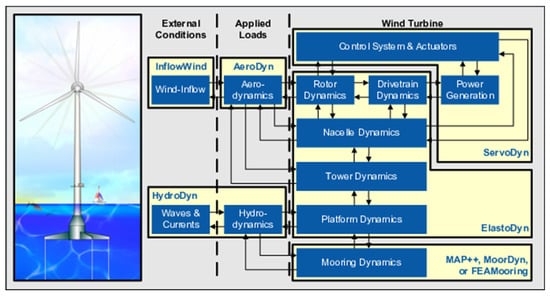
Figure 3.
OpenFAST module schematic [].
To validate the constructed model, the analysis results of the developed OpenFAST model were compared with those presented by Jonkman et al. [], as shown in Figure 4. For the 5 MW turbine, which has a rated wind speed of 11.4 m/s, the rotor thrust reaches its maximum near 11 m/s, after which the rotor speed and torque remain nearly constant. Although minor discrepancies appear between the analysis results at each wind speed and those reported by Jonkman et al. [], the overall trends exhibited good agreement.
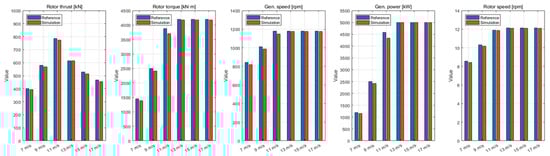
Figure 4.
Comparison between the reference case and the analysis conducted in this study.
According to the IEC 61400-1 standard, dynamic simulations must be sufficiently long to ensure the statistical reliability of specific loads. This standard recommends conducting at least six simulations of 10 min each or a continuous simulation of 60 min under the specified conditions. Additionally, it specifies that the initial 5 s or more (if necessary) of the data should be excluded from analysis [].
In accordance with the IEC 61400-1 standard, the simulation duration was set to 1 h. Based on the methods adopted in previous studies, the first 60 s of the simulation were excluded from the analysis in this study [,,]. The referenced studies are summarized in Table 4.
Table 4.
Simulation duration in each study.
The default simulation time step recommended by OpenFAST is 0.01 s. Considering this ideal experimental condition for performing a fast Fourier transform (FFT), the maximum analyzable frequency is limited to 50 Hz. This frequency range is relatively narrow for detailed radiated noise analysis based on frequency responses. Therefore, to conduct numerical analysis over a broader frequency range, it is necessary to reduce the time step. However, reducing the time step significantly increases the memory requirements for generating a wind speed time series, necessitating a practical compromise.
Offshore wind turbines are subjected to turbulence and wave effects that vary randomly with environmental conditions. Considering the characteristics of the OpenFAST program, even when identical environmental conditions are applied, the wind load time series differs if different initial seeds are used. This randomness introduces stochastic uncertainty that can be addressed by repeating the same simulation multiple times using different random seeds [].
According to Haid et al. [], comparing different simulations requires the total simulation time to be the same for all cases. Therefore, to balance computational cost and accuracy, a time step of 0.002 s was used for 1 h simulations, as recommended by the IEC 61400-1 standard. To maintain a consistent total simulation time, six simulations of 660 s were conducted, excluding the first 60 s. The OpenFAST parameters used in this study are listed in Table 5.
Table 5.
OpenFAST parameters used in this study.
3.2. Extraction of Wind and Wave Load Excitation Sources
To apply the wind turbine load analysis results to the FEM, the rotor rotational components and hydrodynamic forces acting on the jacket were extracted from the load calculations under DLC 1.2 conditions at wind speeds of 5, 9, 15, and 25 m/s. The results are presented in Figure 5. For visualization, the data were averaged over 500 samples.
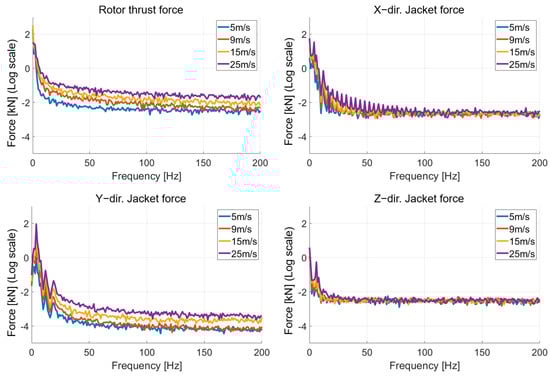
Figure 5.
Extraction results of excitation forces as a function of wind speed.
When the wind speed exceeds the rated wind speed, blade pitch control is used to maintain the rated power output, which reduces the rotor thrust. The FAST time domain results indicate that the rotor thrust reaches its maximum near the rated wind speed, as summarized in Table 6, and gradually decreases as the wind speed moves away from the rated value. However, the FFT results of the rotor thrust exhibit an increasing magnitude trend at higher wind speeds, likely owing to the superposition of the sinusoidal components used in OpenFAST to generate turbulent flow fields at elevated wind speeds.
Table 6.
Rotor thrust force in the x direction as a function of wind speed in the time domain.
Because wave heights increase with higher wind speeds, the hydrodynamic forces acting on the jacket also exhibit an increasing trend.
3.3. Extraction of Gear Mesh Frequency (GMF) Excitation Sources
In actual wind turbines, nacelle excitation forces arise not only from direct loading due to wind and waves but also from drivetrain rotation. To account for these effects, the GMF of the drivetrain was calculated and incorporated into our analysis. For a precise calculation, modeling of 5 MW drivetrain used in the NREL 5 MW reference turbine is required; however, such modeling is beyond the scope of this study. Therefore, direct modeling was not performed. Instead, the GMF was estimated by applying the methodology proposed by Marmo et al. [] based on detailed gearbox information provided by Nejad et al. [] for a 5 MW gearbox. Marmo et al. [] modeled the drivetrain excitation forces up to the 15th harmonic, assuming a normal distribution, and scaled them according to the wind speed. In contrast, we calculated the GMF based on OpenFAST simulation results corresponding to different wind speeds. The specifications of the gearbox presented by Nejad et al. [] are shown in Table 7.
Table 7.
5 MW reference gearbox specifications.
The GMF calculation formula proposed by Marmo et al. [] is defined in Equation (1).
The amplitude was calculated inversely using the low-speed shaft (LSS) torque, as shown in Equations (2)–(4). The LSS torque was taken as the time-averaged value from the OpenFAST simulation data.
Here, i is the gear ratio and n is the number of planetary gears.
Based on the information presented above, the GMF calculated for DLC 1.2 at 15 m/s is illustrated in Figure 6.
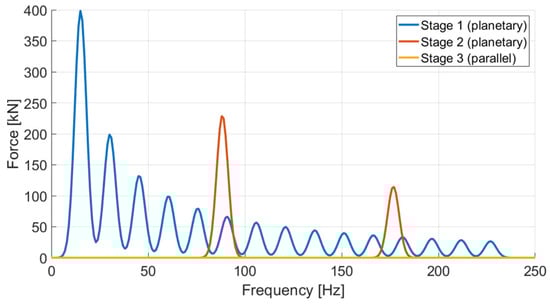
Figure 6.
Calculation results of the GMF components for each stage under DLC 1.2 at a wind speed of 15 m/s.
As the torque decreases toward the high-speed shaft, the corresponding amplitude also decreases, resulting in a decrease in the overall level. To examine the pattern of the GMF components with respect to wind speed, the GMF components of the three stages were summed and compared based on wind speed, as shown in Figure 7. Since the GMF amplitude was derived from the rotor torque, identical GMF values were obtained for the post-rated wind speed conditions.
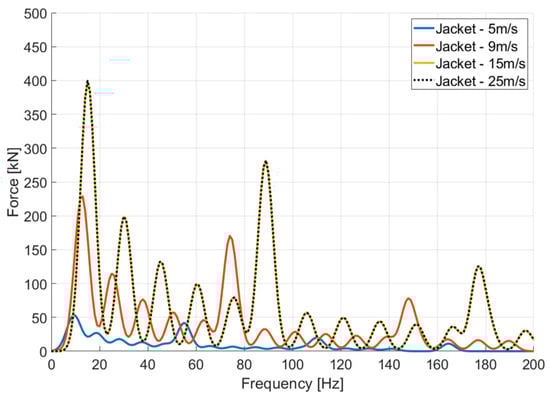
Figure 7.
GMF spectra at each wind speed under DLC 1.2.
4. Numerical Simulation Model
The acoustic domain and frequency range targeted for numerical analysis are presented in Figure 8 and Table 8, respectively.
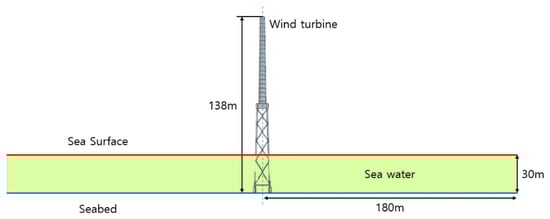
Figure 8.
Acoustic domain for structural–acoustic coupled simulation.
Table 8.
Target domain and frequency range for numerical simulation.
To analyze the underwater radiated noise of the turbine, the seawater domain must be modeled. If the acoustic domain is too small, then low-frequency soundwaves cannot be predicted accurately, leading to errors. Therefore, the distance from the noise source to the boundary of the analysis domain was configured to be at least one wavelength at the lowest frequency. The minimum frequency was set to 10 Hz and the analysis domain was defined as extending 180 m from the tower center, which exceeds the wavelength of a 10 Hz underwater soundwave (approximately 150 m).
For vibration and noise analyses, we used the commercial software Simcenter 3D 2312.6 (Siemens). The governing equations for the structural and acoustic analyses are defined as follows []:
Here, the subscripts and denote the structural and acoustic meshes, respectively. [M], [C], and [K] represent the mass, damping, and stiffness matrices, respectively. and are the displacement vectors at the structural mesh nodes and acoustic mesh nodes, respectively. Matrix represents the coupling matrix between the structural and acoustic meshes, and is defined as follows:
Here, N represents the shape functions of the structural and acoustic elements and denotes the normal vector at the boundary interface of the structural and acoustic meshes.
Because the radiating medium in the noise-emission region is water, its density is expected to influence the vibration modes of the substructure significantly. Therefore, a two-way coupled structural–fluid interaction method was applied to model the mutual response interaction between the structure and fluid. To prevent nonphysical reflections of acoustic waves at the mesh boundary when the waves reach 180 m, an automatically matched layer (AML) boundary condition was applied to the acoustic mesh surface. The AML boundary condition creates an artificial absorbing layer that prevents wave reflection by implementing the Sommerfeld condition. The Sommerfeld equation is defined as
4.1. Seabed Boundary Conditions
4.1.1. Application of Boundary Constraints to the Wind Turbine
The support base of the wind turbine was firmly connected to the ground, ensuring that the vibrations caused by the rotor rotation and waves propagated through the substructure without separation. Therefore, all six degrees of freedom at the bottom four grout surfaces of the jacket were fixed by applying fixed boundary conditions, as shown in Figure 9.
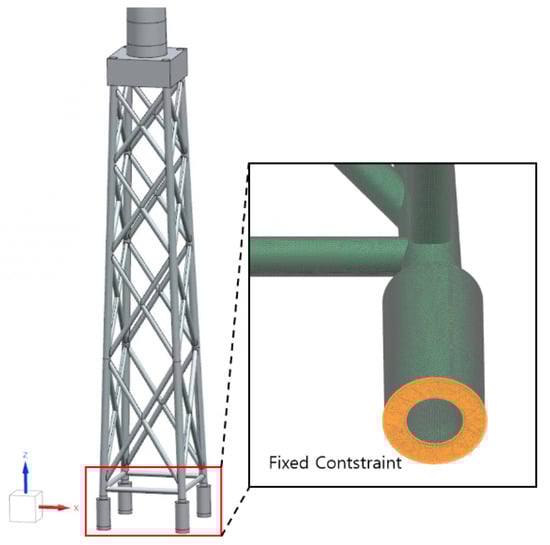
Figure 9.
Fixed constraint boundary condition of the wind turbine.
4.1.2. Application of Acoustic Boundary Conditions
To account for acoustic absorption and radiation by sediments in the Yellow Sea, the sediments were modeled using the Biot–Stoll model based on porous media theory. MATLAB 2024a (MathWorks) was used to calculate the acoustic impedance of the sediment. The complex impedance was computed using the complex equivalent density formula proposed by Williams [] as follows:
where
, : Kelvin function.
To calculate the complex impedance of the Yellow Sea seabed sediments, data compiled by Zhou et al. [] were used as a basis and reorganized according to the physical properties of the Yellow Sea based on measurements by Kim et al. []. The acoustic impedance of the Yellow Sea seabed sediments was calculated using the parameters listed in Table 9.
Table 9.
Data applied for the calculation of the acoustic complex impedance of the Yellow Sea seabed.
The calculation results are presented in Figure 10, where the blue and red lines represent the real and imaginary components of the complex impedance, respectively, with units of . The left and right axes correspond to the real and imaginary components of the complex impedance, respectively. For comparison, the scales of both axes are fixed. The impedance calculations reveal that up to 500 Hz, the difference in the real component of the acoustic impedance is on the order of , indicating a negligible level of reduction. Although the imaginary component increases with frequency, its magnitude remains at approximately 0.04% of the total impedance within the target frequency range, suggesting minimal influence. Even though the imaginary component of the acoustic impedance is expected to have little effect on underwater sound radiation, both the real and imaginary components of the frequency-dependent acoustic impedance were extracted and applied to the seabed boundary in the numerical model to reflect the material properties accurately.
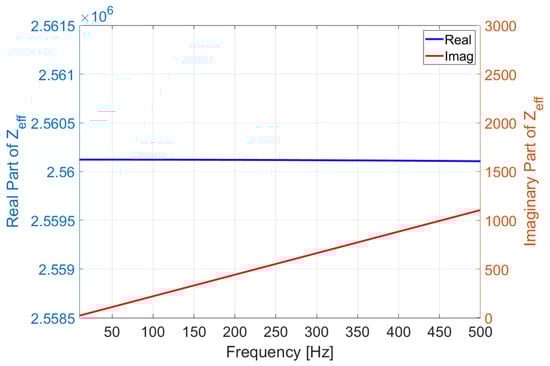
Figure 10.
Results of acoustic complex impedance calculations for the seabed of the Yellow Sea.
4.2. Sea Surface Boundary Conditions
To account for the underwater acoustic wave reflection and transmission effects caused by dynamic sea surface responses to wind accurately, it is necessary to track the time-varying wave shape and boundary interface induced by wind–sea interactions precisely using computational fluid dynamics or similar methods. However, such detailed considerations are often limited to frequency response analyses. Therefore, an equivalent impedance boundary condition was applied to replicate the effects of rough sea surfaces at different wind speeds. Vecchiotti et al. [] proposed an empirical formula for the surface impedance as a function of the significant wave height and frequency. However, they noted that the empirical formula is valid only when the sea surface roughness is significantly smaller than the wavelength. Their formula is defined as
According to the summary of sea surface roughness at 10 m above the water surface as a function of wind speed presented by Takagaki et al. [], the sea surface roughness at the analyzed wind speeds of 5, 9, 15, and 25 m/s is on the order of ~0.01 m. Compared with the underwater acoustic wavelength of 7.5 m at the target frequency of 200 Hz, this roughness corresponds to approximately 0.13% of the wavelength, validating the use of the empirical formula proposed by Vecchiotti et al. [] in this wind speed range. The acoustic impedance under meteorological conditions corresponding to DLC 1.2 at 5 m/s is presented in Figure 11. The frequency-dependent real and imaginary components of the acoustic impedance were extracted and applied to the sea surface boundary of the numerical model.
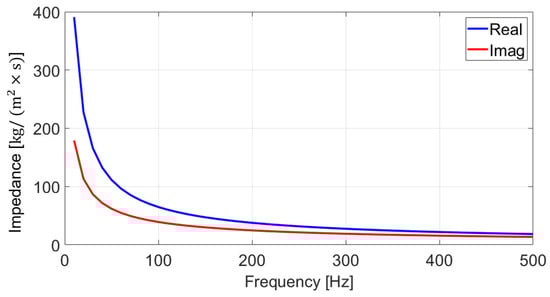
Figure 11.
Results of acoustic impedance calculations for the Yellow Sea surface.
4.3. Structural and Acoustic Meshes
To ensure sufficient mesh resolution, the structural mesh size of the tower was set to 500 mm, allowing for more than 20 elements around the tower circumference. As the geometry becomes more complex toward the jacket, the structural mesh size progressively decreases. The mesh types and sizes are listed in Table 10.
Table 10.
Mesh size values for the turbine structures.
The constructed structural mesh is presented in Figure 12. To consider the mass of the nacelle within the structural mesh, a concentrated mass was assigned, and to distribute the load to the top of the tower uniformly, the concentrated mass was connected to the tower top using RBE2 elements. The mass of the rotor–nacelle assembly (RNA) was assigned to the concentrated mass node, and the corresponding values are listed in Table 11.
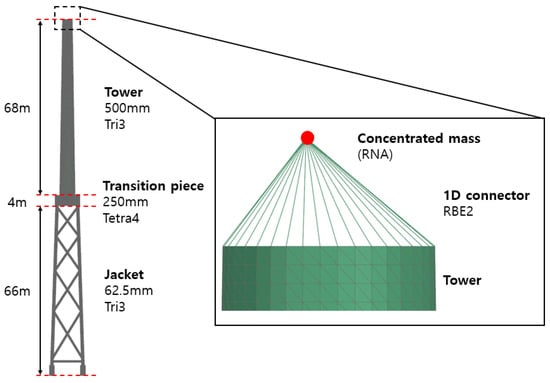
Figure 12.
Concentrated mass of the RNA and element types of the wind turbine.
Table 11.
Detailed specifications of the RNA concentrated mass.
The acoustic mesh was configured to include six elements per wavelength within the upper frequency limit. Accordingly, the maximum mesh size was restricted to 1.25 m. Because the structural mesh size of the jacket was 62.5 mm, the acoustic mesh size in contact with the jacket structural mesh was set to 62.5 mm to ensure appropriate data interpolation between the structural and acoustic meshes. To avoid the significant loss of result reliability caused by rapid mesh size growth from 62.5 mm to 1.25 m, the acoustic mesh growth rate was set to 1.3. These settings are detailed in Table 12.
Table 12.
Acoustic mesh settings.
The constructed acoustic mesh is presented in Figure 13. To extract data from the acoustic mesh, a microphone mesh was created with a size of 400 m, encompassing the acoustic mesh, which had a radius of 180 m. To ensure sufficient sampling points for sound pressure extraction, the mesh size was set to 10 m. The combined configuration of the acoustic mesh and microphone mesh is illustrated in Figure 14.
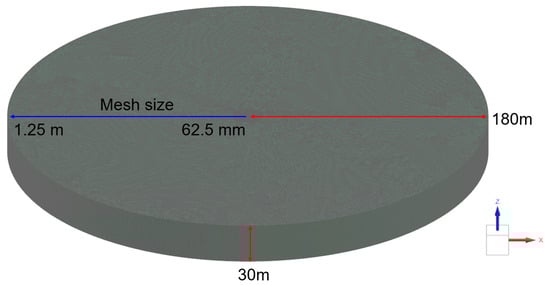
Figure 13.
Acoustic mesh domain.
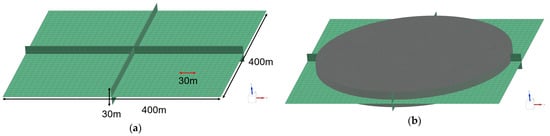
Figure 14.
(a) Microphone mesh domain and (b) coupled acoustic–microphone mesh domain.
5. Numerical Simulation Results
Because the excitation forces caused by rotor rotation and GMF are dominant in the x direction among the x, y, and z directions, the sound pressure level (SPL) was analyzed at hydrophone positions located in the +x direction from the tower center at distances of 10, 50, 70, 100, and 200 m, as shown in Figure 15. The reference for the dB values is 1 × 10⁻⁶ Pa, and the depth of the hydrophone measurement points is 15 m.
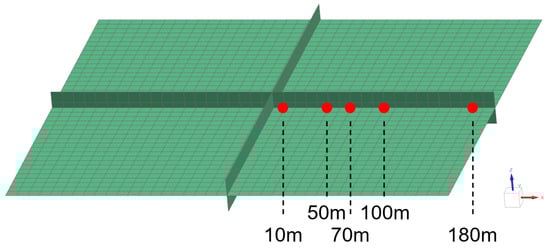
Figure 15.
Microphone mesh and data acquisition points.
The analysis results are presented in Figure 16 and the overall SPL (OASPL) values are summarized in Table 13. The underwater radiated noise increased with higher wind speeds and at points closer to the tower. There was little difference in underwater noise levels between wind speeds of 15 and 25 m/s, which is attributable to the minimal variation in GMF components and excitation forces, despite the increase in wind speed.
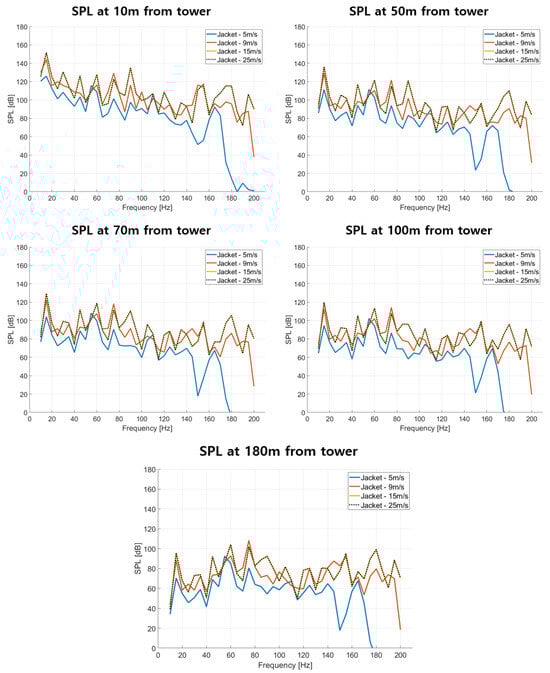
Figure 16.
Numerical simulation results as a function of distance from the tower.
Table 13.
OASPL as a function of wind speed and distance from tower.
The Underwater radiated noise generated during wind turbine operation inevitably includes background noise. The components at 150, and 180 Hz of 5 m/s results are likely noise artifacts resulting from missing GMF excitation forces, rather than true signals.
The simulation frequency resolution was set to 5 Hz. To assess sensitivity to frequency resolution, additional simulations were performed at 2 Hz for the 15 m/s case. The OASPL as a function of distance from the tower was computed for all resolutions. Compared with the 2 Hz case, the 5 Hz simulation overestimated OASPL by 0.5 dB, negligible compared to the overall spectral level. Given that this study primarily develops the methodology and that computational effort increases markedly with finer frequency bins, all computations used a 5 Hz resolution as a balanced choice between accuracy and efficiency.
SPL is also highly sensitive to the excitation force; a sensitivity analysis was conducted on the excitation force and subsequently applied to the SPL evaluation. Table 14 presents a comparison of the relative deviation between the time-series rotor torque and the mean rotor torque obtained from six FAST simulations for each wind speed, revealing differences of up to 25%. This variation is attributed to phase differences arising from the application of random seeds in each simulation. Considering a 26.1% variation in sound pressure amplitude, the corresponding difference in SPL was found to be approximately 2.6 dB.
Table 14.
Sensitivity analysis for rotor torque of each wind speed.
To compare the spectra from various previous studies with the results of our study directly, it is essential to have consistent conditions such as turbine capacity, measurement location, and wind speed. Therefore, the experimental data were scaled to standardize the turbine capacity, measurement distance, and wind speed for meaningful comparisons. Scaling was performed based on the normalization approach presented by Tougaard et al. [], who standardized multiple experimental studies to the conditions of a 100 m measurement distance, 1 MW turbine capacity, and 10 m/s wind speed, consolidating the corresponding underwater radiated noise levels. The data outside the analysis range used by Tougaard et al. [] were linearly extrapolated to estimate the values within the range. The resulting scaled data are presented in Figure 17.
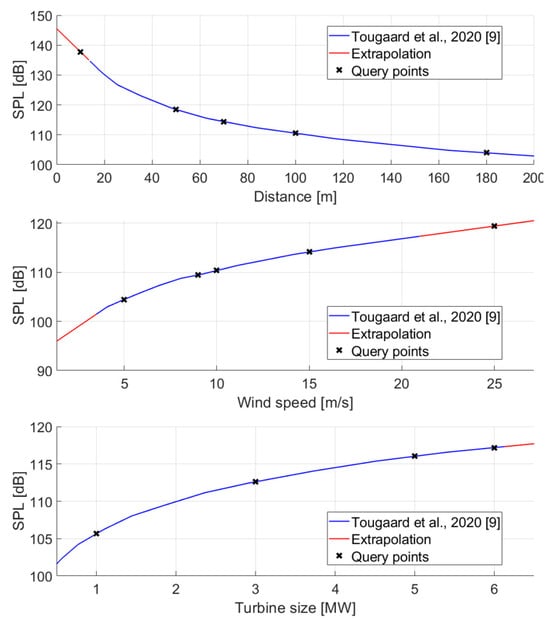
Figure 17.
Extrapolation results of SPL data and query points.
Two experimental studies measuring the underwater radiated noise from operating wind turbines with jacket substructures were selected for comparison. Although the water depths in these two studies differed from those specified in our study, it was determined that this discrepancy would not pose a significant issue when comparing noise level trends. Yoon et al. [] measured the underwater noise from a wind farm consisting of 3 MW turbines located on the southwestern coast of Korea, and HDR [] conducted measurements at a wind farm with 6 MW turbines in Block Island, USA. The relevant experimental data are summarized in Table 15. Numerical simulation data were scaled to experimental conditions based on the scaling approach of Tougaard et al. [], as shown in Table 16. Scaling was not performed on the measurement depth.
Table 15.
Studies investigating underwater radiated noise generated by offshore wind turbines with jacket substructures.
Table 16.
Decibel correction values for each study.
To validate the applicability of the present methodology to the existing operating off-shore wind turbines, the predictions results are compared with the measured data. For the comparison, as the GMF component is identified as the primary excitation source, a torque-based excitation force estimation method was employed to model it. In general, as turbine capacity increases, the rotor torque also increases, which in turn amplifies the GMF amplitude. Additionally, the reduction in rotor speed decreases the fundamental frequency, thereby increasing the number of harmonic components within the frequency range of interest. In this modeling framework, an increase in torque leads to stronger excitation forces and, consequently, higher levels of radiated noise. However, this rationale is valid only for studies that estimate excitation forces based on torque. Given the complex mechanisms governing underwater radiated noise, any scaling to the experimental data was not applied.
For a direct comparison with the experimental data, the power spectral density results are presented in Figure 18 and Figure 19. Simulation results exhibited oscillations at a higher level than the experimental results. In reality, turbine-induced vibrations are partially absorbed by the soil. When modeling turbines with pile foundations, p-y modeling techniques assign depth-dependent stiffness to the soil; however, this aspect was omitted in this study, which focused on underwater radiated noise modeling. Consequently, the simplification of structure–soil interactions may have contributed to the elevated noise values. Molenkamp et al. [] quantitatively analyzed the variation in underwater radiated noise according to soil–pile boundary conditions and found that the radiated noise level was higher when the soil and pile were fully coupled than when they were not.
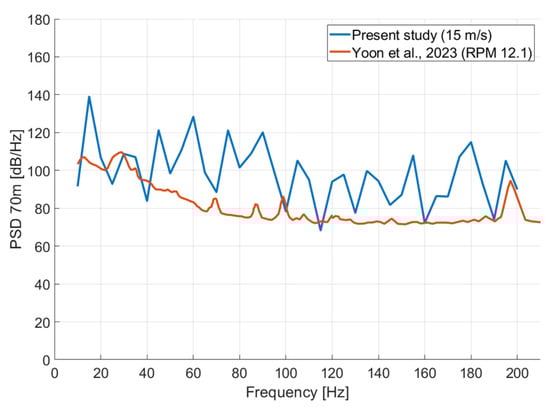
Figure 18.
Comparison between numerical simulation results and experimental data (Yoon et al. []).
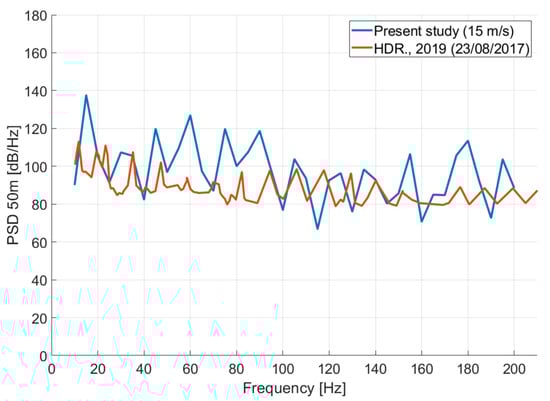
Figure 19.
Comparison between numerical simulation results and experimental data (HDR. []).
6. Summary and Discussion
In this study, the acoustic properties of the western coastal waters of the Korean Peninsula were applied to analyze the radiated noise levels of an NREL 5 MW jacket-type wind turbine as a function of wind speed and microphone points. Integrated load analysis was conducted using OpenFAST under a 30 m water depth at wind speeds of 5, 9, 15, and 25 m/s. The load analysis results were inputted into an FEM to conduct a coupled structural–acoustic radiated noise analysis. The numerical results revealed that the SPL increased with wind speed and decreased with distance from the tower. Notably, in the frequency domain, the GMF components had a dominant influence on the radiated noise compared with the direct loads from wind and waves, which exhibited significant values below 10 Hz.
To evaluate whether magnitude and trend of the numerical analysis results are appropriate, they were directly compared with experimental underwater radiated noise data from wind turbines with jacket substructures reported by Yoon et al. [] and HDR []. For direct comparisons, the radiated noise levels were adjusted according to the scaling method presented by Tougaard et al. []. Although the prediction results exhibited oscillations at a higher level than the experimental results, the numerical results demonstrate reasonable agreement with the experimental studies. Considering the comparison between the experimental and numerical results, as well as the simplifications made to the pile–soil boundary conditions, the boundary conditions reflecting local environmental characteristics applied in this study appear to be appropriate. Accuracy of such boundary conditions tends to improve with increasing frequency and with greater distance between the noise measurement point and the tower. Accordingly, future research will aim to enhance these boundary conditions by extending the analysis to higher frequencies and more distant observation points.
In conclusion, the methodology developed in this study was found to predict underwater radiated noise within a reasonable and acceptable range. Although the acoustic properties applied in this study are specific to the Korean coastal environment, the proposed methodology is expected to be universally applicable to offshore sites worldwide.
Author Contributions
Conceptualization, C.C.; formal analysis, C.C., S.L. (Songjune Lee) and G.-s.L.; methodology, J.L., S.L. (Sangheon Lee), S.L. (Songjune Lee) and G.-s.L.; investigation, J.L.; writing—original draft preparation, J.L.; writing—review and editing, C.C.; supervision, C.C.; project administration, S.L. (Songjune Lee) and G.-s.L. All authors have read and agreed to the published version of the manuscript.
Funding
This work was supported by Korea Institute of Energy Technology Evaluation and Planning (KETEP) grant funded by the Korea government(MOTIE) (20220710100020, Development of layout design and underwater noise management technology for coexisting suitable offshore wind farm, and 20228520020040, Development of O&M scheduling technology for large-scale offshore wind farms optimized in domestic environments).
Data Availability Statement
The data presented in this study are available upon request from the corresponding author.
Conflicts of Interest
The authors declare no conflicts of interest.
References
- Bilgili, M.; Yasar, A.; Simsek, E. Offshore wind power development in Europe and its comparison with onshore counterpart. Renew. Sustain. Energy Rev. 2011, 15, 905–915. [Google Scholar] [CrossRef]
- Oh, K.Y.; Kim, J.Y.; Lee, J.K.; Ryu, M.S.; Lee, J.S. An assessment of wind energy potential at the demonstration offshore wind farm in Korea. Energy 2012, 46, 555–563. [Google Scholar] [CrossRef]
- Mooney, A.; Andersson, M.H.; Stanley, J. Acoustic impacts of offshore wind energy on fishery resources: An evolving source and varied effects across a wind farm’s lifetime. Oceanography 2020, 33, 82–95. [Google Scholar] [CrossRef]
- Galparsoro, I.; Menchaca, I.; Garmendia, J.M.; Borja, Á.; Maldonado, A.D.; Iglesias, G.; Bald, J. Reviewing the ecological impacts of offshore wind farms. npj Ocean Sustain. 2022, 1, 1. [Google Scholar] [CrossRef]
- Kim, B.; Jin, G.; Byeon, Y.; Park, S.Y.; Lee, C.; Lee, J.; Noh, J.; Khim, J.S. Pile driving noise impacts behavioral patterns of im portant East Asian juvenile marine fishes. Mar. Pollut. Bull. 2024, 207, 116893. [Google Scholar] [CrossRef]
- Food and Agriculture Organization of the United Nations (FAO) [FAO Report]. Global Fisheries and Aquaculture Production Reaches a New Record High. Available online: https://www.fao.org/newsroom/detail/fao-report-global-fisheries-and-aquaculture-production-reaches-a-new-record-high/en (accessed on 24 September 2025).
- Ministry of Oceans and Fisheries. Korean. Available online: https://www.fips.go.kr/p/Main/ (accessed on 24 September 2025).
- Yoon, Y.G.; Han, D.-G.; Choi, J.W. Measurements of underwater operational noise caused by offshore wind turbine off the southwest coast of Korea. Front. Mar. Sci. 2023, 10, 1153843. [Google Scholar] [CrossRef]
- Tougaard, J.; Hermannsen, L.; Madsen, P.T. How loud is the underwater noise from operating offshore wind turbines? J. Acoust. Soc. Am. 2020, 148, 2885. [Google Scholar] [CrossRef]
- Han, D.-G.; Choi, J.W. Measurements and spatial distribution simulation of impact pile driving underwater noise generated during the construction of offshore wind power plant off the southwest coast of Korea. Front. Mar. Sci. 2022, 8, 654991. [Google Scholar] [CrossRef]
- Betke, K.; Schultz-von Glahn, M.; Matuschek, R. Underwater noise emissions from offshore wind turbines. In Proceedings of the Joint Congress CFA/DAGA ’04, Strasbourg, France, 22–25 March 2004; pp. 5–8. [Google Scholar]
- Pangerc, T.; Theobald, P.D.; Wang, L.S.; Robinson, S.P.; Lepper, P.A. Measurement and characterisation of radiated underwater sound from a 3.6 MW monopile wind turbine. J. Acoust. Soc. Am. 2016, 140, 2913. [Google Scholar] [CrossRef]
- Marmo, B.; Roberts, I.; Buckingham, M.P.; King, S.; Booth, C. Modelling of Noise Effects of Operational Offshore Wind Tur Bines Including Noise Transmission Through Various Foundation Types; Scottish Government: Edinburgh, UK, 2013. [Google Scholar]
- Kim, B.-S.; Jin, J.-W.; Bitkina, O.; Kang, K.-W. Ultimate load characteristics of NREL 5-MW offshore wind turbines with dif ferent substructures. Int. J. Energy Res. 2016, 40, 639–650. [Google Scholar] [CrossRef]
- Wei, H.; Shi, J.; Lu, Y.; Peng, Y. Interannual and long-term hydrographic changes in the Yellow Sea during 1977–1998. Deep Sea Res. II 2010, 57, 1025–1034. [Google Scholar] [CrossRef]
- Song, Y.; Kim, C.-J.; Paek, I.-S.; Kim, H.-G. Evaluation of implementation potential of offshore wind farm capacity in Korea using national wind map and commercial wind farm design tool. J. Korean Sol. Energy Soc. 2016, 36, 21–29. (In Korean) [Google Scholar] [CrossRef]
- Ainslie, M.A. Effect of wind on long range propagation in shallow water. In Proceedings of the 7th European Conference on Underwater Acoustics, Delft, The Netherlands, 5–8 July 2004; ECUA: Delft, The Netherlands, 2004. [Google Scholar]
- Xia, C.; Qiao, F.-L.; Yang, Y.; Ma, J.; Yuan, Y. Three-dimensional structure of the summertime circulation in the Yellow Sea from a wave-tide-circulation coupled model. J. Geophys. Res. 2006, 111, C11S03. [Google Scholar] [CrossRef]
- Cho, B.; Makris, N.C. Predicting the effects of random ocean dynamic processes on underwater acoustic sensing and commu nication. Sci. Rep. 2020, 10, 4525. [Google Scholar] [CrossRef]
- Jonkman, J.M.; Butterfield, S.; Musial, W.; Scott, G. Definition of a 5-MW Reference Wind Turbine for Offshore System Development; NREL/TP-500-38060; National Renewable Energy Laboratory: Golden, CO, USA, 2009. Available online: https://docs.nrel.gov/docs/fy09osti/38060.pdf (accessed on 17 September 2025).
- Popko, W.; Vorpahl, F.; Zuga, A.; Kohlmeier, M.; Jonkman, J.; Robertson, A.; Larsen, T.; Yde, A.; Saetertro, K.; Okstad, K.; et al. Offshore Code Comparison Collaboration Continuation (OC4), Phase I—Results of Coupled Simulations of an Offshore Wind Turbine with Jacket Support Structure; NREL/CP-5000-54124. 2012. Available online: https://docs.nrel.gov/docs/fy12osti/54124.pdf (accessed on 17 September 2025).
- Shi, W.; Han, J.; Kim, C.W.; Lee, D.; Shin, H.; Park, H. Feasibility study of offshore wind turbine substructures for southwest offshore wind farm project in Korea. Renew. Energy 2015, 74, 406–413. [Google Scholar] [CrossRef]
- National Renewable Energy Laboratory. Introduction—Aerodyn-OLAF Module in OpenFAST: User Documentation. 2023. Available online: https://openfast.readthedocs.io/en/dev/source/user/aerodyn-olaf/Introduction.html (accessed on 17 September 2025).
- KS C IEC 61400-1; Wind Energy Generation Systems—Part 1: Design Requirements. Korean Standards Association: Seoul, Republic of Korea, 2014. (In Korean)
- Zalkind, D.; Shields, M.; Lenfest, E.; Goupee, A.; Allen, C. Open-Loop Control of Adjustable Tuned Mass Dampers for Floating Wind Turbine Platforms [Preprint]. 2021. Available online: https://docs.nrel.gov/docs/fy21osti/78839.pdf (accessed on 17 September 2025).
- Brown, K.; Bortolotti, P.; Branlard, E.; Chetan, M.; Dana, S.; deVelder, N.; Doubrawa, P.; Hamilton, N.; Ivanov, H.; Jonkman, J.; et al. One-to-one aeroservoelastic validation of operational loads and performance of a 2.8 MW wind turbine model in OpenFAST. Wind Energy Sci. 2024, 9, 1791–1810. [Google Scholar] [CrossRef]
- Haid, L.; Stewart, G.; Jonkman, J.; Robertson, A.; Lackner, M.; Matha, D. Simulation-length requirements in the loads analysis of offshore floating wind turbines. In Proceedings of the ASME 2013 32nd International Conference on Ocean, Offshore and Arctic Engineering, Nantes, France, 9–14 June 2013. [Google Scholar] [CrossRef]
- Singh, D.; Dwight, R.P.; Laugesen, K.; Beaudet, L.; Viré, A. Probabilistic surrogate modeling of offshore wind-turbine loads with chained Gaussian processes. J. Phys. Conf. Ser. 2022, 2265, 032070. [Google Scholar] [CrossRef]
- Nejad, A.R.; Guo, Y.; Gao, Z.; Moan, T. Development of a 5 MW reference gearbox for offshore wind turbines. Wind Energy 2016, 19, 1089–1106. [Google Scholar] [CrossRef]
- Siemens. Siemens Digital Industries Software, Simcenter Nastran Acoustics User’s Guide Version 2312; Siemens: Plano, TX, USA, 2023. [Google Scholar]
- Williams, K.L. An effective density fluid model for acoustic propagation in sediments derived from Biot theory. J. Acoust. Soc. Am. 2001, 110, 2276–2281. [Google Scholar] [CrossRef]
- Zhou, Q.; Li, X.; Huang, B.; Liu, L.; Gao, S.; Zhou, H.; Liu, J.; Liu, B.; Zhang, C. Inversion of the physical properties of seafloor surface sediments based on AUV sub-bottom profile data in the northern slope of the South China Sea. Sci. Rep. 2021, 11, 6539. [Google Scholar] [CrossRef]
- Kim, G.Y.; Kim, D.C.; Kim, S.J.; Seo, Y.K.; Jung, J.H.; Kim, Y.E. Physical properties of southeastern Yellow Sea Mud (SEYSM): Comparison with the East Sea and the South Sea mudbelts of Korea. Sea J. Korean Soc. Oceanogr. 2000, 5, 335–345. (In Korean) [Google Scholar]
- Schock, S.G. A method for estimating the physical and acoustic properties of the sea bed using chirp sonar data. IEEE J. Ocean. Eng. 2004, 29, 1200–1217. [Google Scholar] [CrossRef]
- Hovem, J.M.; Ingram, G.D. Viscous attenuation of sound in saturated sand. J. Acoust. Soc. Am. 1979, 66, 1807–1812. [Google Scholar] [CrossRef]
- Vecchiotti, A.; Ryan, T.J.; Vignola, J.F.; Turo, D. Atmospheric sound propagation over rough sea: Numerical evaluation of equivalent acoustic impedance of varying sea states. Acoustics 2024, 6, 489–508. [Google Scholar] [CrossRef]
- Takagaki, N.; Komori, S.; Suzuki, N.; Iwano, K.; Kuramoto, T.; Shimada, S.; Kurose, R.; Takahashi, K. Strong correlation between the drag coefficient and the shape of the wind sea spectrum over a broad range of wind speeds. Geophys. Res. Lett. 2012, 39, L23604. [Google Scholar] [CrossRef]
- HDR. Field Observations During Wind Turbine Operations at the Block Island Wind Farm, Rhode Island; Final Report to the U.S. Department of the Interior; OCS Study BOEM 2019-028; Bureau of Ocean Energy Management, Office of Renewable Energy Programs: Sterling, VA, USA, 2019; p. 281. [Google Scholar]
- Molenkamp, T.; Tsouvalas, A.; Metrikine, A. The influence of contact relaxation on underwater noise emission and seabed vibrations due to offshore vibratory pile installation. Front. Mar. Sci. 2023, 10, 1118286. [Google Scholar] [CrossRef]
Disclaimer/Publisher’s Note: The statements, opinions and data contained in all publications are solely those of the individual author(s) and contributor(s) and not of MDPI and/or the editor(s). MDPI and/or the editor(s) disclaim responsibility for any injury to people or property resulting from any ideas, methods, instructions or products referred to in the content. |
© 2025 by the authors. Licensee MDPI, Basel, Switzerland. This article is an open access article distributed under the terms and conditions of the Creative Commons Attribution (CC BY) license (https://creativecommons.org/licenses/by/4.0/).