Abstract
The oil sector in Ecuador represents one of the largest national energy consumers, with significant contributions to greenhouse gas and thermal emissions due to reliance on diesel-based thermoelectric generation. This study assesses the feasibility of implementing waste heat recovery processes in upstream petroleum operations, aiming to improve energy efficiency and reduce the sector’s carbon footprint. Historical production and energy consumption data (2015–2020) from the main oil blocks (43-ITT, 57-Shushufindi, 57-Libertador, 58-Cuyabeno, 60-Sacha, and 61-Auca) were analyzed, alongside experimental parameters from thermoelectric equipment. Key energy indicators, including recoverable heat potential, energy intensity, and CO2 emissions, were quantified to identify inefficiencies and opportunities for recovery. Results show that blocks with the highest crude production also exhibit the largest energy demand, with flue gas temperatures averaging 400 °C and an estimated recovery potential of up to 1.9 MWe through Rankine Cycle systems. Pre-feasibility analysis indicates a cost–benefit ratio of 1.03 under current conditions, which could reach 1.29 with higher load factors, while avoided emissions surpass 7000 tCO2 annually. The findings highlight a strong correlation between energy intensity and CO2 emissions, emphasizing the environmental relevance of recovery projects. Adoption of heat recovery technologies, coupled with regulatory incentives such as carbon pricing, offers a viable pathway to enhance energy efficiency, reduce operational costs, and strengthen sustainability in the Ecuadorian oil industry.
1. Introduction
Since the beginning of the industrial era, the need to achieve social welfare and economic growth has led to the endless search for energy sources [1]. It is evident that, from the beginning of the 20th century to the present, the world economy has increased its Gross Domestic Product 73.5 times and energy consumption 27.70 times, according to International Energy Agency information [2]. Technology has improved over the years, and therefore, energy efficiency has too; however, the increase in energy consumption, in absolute terms, has increased significantly. Therefore, to meet this growing need, the extracted volumes from coal, oil, and natural gas around the world have been increased continuously. Also, in the last twenty-five years, world energy fuel sources have not changed significantly. Oil stands as the main source of energy worldwide, and in 2019 it had an equivalent energy consumption of 4525 megatons of oil equivalent (MTOE), compared to coal with 3775 MTOE, natural gas with 3340 MTOE, and other types of energy with 2765 MTOE [2]. Oil is a strategic resource, and it is directly linked to the productive development level reached as well as energy and industrialization, as has been the case in Ecuador since the 1970s [3,4]
In the Ecuadorian case, one of the industries with the highest energy consumption is the oil industry, which includes the processes of exploration, exploitation, production (upstream), transportation, storage (midstream), refining, sale, and distribution (downstream). According to data from the Regulatory and Control Agency of Energy and Non-Renewable Natural Resources (ARCERNNR in Spanish), the audited Ecuadorian oil production for the year 2019 was 186 million barrels of crude (510,000 daily in average) [5]. The energy of an oil barrel corresponds to 1700 kilowatt-hours [5]; therefore, the use of the oil produced in 2019 would be equivalent to 224,000 megatons of equivalent carbon dioxide. In addition to the environmental pollution, thermal pollution is generated due to combustion gases’ temperatures (average 400 °C), which are emitted directly into the environment through the chimneys of industrial processes, increasing global warming consequently [6,7].
For these reasons, the Geological and Energy Research Institute (IIGE), from 2014 to 2017, developed the project called “Study to increase energy efficiency in thermoelectric plants”, which intended to generate additional electricity, with a zero-carbon footprint, through residual heat recovery from diesel generator combustion gases (Hyundai 9H21/32, nominal power 1.7 MWe) using an Organic Rankine Cycle (ORC) in the Quevedo II thermoelectric plant. The scope of this project was the design, implementation, and commissioning of an ORC plant prototype, which could generate between 50 and 200 kWe [8].
During 2018, within the framework of the Specific Agreement between the Hydrocarbon Ministry with the support of the Inter-American Development Bank (IDB), PETROAMAZONAS, EP PETROECUADOR, and INER, a consultancy called “Support for energy efficiency management in the oil industry” was developed. The consultancy’s general objective was carrying out a comprehensive rapid diagnosis of the current energy situation in the Ecuadorian oil industry (upstream, transport—midstream, downstream, and final consumption). The results obtained allowed for the identification of a preliminary list of potential efficiency projects throughout the value chain and for the evaluation of the identified projects in economic and environmental terms [9].
Based on the aforementioned information, the IIGE executed a project called “Study of heat recovery in refineries and reference wells of the oil industry” with the support of EP Petroecuador. The main objective of the project is to elaborate on measurement indicators that allow for the quantification of energy consumption per production unit, the proportion of each energy source, and combustion gas emissions [10]. These indicators are elaborated on in order to quantify the potential recoverable heat from those gases for its subsequent conversion into additional electricity, heat, or a combined cycle through cogeneration, and its different technologies. This information will allow for an analysis of the oil thermoelectric park to optimize its operation parameters, maximize thermal efficiency, reduce operation costs, and minimize thermal and environmental pollution [11,12].
In the first stage of the project, the oil upstream was prioritized in the blocks with the largest crude extraction (Blocks: 43-ITT, 57-Shushufindi, 57-Libertador, 58-Cuyabeno, 60-Sacha, and 61-Auca), as well as the methodology for the analysis of historical and experimental data to be collected [13]. In the second stage, the specific agreement was signed with EP Petroecuador (formerly Petroamazonas EP). This specific agreement had the purpose of formalizing the request for information and access to the fields of the main oil blocks. Finally, in the third stage, the filed acquired data were tabulated and analyzed in order to prepare this energetic situation evaluation report [10].
2. Methodology
The methodological framework combined historical data analysis, thermodynamic modeling, and feasibility assessments to quantify the potential of waste heat recovery in the Ecuadorian oil sector.
2.1. Study Area
Initial statistical analysis carried out by the IIGE determined that the oil blocks with the largest energy consumption between 2015 and 2020 were those with the highest level of oil production. The blocks selected to meet the objective of this project were 43-ITT, 57-Shushufindi, 57-Libertador, 58-Cuyabeno, 60-Sacha, and 61-Auca, shown in Figure 1.
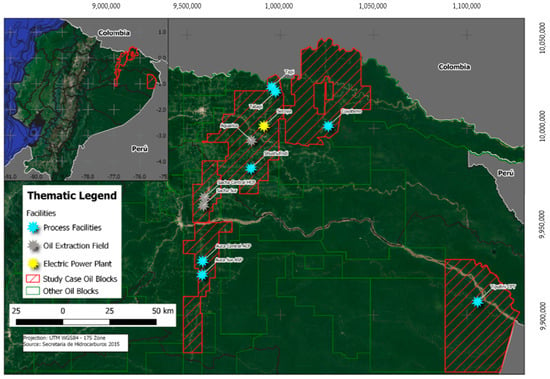
Figure 1.
Geographical locations of the prioritized oil blocks for the project [13].
2.2. Historical Data Analysis
Historical data analysis was conducted to identify trends in production, energy consumption, and thermoelectric generation across the main oil blocks operated by EP Petroecuador between 2015 and 2020. The dataset, officially reported by PEC [14] and validated through the national regulatory agency (ARCERNNR), included the following:
- Annual oil production (million bbls): used to determine the contribution of each block to national output.
- Diesel consumption for thermoelectric generation (million gallons): assessed to estimate the dependence of each block on the off-grid diesel-based energy supply.
- Thermoelectric generation (GWh): correlated with oil production to evaluate the efficiency of on-site energy systems.
The dataset underwent systematic tabulation and normalization to enable direct comparison among the six prioritized oil production blocks: 43-ITT, 57-Shushufindi, 57-Libertador, 58-Cuyabeno, 60-Sacha, and 61-Auca. Statistical analyses revealed variations and anomalies within these blocks. Time-series graphs depicted trends in production volume, diesel consumption intensity, and generation patterns, with emphasis on changes observed after integration with the National Interconnected System (SNI).
This historical analysis established a baseline for estimating residual heat availability. Higher levels of energy consumption and thermoelectric generation directly corresponded to increased potential for waste heat recovery.
2.3. Maximum Thermal Potential Assessment
The assessment of thermal potential focused on quantifying the recoverable energy contained in the exhaust gases of thermoelectric generation units operating in the selected oil blocks. The analysis was based on both manufacturer specifications and field data collected during technical inspections carried out by IIGE in 2021.
The available thermal energy (Eg) was calculated according to Equation (1)
where
: exhaust gas mass flow rate (kg/s);
Cp: average specific heat capacity of the flue gas mixture (kJ/kg·K);
: = exhaust gas inlet and outlet temperatures (°C) before and after recovery.
To ensure accurate calculation of recoverable thermal potential, key operating parameters were estimated from both experimental measurements and technical documentation:
- Exhaust gas mass flow was estimated from fuel consumption and combustion stoichiometry, cross-validated with manufacturer technical sheets.
- Gas temperatures were measured in situ at representative sampling points, with values ranging between 300 °C and 450 °C depending on equipment type.
- Specific heat capacity values were corrected for actual gas composition (CO2, H2O, N2, O2) using thermodynamic property tables.
The analysis assumed some considerations, such as the following:
- Steady-state operating conditions were considered, reflecting the average load factor of each block between 2015 and 2020.
- Heat losses in ducts and exchangers were not included at this stage to establish an upper-bound potential.
- The condenser outlet temperature was fixed at 40 °C, consistent with site cooling water availability.
The calculated thermal potential was validated by comparing estimated values with manufacturer specifications and field measurements. A sensitivity analysis was performed considering ±10% variations in exhaust gas flow and temperature, confirming the robustness of the results and defining confidence intervals for energy recovery estimates.
By applying this procedure, the maximum thermal energy (kWt) and the corresponding recoverable electrical power (kWe) were derived for each thermoelectric unit. These results served as inputs for the subsequent economic and environmental feasibility analysis.
2.4. Actual Heat Potential Determination
Waste heat from thermoelectric generation exhaust gases can be harnessed to produce electricity, heat, or both through cogeneration. The most widely applied technologies are the conventional Rankine Cycle and the Organic Rankine Cycle (ORC) [15], as highlighted by the United States Environmental Protection Agency [16,17]. ORC systems are particularly recommended for heat sources below 300 °C [18], where the use of water in traditional Rankine Cycles becomes less energy efficient [19].
Since the temperatures of the flue gases in the chimneys exceed 300 ºC, it is more appropriate to assess the potential for heat recovery for power generation purposes through the Rankine Cycle (the cycle most used worldwide in thermoelectric plants and constitutes the cycle of ideal steam power). The use of steam in the Rankine Cycle is convenient due to its attractive characteristics, such as low cost, great abundance, and high enthalpy of vaporization [20]. Figure 2 shows the scheme of a plant that operates with the simple Rankine Cycle (without reheating and/or regeneration), in which the following four processes are carried out:
1–2 Isentropic compression in a pump;
2–3 Heat addition at constant pressure in an evaporator or boiler;
3–4 Isentropic expansion in a turbine;
4–1 Heat rejection at constant pressure in a condenser.
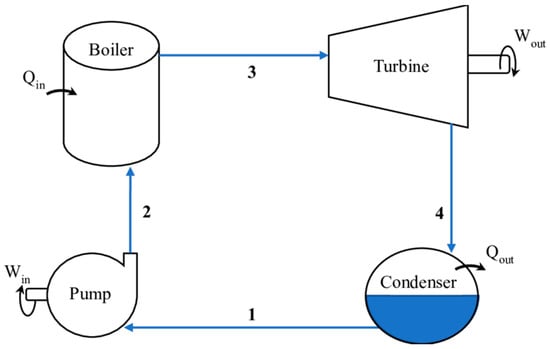
Figure 2.
Rankine Cycle plant scheme [20].
The pump raises the water pressure up to the plant operating pressure. In the evaporator, the generator sets combustion gases to heat the water, generating high-pressure steam which gets expanded in a turbine turning the thermal energy into mechanical energy, and is transformed into electricity using a generator. Finally, the low-pressure steam becomes liquid in a condenser and is sucked into the pump, starting the cycle again.
Given this background, and according to research within the framework of the project “Study of the increase in energy efficiency in thermoelectric plants”, the process of numerical simulation will be used (see Figure 2). With this simulation, the amount of recoverable and usable energy for conversion into electricity is determined.
2.5. Pre-Feasibility Analysis
The selection of thermoelectric units for detailed evaluation was based on a multi-criteria assessment that considered more than mass flow rate. The following parameters were applied systematically:
- Thermal potential: Calculated from exhaust gas temperature (300–450 °C), mass flow, and composition to determine the maximum recoverable heat.
- Operating conditions: Units with stable operation and high average load factors (>60%) were prioritized, as these ensure consistent waste heat availability.
- Technical constraints: Only equipment with sufficient physical space for the installation of heat exchangers and ancillary systems, as verified during site inspections, was considered feasible.
- Economic return: Preliminary calculations of cost–benefit ratio (BCR) and net present value (NPV) were used to exclude systems where the required investment clearly outweighed the potential energy and environmental benefits.
Applying these criteria, the larger turbomachinery (Ruston TB-5000 gas turbines and the Wartsila 16V32LNGD engines) were identified as the most suitable candidates due to their high exhaust mass flow, stable operating profiles, and greater prospects for economic viability, in contrast to the smaller diesel generator sets.
2.6. Economic Feasibility Analysis
It is necessary to determine the cost–benefit relationship to determine the project implementation economic feasibility. Consequently, the following parameters must be considered:
- Investment. This value represents the cost of installing heat recovery equipment (equipment, connection pipes, and accessories); it is expressed in dollars.
- Reference lending rate. Effective active current rates according to the Central Bank from Ecuador for October 2021.
- Discount rate. The discount rate is the cost of capital that is applied to determine the present value of a future payment.
- Working capital. It is the necessary number of resources for a company to carry out its functions and activities normally. It is considered 10% of the investment [20].
- Thermoelectric kilowatt-hour cost (2020). This cost is considered in the generation equipment located on deselected blocks according to the pre-feasibility analysis; it is expressed in USD/kWe.
- Lifetime expressed in years.
- Steam turbine rated power (RP), expressed in kWe.
- Annual operation: 8760 hours per year (AO).
- Average load factor from 2015 to 2020 (LF).
- Plant factor (FP): 95%.
- Economic benefits associated with the investment (EB). This amount represents the cost that EP Petroecuador would have to pay for thermoelectric generation. It is calculated with the next equation:
- Cost benefit relation (BCR). To calculate the ratio, it is necessary to obtain discounted benefits brought to the present, and divide by the sum of the also discounted costs.
- Net present value (NPV). It is an investment criterion that consists of updating the collections and payments of a project or investment to know how much will be gained or lost with that investment.
If BCR > 1, the benefits exceed the costs, and the project should be considered feasible.
If BCR < 1, the costs outweigh the benefits, and the project should not be implemented.
If BCR = 1, this indicates that benefits and costs are balanced, with no net gain; however, some projects may remain at this threshold temporarily and later surpass it due to factors such as cost reductions.
2.7. Environmental Feasibility Analysis
To carry out this analysis, the annual economic benefit generated by the investment will be considered, plus the price of the carbon credit (October 2021) of 2 USD/Ton CO2 equivalent avoided [21,22]. According to the Stern–Stiglitz commission in 2017, the price of carbon credits should increase between USD 50 and USD 100 per ton of carbon dioxide avoided by 2030, according to the agreements made by the countries and participants of the 2015 Paris Agreement [23].
Therefore, the economic viability analysis will be carried out considering the evolution of the current price of a carbon credit from USD 2 in 2021 to an average price of USD 100/Ton CO2 eq by 2030, stipulated by the Stern–Stiglitz commission [24,25].
3. Results and Discussion
3.1. Annual Asset Production
For the 2015–2020 period, a total of 636.15 million bbls were extracted in the six blocks, corresponding to 55.30% of national oil production. The blocks with the highest oil production were 57-SH, 61-AU, and 60-SCH, with a production of 160.44, 152.05, and 151.05 million bbls, respectively, while the block with the lowest production was 57-LB with 33.83 million bbls. The annual oil production by prioritized block is evidenced in Figure 3.
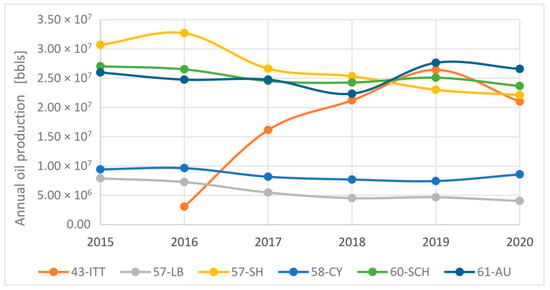
Figure 3.
Annual oil production by prioritized block, 2015–2020 [10].
3.2. Diesel Consumption for Thermoelectric Generation
Diesel prices have varied since October 2015, with an average cost between 2015 and 2020 of USD 1.80 per gallon. Block 43-ITT, not being connected to the National Interconnected System (SNI) due to its geographic location and producing 14.63 million bbls of oil on average annually, consumes the largest amount of diesel (53.44 million gal) after field 61-AU (75.38 million gal), which extracts 25.34 million bbls of oil, despite being fed with about 72 GWh on average, since 2018, by the SNI. The block with the lowest diesel consumption is block 57-LB with 17.69 million gal. Due to its low oil production, Figure 4 shows the consumption of diesel for thermoelectric generation.
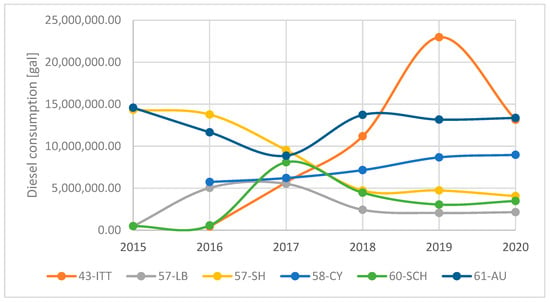
Figure 4.
Diesel consumption for thermoelectric generation by prioritized block, 2015–2020 [10].
3.3. Annual Thermoelectric Generation
Thermoelectric generation is defined by the amount of oil produced and the interconnection with SNI. In the case of block 43-ITT, whose oil production has been increasing considerably since the beginning of exploitation, and as it is not connected to the SNI, it is the block that has produced the greatest thermoelectric generation, with a peak generation of 32.37 GWh in 2019, and producing 26.41 million bbls of oil in the study period. The annual thermoelectric generation is shown in Figure 5.
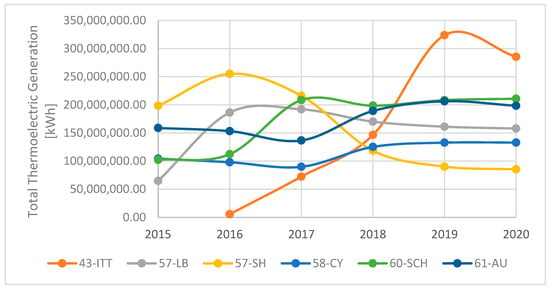
Figure 5.
Total thermoelectric generation by prioritized block, 2015–2020 [10].
3.4. Usable Heat Recovery Potential
According to the methodology described in Section 2.5 and the data collected during the technical visits carried out by the IIGE in 2021 [26], the potential for recovery of heat that can be converted into electricity through the Rankine Cycle in the thermoelectric generation equipment of the prioritized blocks has been determined, as summarized in Table 1.

Table 1.
Electrical energy recoverable through the Rankine Cycle in the prioritized blocks.
3.5. Economic Viability Analysis
According to the results presented in Table 1 for the Ruston TB-5000 turbines of the Shushufindi Process Center and the Wartsila 16V32LNGD engines, the net present value (NPV) and the cost–benefit relationship will be analyzed to determine the economic viability.
According to Table 2, the cost–benefit analysis indicates that the implementation of heat recovery at the Shushufindi Processing Plant is currently not viable, since the investment and associated expenses are almost equivalent to the economic benefits generated by fossil fuel savings (average load factor in 2015–2020 was 63.67%). However, if the load factor were to increase to 80% annually, the cost–benefit ratio would rise to 1.29, making the project feasible. In contrast, the Secoya facility shows an unfavorable scenario, where the combined investment and expenses exceed the NPV of economic benefits by 131%. Furthermore, for diesel generator sets, the feasibility ratio is consistently very low or negative, reflecting their limited thermal potential and poor economic return compared to larger turbomachinery such as the Ruston TB-5000 and Wartsila 16V32LNGD units.

Table 2.
Analysis parameters to determine the feasibility of the implementation of heat recovery.
3.6. Evaluation of Pre-Feasibility Findings
The candidate systems were compared using a multi-criteria evaluation matrix that included thermal potential, operating stability, technical feasibility of retrofitting, and preliminary economic indicators (BCR and NPV). As shown in Table 3, the Ruston TB-5000 turbines and Wartsila 16V32LNGD engines were selected for detailed evaluation due to their higher exhaust flows, favorable operating conditions, and realistic prospects for economic viability. In contrast, diesel generator sets and smaller gas engines were excluded, as their low thermal potential, limited load factors, and negative economic performance made them unsuitable for waste heat recovery implementation.

Table 3.
Comparative evaluation matrix for heat recovery system candidates.
Consequently, the ideal places for the implementation of heat recovery are as follows:
- Block 57—Shushufindi—Shushufindi Process Center.
- Block 57—Libertador—Secoya Generation Plant
3.7. Environmental Viability
According to the economic viability analysis carried out, the implementation of heat recovery equipment is not viable at the current time; however, as the price of a carbon credit increases over time [22], the cost–benefit relationship will increase, as evidenced in Figure 6.
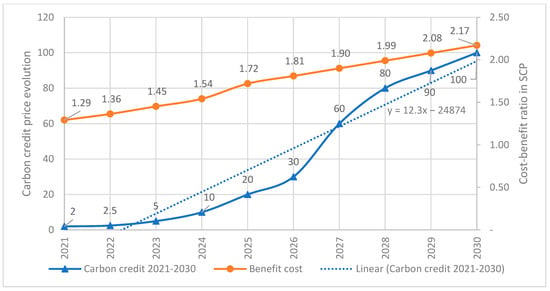
Figure 6.
Evolution of the cost–benefit relationship according to the increase in the price of a carbon credit until 2030.
3.8. Uncertainty and Sensitivity Analysis
To evaluate the robustness of the economic and environmental results, a sensitivity analysis was performed considering three key variables: load factor, carbon credit price, and discount rate. For the Shushufindi case study, increasing the average load factor from 63.7% to 80% raised the benefit–cost ratio (BCR) from 1.03 to 1.29, confirming the strong influence of operating conditions on project viability. Similarly, carbon price scenarios were tested, ranging from 2 USD/tCO2 (current level, 2021) to 100 USD/tCO2 (projected by 2030, Stern–Stiglitz Commission). Under the higher carbon price scenario, the BCR nearly doubled, highlighting the importance of regulatory and market incentives. Finally, adjusting the discount rate between 5% and 10% altered the net present value (NPV) by up to ±18%, indicating moderate sensitivity to financing assumptions.
Overall, the sensitivity analysis confirms that while the economic viability of waste heat recovery is marginal under current conditions, it becomes significantly more attractive under higher load factors and carbon credit valuations, underscoring the relevance of operational optimization and supportive policy frameworks.
4. Conclusions and Recommendations
Block 61-AU registered the highest diesel consumption during the study period, with 75.38 million gallons in total, since in 2015, its thermoelectric generation relied 95.75% on diesel. Block 43-ITT followed with 53.44 million gallons, largely due to its geographical isolation and lack of connection to the National Interconnected System (SNI). By contrast, block 57-LB showed the lowest diesel consumption (17.69 million gallons), reflecting its lower oil production and greater reliance on crude oil and gas for power generation.
Block 43-ITT also produced the greatest thermoelectric generation, reaching a peak of 323.70 GWh in 2019 to support 26.41 million bbl. of oil, fully consuming the energy it generated on site due to its disconnection from SNI. Conversely, block 57-SH exhibited the lowest thermoelectric generation (85.41 GWh of 365.52 GWh required), with its energy demand significantly reduced after integration with the SNI in 2018.
The feasibility analysis indicates that heat recovery implementation is technically viable at the Shushufindi Process Plant, where the two Ruston TB-5000 turbines (29.74 kg/s combined mass flow) could generate up to 1.9 MWe. The cost–benefit ratio under current conditions is 1.03, considering an avoided emission value of 2 USD/tCO2 [22]. However, higher load factors and increased carbon credit prices would substantially improve economic performance; for instance, raising the load factor to 80% increases the ratio to 1.29. In contrast, if carbon credit prices remain at 2 USD/tCO2 and operating conditions do not improve, the ratio would remain marginal at 1.03.
While this study demonstrates the technical feasibility of waste heat recovery in Ecuador’s oil sector, several limitations persist. These include variability in flue gas flow, integration challenges with existing infrastructure, and elevated maintenance demands in remote Amazonian facilities. Economic barriers, such as uncertainty in long-term carbon credit pricing and restricted access to financing, may also hinder large-scale deployment. Future research should therefore address these technical and policy constraints to ensure that waste heat recovery becomes a practical and sustainable pathway for improving energy efficiency and reducing emissions in the petroleum industry.
Author Contributions
Conceptualization, A.C.-D. and M.M.; methodology, A.C.-D., M.M., and R.V.; software, A.C.-D., M.M., and R.V.; validation, J.M.-G.; formal analysis, A.C.-D., M.M., and R.V.; investigation, A.C.-D., M.M., and R.V.; resources, J.M.-G.; data curation, A.C.-D., M.M., and R.V.; writing—original draft preparation, A.C.-D., M.M., and R.V.; writing—review and editing, J.M.-G.; visualization, A.C.-D., M.M., and R.V.; funding acquisition, J.M.-G. All authors have read and agreed to the published version of the manuscript.
Funding
This research was supported by Universidad Internacional SEK, grant number P121819.
Institutional Review Board Statement
Not applicable.
Data Availability Statement
Original data are available upon request.
Acknowledgments
This study is a component of the Parque de Energias Renovables project P121819, which was started by Universidad Internacional SEK.
Conflicts of Interest
The authors declare no conflicts of interest.
Abbreviations
| Abbreviation | Definition |
| AO | Annual Operation |
| ARCERNNR | Agencia de Regulación y Control de Energía y Recursos Naturales No Renovables (Regulatory and Control Agency of Energy and Non-Renewable Natural Resources, Ecuador) |
| BCR | Benefit–Cost Ratio |
| bbls | Barrels of Crude Oil |
| C/B | Cost–Benefit Ratio |
| CO2 | Carbon Dioxide |
| EB | Economic Benefit |
| FP | Plant Factor |
| GWh | Gigawatt-hour |
| IIGE | Instituto de Investigación Geológico y Energético (Geological and Energy Research Institute, Ecuador) |
| kWe | Kilowatt-electric |
| kWt | Kilowatt-thermal |
| LF | Load Factor |
| MWe | Megawatt-electric |
| NPV | Net Present Value |
| ORC | Organic Rankine Cycle |
| PEC | Petroecuador (Empresa Pública) |
| RC | Rankine Cycle |
| RP | Rated Power |
| SNI | Sistema Nacional Interconectado (National Interconnected System, Ecuador) |
References
- Beuermann. Requisitos Para Una Transición Energética Global; Friedrich Ebert Stiffung: Berlin, Germany, 2014; Available online: http://biblioteca.olade.org/opac-tmpl/Documentos/cg00361.pdf (accessed on 30 June 2020).
- IEA. World Energy Outlook 2021; OECD: New York, NY, USA, 2021. [Google Scholar]
- Albavera, F.S.; Vargas, A. La volatilidad de los precios del petróleo y su impacto en América Latina. In Naciones Unidas, CEPAL; División de Recursos Naturales e Infraestructura: Santiago, Chile, 2005; Available online: http://www.cepal.org/publicaciones/RecursosNaturales/3/LCL23PE/lcl2389e.pdf (accessed on 30 June 2020).
- González, M.Á.M. Recursos externos, volatilidad y crecimiento económico en países de América Latina, 1990–2015. Cuad. Econ. 2022, 41, 77–108. [Google Scholar] [CrossRef]
- Agencia de Regulación y Control Hidrocarburífero (ARCH). Producción Mensual Nacional de Petróleo Fiscalizado; Agencia de Regulación y Control Hidrocarburífero (ARCH): Quito, Ecuador, 2020; pp. 2010–2020. Available online: https://www.controlhidrocarburos.gob.ec/wp-content/uploads/PRODUCCIÓN-FISCALIZADA-2010-2020.pdf (accessed on 30 June 2020).
- Nowicki, C.; Gosselin, L. An overview of opportunities for waste heat recovery and thermal integration in the primary aluminum industry. JOM 2012, 64, 990–996. [Google Scholar] [CrossRef]
- Nikolaisen, M.; Andresen, T. System impact of heat exchanger pressure loss in ORCs for smelter off-gas waste heat recovery. Energy 2021, 215, 118956. [Google Scholar] [CrossRef]
- INER. Estudio de Incremento de Eficiencia Energética en Plantas Termoeléctricas, Quito—Ecuador. 2017. Available online: https://www.celec.gob.ec/termopichincha/index.php/blog/noticias/316-prototipo-de-planta-de-cogeneracion-orc (accessed on 30 June 2020).
- Noboa, D.D. Consultoría: Apoyo a la gestión de la eficiencia energética en el Sector Hidrocarburos. Diagnóstico de la situación energética en el Sector Hidrocarburos. Banco Interam. Desarro. 2018, 1, 292. [Google Scholar]
- Guerron, G.; Nicolalde, J.F.; Martínez-Gómez, J.; Dávila, P.; Velásquez, C. Experimental analysis of a pilot plant in Organic Rankine Cycle configuration with regenerator and thermal energy storage (TES-RORC). Energy 2024, 308, 32964. [Google Scholar] [CrossRef]
- Li, M.-J.; Tao, W.-Q. Review of methodologies and polices for evaluation of energy efficiency in high energy-consuming industry. Appl. Energy 2017, 187, 203–215. [Google Scholar] [CrossRef]
- Chauvin, D.; Depraz, S.; Buckley, H. Saving Energy in the Oil and Gas Industry. In All Days; SPE: Dallas, TX, USA, 2008; pp. 1881–1890. [Google Scholar] [CrossRef]
- Campana-Díaz, A.; Moya, M.; Urresta, E.; Harnisth, R. Energy and environmental performance indicators at upstream oil facilities in Ecuador. CienciAmérica 2024, 13, 63–81. [Google Scholar] [CrossRef]
- PEC. Producción Total de Activos Petroleros 2015–2020, Quito—Ecuador. 2020. Available online: https://www.eppetroecuador.ec/ (accessed on 30 June 2020).
- Sun, W.; Yue, X.; Wang, Y. Exergy efficiency analysis of ORC (Organic Rankine Cycle) and ORC-based combined cycles driven by low-temperature waste heat. Energy Convers. Manag. 2017, 135, 63–73. [Google Scholar] [CrossRef]
- United States Environmental Protection Agency (EPA). Waste Heat to Power Systems; EPA: Washington, DC, USA, 2012.
- EPA. Greenhouse Gas Equivalencies Calculator. United States Environmental Protection Agency (EPA). Available online: https://www.epa.gov/energy/greenhouse-gas-equivalencies-calculator#results (accessed on 30 June 2020).
- Braimakis, K.; Karellas, S. Thermodynamic investigation of integrated organic Rankine cycle-ejector vapor compression cooling cycle waste heat recovery configurations for cooling, heating and power production. Energy 2024, 304, 132020. [Google Scholar] [CrossRef]
- Karellas, S.; Leontaritis, A.-D.; Panousis, G.; Bellos, E.; Kakaras, E. Energetic and exergetic analysis of waste heat recovery systems in the cement industry. Energy 2013, 58, 147–156. [Google Scholar] [CrossRef]
- Wang, Y.; Tang, Q.; Wang, M.; Feng, X. Thermodynamic performance comparison between ORC and Kalina cycles for multi-stream waste heat recovery. Energy Convers. Manag. 2017, 143, 482–492. [Google Scholar] [CrossRef]
- Hermesmann, M.; Müller, T.E. Green, Turquoise, Blue, or Grey? Environmentally friendly Hydrogen Production in Transforming Energy Systems. Prog. Energy Combust. Sci. 2022, 90, 100996. [Google Scholar] [CrossRef]
- CPLC. Carbon Pricing Leadership Report 2020/21. Washington, DC. 2021. Available online: https://static1.squarespace.com/static/54ff9c5ce4b0a53decccfb4c/t/60ba4a7d2f4d4b6e0ace36c4/1622821505499/CPLC%2BReport%2B2021_Final.pdf (accessed on 30 June 2020).
- Joseph, S. Report of the High-Level Commission on Carbon Prices; The World Bank Group: Paris, France, 2017. [Google Scholar]
- Stiglitz, J.E. Addressing climate change through price and non-price interventions. Eur. Econ. Rev. 2019, 119, 594–612. [Google Scholar] [CrossRef]
- Stern, N. Towards a carbon neutral economy: How government should respond to market failures and market absence. J. Gov. Econ. 2022, 6, 100036. [Google Scholar] [CrossRef]
- IIGE. Estudio de Recuperación de Calor en Refinerías y Pozos Referenciales en el Sector Petrolero, Quito—Ecuador. 2021. Available online: https://www.geoenergia.gob.ec/estudio-de-procesos-de-recuperacion-de-calor-en-refinerias-y-pozos-referenciales-del-sector-petrolero/ (accessed on 30 June 2020).
Disclaimer/Publisher’s Note: The statements, opinions and data contained in all publications are solely those of the individual author(s) and contributor(s) and not of MDPI and/or the editor(s). MDPI and/or the editor(s) disclaim responsibility for any injury to people or property resulting from any ideas, methods, instructions or products referred to in the content. |
© 2025 by the authors. Licensee MDPI, Basel, Switzerland. This article is an open access article distributed under the terms and conditions of the Creative Commons Attribution (CC BY) license (https://creativecommons.org/licenses/by/4.0/).