1. Introduction
Flexible DC transmission technology, based on voltage source converters (VSC-HVDC), is increasingly vital for modern power systems due to its advantages in power quality, controllability, and integration with renewable energy [
1,
2]. However, the reliability of these systems is highly dependent on the DC transmission line, which statistically has the highest fault incidence in an HVDC system [
3,
4]. Therefore, rapid and accurate fault location is critical for system stability and equipment safety.
Current fault location methods for transmission lines can be broadly classified into two categories: impedance-based methods and traveling-wave-based methods [
5,
6]. Impedance-based methods estimate the fault distance by leveraging the apparent impedance seen at a terminal, assuming a known relationship between the measured impedance and the line length. While simple, impedance methods are sensitive to fault conditions—their accuracy is easily affected by the fault type, fault location, and transition resistance. Moreover, in DC systems, calculating impedance from time-domain signals is susceptible to noise and interference [
7], limiting the effectiveness of impedance-based approaches for DC line fault location.
Traveling wave-based fault location methods determine the fault position by analyzing the high-frequency transient voltage and current waves produced by a fault. These methods have become the primary technique for DC line fault location. There are two main approaches: single-ended methods [
8,
9] and double-ended (two-terminal) methods [
10,
11]. The single-ended traveling wave method uses measurements from only one end of the line. It computes the fault distance by measuring the time difference between the arrival of the initial fault traveling wave(IFTW) and the arrival of a subsequent wave reflected from the fault point. This approach does not require communication between line ends. However, a major challenge for single-ended methods is accurately identifying the fault-point reflected wave (the wave reflected back from the fault) among other transients. The IFTW is followed by multiple reflections and refractions at various impedance discontinuities in the system, so the fault-point reflection can be obscured by other waveforms and is difficult to discern with certainty. The double-ended method, on the other hand, uses synchronized measurements at both ends of the line. It relies on the time difference between the arrivals of the IFTW at the two line ends to calculate the fault location. The double-ended approach uses only the first fault wave (which is relatively unaffected by interference), but it requires strict time synchronization between the two ends. In practice, limited timing accuracy or clock synchronization errors between the recording devices can introduce significant location errors in the double-ended method.
A fundamental challenge common to both traditional traveling wave methods is their reliance on an accurately known wave propagation velocity (v). In practice, v is often estimated as a constant, but it varies with line parameters and frequency, leading to significant location errors.
Recent research has attempted to address these limitations. Methods leveraging differences in modal propagation velocities (e.g., zero-mode and line-mode) have been proposed to circumvent synchronization requirements [
12,
13] or the need for FPRW identification [
14]. However, these approaches still require precise values for the modal velocities, which are difficult to determine in practice. Another method [
15] eliminates the need for preset wave speeds and synchronization by using the time difference between zero-mode and line-mode waves at the same end, but its reliability is constrained by the severe attenuation of zero-mode components in real HVDC lines.
In summary, the key challenges hindering accurate traveling wave fault location remain: (1) the difficulty of identifying the FPRW in single-ended methods, (2) the requirement for high-precision synchronization in double-ended methods, and (3) the uncertainty of wave propagation speed.
To overcome these intertwined limitations, this paper proposes an improved double-ended traveling wave fault location method for flexible DC transmission lines. The proposed method synergistically combines the advantages of both single-ended and double-ended approaches. It utilizes the inherent properties of DC line smoothing reactors to simplify wave identification and introduces a novel algorithm that is inherently independent of both wave speed variations and synchronization errors. This integration significantly enhances location accuracy, as validated by simulations and comparisons with conventional methods.
3. Analysis of Traveling Wave Reflection and Refraction in DC Transmission Lines
Smoothing reactors are installed at both ends of most flexible DC transmission lines. These reactors serve as line boundaries and have a strong blocking effect on high-frequency components. As a result, traveling waves originating from a fault on the line will be almost totally reflected when they reach the line ends (the terminals at the converters). This characteristic helps isolate the line from external network transients and makes the reflection patterns on the line easier to analyze. In this section, we analyze the process of traveling wave reflection and refraction on a flexible DC line, which forms the basis for the proposed fault location method.
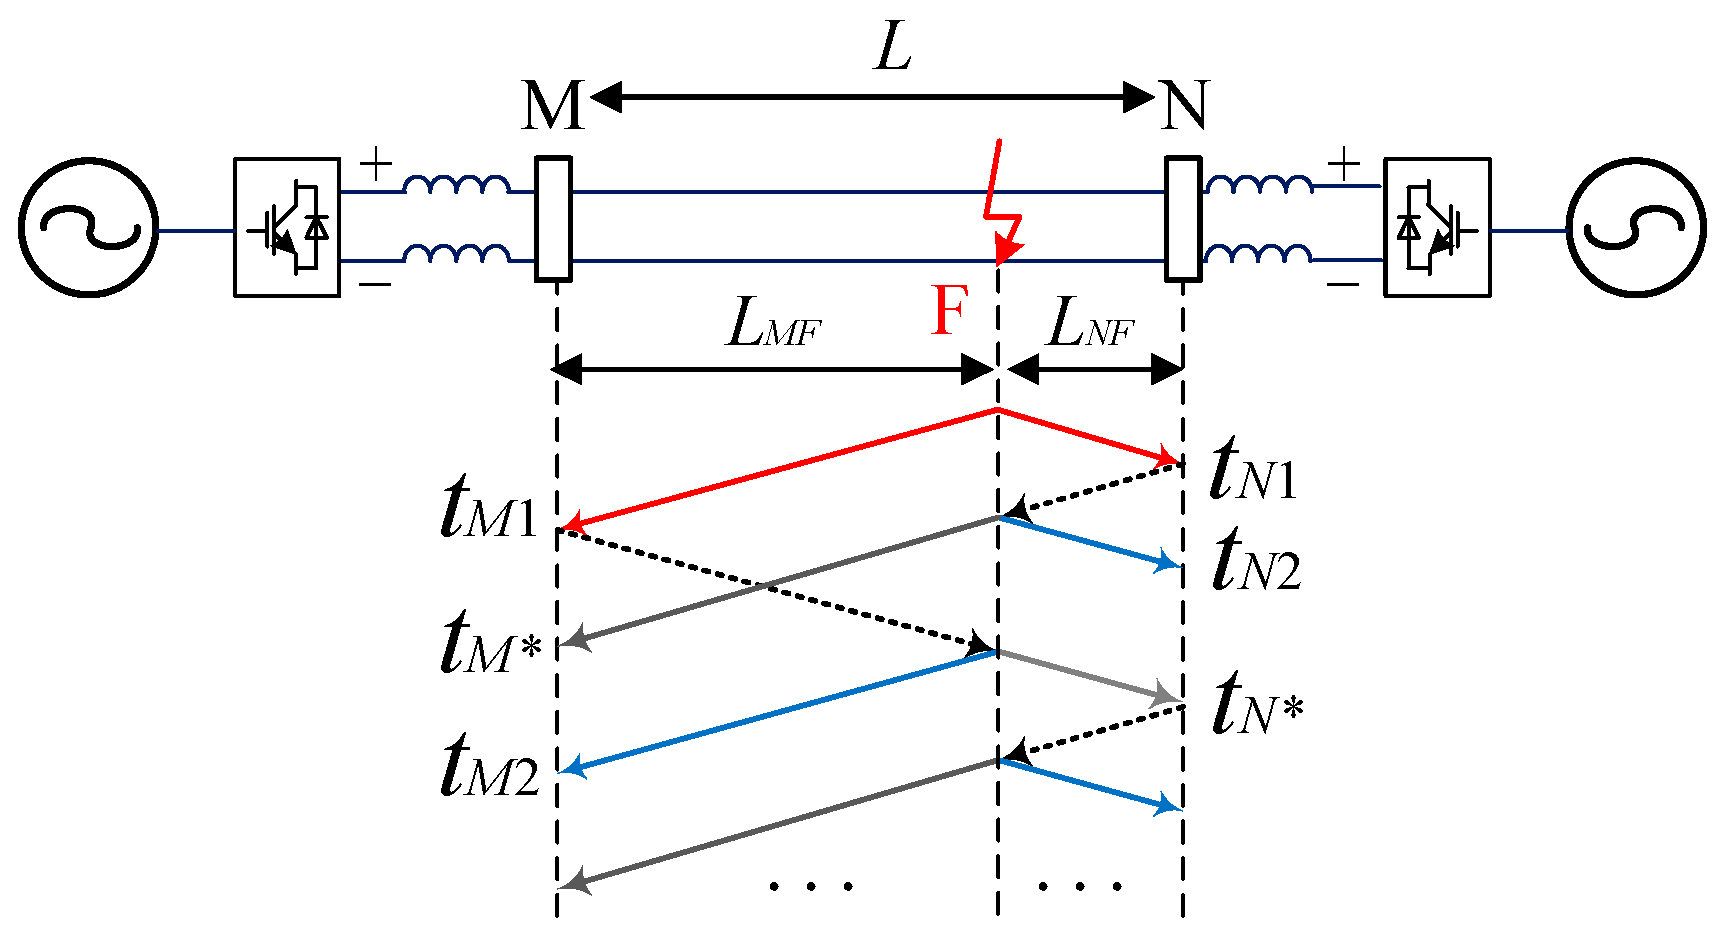
Figure 3 illustrates the topology of a typical flexible DC transmission line and the propagation of traveling waves following a fault. The positive and negative poles of the converter’s DC side are connected to smoothing reactors. Measurement points M and N (with line length L between them) are located on the line side of these smoothing reactors at the two ends. Suppose a ground fault occurs at point F along the line, at distances
LMF from M and
LNF from N (so
LMF +
LNF =
L). After the fault at F, high-frequency traveling waves are launched from the fault point and propagate toward both ends of the line. Because the smoothing reactors present a very high impedance to the high-frequency transient, each incident wave is almost fully reflected upon reaching M or N.
The time when the IFTW arrives at M is denoted tM1, and the time it arrives at N is tN1. After this initial wave, the system will experience multiple successive traveling wave fronts due to reflections between the line ends and the fault point. Each traveling wave will continue to reflect and forth between impedance discontinuities (the fault point and the line ends) until its amplitude decays below the measurable range, at which point the transient dies out and the system settles to a steady state following the fault. Thus, a series of wavefronts is recorded at each measurement point following the fault, which we can refer to as a wavefront ensemble.
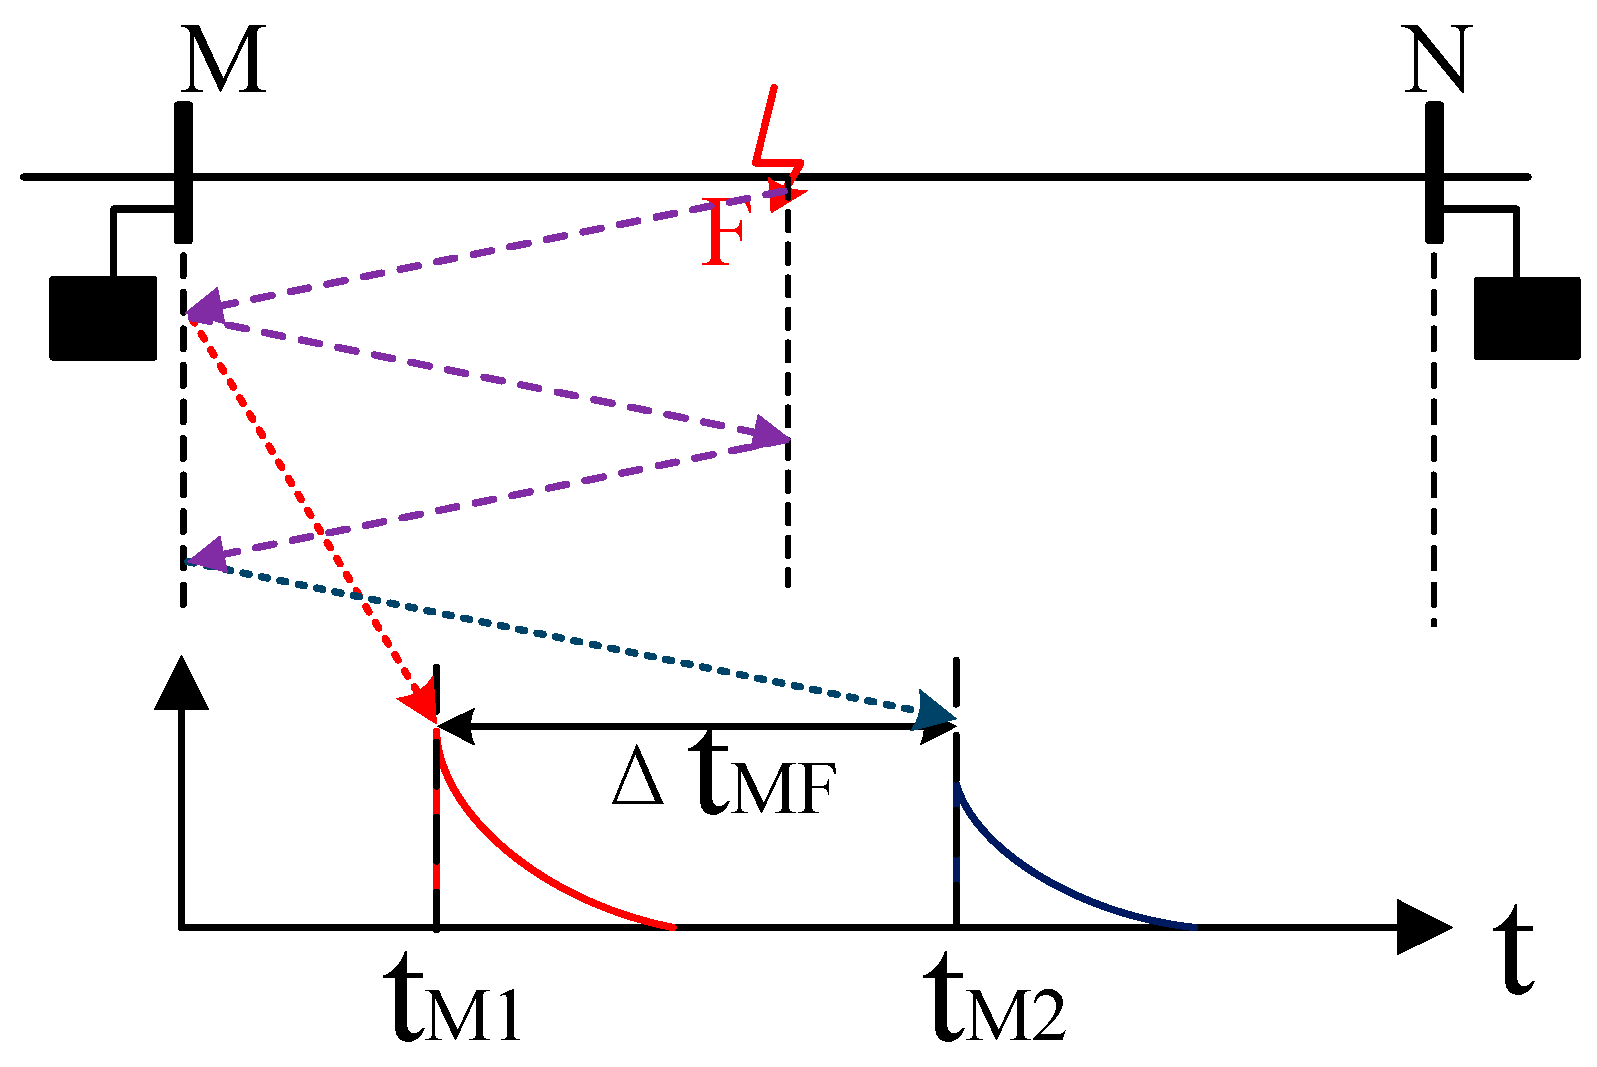
Based on the locations where these reflections occur, the ensemble of wavefronts can be categorized into two types: (i) those originating from reflections at the opposite end busbar, and (ii) those originating from reflections at the fault point. For clarity, we introduce two terms for these categories (using the perspective of point M as an example):
Opposite-Busbar Reflected Wave (OBRW): This refers to a traveling wave that has reflected off the remote end of the line (the converter busbar at the N end) and then traveled back to the other side. For example, starting from a fault at F, a wave propagates to the opposite end N, undergoes essentially total reflection at the N busbar (because of the smoothing reactor’s open-circuit effect), and then travels back towards M. The arrival of this reflected wave at M is recorded at time tM*. Any wave fronts generated by partial refractions during this process (for instance, at the fault point when the wave passes through) are also considered part of the opposite-busbar reflected wave set. In summary, the OBRW set consists of wavefronts that have reflected from the far end (N) before arriving at the local end (M).
Fault-Point Reflected Wave (FPRW): This is the traveling wave that has reflected from the fault point itself. In the sequence of events for the M side, the IFTW from F to M is fully reflected at M (again due to the smoothing reactor). This reflected wave then travels back toward the fault point F, where it reflects (partially, since the fault presents a finite impedance) and returns to M. The wave that returns to M from the fault constitutes the fault-point reflected wave. We denote its arrival time at M as tM2 (this is the same quantity introduced in the single-ended method). Likewise, on the N side, a similar wave would arrive at time tM2. Together with any refracted components generated during propagation, these constitute the FPRW set—the set of wavefronts that have reflected off the fault point before reaching the measurement location.
Because the smoothing reactors prevent most external surges from entering the line, any traveling wave recorded at M or N after the IFTW must belong to one of the two categories above: either an opposite-busbar reflected wave (OBRW) from the opposite end, or a fault-point reflected wave (FPRW). The task then is to distinguish the FPRW from the OBRW in the measurement data. The following analysis focuses on the M-side measurements for illustration; an analogous reasoning holds for the N side.
When a traveling wave encounters the fault point F, a portion of its energy is transmitted (refracted) past the fault, and the remainder is reflected. To characterize this, let the transition resistance at the fault point be RF, and let ZC be the surge impedance (characteristic impedance) of the line. According to Pedersen’s formula for wave splitting at an impedance discontinuity, the fault can be modeled as an equivalent impedance R (combining RF in parallel with the line behind the fault point) seen by the incoming wave.
Figure 4 shows an equivalent circuit representation at the fault. In this model, U
0 represents the incident traveling wave arriving at the fault. The fault behaves like an impedance R in parallel with the line’s surge impedance
ZC. When the incident wave reaches point F, it generates a refracted wave U
z that propagates beyond the fault and a reflected wave U
r that travels back from the fault towards the line ends. The reflection coefficient at the fault can be given as follows:
In Equation (4), due to the parallel relationship, we have R < ZC, the reflection coefficient ρ < 0, and |ρ| < 1. This indicates that whenever a traveling wave propagates to the fault point, a reflected wave with opposite polarity to the incident wave is generated, and the reflected wave amplitude is smaller than the incident wave. At the line boundary, due to the high-frequency blocking effect of the flat-wave reactor, R ≈ + ∞. The incident traveling wave undergoes total reflection, i.e., ρ ≈ 1, without altering the polarity of the incident wave.
Next, we compare the propagation paths of OBRW and an FPRW to further understand their differences:
OBRW Path: Starting from fault F, a wave travels to the N-end of the line, undergoes a total reflection at the N busbar (smoothing reactor), then travels back toward the fault. When it reaches the fault point F, part of it refracts through the fault (since the fault is not an open circuit) and continues to M. Thus, for a wave to go from F to M via the opposite-end reflection path, it undergoes one reflection at N and one refraction through F.
FPRW Path: Starting again from fault F, a wave travels directly to the M-end, is totally reflected at M, then travels back to F, and is reflected at F (with opposite polarity) to finally reach M. In this path, the wave undergoes one reflection at M and one reflection at F.
In summary, the OBRW omits one reflection at the fault compared to the FPRW. Instead, it includes a refraction at the fault. Therefore:
The OBRW arriving at M has the same polarity as the IFTW. This is because it was reflected at N with no polarity change and passed through the fault via refraction (which does not invert polarity, as the transmitted wave’s polarity is dictated by the incident wave). Essentially, the single polarity inversion at the fault for the refracted portion does not occur; the wave that makes it to M via this path has been reflected only at the busbar (no inversion) and transmitted through the fault (no inversion of the transmitted portion’s polarity).
The TWRF arriving at M has opposite polarity to the IFTW, because it underwent a reflection at the fault point (which inverts polarity, ρ < 0 in its journey).
This polarity distinction provides a basis for identifying which wavefront is the FPRW. Immediately after a fault occurs in a DC line, the IFTW launched from the fault typically has a certain polarity (for example, a pole-to-ground fault on the positive pole will produce a negative polarity surge traveling outwards on that pole). Suppose in our scenario, the IFTW recorded at M has negative polarity. Based on the above reasoning:
If the second significant wavefront detected at M after the initial wave has positive polarity, then that wavefront must be the FPRW. In this case, we can immediately identify it and mark its arrival time as tM2.
If instead the second wavefront at M has negative polarity, this indicates that the OBRW arrived before the FPRW. In this situation, the fault-point reflected wave will arrive later. However, not every subsequent positive wavefront is necessarily the fault-point reflection, because multiple wavefronts from the opposite busbar reflection set (OBRW set) could also arrive, some of which might be positive due to complex refractions. Due to attenuation, the amplitudes of wavefronts in each set (busbar-reflected and fault-reflected) generally decrease over time. Once the first busbar-reflected wave (negative polarity) has arrived, the waves from the two sets will arrive interleaved in time. To identify the fault-point reflection among them, we can observe the trend of the wavefront magnitudes: typically, after the initial negative wave (busbar reflection) at M, the next arriving waves will cause the measured wave amplitude to first decrease (as the tail of the negative wave passes) and then at some point increase when the fault-reflected wave (positive) begins to dominate. If we plot or examine the wavelet transform modulus of the transient, we would see a local maximum from the busbar wave, then a drop, then another rise when the fault wave arrives.
Identification rule: If the first post-initial wavefront has negative polarity, continue monitoring the wavefront sequence. The traveling wave amplitude at M will initially show a downward trend, followed by an upward kick when a positive wave arrives. Record the time of the first significant positive peak in the measured wave amplitude after that initial negative wave. If the wave corresponding to this peak is positive in polarity, that wave is identified as the FPRW. If, unexpectedly, that wave were also negative, then the search continues: in practice, the largest-amplitude positive-polarity wavefront within a reasonable post-fault time window will be the FPRW. We denote the identified arrival time of the fault-point reflected wave at M as tM2. On the rare occasion that the fault is exactly at the midpoint of the line, the first busbar-reflected wave and the fault-point wave arrive at M simultaneously. In that case, because the OBRW has suffered an extra attenuation due to refraction at the fault, the combined wavefront observed at M is dominated by the FPRW and will have the polarity of the fault-point wave (i.e., positive in this scenario).
By analyzing the changes in wavefront amplitude and polarity as described above, we can determine the arrival time of the fault-point reflected wave at each end of the line:
tM2 on the M side and
tN2 on the N side. Once these are identified, we can calculate the local propagation time differences:
which are the travel time intervals between the initial fault surge and the fault-point reflected wave at each end. These time differences Δ
tMF and Δ
tNF inherently contain the information about the distances from the fault to M and N, respectively, but importantly, they do not depend on the absolute arrival times or a common clock—each is measured locally at one end.
4. Wave-Speed-Independent Traveling Wave Location Method
The key insight of the proposed method is that by using the time differences Δ
tMF and Δ
tNF from each end (obtained as described in
Section 3), one can determine the fault location without needing to know the exact wave speed v or maintain synchronized clocks. The values Δ
tMF and Δ
tNF are effectively the round-trip travel times from the fault to each end (M and N, respectively), and thus they directly relate to the distances
LMF and
LNF. Specifically, if
v is the wave propagation velocity, then by the single-ended time-of-flight principle, we have approximately:
Assuming the traveling wave propagation velocity is
v, based on the single-ended ranging formula, the following relationship holds:
Furthermore, since
L =
LMF +
LNF, we have the following:
Thus, using the information from the measurement points at both ends and eliminating the velocity using Equation (6), we obtain the following ranging formula:
In Equation (7), since the calculations involve the time differences locally computed at points M and N, clock synchronization between the two ends is unnecessary. Only ΔtMF and ΔtNF need to be uploaded to the master station or one-end device. This significantly reduces communication overhead and, in principle, eliminates ranging errors caused by limited clock synchronization accuracy.
Based on
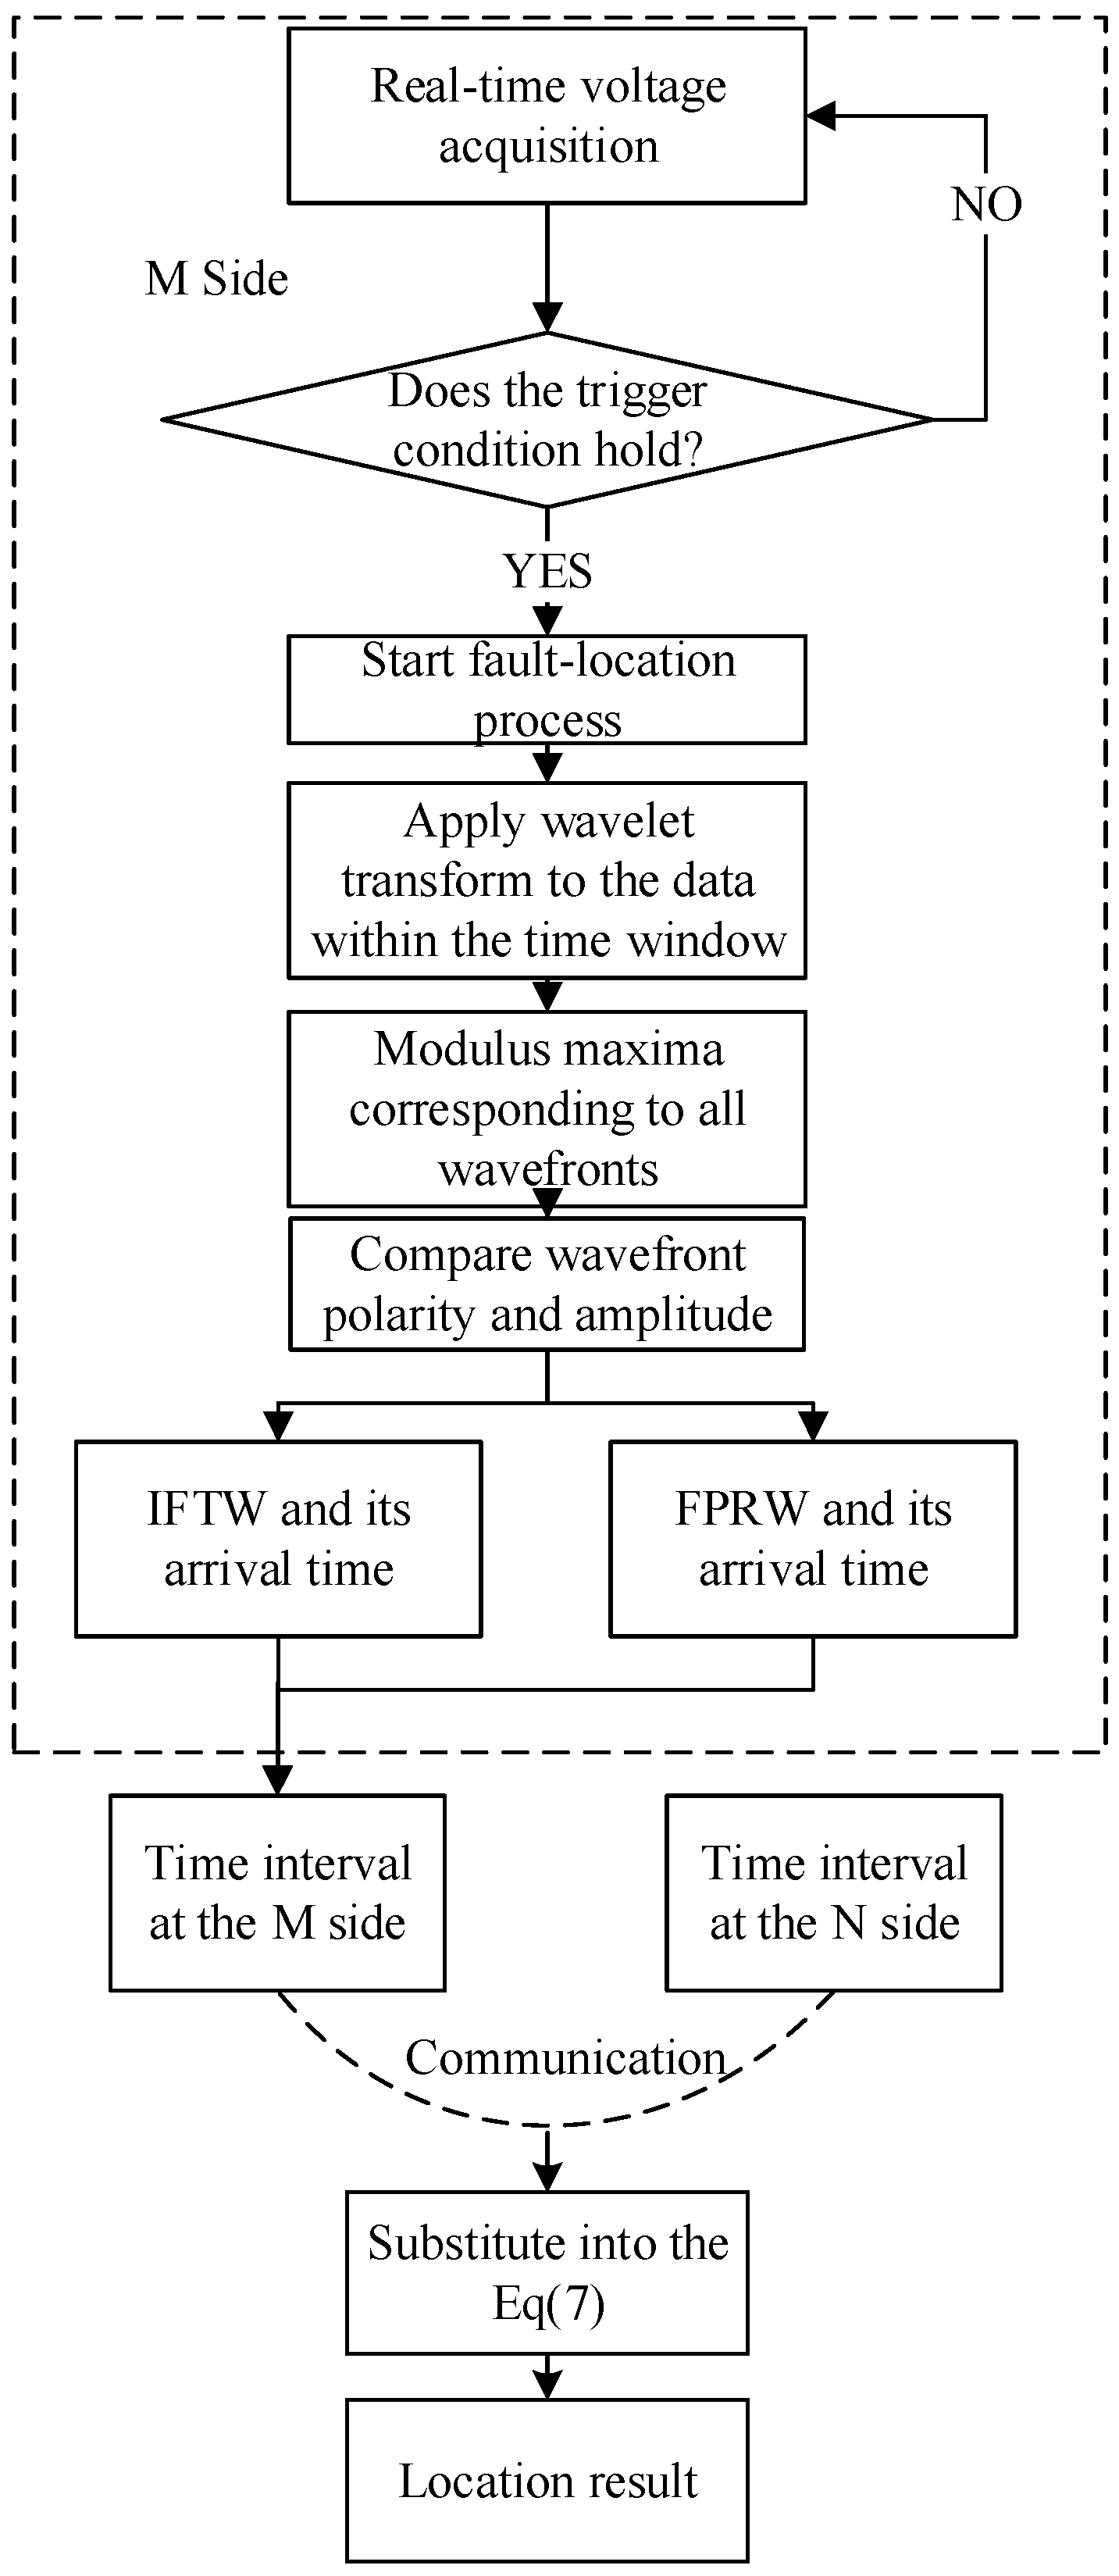
Section 3 and the derivation of the above formula, the following distance measurement algorithm flow is established:
Fault Detection and Data Acquisition: When a fault is detected on the line, begin high-speed recording of transient voltages (or currents) at measurement points M and N. Use a sufficiently high sampling rate to capture the traveling wave fronts.
Initial Wave Arrival Time Identification: Determine the arrival of the initial fault traveling wave at each end. This can be achieved by finding the first significant wavefront or the first peak in the signal’s wavelet transform modulus. Record these times as tM1 and tN1 for the M side and N side, respectively. (In practice, a wavelet transform or a threshold detection on the measured surge can be used to pick out the first arrival.)
Identify the Fault-Point Reflected Wave: Using the criteria from
Section 3, analyze the subsequent wavefronts at each end to find the arrival of the fault-point reflected wave. This involves checking the polarity of the wavefronts after the initial arrival:
- 3.1
If the second wavefront at a measurement point has opposite polarity to the first, classify it immediately as the fault-point reflection and record its arrival time (tM2 or tN2).
- 3.2
If the second wavefront has the same polarity as the first (indicating it is an OBRW first), then examine the wavefront amplitude trend. Identify when a positive-polarity wavefront appears after an initial negative wave. The first significant wavefront with the opposite polarity is taken to be the fault-point reflected wave. Record its arrival time.
- 3.3
In cases where the fault is near the midpoint and the two types of waves arrive nearly together, the resultant waveform’s polarity will indicate which wave dominates. Typically, the FPRW will dominate due to the attenuation of the OBRW, so the combined second wavefront will show the FPRW’s polarity.
Calculate Local Time Differences: For each end, compute the time difference between the FPRW and the IFTW, which represent the propagation times from the fault to the end and back to the fault (for M and N, respectively).
Communication of Results: Transmit the locally measured time differences (ΔtMF and ΔtNF) from both ends to a central location (such as a control center or one of the converter stations). This step requires only a basic communication link, not time synchronization—only the numeric values of the time intervals are sent.
Fault Distance Calculation: Using the received ΔtMF and ΔtNF and the known total line length L, calculate the distance to the fault from each end by applying Equation (7). The result will be LMF and LNF.
Because this method relies on time intervals measured at each end rather than absolute timing, it inherently avoids errors from clock synchronization issues. Furthermore, since
v is eliminated in the final formula, any uncertainty in the exact wave propagation speed does not affect the accuracy of the computed fault distance. In essence, the method combines the advantages of both single-ended and double-ended approaches: it uses the minimal information (time differences) like a single-ended approach, but takes measurements from both ends for higher accuracy, similar to a double-ended approach, without requiring
v or synchronized clocks. The above process is illustrated in
Figure 5:
5. Simulation
To validate the proposed improved algorithm, a flexible DC transmission line model was constructed in PSCAD using partial parameters from the Xiamen flexible DC transmission project. The true bipolar DC system operates at a rated voltage of ±320 kV. The transmission line consists of a DC cable, model DC-YJLW03 ± 320 kV 1 × 1800, with a length of 15 km. In PSCAD, the Frequency Dependent Model was selected to model the cable, enabling the most accurate simulation of traveling wave propagation and characteristics.
As shown in
Figure 3, measurement points M (head end) and N (tail end) are set at both ends of the line to measure the positive and negative polarity voltages, respectively. To ensure capture of the reflected wave at the fault point, the time window length is set according to Equation (8):
where
v is the wave velocity. For this cable type, the wave velocity typically ranges from 1.8 to 1.9 × 10
8 m/s, with 1.8 adopted here.
L represents the total line length, which is 15 km.
Therefore, ΔTS = 300 μs. Data spanning 50 μs before and 250 μs after the distance measurement initiation is captured. Sampling is performed at a high rate of 10 MHz to ensure more accurate calibration of the traveling wave front time and reduce ranging errors caused by insufficient sampling rates.
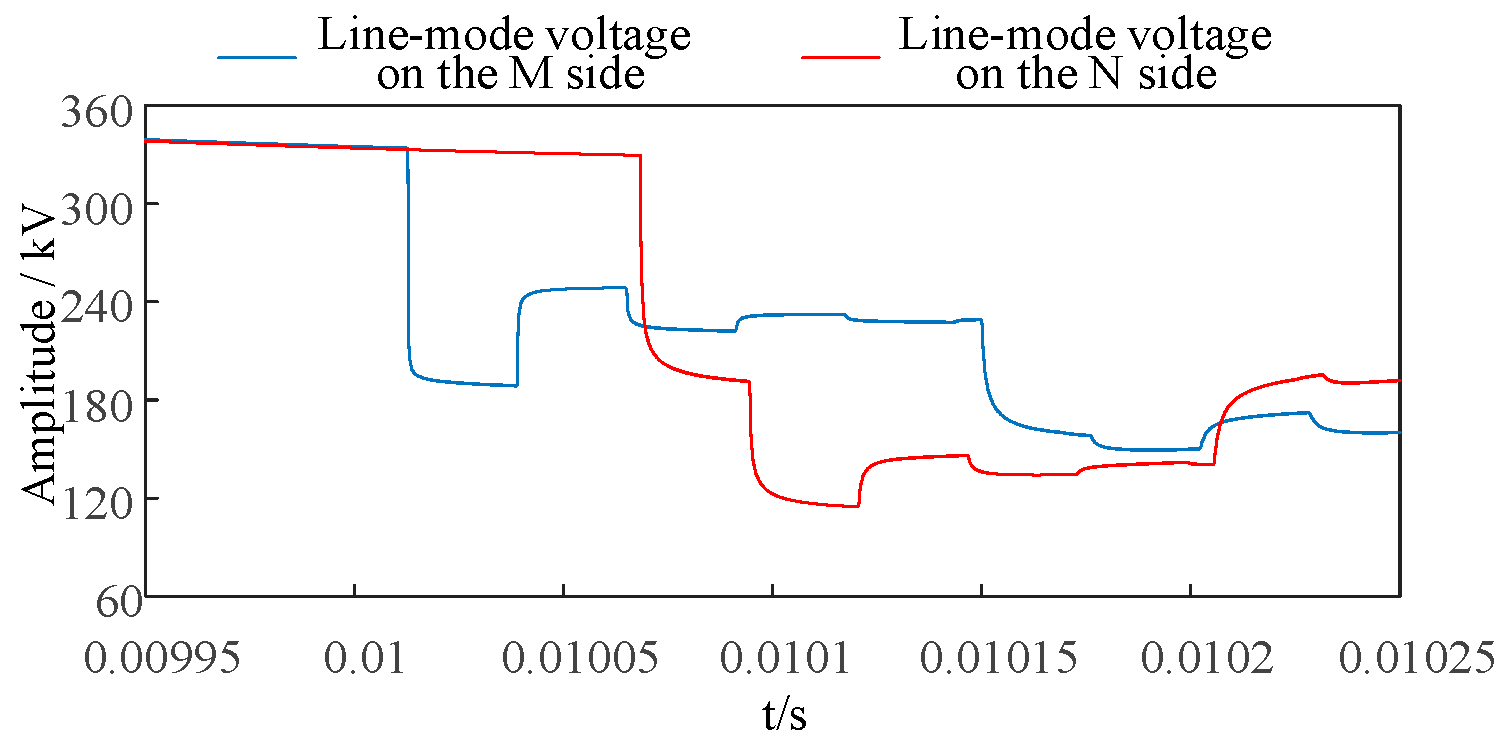
A positive-side ground fault was simulated via a 20 Ω transition resistor. The fault duration was 0.1 s, occurring 2.4 km from the M-side. The M-side voltage was transformed into a line-to-ground voltage using a line-to-ground transformation with respect to the N-side bipolar voltage, yielding the waveform shown below
Figure 6.
Perform a wavelet transform on the line-mode voltages from both sides to obtain the transformed mode maxima, as shown below.
As shown in
Figure 7 and
Figure 8, the time corresponding to the wavelet transform mode maximum represents the arrival time of the traveling wave. The first mode maximum corresponds to the IFTW. The arrival time of the IFTW on the M side is:
tM1 = 0.010013 s. The polarity of the second traveling wave detected on the M side is opposite to that of the IFTW. This wave is the FPRW,
tM2 = 0.01003910 s. According to Equation (4), the difference in traveling wave arrival times on the M side is calculated as Δ
tMF = 26.1 μs.
On the N side, the IFTW arrival time tN1 = 0.010068 s. The polarity of the second traveling wave is the same as that of the IFTW, indicating the OBRW arrives before the FPRW. Therefore, following the location method, compare the magnitude and polarity of all amplitude maxima within the time window. The amplitude exhibits a trend of first decreasing and then increasing. Locate the first amplitude increase with positive polarity, which corresponds to the fault point reflection wave. tN2 = 0.0102058 s. Calculate the time difference between N-side traveling waves using Equation (4): ΔtNF = 137.3 μs.
Substituting ΔtMF and ΔtNF into the formula yields the distance measurement results: LMF = 2395.96 m, LNF = 12,604.04 m, with an absolute error of 4.04 m and a relative error of 0.168%.
Multiple random fault simulations were conducted with transition resistances set between 0.01~20 Ω. The wave velocity v = 1.8 × 10⁸ m/s was applied to the given cable. Results from the traditional two-terminal distance measurement method were compared with those from the improved algorithm proposed herein.
Under conditions where the traveling wave front can be effectively detected, the performance of both the traditional method and the improved method remains unaffected by transition resistors. As shown in
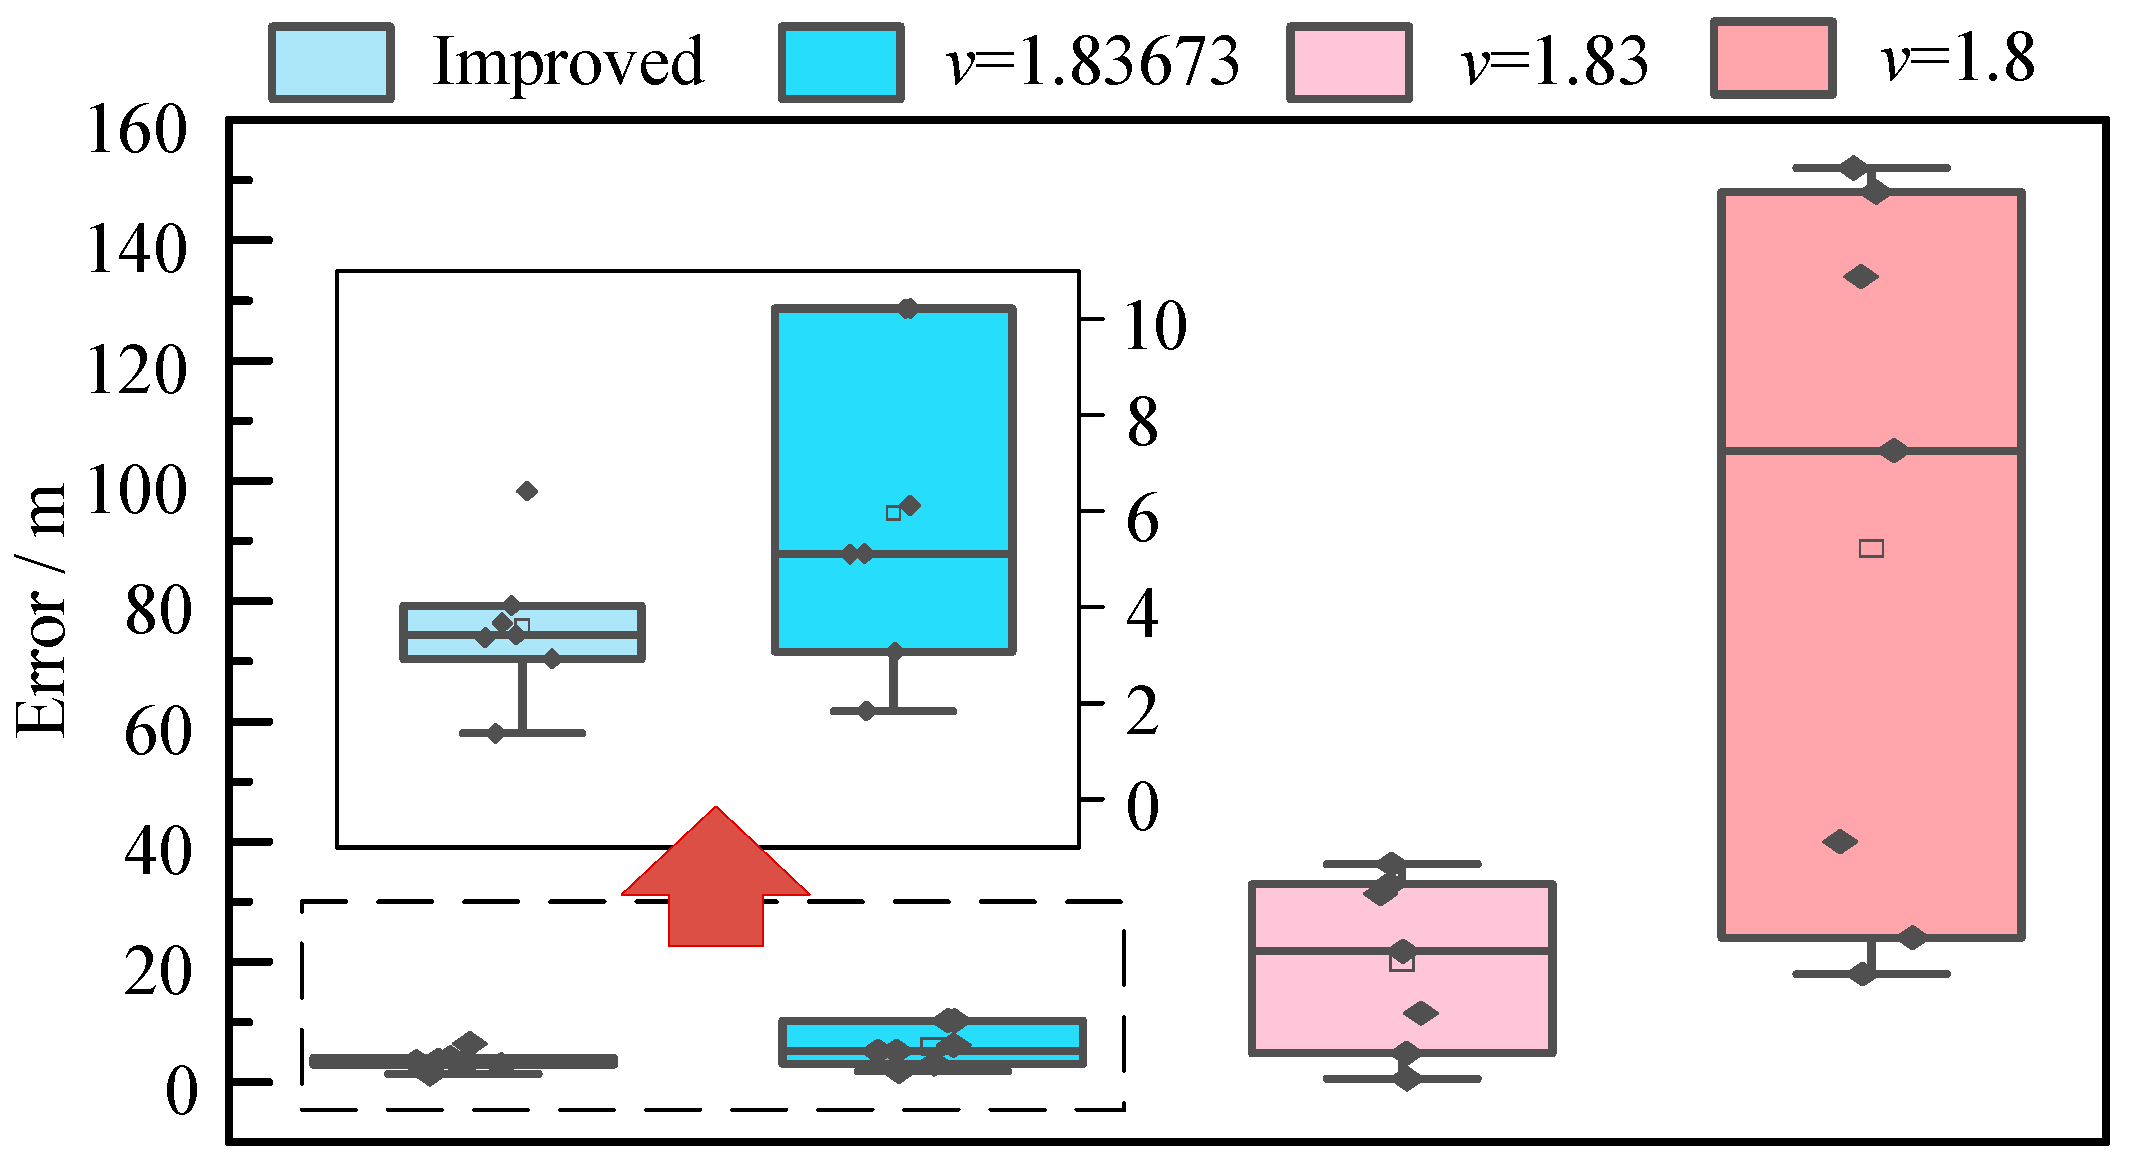
Table 1, the primary cause of significant calculation errors in the traditional method is the discrepancy between the preset wave velocity and the actual wave velocity. A key characteristic of the traditional two-terminal method is that the error decreases as the fault point approaches the midpoint of the line. Furthermore, when comparing calculations using wave velocities of varying precision against the improved method, the resulting errors are as follows.
As shown in
Figure 9, the distance measurement error of the traditional method decreases as the wave velocity becomes more precise. However, when the wave velocity is v = 1.83673 × 10
8 m/s (accurate to four decimal places), its error remains greater than that of the improved method. Simulation results demonstrate that the proposed improved algorithm’s calculations are independent of wave velocity and significantly reduce ranging errors caused by wave velocity inaccuracies.
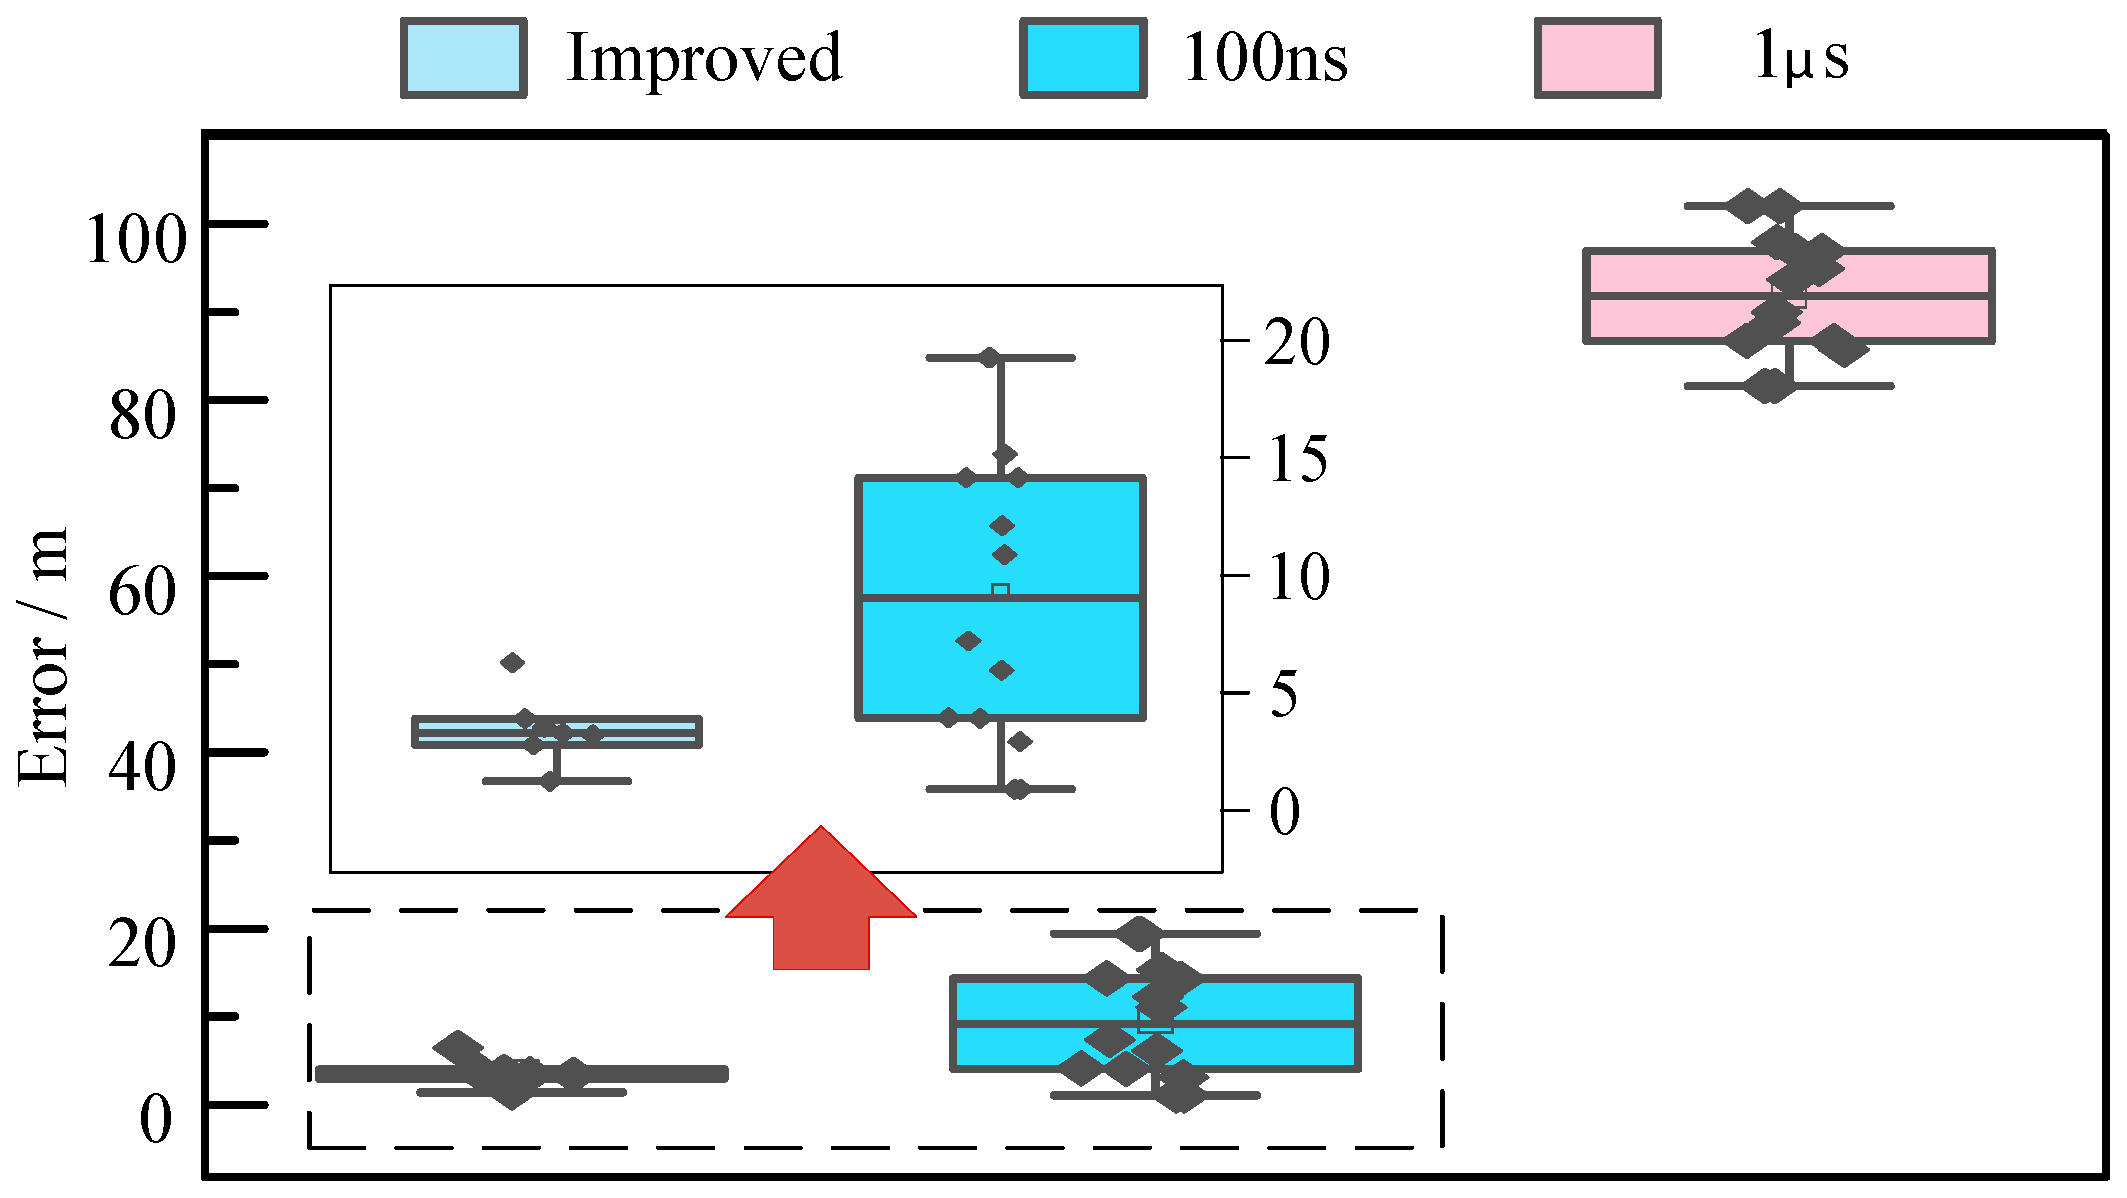
The traditional two-point ranging method relies on precise synchronization between clocks at both ends, whereas the improved algorithm fundamentally does not require clock synchronization. Currently, synchronization devices used in field applications exhibit timing errors ranging from 100 ns to 1 μs. The performance of both algorithms is compared under conditions where timing errors exist.
As shown in
Figure 10, the ranging error of the traditional method decreases with improved timing accuracy. However, even at 100 ns timing accuracy, the traditional method still exhibits greater error than the improved method. Simulation results demonstrate that the proposed improved algorithm’s computation is independent of timing accuracy, delivering superior performance compared to the traditional clock-synchronization-dependent method.
