Article

Enhancing Power-to-Hydrogen Flexibility Through Optimal Bidding in Nordic Energy Activation Market with Wind Integration

by
Sina Ghaemi
,
Sreelatha Aihloor Subramanyam
,
Hessam Golmohamadi
,
Amjad Anvari-Moghaddam
and
Birgitte Bak-Jensen
*,†
Department of Energy (AAU Energy), Aalborg University, 9220 Aalborg, Denmark
*
Author to whom correspondence should be addressed.
These authors contributed equally to this work.
Energies 2025, 18(21), 5734; https://doi.org/10.3390/en18215734 (registering DOI)
Submission received: 18 September 2025 / Revised: 20 October 2025 / Accepted: 27 October 2025 / Published: 31 October 2025

Abstract

The recent updates to the Single Day-Ahead Coupling (SDAC) framework in the European energy market, along with new rules for providing manual frequency restoration reserve (mFRR) products in the Nordic Energy Activation Market (EAM), have introduced a finer Market Time Unit (MTU) resolution. These developments underscore the growing importance of flexible assets, such as power-to-hydrogen (PtH) facilities, in delivering system flexibility. However, to successfully participate in such markets, well-designed and accurate bidding strategies are essential. To fulfill this aim, this paper proposes a Mixed Integer Linear Programming (MILP) model to determine the optimal bidding strategies for a typical PtH facility, accounting for both the technical characteristics of the involved technologies and the specific participation requirements of the mFRR EAM. The study also explores the economic viability of sourcing electricity from nearby wind turbines (WTs) under a Power Purchase Agreement (PPA). The simulation is conducted using a case study of a planned PtH facility at the Port of Hirtshals, Denmark. Results demonstrate that participation in the mFRR EAM, particularly through the provision of downward regulation, can yield significant economic benefits. Moreover, involvement in the mFRR market reduces power intake from the nearby WTs, as capacity must be reserved for downward services. Finally, the findings highlight the necessity of clearly defined business models for such facilities, considering both technical and economic aspects.

1. Introduction

In alignment with Europe’s ambitious initiatives to realize a carbon-free society, the European energy market is undergoing a profound transformation within the Single Day-Ahead Coupling (SDAC) framework. This shift entails transitioning from a traditional 1 h Market Time Unit (MTU) to a finer 15 min resolution, strategically designed to enhance the integration of renewable energy sources, strengthen grid stability, and elevate overall market efficiency [1]. Concurrently, the Manually Activated Reserves Initiative (MARI) has emerged as a pivotal platform for trading manual frequency restoration reserve (mFRR) in real-time, further strengthening the continent’s resilient and sustainable energy ecosystem. In this context, to facilitate efficient pathway toward full EU integration into the MARI, the Nordic mFRR Energy Activation Market (EAM), which features a granular 15 min resolution, has been developed and successfully launched across the Nordic region since 4 March 2025 [2]. These transformative shifts in market-clearing mechanisms for both energy and balancing products, coupled with the adoption of shorter timescales, unlock opportunities for flexible resources, such as power-to-hydrogen (PtH) facilities to optimize revenue streams by delivering essential flexibility services to power systems. However, achieving optimal participation in these evolving markets demands a carefully made bidding strategy.
Among emerging flexibility solutions, PtH facilities have attracted significant attention. Electrolyzers can ramp quickly, operate across a wide load range, and thus not only generate hydrogen but also act as controllable loads, offering ancillary services [3,4]. The dual role of hydrogen technologies as long-term energy storage and as short-term balancing assets positions them as key enablers in future energy systems [5,6]. Recent reviews of demonstration projects confirm growing momentum in integrating PtH at scale across Europe [7].
Several studies have investigated the economic and operational feasibility of electrolyzers in electricity markets. Guinot et al. [8] assessed the profitability of electrolysis plants participating in frequency regulation in France, finding revenues highly dependent on market design. Glenk and Reichelstein [9] examined renewable hydrogen economics under fluctuating prices, concluding that cost competitiveness is within reach in niche markets. More recent contributions focus explicitly on Nordic and Danish contexts: Zheng et al. [10] evaluated the economics of PtH systems providing multiple reserves using Danish market data, showing that ancillary service revenues substantially improve profitability; Saretta et al. [11] proposed an MILP-based scheduling strategy for electrolyzers offering frequency containment reserves; and Lomholt and Klausen [12] analyzed the dynamic frequency response potential of electrolysis under large-scale renewable integration. These works demonstrate that optimized operation in balancing markets is essential for business viability.
Beyond economics, technical studies underline the role of PtH in grid stability. Phan et al. [13] compared PEM and alkaline electrolyzers for frequency support, while Salaciński et al. [14] synthesized global findings and highlighted the importance of compensation mechanisms for economic feasibility. Complementary studies address integration challenges from a regulatory and grid-code perspective, with Riofrio et al. [15] emphasizing the importance of harmonized technical requirements for PtX facilities. Authors in [16] have studied how much offering rewards for PtH facilities can lead to a drop in congestion in distribution networks without considering their role in providing ancillary services. In addition, the authors in [17] have shown how selling excess heat as a by-product during the process of splitting water to make hydrogen can count as an income stream for the PtH unit and can lead to more economic operating hours for such systems without exploring the role of such units in providing ancillary services. The authors of [18] have proposed a comprehensive techno-economic framework for analyzing hydrogen pipeline infrastructure across different operational scales, examining the impact of design pressure, transmission capacity, and transport distance on system economics. Their analysis revealed that the levelized transportation cost varies significantly from 0.13 to 1.81 $/kg depending on system configuration, with lower design pressures being economically favorable for short-distance and small-volume applications, while higher pressures become optimal as both transmission distance and volume increase. Haggi et al. in [19] have suggested a proactive rolling-horizon framework, utilizing hydrogen systems to enhance power grid resilience against cyber–physical–human threats and natural disasters through a bilevel optimization model that coordinates distribution and transmission network operations. The authors of [20] have developed a comprehensive industry chain assessment framework to evaluate the green hydrogen development potential across China, the United States, and the European Union, analyzing technological readiness, economic viability, and implementation roadmaps for these leading energy consumers. Their analysis projected substantial hydrogen adoption by 2050, with China targeting 112 Mt/year (82% green), the U.S. achieving 93 Mt/year, and the EU reaching 71 Mt/year (both nearly 100% green).
Despite these advances, important gaps remain. First, while prior work has evaluated frequency containment and restoration services, the specific benefits of participating in the Nordic mFRR down-regulation market, where absorbed power can be converted into sellable hydrogen, are scarcely quantified [11,21,22]. Second, although power purchase agreements (PPAs) with wind turbines (WTs) are widely adopted in Nordic systems, their interaction with bidding strategies and profitability of PtH remains underexplored [23,24]. Third, sensitivity analyses regarding hydrogen storage capacity and dynamic pricing conditions are rarely addressed in depth [25,26,27].
This paper addresses the identified gaps by developing an optimal scheduling model for a typical PtH facility, planned to be installed at the Port of Hirtshals, Denmark, to participate in the Nordic mFRR EAM, while considering both the technical limitations of the technologies within the facility and the market requirements. The proposed scheduling framework operates on a 15 min time interval to align with recent updates to the SDAC and Nordic mFRR EAM frameworks. To manage the nonlinear relationship between the electrolyzer’s hydrogen production and its power consumption, a linear regression approach has been applied for linearization. In addition, the operating temperature of the electrolyzer, an important factor influencing hydrogen production efficiency, has been incorporated into the model’s operational constraints. Furthermore, sensitivity analyses are also performed to assess how variations in technical and economic parameters affect the unit’s overall profitability. Finally, the main contributions of this paper are summarized as follows:
(i)
Development of a Mixed Integer Linear Programming (MILP) model that integrates the technical constraints of a PtH facility while enabling its optimal participation in the Nordic mFRR market.
(ii)
Evaluation of the economic performance of a 6 MW PtH facility located at the Port of Hirtshals, Denmark, under two power supply scenarios: electricity sourced from the grid and electricity procured through a PPA with nearby WTs.
(iii)
Execution of sensitivity analyses on key parameters influencing profitability, including PPA pricing, hydrogen price, and hydrogen storage tank capacity.
The structure of this paper is as follows: Section 2 outlines the research methodology and consists of two subsections. First, a brief description of the Nordic mFRR EAM is provided. Then, the mathematical model used in this study is presented. Section 3 discusses the case study and simulation results. Finally, Section 4 offers concluding remarks and plans for future research.

2. Methodology of Research

This section consists of two parts, including a brief description of the Nordic mFRR EAM, along with the mathematical setup for the optimal scheduling of a PtH unit used for participating in that market.

2.1. Nordic mFRR Energy Activation Market (EAM)

To boost operational efficiency, support energy transitions towards clean energy utilization, and pave the way for linking up with the European platform for offering balancing products (MARI), four Nordic transmission system operators (TSOs) (Energinet, Fingrid Oyj, Statnett, and Svenska kraftnät) created the Nordic mFRR EAM. They put it into action through the Nordic balancing model, with the automated market going live on 4 March 2025. This market offers two products: up-regulation and down-regulation. Participants can trade them in near-real time. The bid submission deadline is 45 min before the delivery time, and bidders can send their offers for each product separately for each 15 min period. After collecting all the bids from participants, the market clears them based on a pay-as-clear pricing system. It picks the best bids and notifies their owners just 7.5 min before the delivery period. For the Danish grid operator, the full activation time is 12.5 min, which includes 2.5 min for preparation and 10 min for ramping up. The minimum full running time is 5 min if the bidder is not asked for providing the product for the next 15 min slot, as shown in Figure 1.
It is noteworthy to mention that Nordic mFRR EAM matches the European MARI platform, and the only difference is the bid submission deadline, which is 25 min before the delivery time for MARI compared to 45 min for the Nordic mFRR EAM.

2.2. Mathematical Model

A typical PtH facility consists of main technologies such as electrolyzers, compressors, and hydrogen tanks, with the electrolyzer serving as the key component responsible for water electrolysis to split water molecules into hydrogen and oxygen through an electrochemical process. Currently, three primary electrolyzer technologies dominate the market for green hydrogen production: Alkaline Electrolyzer (AEL), Proton Exchange Membrane Electrolyzer (PEM), and Solid Oxide Electrolyzer Cell (SOEC), each exhibiting distinct operational characteristics, efficiencies, and economic profiles that significantly influence their suitability for different applications.
According to [28], AELs represent the most mature and commercially established technology, operating with a liquid alkaline electrolyte (typically 25–30% KOH solution) at temperatures between 60 and 90 °C and achieving efficiencies of 62–82%. AEL systems offer several compelling advantages, including the lowest capital costs among all electrolyzer types (typically 270–500 USD/kW), exceptional operational lifetimes exceeding 50,000–80,000 h, and the use of non-precious metal catalysts, such as nickel-based materials, which significantly reduces material costs and supply chain risks. However, these systems face limitations, including lower current densities (0.2–0.4 A/cm2) resulting in larger footprints, and minimum load constraints typically requiring 10–20% of rated capacity for stable operation. In contrast, PEM electrolyzers utilize a solid polymer membrane as the electrolyte, operating at 50–80 °C with efficiencies ranging from 67–82%, and demonstrate superior operational flexibility through high current densities (1–2 A/cm2) enabling more compact designs, excellent dynamic response capabilities with sub-second reaction times, and the ability to produce high-purity hydrogen exceeding 99.99%. Nevertheless, PEM systems present significant economic challenges with capital costs ranging from 400–1800 USD/kW, alongside shorter operational lifetimes of approximately 60,000 h and more stringent water purity requirements necessitating ultrapure water feed systems [28,29]. In addition, Solid Oxide Electrolyzer Cells operate at substantially higher temperatures (700–850 °C) using a ceramic electrolyte such as yttria-stabilized zirconia, offering the highest theoretical electrical efficiencies among all electrolyzer types (potentially exceeding 100% when accounting for waste heat utilization), the capability for co-electrolysis of CO2 and H2O simultaneously, and independence from precious metal catalysts. Despite these thermodynamic advantages, SOEC technology remains the least mature option, with limited commercial availability and facing significant challenges, including material degradation issues at high operating temperatures, leading to lifetimes below 20,000 h, complex thermal management requirements, extended startup times measured in hours, and the highest capital costs [28].
The selection of AEL technology for this study is justified by multiple converging factors that make it the most suitable choice for large-scale hydrogen production modeling. First, AEL represents the most mature technology and accounts for the largest share of installed electrolyzer capacity globally, providing extensive operational data essential for accurate modeling and validation [7]. In addition, the significantly lower capital costs combined with the absence of precious metal requirements position AEL as the most economically viable option for utility-scale hydrogen production facilities, particularly important for developing deployment scenarios in cost-sensitive markets. Finally, the interest from PtH facility owners at the Port of Hirtshals (Case Study) in implementing AEL technology aligns with local stakeholder preferences and enhances the practical relevance of this technological choice for the study. The most important characteristic of the AEL relates to its I-V curve, which describes the voltage change of the cell in response to current density. The open-circuit voltage of the cell, also called reversible voltage, can be calculated as follows:
V r e v = Δ G 2 F
where Δ G stands for Gibbs free energy during the reaction, and F refers to the Faraday constant. When AEL operates under standard temperature and pressure, the reversible voltage value becomes 1.23 V. However, this value decreases as the temperature increases. The empirical calculation of this pattern is as follows [30]:
V r e v = 1.5184 1.5421 × 10 3 T + 9.523 × 10 5 T l n ( T ) + 9.84 × 10 8 T 2
where T refers to the operating temperature in Celsius. The voltage drop depends on the operating temperature of the cell and the current density passing through the cell. The relationship between these variables makes it difficult to calculate exact values. However, Ulberg in [31] proposed an empirical equation for AEL that expresses the voltage drop of each electrolyzer cell as a function of its operating temperature and current density as follows:
V = V r e v + ( c 1 + τ 2 T ) A I + s × l n ( ( α 1 + α 2 T + α 3 T 2 ) A I + 1 )
where A stands for the cell area in square meters, I refers to the current in amperes, τ 1 and τ 2 are electric ohmic resistance parameters, and α 1 , α 2 , and α 3 are overvoltage parameters of the electrode.
Finally, the relationship between the current passing through the cell and the amount of hydrogen production can be calculated using Faraday’s law using Equation (4):
m H 2 = η F × M H 2 × N c e l l × I 2 F
where m H 2 shows the amount of hydrogen produced in moles per second, η F represents the Faraday efficiency, N c e l l is the number of cells in the electrolyzer, and M H 2 refers to the molar mass of hydrogen. Finally, the total power use of each electrolyzer cell can be found by multiplying the voltage drop by the current passing through each cell:
P E L Z = V × I
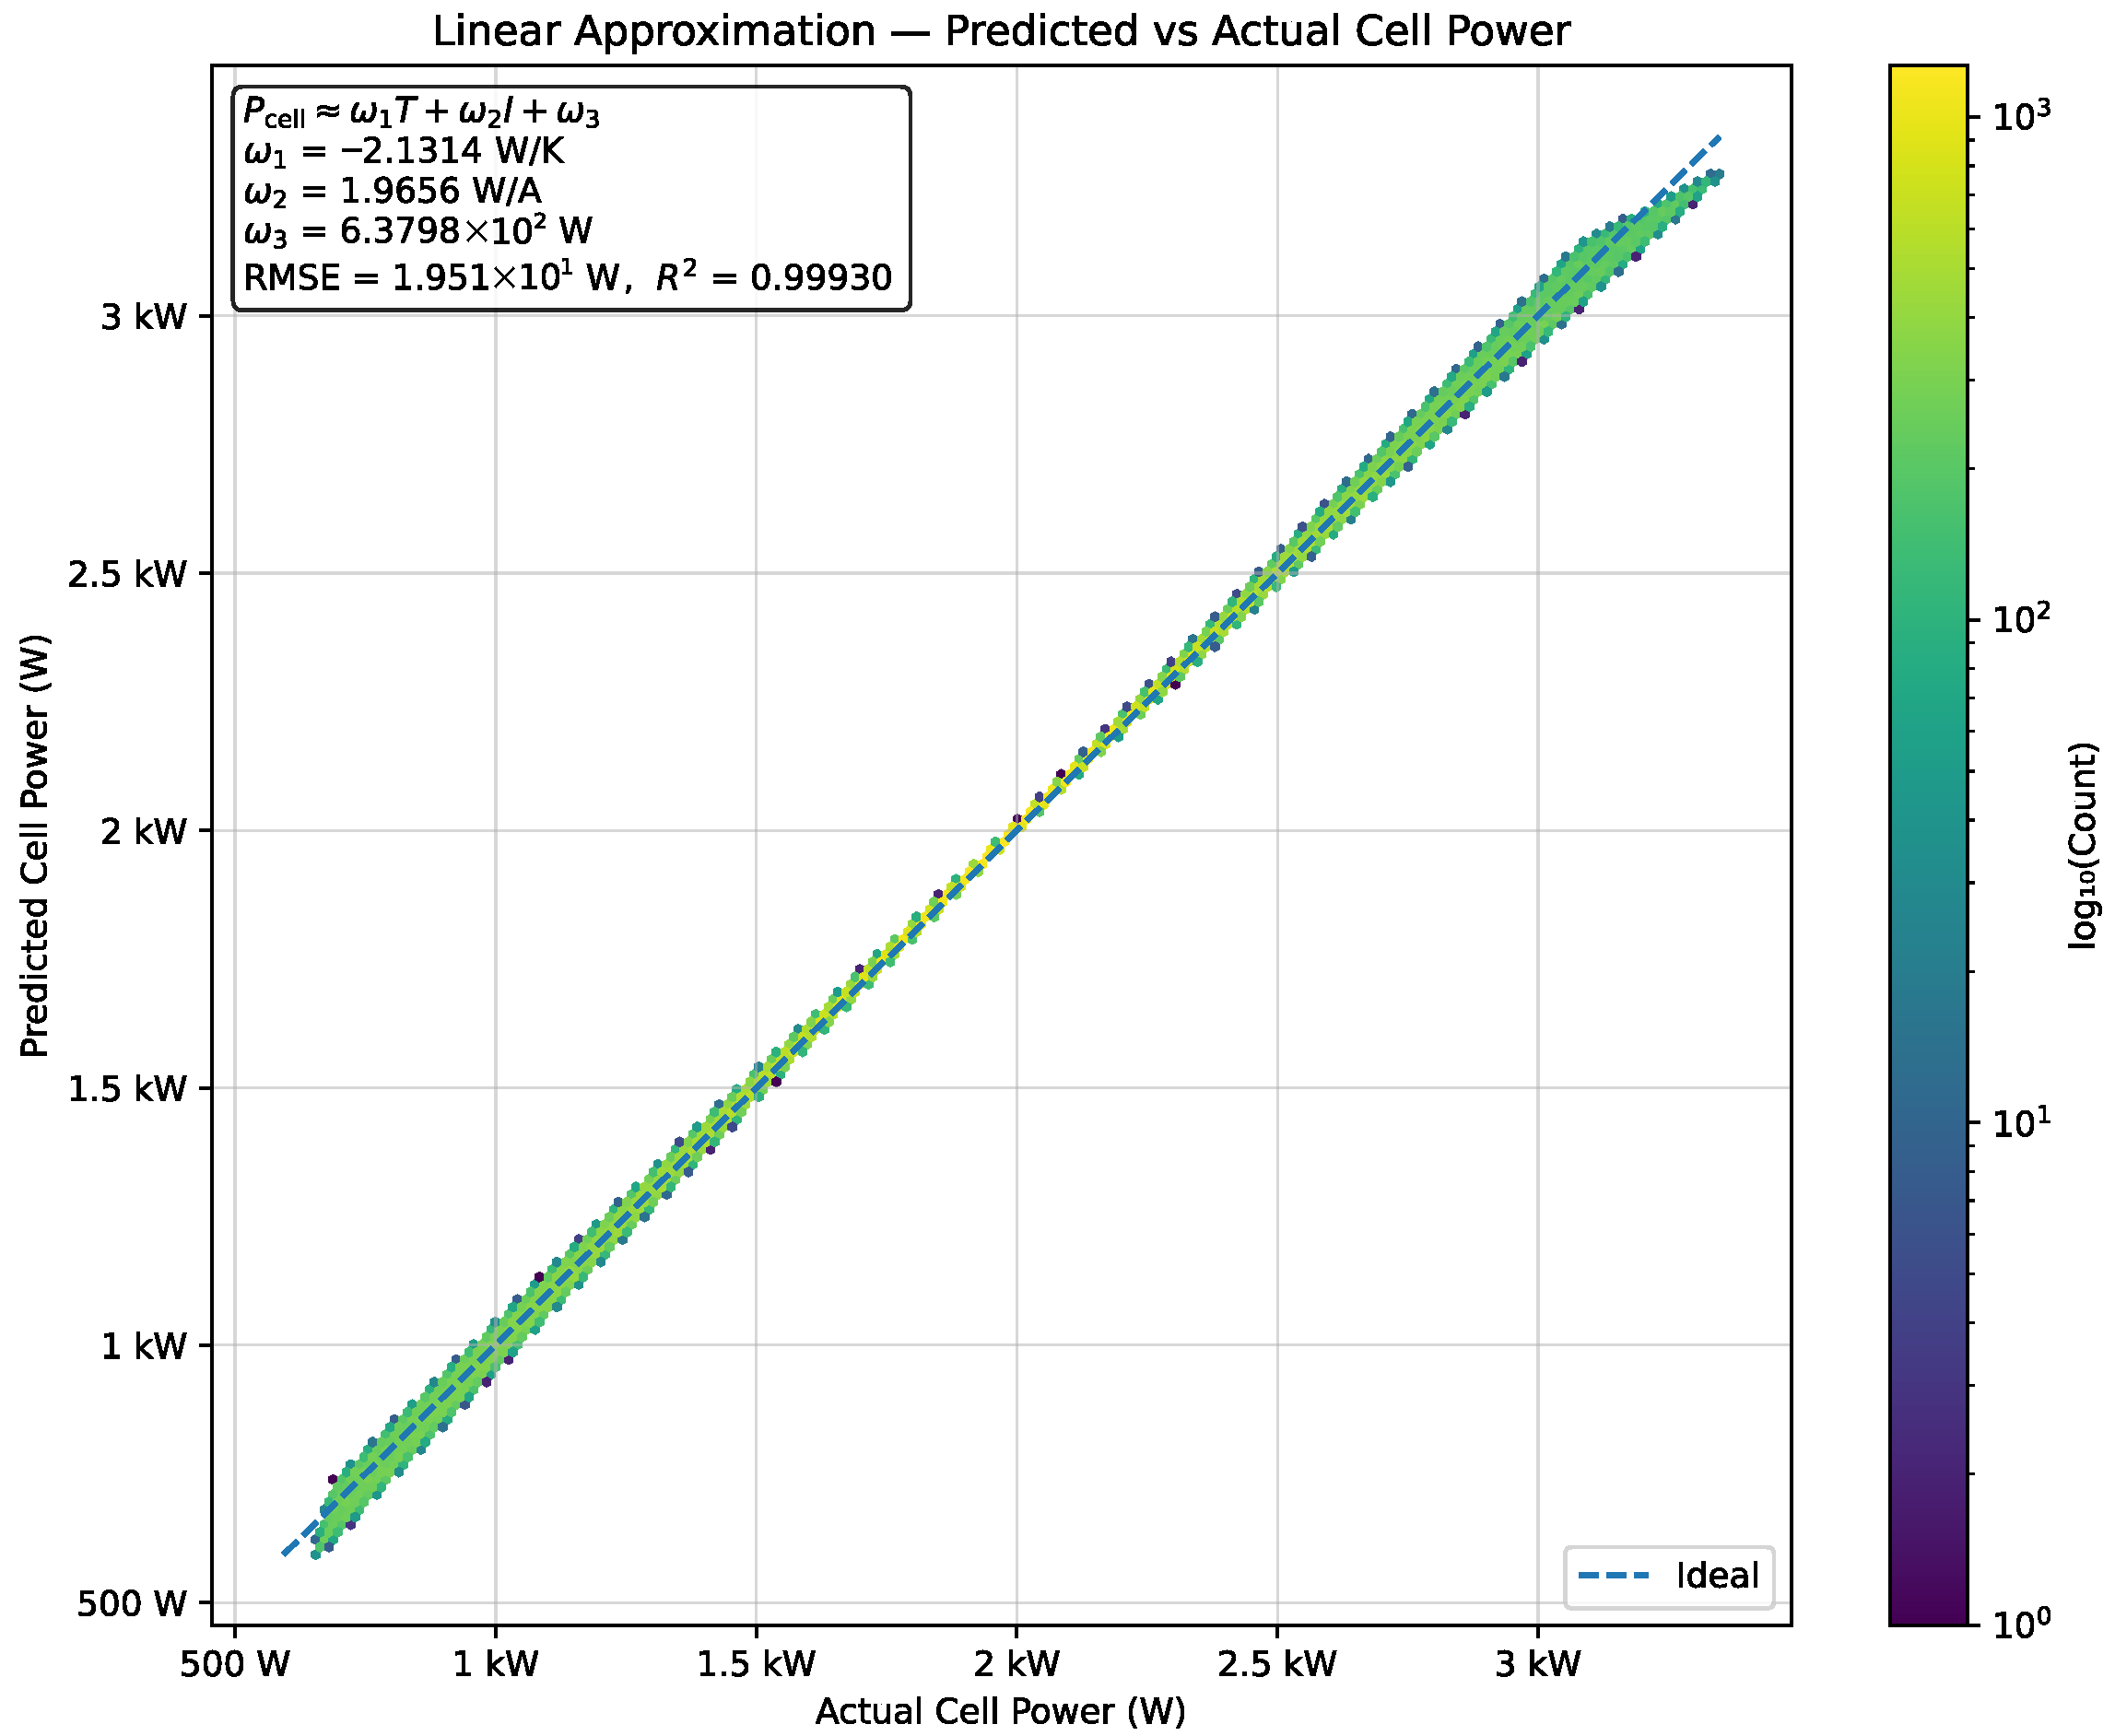
However, Equation (5) is not linear due to Equation (3) and its multiplication with the current. As a result, the power use of the electrolyzer becomes a non-linear function of the operating temperature and the current passing through each cell. For the development of the mixed-integer linear programming model for scheduling optimization, a linear function relating the power consumption to the operating temperature and current of the electrolyzer is considered. To achieve this linearization, a comprehensive dataset by evaluating the physics-based model described in Equations (1)–(5) across the full operational envelope of the electrolyzer is created. To achieve this, the cell power consumption is calculated across a comprehensive grid of 1000 temperature points, spanning 25 °C to 90 °C and 1000 current density points covering 1000 to 4500 A/m2, generating data points that encompass the complete operational characteristics of the AEL system. Then, each data point is calculated using the empirical voltage equation (Equation (3)) multiplied by the corresponding current value, ensuring that the regression model accurately represents the underlying electrochemical behavior across all feasible operating conditions. Finally, the linear regression (See Figure 2) is applied to this generated dataset to approximate the power consumption as follows:
P E L Z = ω 1 T + ω 2 I + ω 3
The regression analysis yielded coefficients ω 1 , ω 2 , and ω 3 to −2.1314 W/K, 1.9656 W/A, and ω  3 = 637.98 W, respectively, with an exceptional fit quality demonstrated by R2 = 0.9993 and RMSE = 19.51 W, as illustrated in Figure 2. This high accuracy validates that the linear approximation adequately captures the electrolyzer’s power consumption behavior for optimization purposes while maintaining computational tractability.
In order to keep the optimization as MILP and tractable at 15 min resolution, the following assumptions have been made:
Electrolyzer performance is represented by a linearized power–current–temperature relation and is enforced only in the online state; however, start/stop and thermal dynamics are addressed.
The hydrogen storage tank is modeled as a zero-dimensional mass balance with negligible charge/discharge losses, consistent with compressed-gas storage efficiencies around 99% reported in [7].
Temperature is assumed to be regulated by the balance-of-plant thermal system.
Compressor power follows an equivalent adiabatic (theoretically) formulation with a constant efficiency parameter [32].
Market participation is modeled with perfect foresight of mFRR activation prices and power generation of WT.
According to the aforementioned assumptions and the linear relation between the power consumption, operating temperature, and the current in Equation (6), the operational constraints of electrolyzer can be formulated as follows:
P h e l z + r d o w n , h m f r r N c e l l C e l z m a x X h o n + C e l z s b X h s b , h
P h e l z r u p , h m f r r N c e l l C e l z s b X h S B , h
N c e l l P h e l z + P h c o m p . P a c t u a l , h W T , h
r u p , h m f r r r ¯ u p , h m f r r X h o n , h
r d o w n , h m f r r r ¯ d o w n , h m f r r X h o n , h
I h m i n I h e l z I h m a x , h
m H 2 = η F × M H 2 × N c e l l × I 2 F , h
N c e l l P a c t u a l , h e l z = N c e l l P h e l z + r d o w n , h m f r r r U P , h m f r r , h
P a c t u a l , h e l z = ω 1 T h + ω 2 I h e l z + ω 3 + χ 1 , h + χ 2 , h , h
M X h S B χ 1 , h M X h S B , h
M X h o f f χ 2 , h M X h o f f , h
Q h H 2 O = η H 2 O P a c t u a l , h e l z , h
X h o n + X h s b + X h o f f = 1 , h
X h s b + X h 1 o f f 1 , h 1
X h 1 s b + X h o n 1 χ h 1 h o t X h 1 s b , h 1
χ h 1 h o t X h o n , h 1
X h 1 o f f + X h o n 1 χ h 1 c o l d X h 1 o f f , h 1
χ h 1 c o l d X h o n , h 1
H C × ( T h T h 1 ) Δ h = N c e l l P a c t u a l , h 1 e l z N c e l l V t n I h 1 e l z 1 R h ( T h 1 T a ) Q ˙ c o o l , h 1 , h 1
T h = T i n i t i a l , h = 0
T h T n , h 1
0 Q ˙ c o o l , h 1 M X h o n , h
Equation (7) shows that the sum of power use and the amount of power for providing down-regulation by each electrolyzer cell cannot exceed the maximum capacity. In this equation, P h e l z refers to the amount of power used by each cell, r d o w n , h m f r r is the total down-regulation power produced, C e l z m a x shows the maximum capacity of each cell, C e l z s b is the fixed power use of the cell when in standby mode, and X h o n and X h s b are binary variables that show the operating and standby modes of the electrolyzer. Equation (8) shows the allowed minimum power use in each cell. In Equation (8), r u p , h m f r r refers to the amount of up-regulation provided by this unit. Equation (9) means that when receiving power from nearby WTs, the amount of power used by the electrolyzer and the compressor must be less than the actual power generated by those WTs at each quarter-hour. P h c o m p . refers to the power used by the compressor, and P a c t u a l , h W T stands for the actual power generation of WTs near the hydrogen facility. Equations (10) and (11) demonstrate that the amount of power provided for up- and down-regulation must be less than or equal to the requested values. The permissible amount of current passing through each electrolyzer cell is restricted using Equation (12). The amount of hydrogen produced has been calculated using Equation (13). The actual power use at each electrolyzer cell is modeled using Equation (14). In addition, the connection between the actual power use of each cell and its operating temperature and the current passing through it is shown using Equation (15). The relationship between power use, operating temperature, and current is valid only for the operating mode. Therefore, this constraint must be skipped when the electrolyzer is in offline or in standby mode. This can be conducted through two auxiliary variables, χ 1 , h and χ 2 , h , in that equation. Their values are zero when the electrolyzer is in operating mode (See Equations (16) and (17)) and have large or small values when the electrolyzer is in standby or offline modes, which do not affect the optimization process. Equation (18) shows the amount of water consumption by the electrolyzer. Equations (19) and (20) mean that the electrolyzer can be in only one mode among its three possible modes (online, offline, and standby) at each quarter-hour. The constraints (21)–(24) have been added to identify the hot and cold start-up times of the unit, and variables χ h o l d and χ h c o l d represent them, respectively. Finally, Equations (25)–(28) describe the dynamic temperature characteristics of the electrolyzer cell, where H C stands for heat capacity, V t n refers to the thermal neutral voltage, T a shows the ambient temperature, and Q ˙ c o o l , h refers to the cooling demand that supports safe operation during the production mode of the electrolyzer.
The power consumption of the compressor for compressing the produced hydrogen and injecting it into the hydrogen tank is calculated using Equation (29):
P h c o m p . = R T i n , h 2 ( γ 1 ) η c ( ( P r o u t P r i n ) ( γ 1 γ ) ) m H 2 , h
where P r i n and P r o u t refer to the inlet and outlet pressure, R stands for gas common constant, T i n , h shows the inlet temperature of the hydrogen, and γ stands for the isotropic exponent, which is 1.4. Finally, the constraints of the hydrogen tank are formulated as follows:
Γ h H 2 Γ h 1 H 2 = m H 2 Δ h , h 1
Γ ̲ H 2 Γ h H 2 Γ ¯ H 2 , h
Γ 0 H 2 = Γ i n i t i a l H 2
where Γ h H 2 shows the hydrogen tank level, Γ ̲ H 2 and Γ ¯ H 2 demonstrate the minimum and maximum permissible level for the hydrogen tank. Equation (30) shows the hydrogen level at each quarter-hour according to the previous hydrogen tank level and the amount of hydrogen produced at that specific quarter. The next constraint (31) shows the permissible bound for the hydrogen tank level, and the last equation shows the initial level of the storage tank. Finally, the objective function for this PtH facility can be defined as follows:
min : O F P t H = h N h [ ( N c e l l P h e l z + P h c o m p . ) π P P A + π w a t e r Q h H 2 O + π h o t X h h o t + π c o l d X h c o l d π h H 2 m H 2 r u p , h m f r r π u p , h m f r r r d o w n , h m f r r π d o w n , h m f r r ] Δ h
The objective function includes seven terms. The first term refers to the cost of buying power based on the PPA. The second term indicates the cost of water use by this unit. The third and fourth terms represent the costs associated with hot and cold start-ups of the electrolyzer, respectively. The fifth term shows the revenue from selling hydrogen, and the last two terms consider the profit that this unit can obtain through participating in the Nordic mFRR EAM.
As seen, the objective function and the technical operating constraints for different technologies, ranging from Equations (7) to (32), are linear. Because of this, the model counts as an MILP problem and can be solved using ready-to-use problem-solving tools like Gurobi. However, as highlighted in the assumptions, the proposed optimization model assumes perfect foresight of both mFRR activation prices and WT’S power output over the scheduling horizon. This deterministic approach, while providing valuable insights into the optimal operation strategies and economic potential of PtH facilities in the mFRR market, represents an idealized scenario. In practical applications, both mFRR prices and wind generation are subject to forecast uncertainties that may impact the realized profits and operational decisions.

3. Case Study and Simulation

This section discusses the effectiveness of the developed scheduling model for a typical PtH facility to take part in the day-ahead market and Nordic mFRR EAM with 15 min MTU. Since the EU single day-ahead coupling (SDAC) is supposed to go live with 15 min MTU from 30 September 2025, in this simulation, we use the hourly spot electricity prices, and we assume that this value for each quarter within each hour is the same. The case study for performing the simulation is about the 6-MW PtH facility that is planned for installation at the port of Hirtshals in Denmark. This unit is supplied by two nearby WTs with a total capacity of 8 MW under the PPA agreement. The schematic of the case study is shown in Figure 3. As mentioned, this facility seeks to optimally take part in the new day-ahead and Nordic mFRR markets.
The technical characteristics of the PtH unit can be found in Table 1.
In addition, as discussed in the formulation section, an alkaline electrolyzer is used for the water electrolysis in the PtH facility. Its technical features are detailed in Table 2.
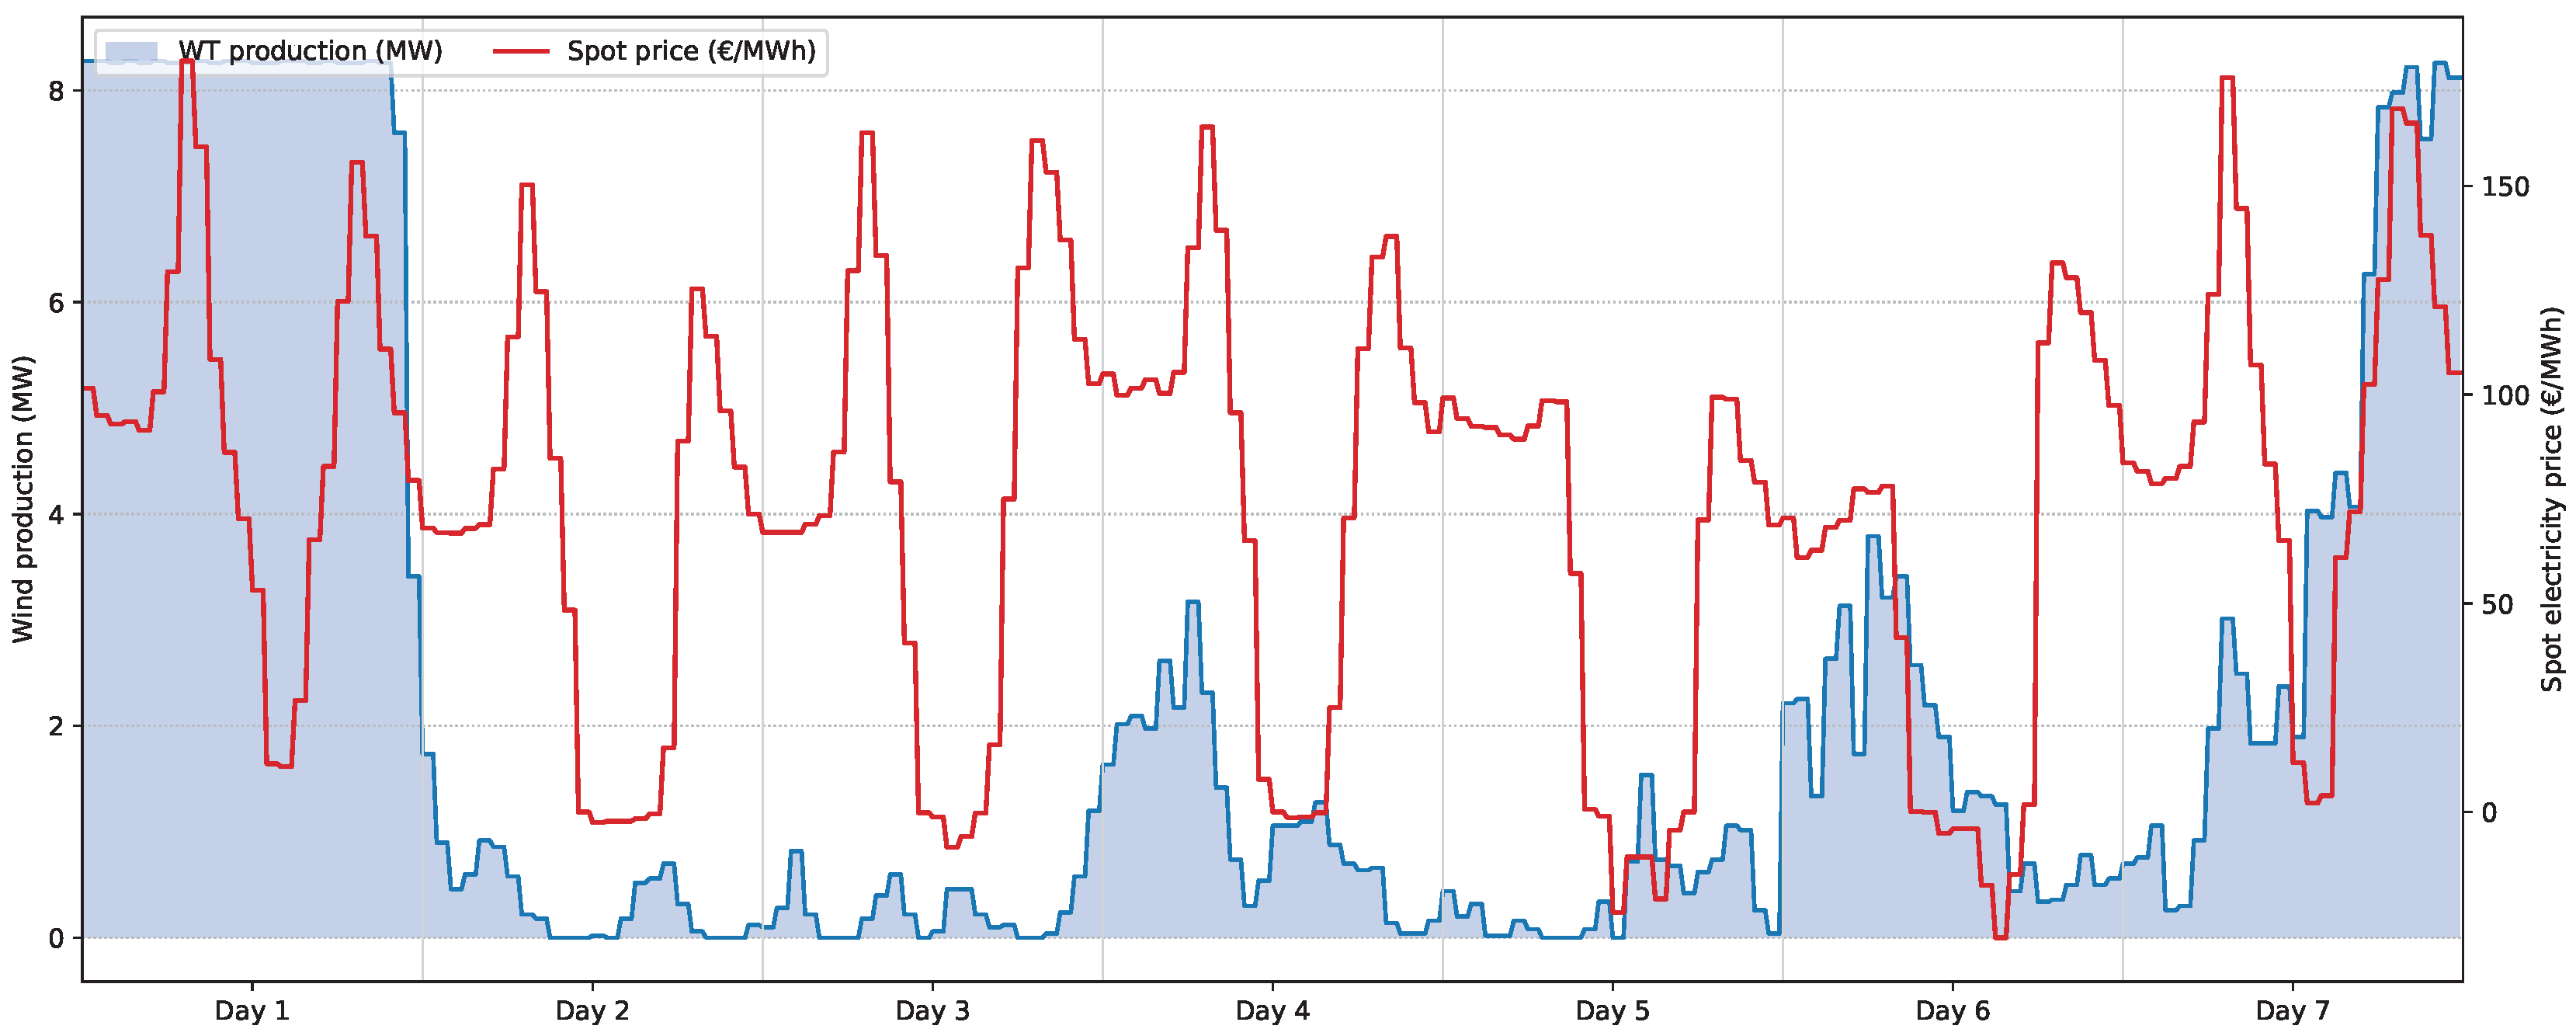
This simulation was run based on the data available for the first week of April 2025. The actual power production of the two WTs and the spot electricity prices for this period can be found in Figure 4.
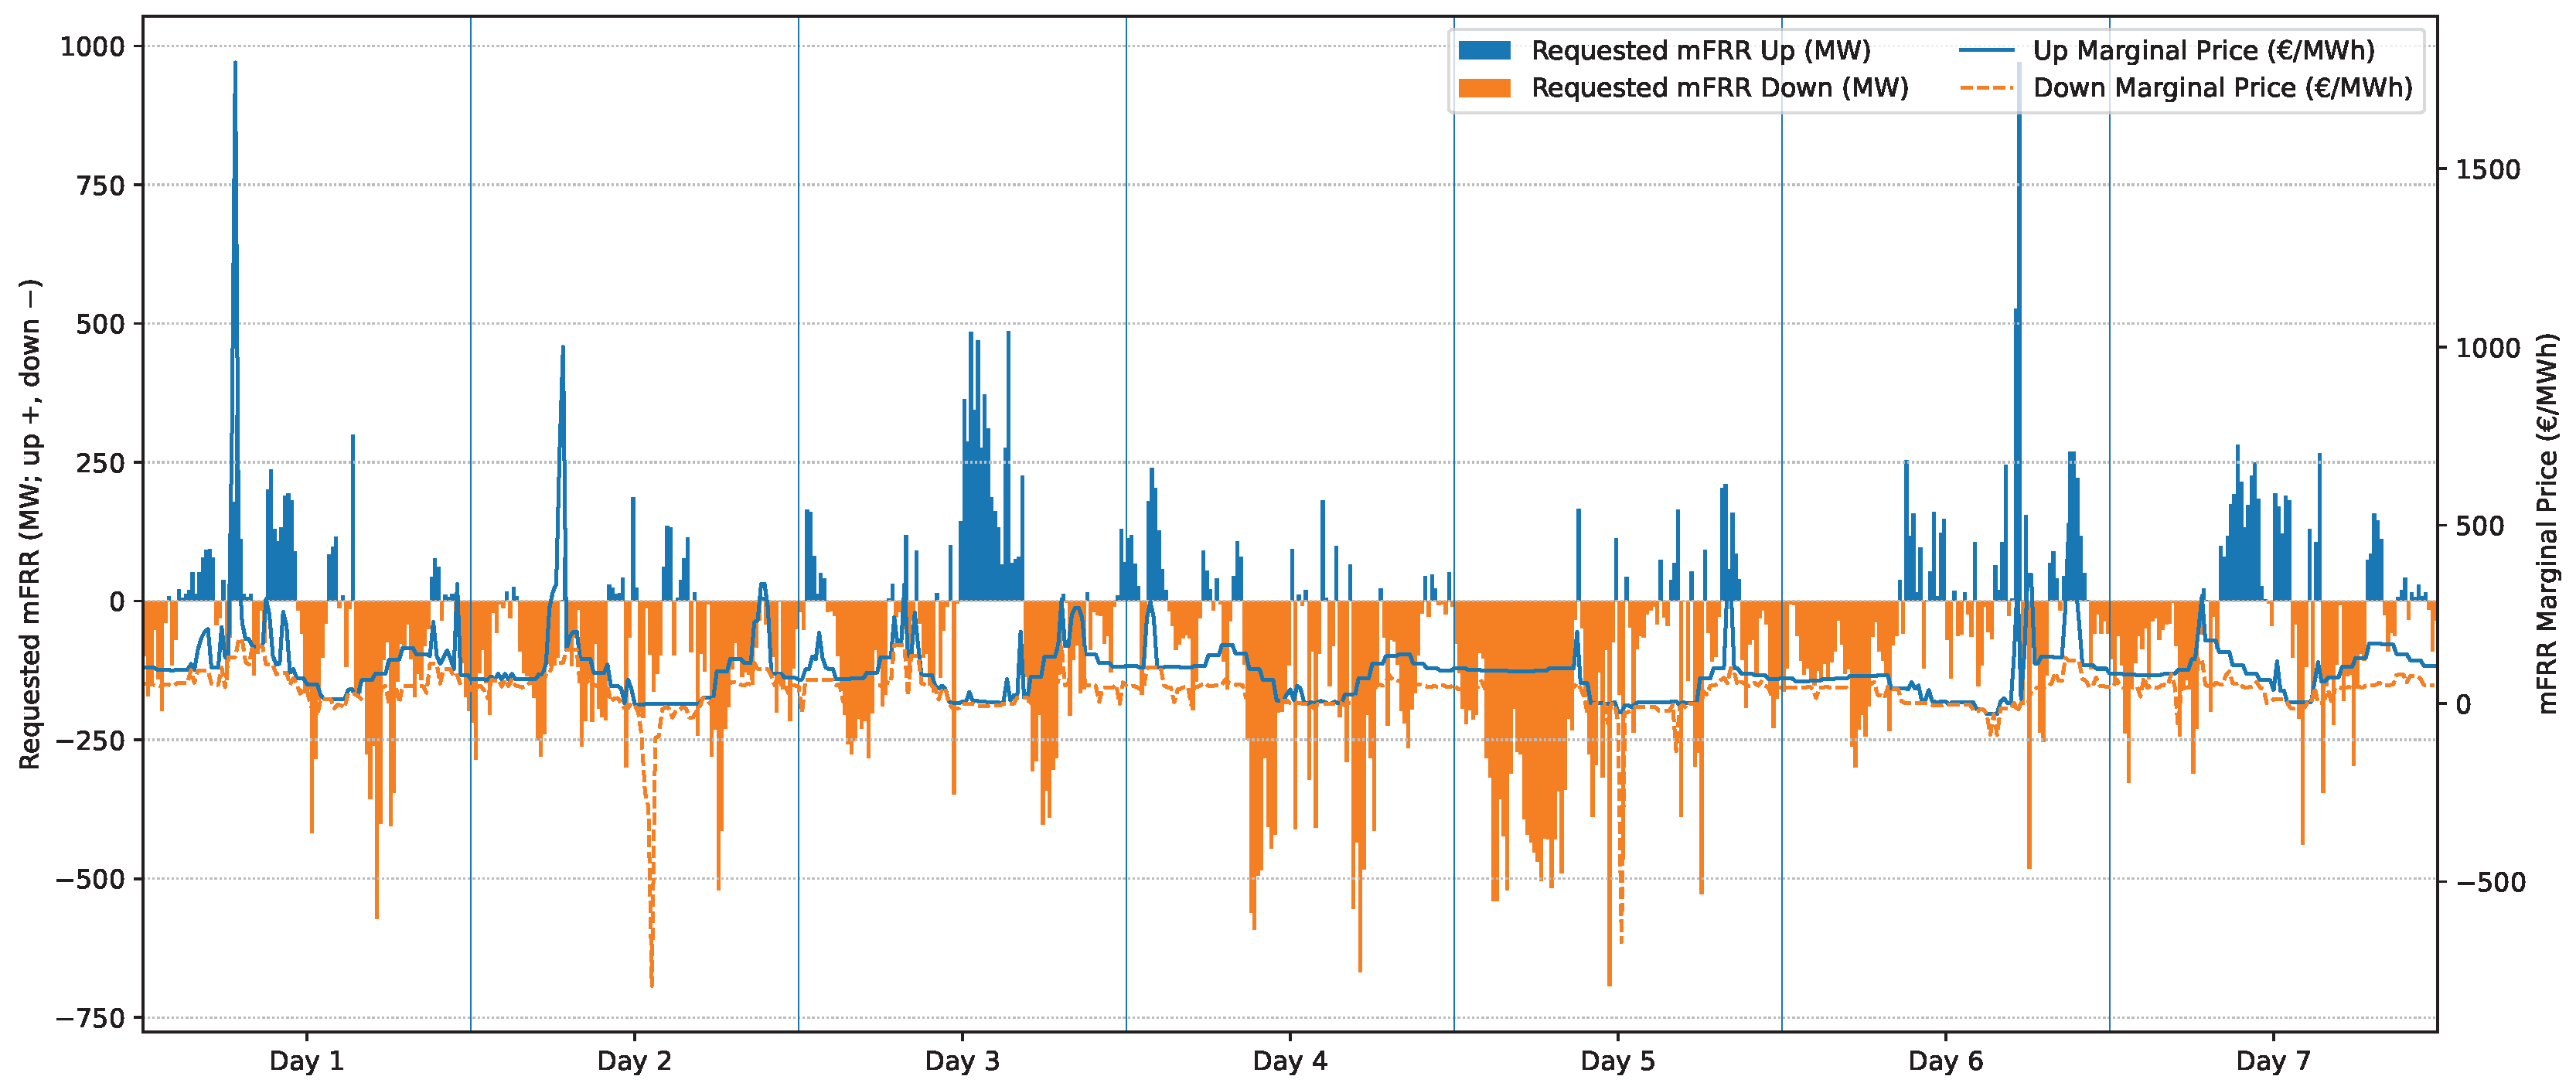
Figure 5 shows the activation prices for upward and downward mFRR products for each single quarter, along with the requested demand for each of them in the Nordic mFRR market [33].
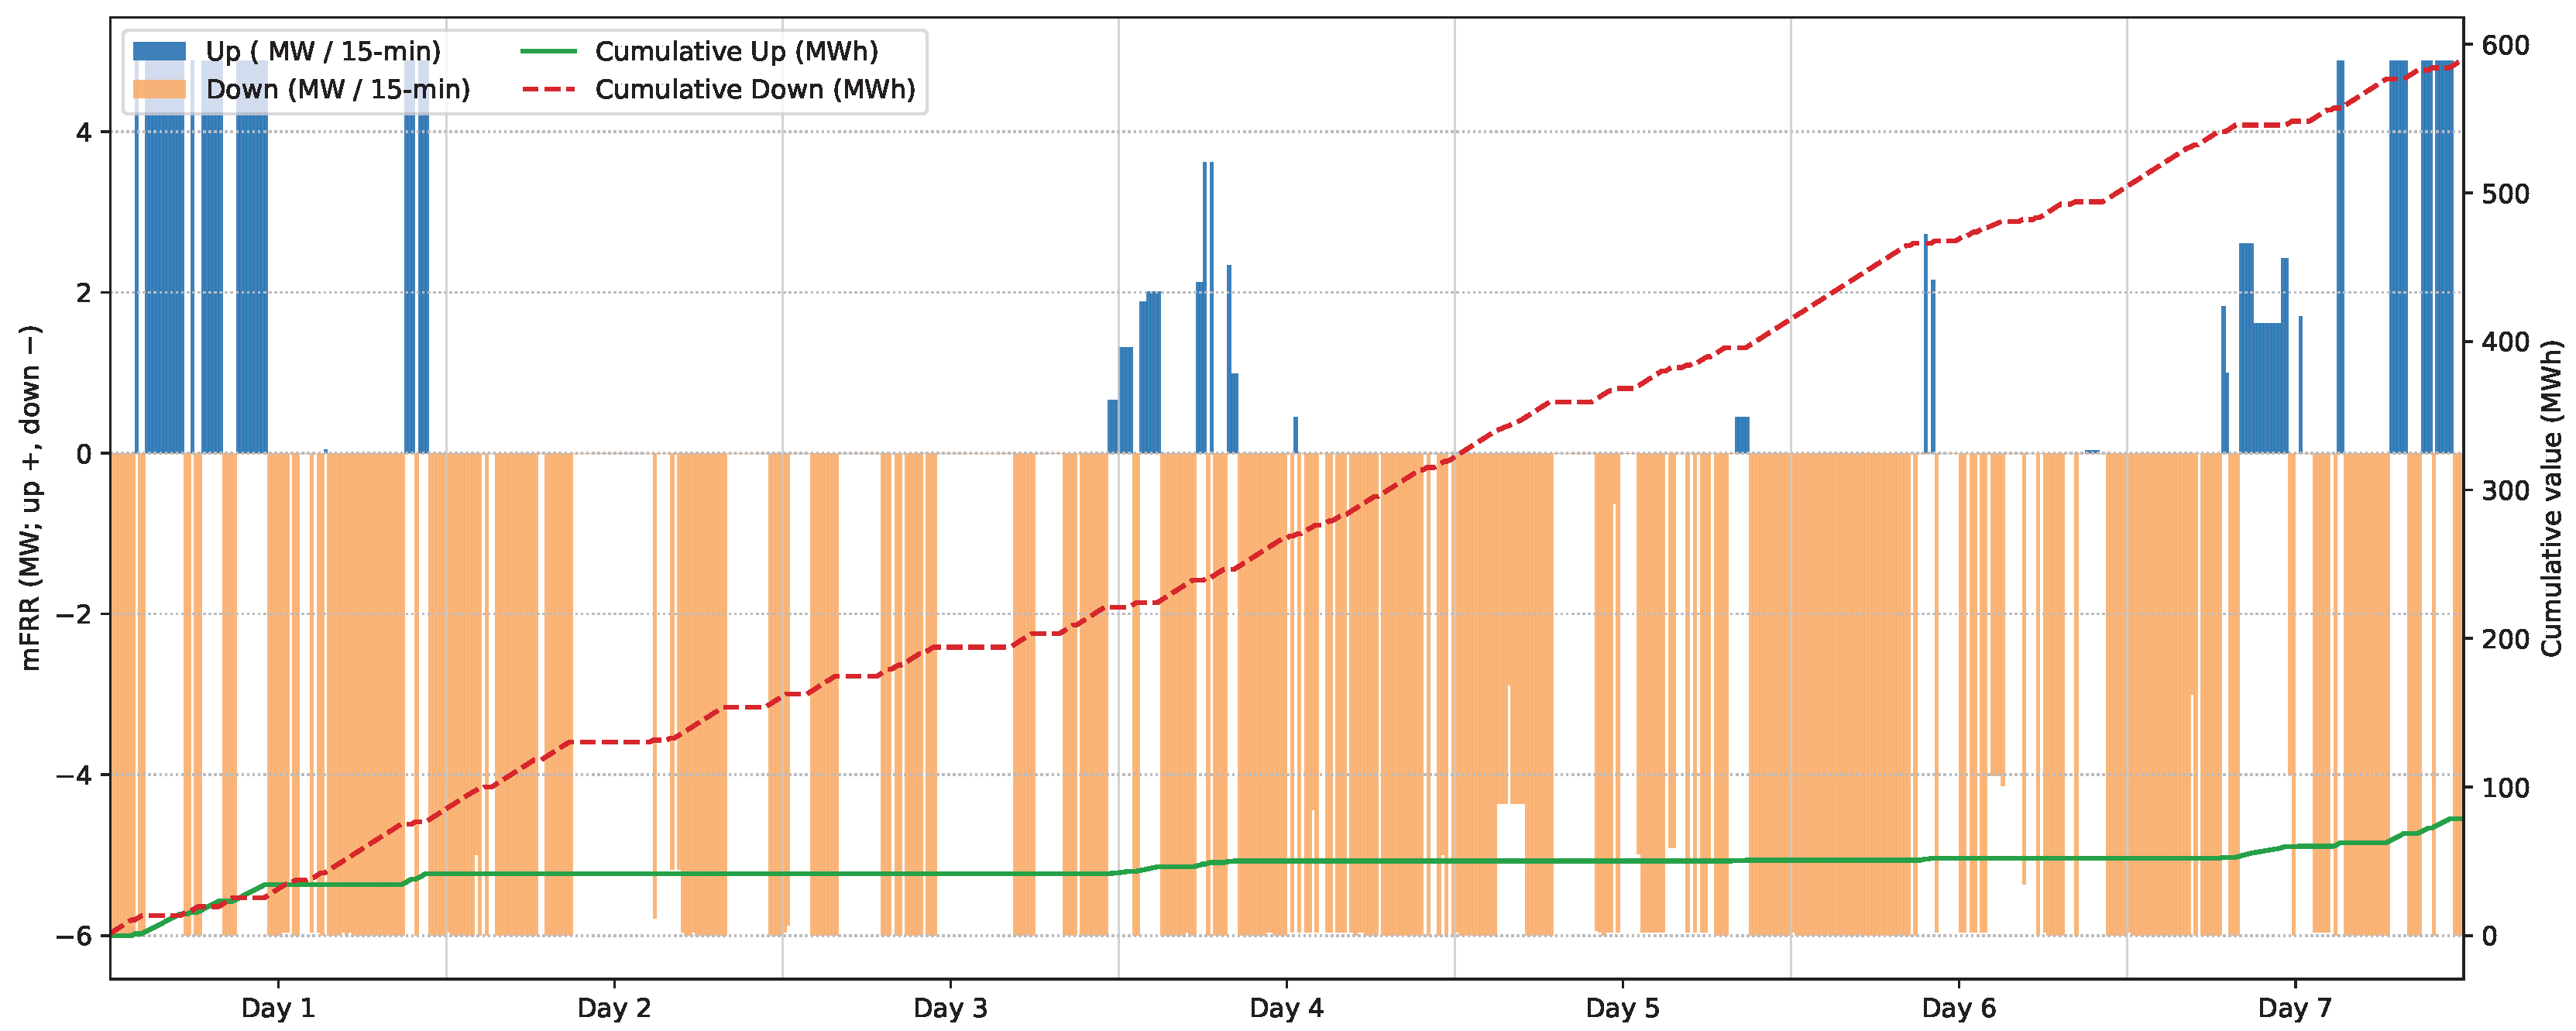
Figure 6 illustrates the cumulative amount of energy provided throughout the simulation period, as well as the upward and downward mFRR produced by the facility during each quarter.
As seen in Figure 6, the facility demonstrates a strong preference for providing downward regulation services over upward services, with the cumulative downward mFRR reaching 588.62 MWh compared to only 78.45 MWh for upward services (ratio of 7.5:1). This asymmetric participation pattern can be explained through a comprehensive marginal revenue analysis that considers the unique economic structure of the Nordic mFRR market and the operational characteristics of electrolyzers. From a marginal revenue perspective, downward regulation service creates a dual revenue stream that fundamentally alters the economics of PtH operations. When providing downward regulation, the facility increases its power consumption, where it receives compensation at the downward mFRR-clearing price for the additional power consumed. Simultaneously, this increased power consumption translates directly into additional hydrogen production. The downward regulation payment often exceeds the electricity cost during periods of system surplus. This creates a negative net electricity cost while simultaneously generating hydrogen revenue. In contrast, upward regulation presents an economically inferior proposition. When providing upward services, the facility reduces consumption. However, this power reduction directly translates to decreased hydrogen production, resulting in lost revenue. Hence, the mFRR payment must compensate for both the lost hydrogen revenue and the saved electricity cost. Furthermore, the Nordic mFRR market’s characteristics can amplify this economic asymmetry. This market experiences frequent periods of renewable energy surplus, particularly from wind generation, creating more opportunities for profitable downward regulation. During these periods, system operators need to absorb excess generation, and downward regulation prices can increase, while spot electricity prices remain low or even negative.
The installed facility in the port of Hirtshals is able to be supplied directly from the nearby WTs or through its direct connection to the grid. In the first case, it is assumed that the actual amount of power generated by those WTs is fed into the electrolyzer based on 40 €/MWh as an agreement. However, in the case of connecting to the grid, it can buy the electrical power from the day-ahead market with the spot electricity price. Table 3 compares the unit’s net profit across different days in the first week of April, accounting for two electrical power supply methods and potential participation in the mFRR EAM.
As Table 3 shows, from an economic angle, buying the power from the market in both cases, with and without taking part in the mFRR EAM, is a better option compared to the PPA with a fixed price of 40 €/MWh. This can be explained by the fact that there are some hours when the electricity price is less than 40 €/MWh, which allows the facility to reduce its costs and, as a result, increase its net profit compared to purchasing power at the fixed price of 40 €/MWh. Another interesting observation is that although the total hydrogen production when supplied by WTs without mFRR EAM participation exceeds that of the grid-connected operation, the net profit remains lower due to the aforementioned reason. From the perspective of enhancing revenue streams for such facilities, participation in the mFRR market can significantly increase net profit due to the substantial contribution these units make in providing downward regulation services.
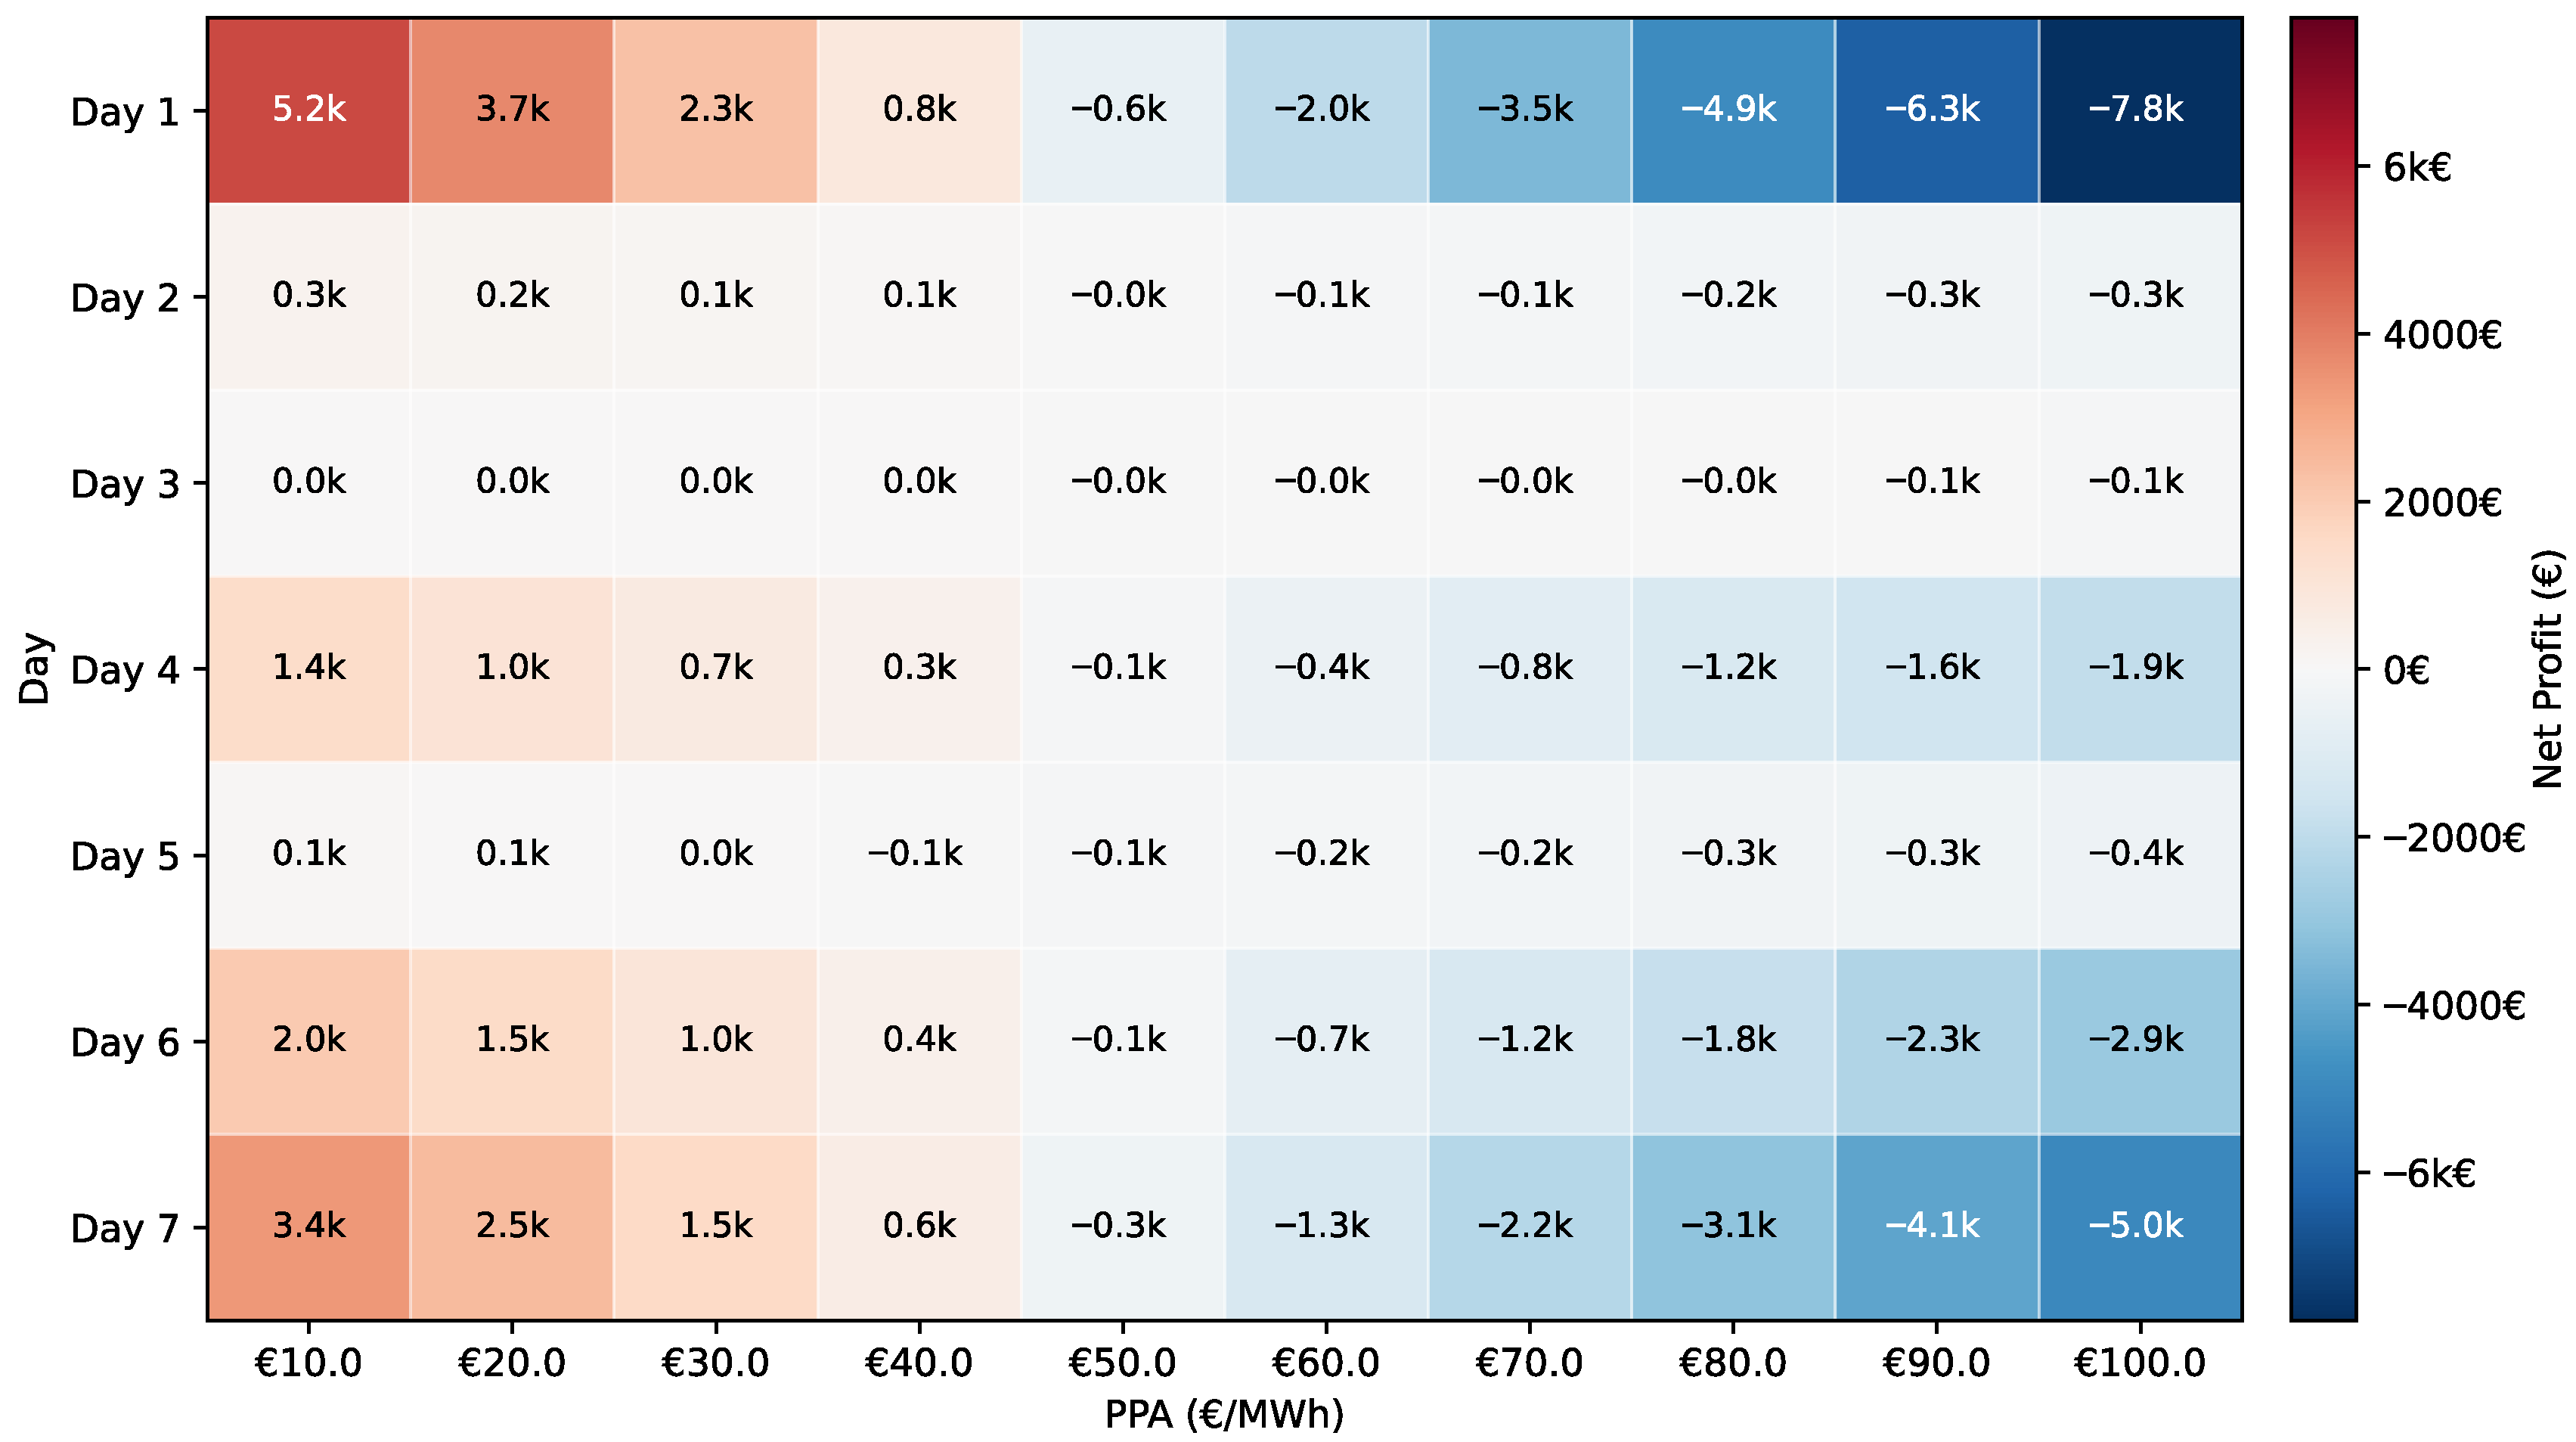
As seen, one of the key factors in the net profit of the facility is tied to the buying of the electrical power. To address this, a sensitivity analysis is conducted to determine the net profit of the PtH unit based on different PPA values without participation in the mFRR EAM, as shown in Figure 7.
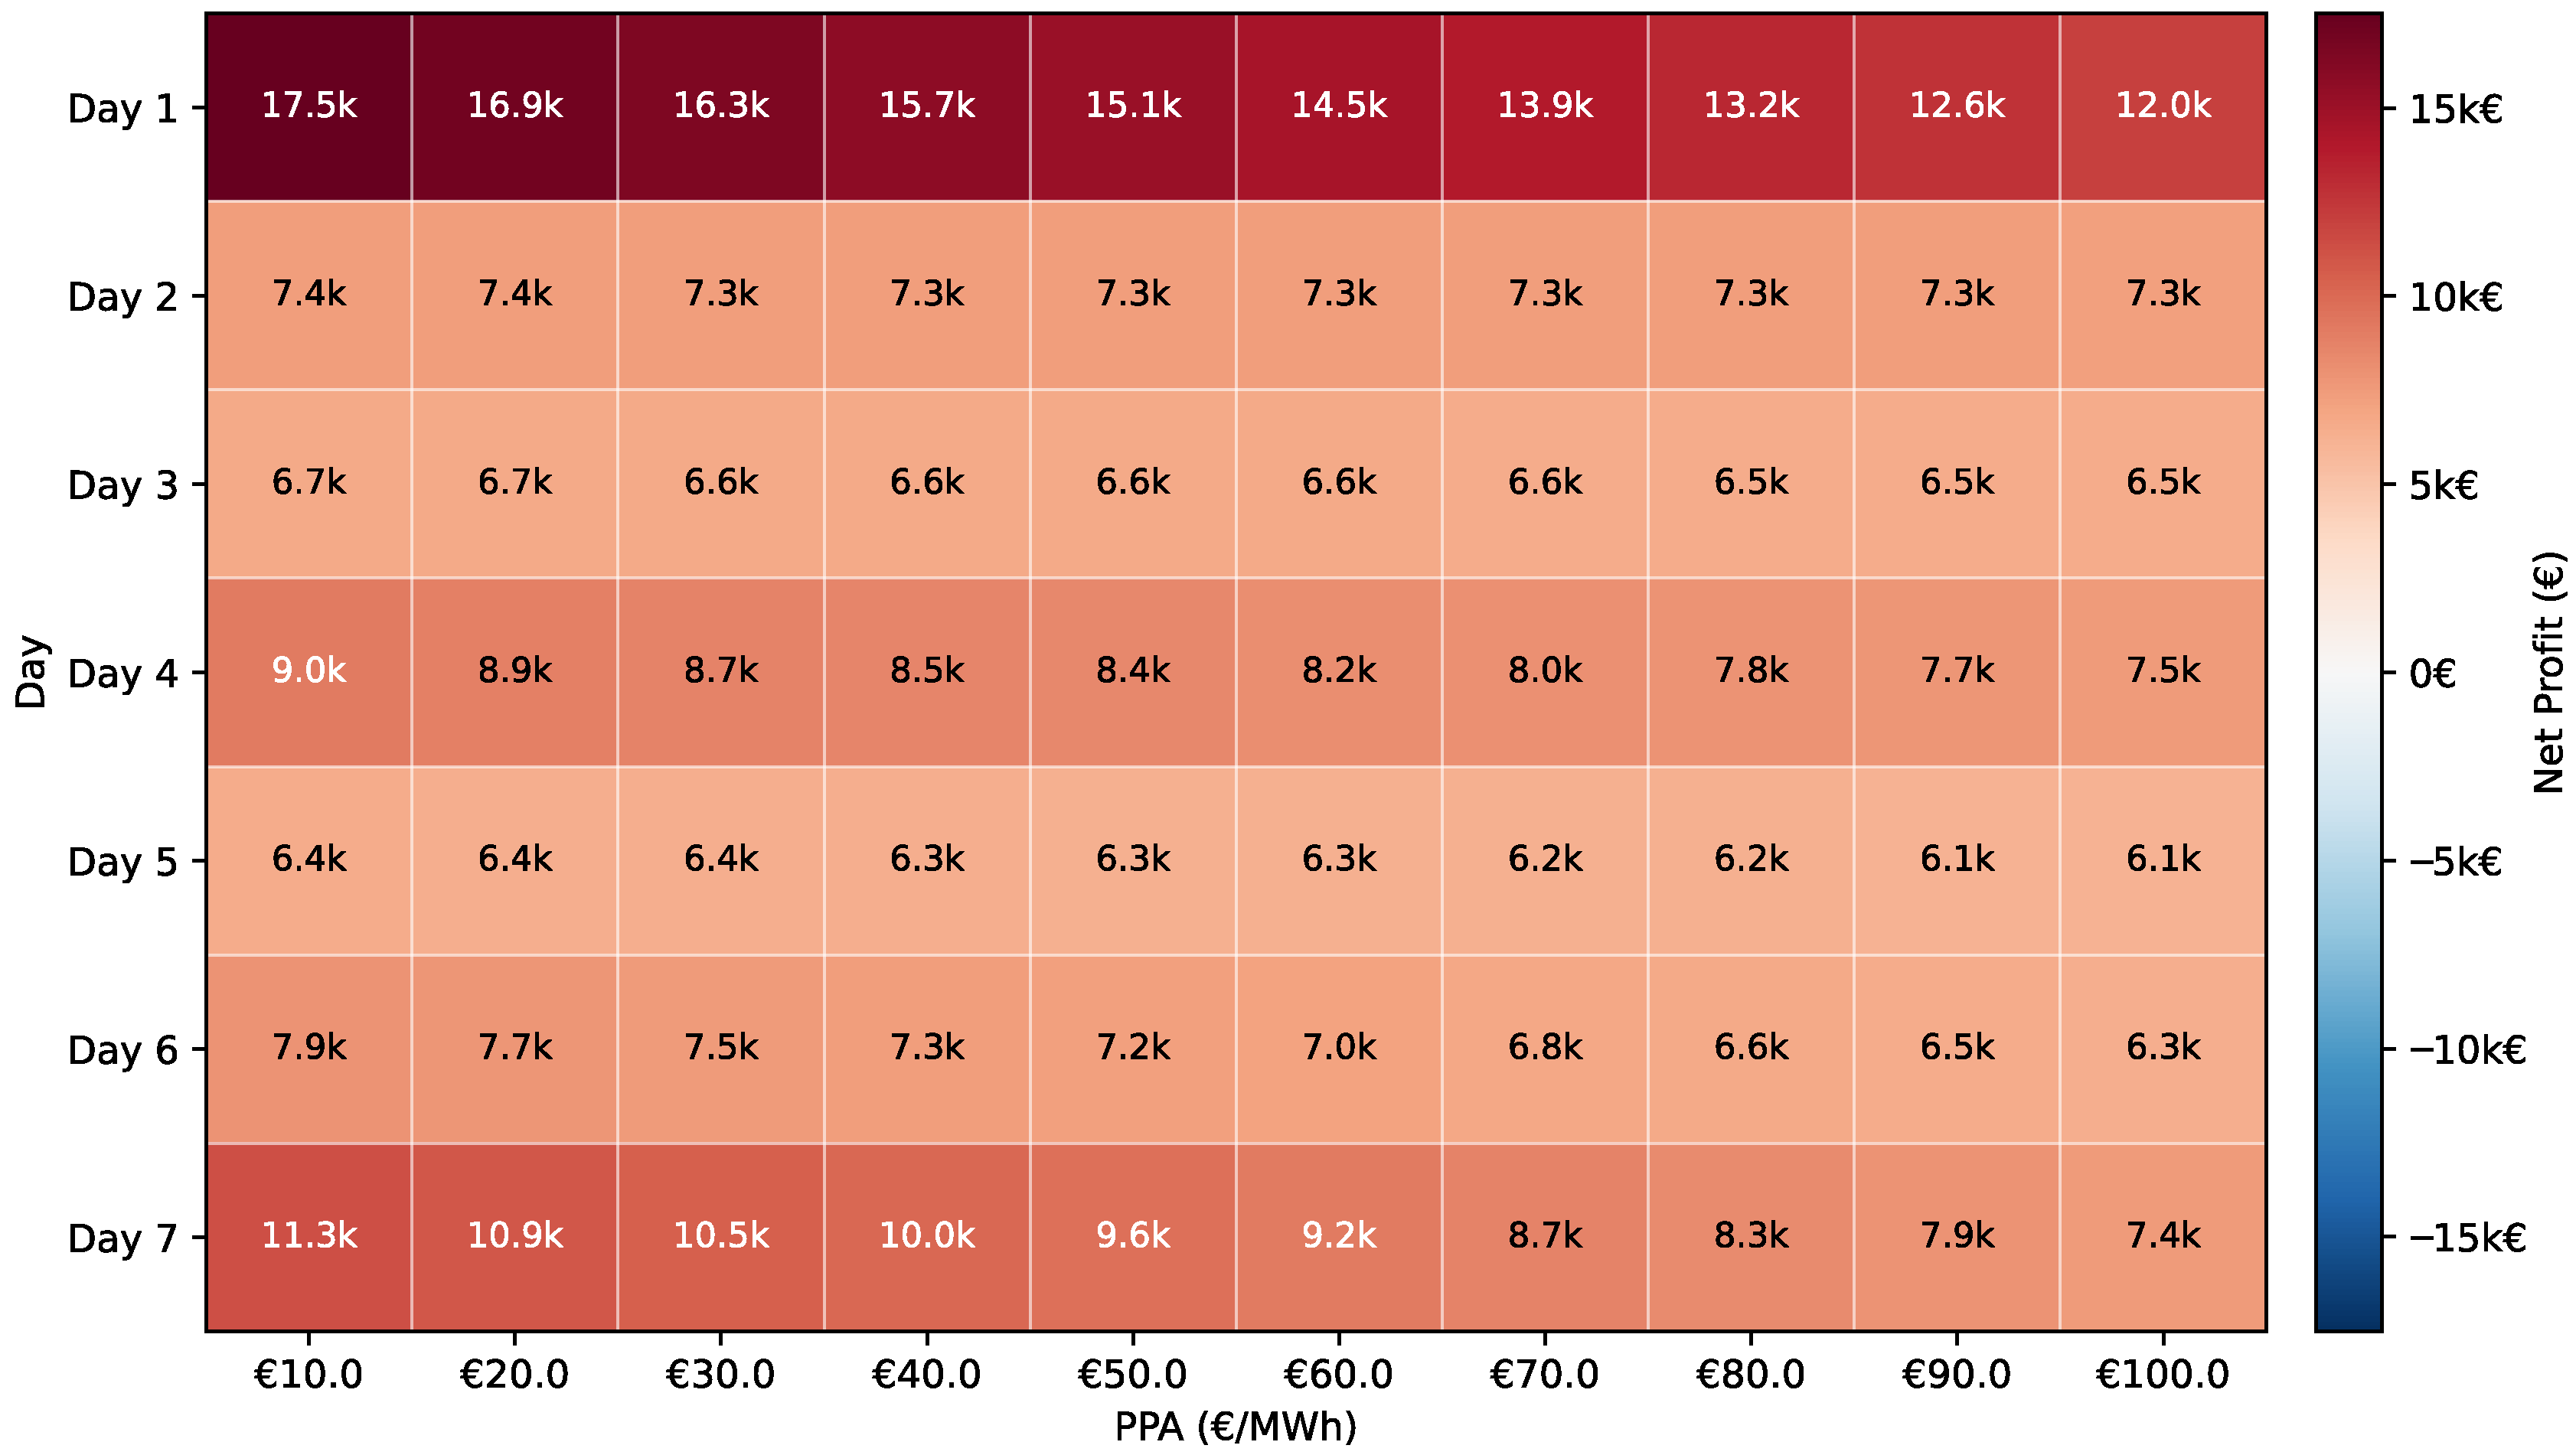
Figure 7 shows a clear pattern of increasing net profit with decreasing PPA values, which can be explained by the reduced cost of purchasing electrical power. However, in some cases, the net profit becomes negative, indicating that the corresponding PPA values are not economically viable and that market participation for electricity procurement may be more advantageous. Moreover, specifically, the analysis reveals that PPA prices below 30 €/MWh consistently yield positive weekly profits across all days, with the optimal sweet spot ranging between 10 and 30 €/MWh. For operators, this suggests that without mFRR participation, securing PPAs below 30 €/MWh is critical for profitability, while agreements above 50 €/MWh result in negative returns for most operational days, making market-based procurement more attractive. A similar analysis has been performed, considering the case where the system is able to take part in the mFRR EAM, and the results of the sensitivity analysis can be found in Figure 8.
As depicted in Figure 8, mFRR participation fundamentally transforms the facility’s economics, maintaining positive profitability even at PPA prices up to 100 €/MWh. This represents a remarkable profit improvement compared to non-participation scenarios, providing operators with significant flexibility in PPA negotiations and demonstrating that facilities should prioritize mFRR market access even when faced with higher electricity costs. This substantial economic benefit is attributed to the significant revenue streams generated through participation in the mFRR market, particularly from providing downward regulation service. When offering downward mFRR, the facility strategically reduces power intake from the wind turbines to reserve capacity for ancillary services while simultaneously increasing grid power consumption. This dual approach enables the electrolyzer to produce additional hydrogen during downward-regulation periods, creating two complementary revenue streams: compensation for the ancillary service provision and income from the sale of surplus hydrogen. Consequently, the facility achieves optimal economic performance by leveraging both market participation opportunities and hydrogen production capabilities.
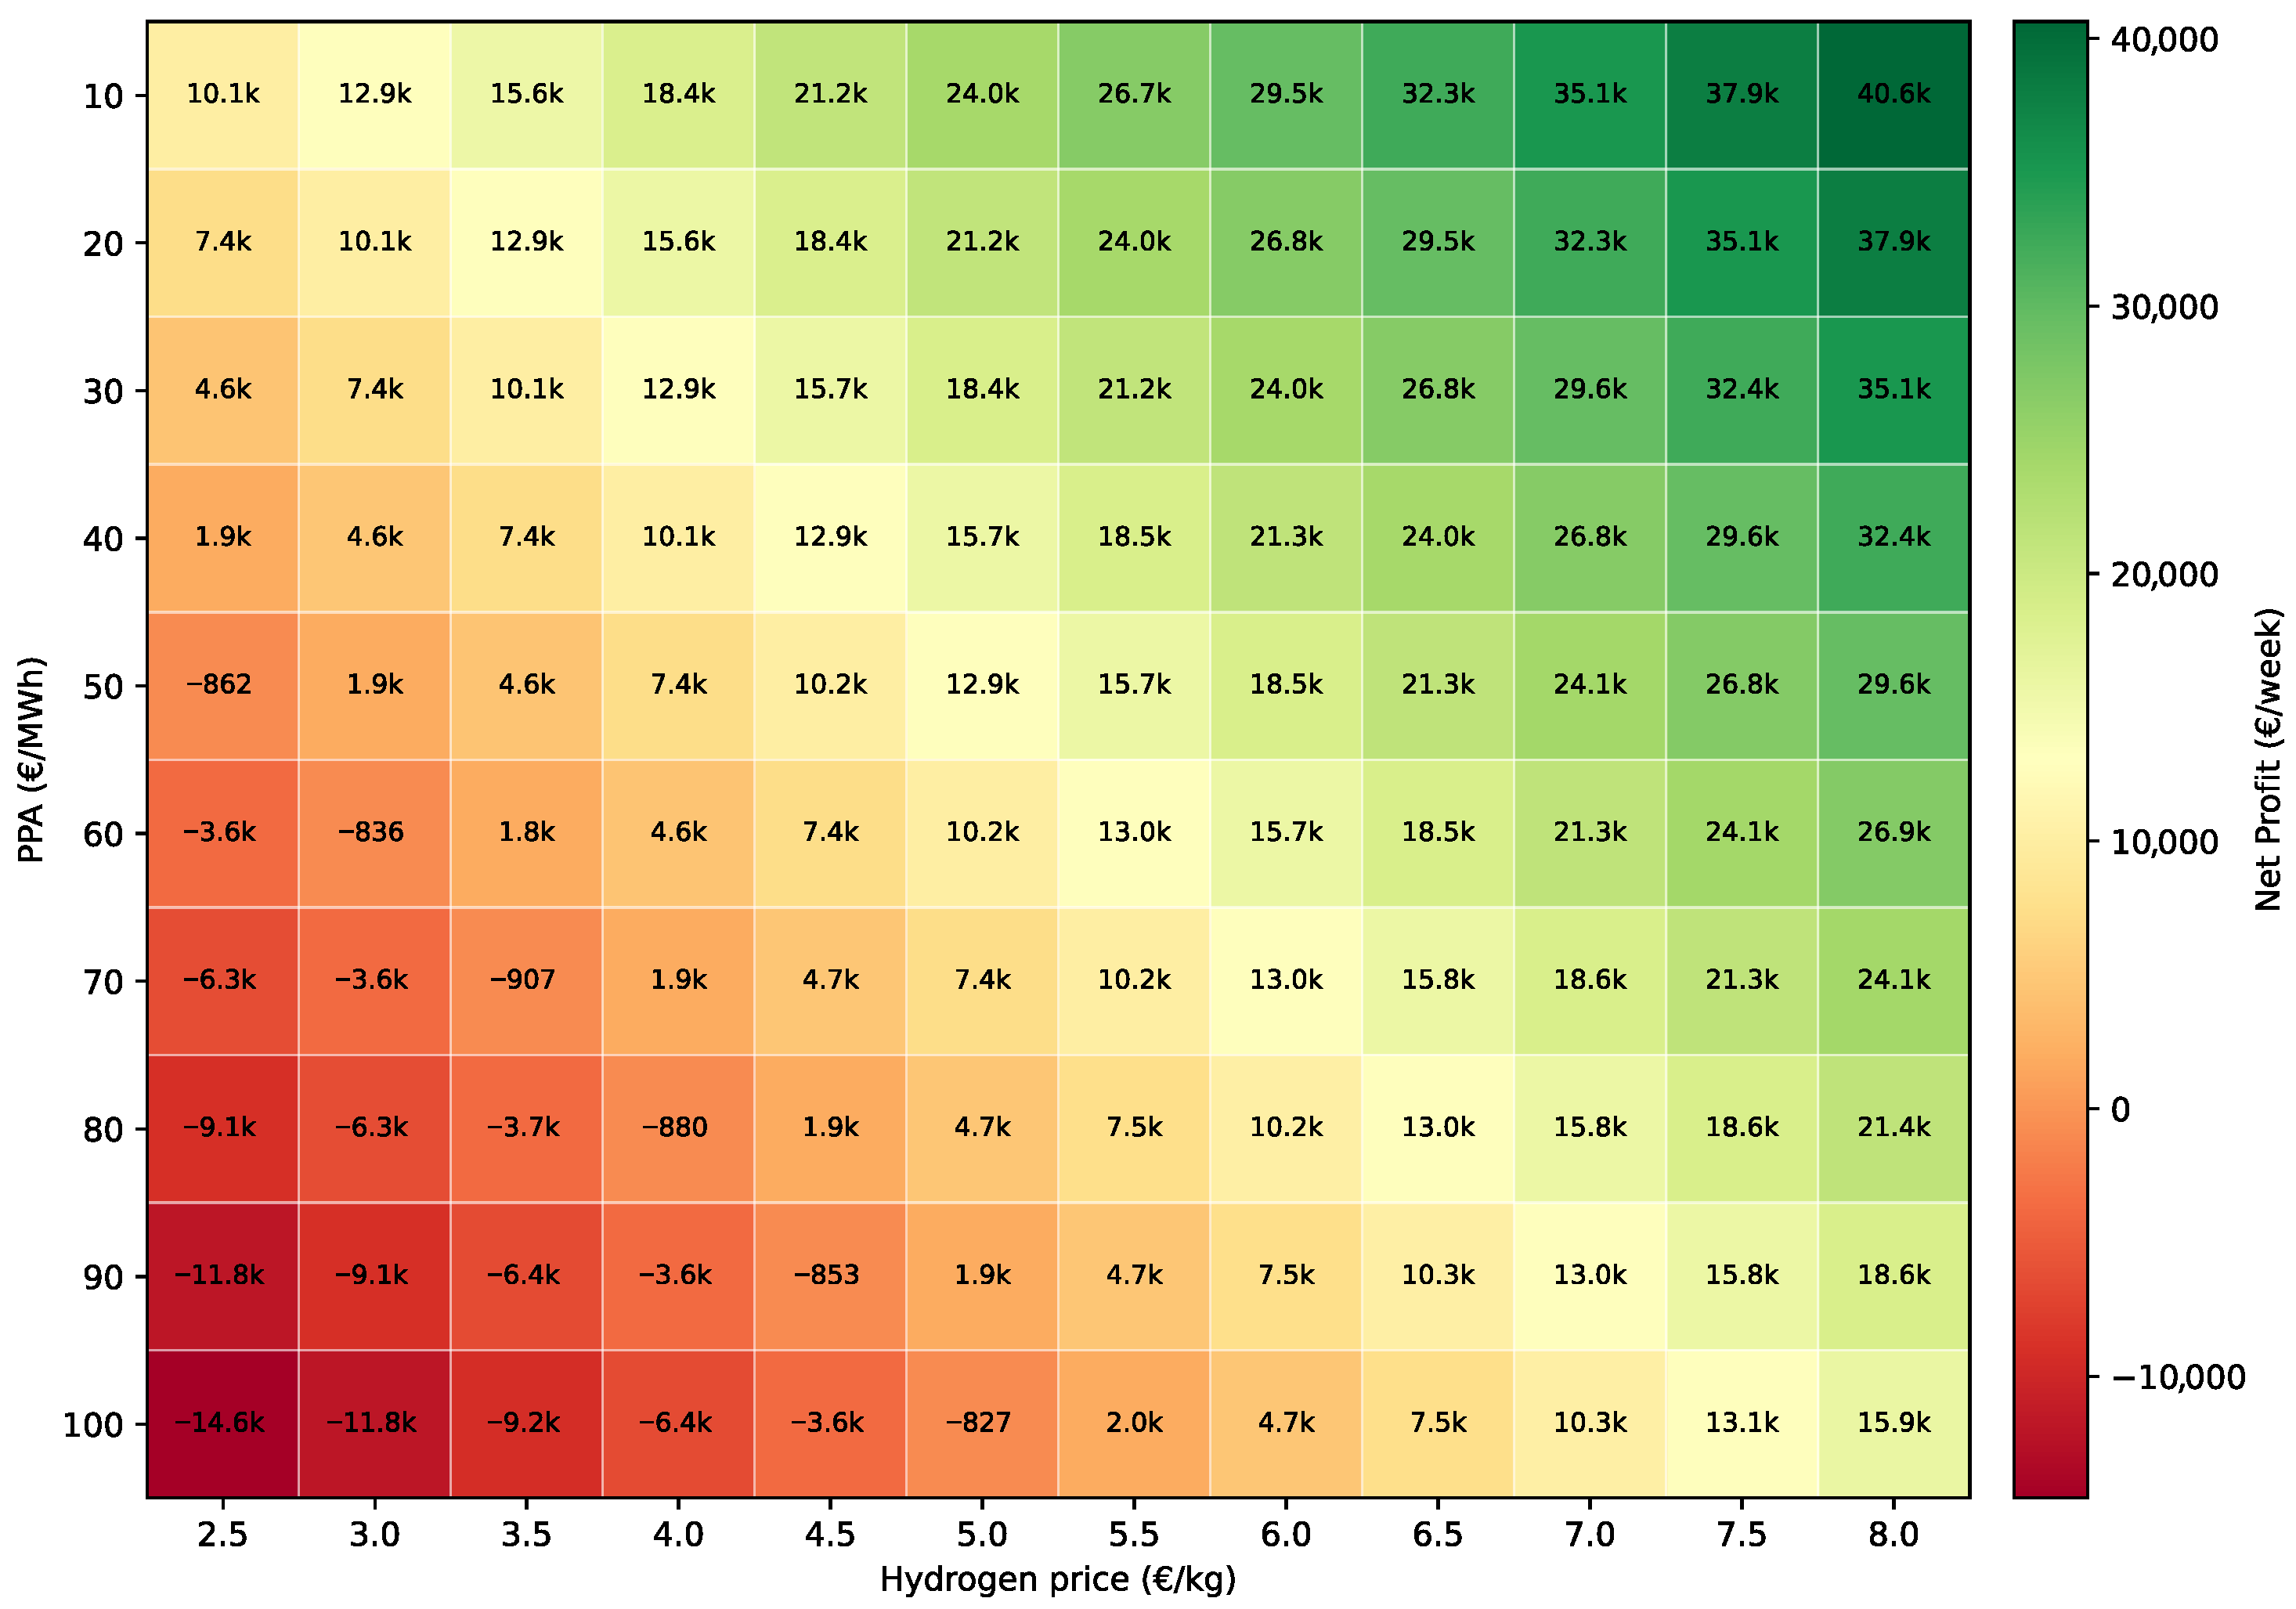
As expected, the net profit of the facility demonstrates an inverse relationship with PPA values, a finding confirmed by Figure 7 and Figure 8 for both operational scenarios (with and without mFRR provision). While electricity pricing remains the primary economic challenge for these facilities, hydrogen market price represents another critical external economic factor subject to variation based on prevailing supportive schemes and market conditions. Consequently, decision-makers must carefully evaluate hydrogen production value when negotiating PPAs with WT operators. To comprehensively address this interdependency, sensitivity analysis is performed for examining the interaction between hydrogen price and PPA values, illustrated in Figure 9, for scenarios excluding mFRR market participation.
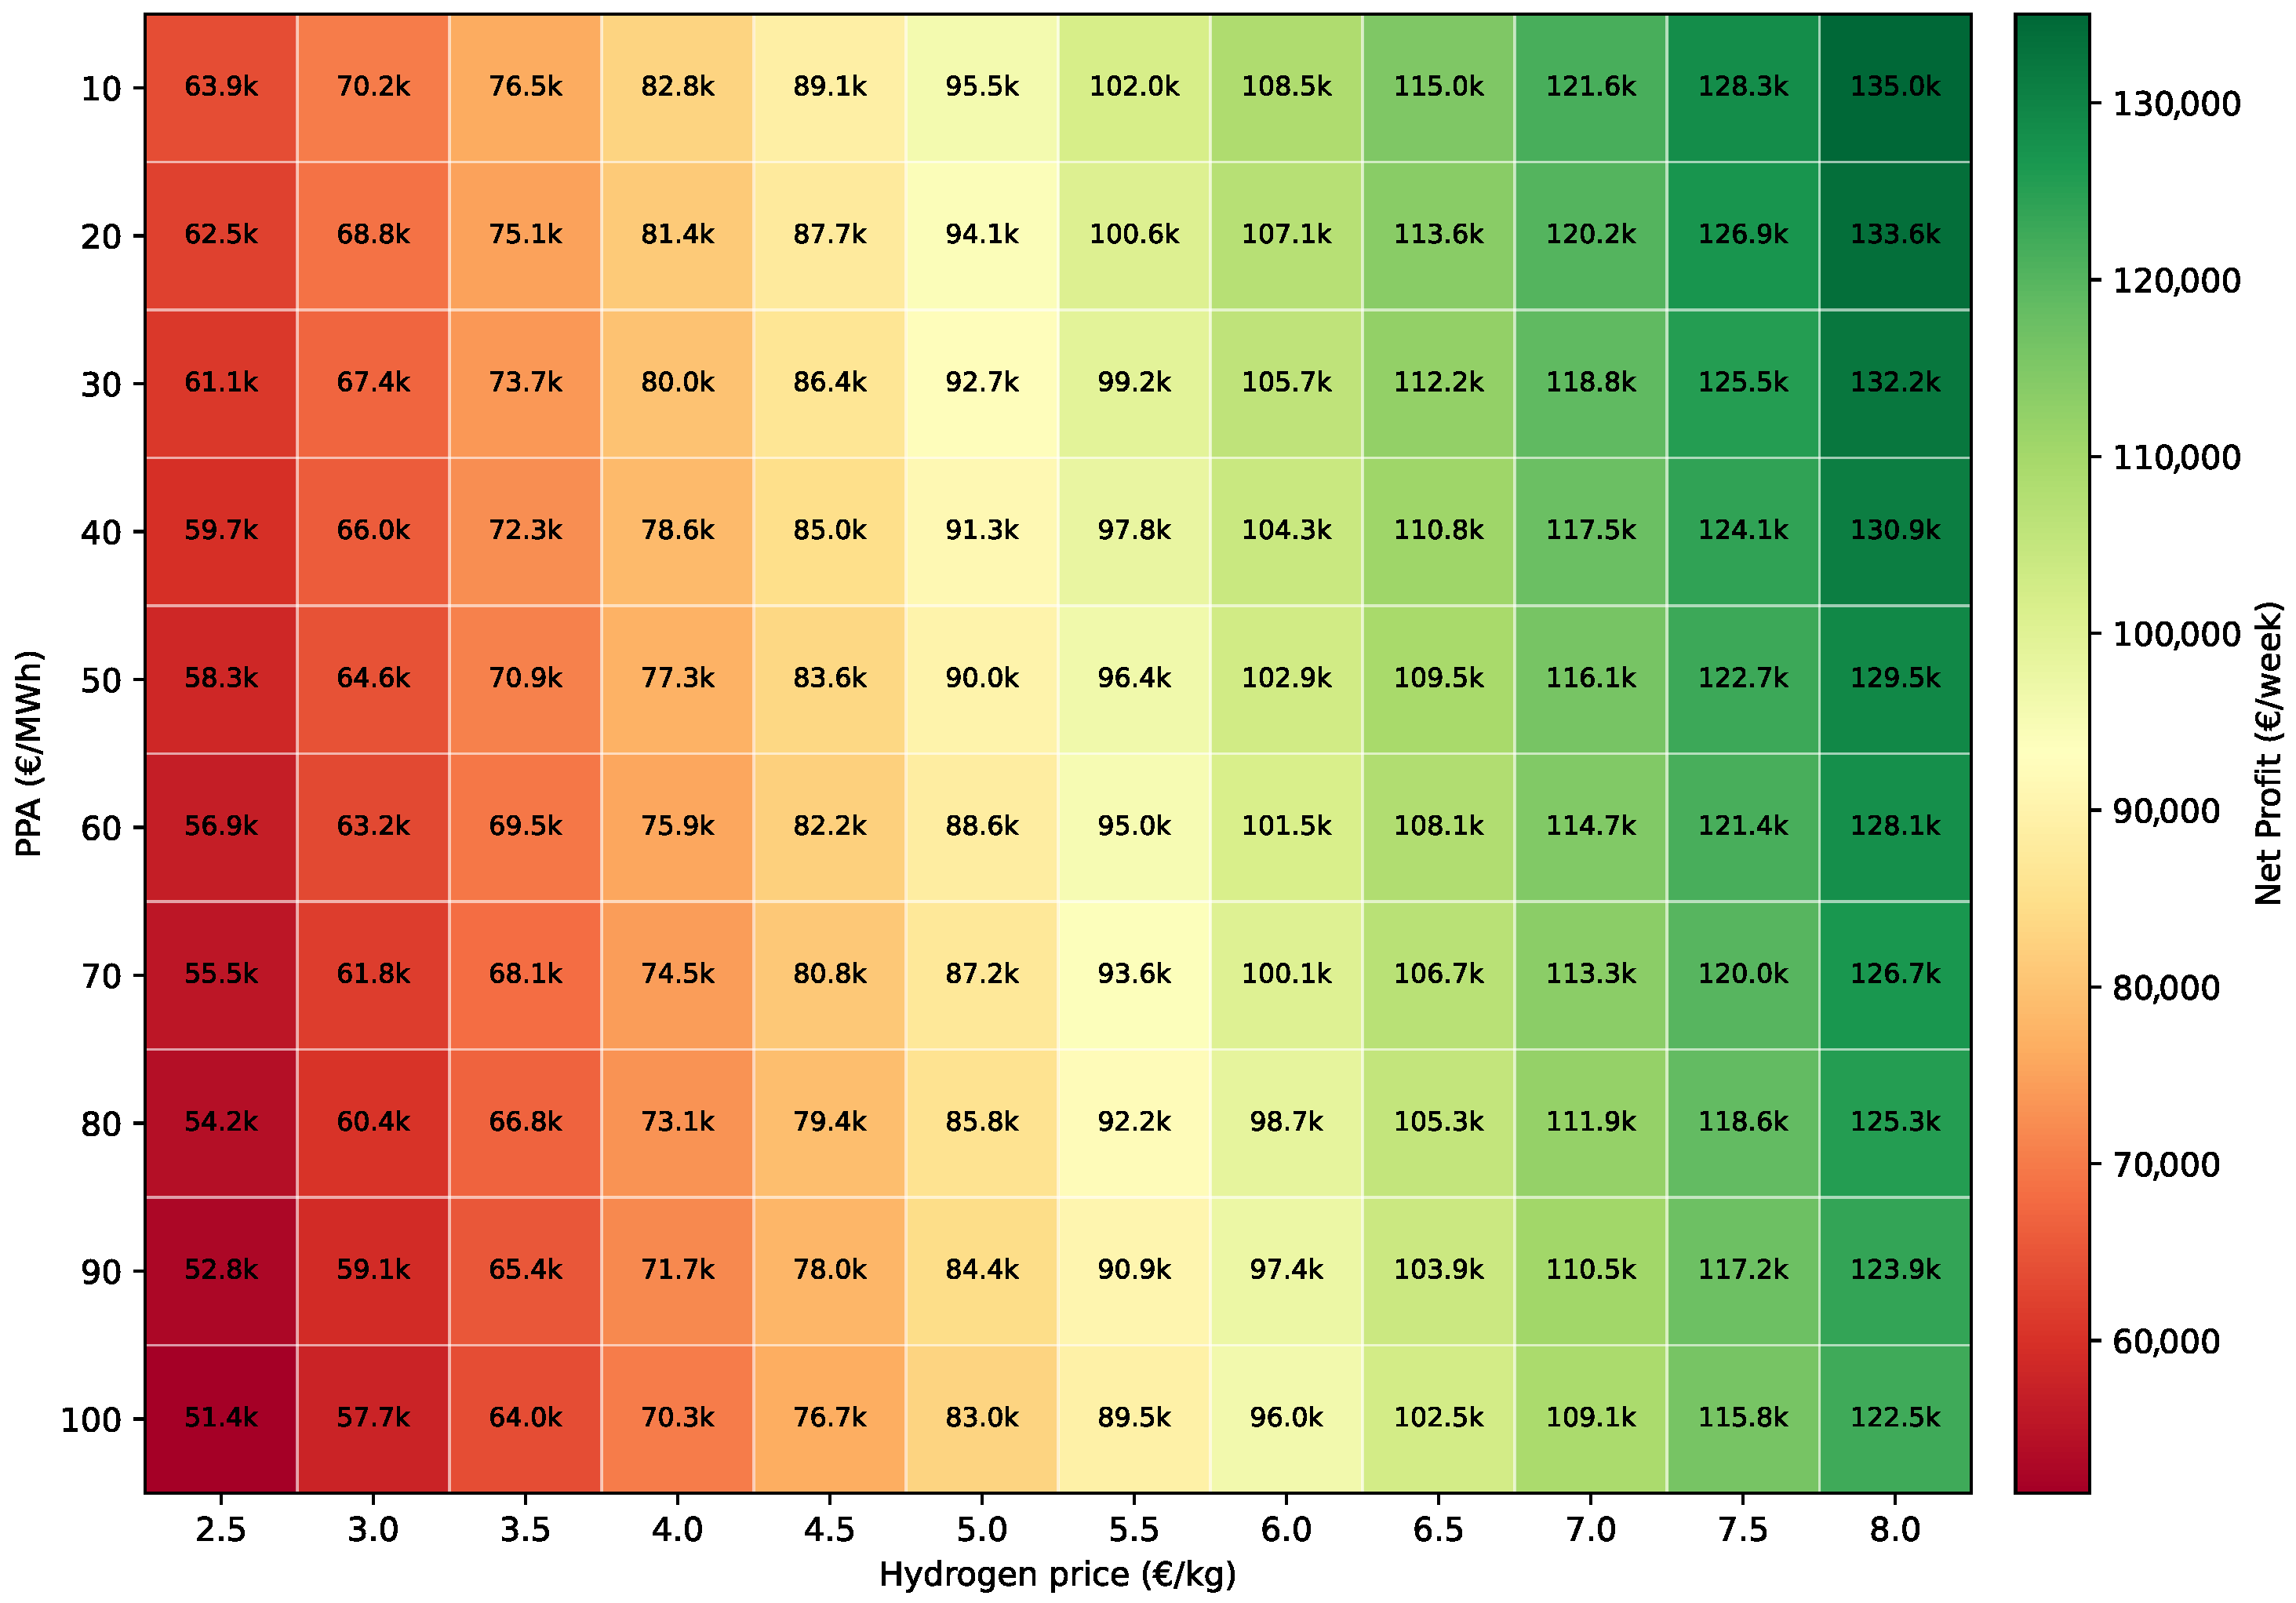
The analysis reveals that facility profitability increases with elevated hydrogen prices and reduced PPA values, exhibiting a clear correlation between these parameters. Notably, multiple break-even points emerge across different hydrogen price–PPA value pairs, underscoring the critical importance of conducting rigorous sensitivity analysis prior to PPA negotiations. A parallel analysis incorporating mFRR market participation is presented in Figure 10.
As seen, market participation generates a substantial improvement in facility economics through the introduction of an additional revenue stream. A comparative analysis with Figure 9 demonstrates a significant reduction in negative profit scenarios, demonstrating the strategic value of ancillary service provision in mitigating profitability risks and enhancing overall financial resilience
Under the PPA between the PtH facility and nearby WTs, the facility purchases electrical power at a predetermined price. The impact of mFRR market participation on the actual power purchased from these WTs warrants examination. Figure 11 illustrates the power purchased from nearby WTs by the PtH unit both with and without ancillary service provision.
As expected, contributing to the mFRR market leads to a reduction in the amount of power bought from the WTs because the facility prefers to keep its capacity for providing downward mFRR, which brings dual profit. This can be seen from the total built-up energy reduction within the simulation period (196.1 MWh), and this can also be an opportunity for the WT owners to sell their leftover power in the energy markets or act as a balancing service provider.
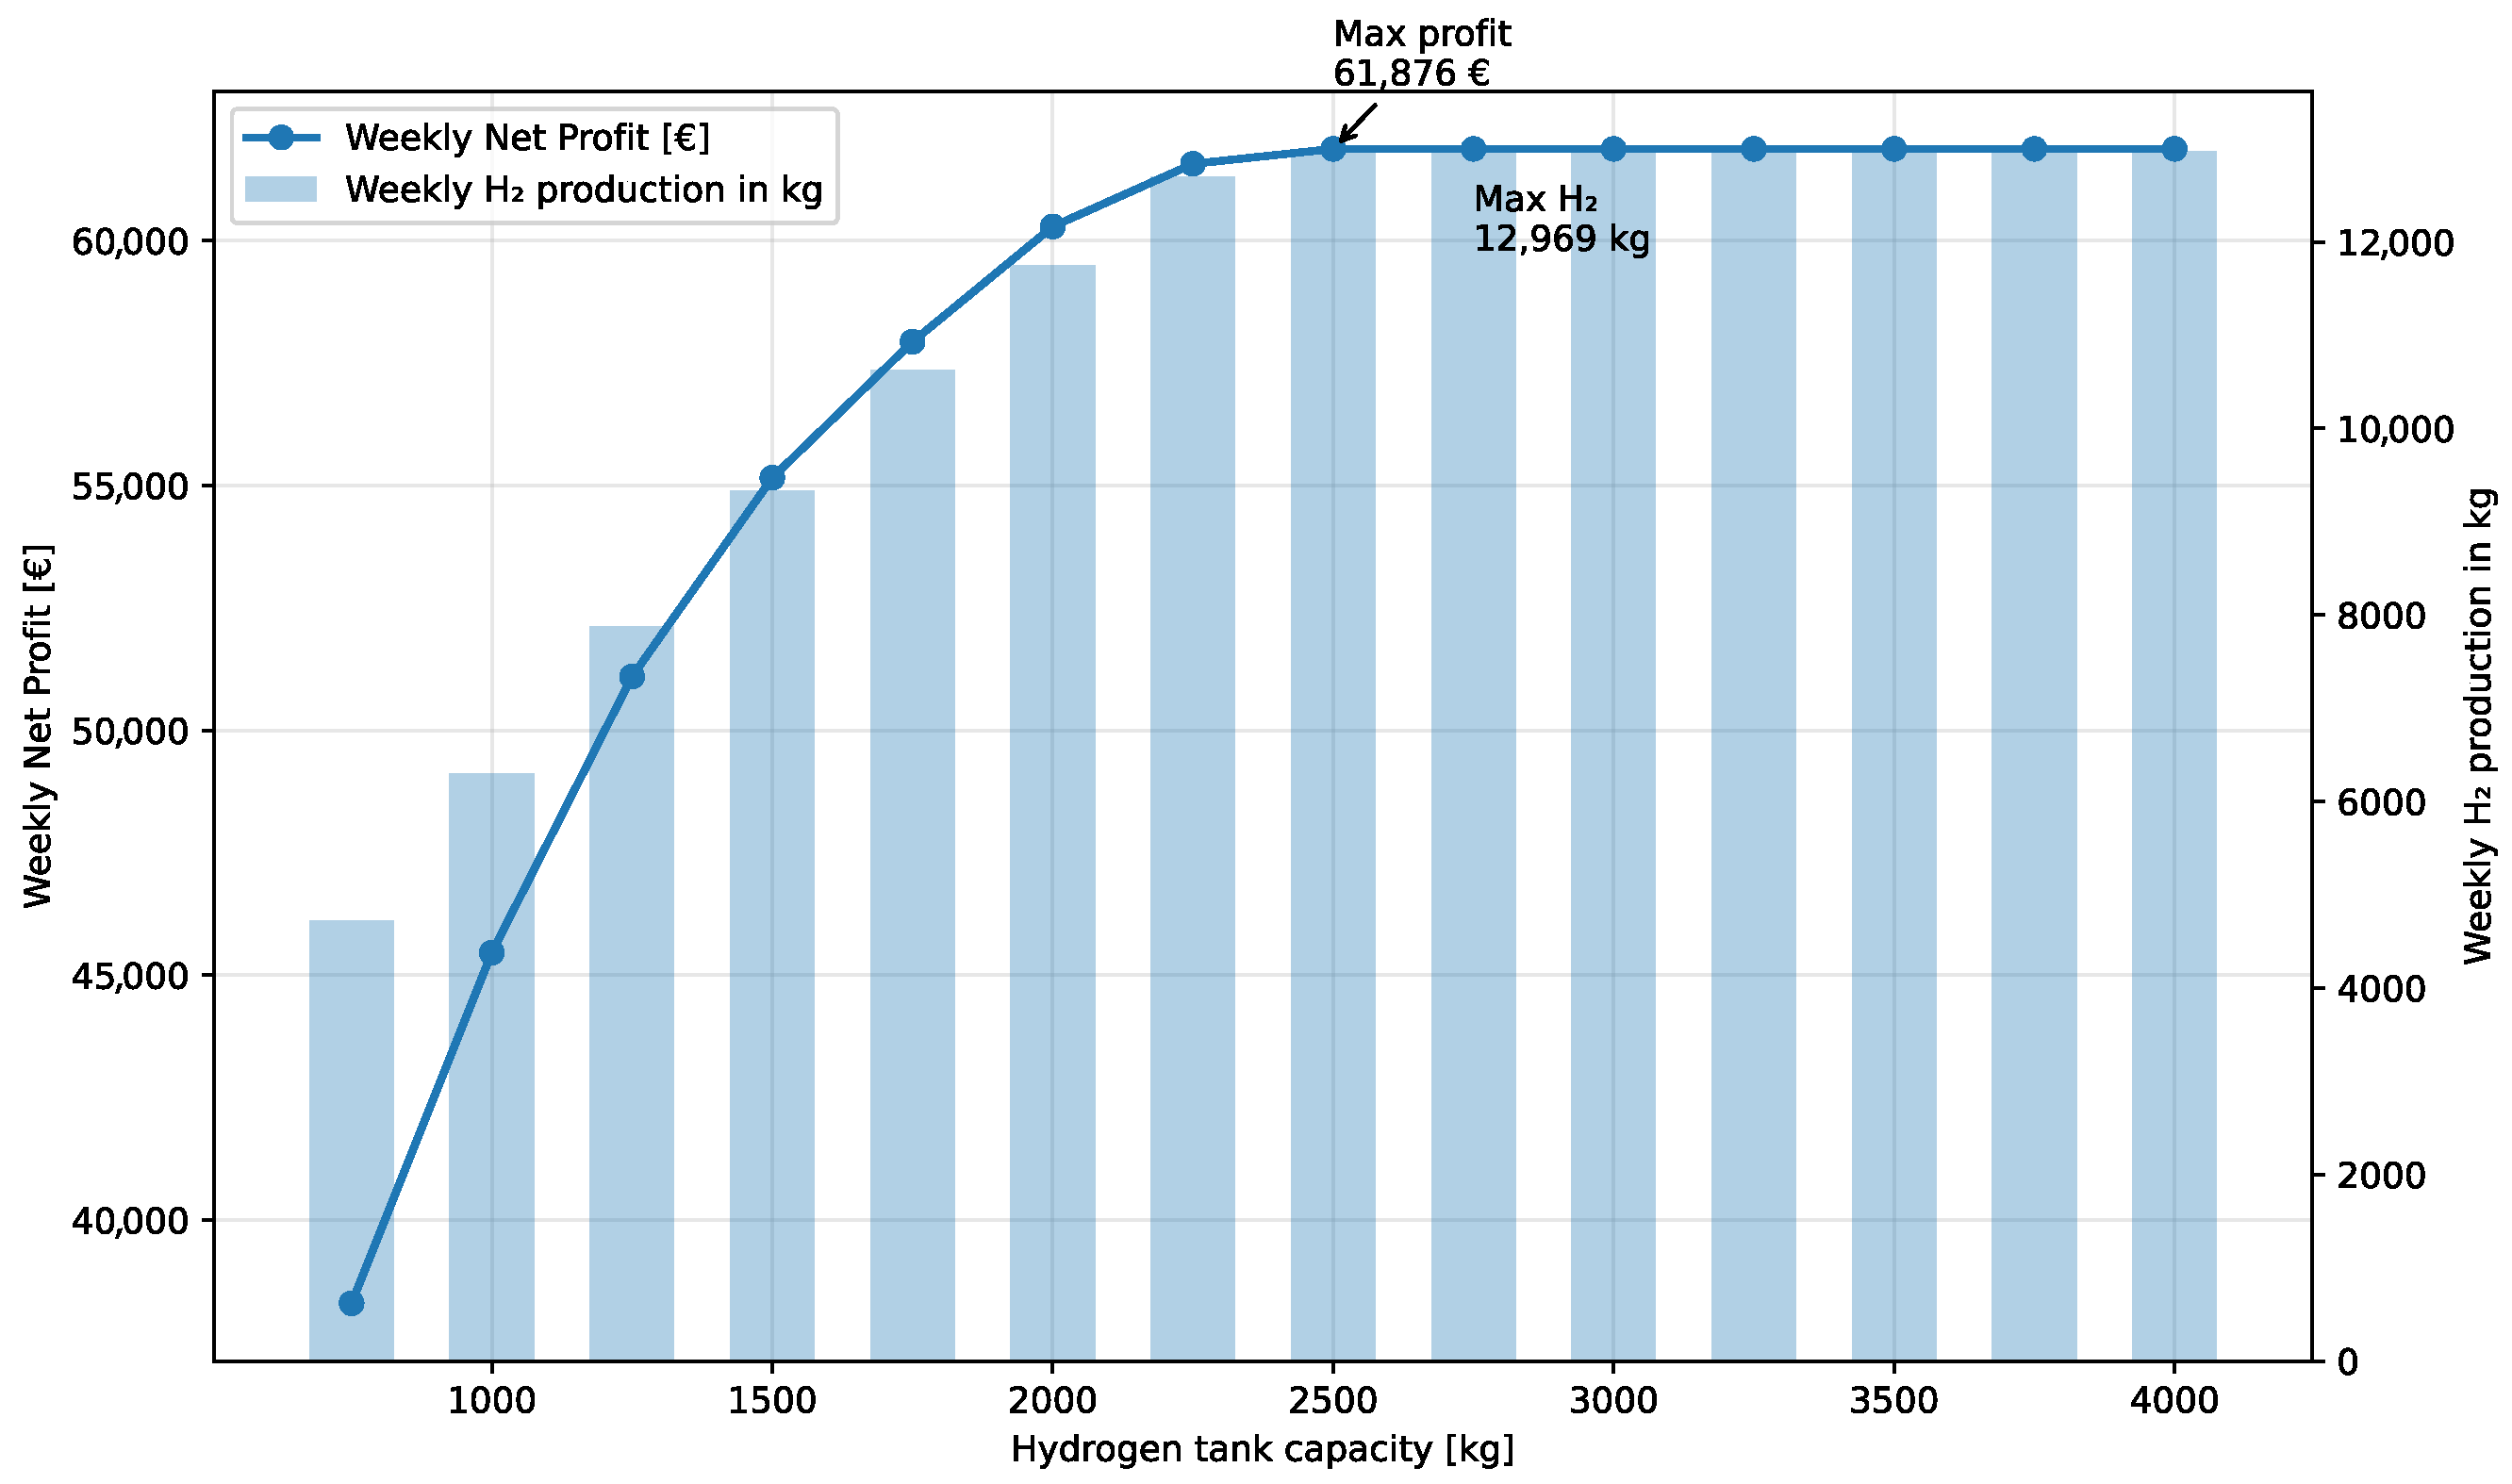
One more study for this system is the size of the hydrogen tank that can be used in this facility, since there is still no way for straight injection into the hydrogen pipelines. Figure 12 shows the total weekly hydrogen production and net profit of the system under study compared to different sizes of hydrogen tank.
As seen from Figure 12, the net profit of the system and the total hydrogen production increase with an increase in the hydrogen tank size, but it cannot be profitable having a hydrogen tank larger than 2.5 tons because of no change occurring in the net profit and the amount of produced hydrogen based on the available amount of power made from the nearby WTs. Therefore, it is necessary for the owner of such systems to figure out what business cases they are looking for, and based on that, they can invest in the right hydrogen storage to avoid leaving part of the capacity unused.
While the simulation results demonstrated significant economic benefits from mFRR participation, it is crucial to acknowledge that these outcomes are based on perfect information assumptions. In real-world operations, forecast errors in mFRR activation prices could lead to suboptimal bidding decisions, potentially reducing profits. Moreover, bids may be partially or fully unaccepted even with accurate prices due to limited activation volumes, and merit-order shifts, introducing acceptance risk. Similarly, wind power forecast errors may result in imbalance costs or missed opportunities for ancillary service provision. To mitigate these uncertainties in practical deployment, operators could implement several strategies, such as rolling-horizon optimization with updated forecasts to adjust bids closer to real-time, conservative bidding strategies that account for prediction intervals, leaving safety margins in capacity allocation, and explicitly sizing offers to account for an expected acceptance ratio (i.e., partial activation). Despite these limitations, the deterministic analysis provides an upper bound on achievable profits and valuable insights into the relative importance of different revenue streams, serving as a benchmark for developing robust operational strategies.

4. Conclusions

This paper set out to develop the optimal scheduling for the PtH facility, which is usable for the new single day-ahead coupling framework of the EU energy market and the Nordic mFRR energy activation market with a 15 min market time unit. To address this, the final MILP model was developed considering the technical limits of the different technologies within this facility, along with the requirements of the different markets. According to the findings, it was concluded that the Nordic mFRR market can be a good opportunity for these facilities to take part in for increasing their income through smart bidding plans. In addition, it was highlighted that these units prefer to mainly provide downward service because of its dual profit. First, reducing the electrical power cost and second, production of hydrogen after turning on and increasing its power use from the grid. Moreover, the usefulness of supplying power from the nearby WTs was analyzed, and it was seen that figuring out an accurate PPA value is necessary for having a net positive income, and finding the right value is tied to what plans the facility prefers to consider. Furthermore, the sensitivity analysis was performed on the optimal tank size, and the need for clearly defining accurate business models for those facilities was again highlighted, and this can help avoid unused capacity. However, this scheduling assumed perfect foresight of mFRR activation prices; in practice, forecast errors and sharp intraday price swings can weaken margins, and bids may be partially or fully unaccepted due to limited activation needs or merit-order shifts. For deployment, rolling (receding-horizon) re-optimization and conservative bidding tied to prediction intervals offer practical mitigations. As future work, robust or distributionally robust optimization using credible price bounds can hedge worst-case realizations for risk-averse decision makers, and simple chance-constrained bidding can cap the probability of adverse spreads. Future work will also analyze co-optimizing a battery energy storage system with the electrolyzer to dampen price volatility and improve revenues under uncertain mFRR activations.

Author Contributions

Conceptualization, S.G., S.A.S., H.G., A.A.-M., and B.B.-J.; methodology, S.G., S.A.S., and H.G.; software, S.G.; validation, S.G., S.A.S., and H.G.; formal analysis, S.G., S.A.S., and H.G.; investigation, S.G., H.G., and A.A.-M.; writing—original draft preparation, S.G., S.A.S., and H.G.; writing—review and editing, S.G., S.A.S., H.G., A.A.-M., and B.B.-J.; visualization, S.G.; supervision, A.A.-M. and B.B.-J.; funding acquisition, B.B.-J. All authors have read and agreed to the published version of the manuscript.

Funding

This research was funded by ELFORSK program under the Danish Energy Agency grant number ELF221-496872.

Data Availability Statement

The data presented in this study are available on request from the corresponding author due to (specify the reason for the restriction).

Conflicts of Interest

The authors declare no conflicts of interest.

References

  1. Kraftnät, S. Balancing Market Outlook 2030. Technical Report, Svenska Kraftnät, Tech. Rep., 2024. [Online]. Available online: https://www.svk.se (accessed on 18 September 2025).
  2. NBM. Confirmation of mFRR EAM Go Live March 4th 2025. 2025. Available online: https://nordicbalancingmodel.net/confirmation-of-mfrr-eam-go-live-march-4th-2025/?utm_source=chatgpt.com (accessed on 20 August 2025).
  3. Buttler, A.; Spliethoff, H. Current status of water electrolysis for energy storage, grid balancing and sector coupling via power-to-gas and power-to-liquids: A review. Renew. Sustain. Energy Rev. 2018, 82, 2440–2454. [Google Scholar] [CrossRef]
  4. Virji, M.; Randolf, G.; Ewan, M.; Rocheleau, R. Analyses of hydrogen energy system as a grid management tool for the Hawaiian Isles. Int. J. Hydrogen Energy 2020, 45, 8052–8066. [Google Scholar] [CrossRef]
  5. Schiebahn, S.; Grube, T.; Robinius, M.; Tietze, V.; Kumar, B.; Stolten, D. Power to gas: Technological overview, systems analysis and economic assessment for a case study in Germany. Int. J. Hydrogen Energy 2015, 40, 4285–4294. [Google Scholar] [CrossRef]
  6. Götz, M.; Lefebvre, J.; Mörs, F.; Koch, A.M.; Graf, F.; Bajohr, S.; Reimert, R.; Kolb, T. Renewable Power-to-Gas: A technological and economic review. Renew. Energy 2016, 85, 1371–1390. [Google Scholar] [CrossRef]
  7. Wulf, C.; Zapp, P.; Schreiber, A. Review of power-to-X demonstration projects in Europe. Front. Energy Res. 2020, 8, 191. [Google Scholar] [CrossRef]
  8. Guinot, B.; Montignac, F.; Champel, B.; Vannucci, D. Profitability of an electrolysis based hydrogen production plant providing grid balancing services. Int. J. Hydrogen Energy 2015, 40, 8778–8787. [Google Scholar] [CrossRef]
  9. Glenk, G.; Reichelstein, S. Economics of converting renewable power to hydrogen. Nat. Energy 2019, 4, 216–222. [Google Scholar] [CrossRef]
  10. Zheng, Y.; Huang, C.; You, S.; Zong, Y. Economic evaluation of a power-to-hydrogen system providing frequency regulation reserves: A case study of Denmark. Int. J. Hydrogen Energy 2023, 48, 26046–26057. [Google Scholar] [CrossRef]
  11. Saretta, M.; Raheli, E.; Kazempour, J. Electrolyzer Scheduling for Nordic FCR Services. In Proceedings of the 2023 IEEE International Conference on Communications, Control, and Computing Technologies for Smart Grids, SmartGridComm 2023, Glasgow, UK, 31 October–3 November 2023. [Google Scholar] [CrossRef]
  12. Lomholt, C.N.; Klausen, N.M. Techno-Economical Evaluation of the Integration of Electrolysers to Provide Dynamic Frequency Response in a Large-Scale Renewable Power System. 2023. Available online: https://backend.orbit.dtu.dk/ws/portalfiles/portal/375176376/M-0609_-_Carl_Nikolaj_Lomholt_Nilas_M_ller_Klausen.pdf (accessed on 18 September 2025).
  13. Phan, L.V.; Nguyen-Dinh, N.P.; Nguyen, K.M.; Nguyen-Duc, T. Advanced frequency control schemes and technical analysis for large-scale PEM and Alkaline electrolyzer plants in renewable-based power systems. Int. J. Hydrogen Energy 2024, 89, 1354–1367. [Google Scholar] [CrossRef]
  14. Nski, J.S.; Milewski, J.; Ryś, P.R.; Paczucha, J.; Kłos, M. Grid Frequency Fluctuation Compensation by Using Electrolysis: Literature Survey. Energies 2025, 18, 4376. [Google Scholar] [CrossRef]
  15. Riofrio, J.; You, S.; Weckesser, T. Power-to-X (PtX) integration in modern power systems: Exploring grid code compliance and technical requirements in Denmark and the United Kingdom. IET Conf. Proc. 2023, 2023, 5–14. [Google Scholar] [CrossRef]
  16. Ghaemi, S.; Li, X.; Mulder, M. Economic feasibility of green hydrogen in providing flexibility to medium-voltage distribution grids in the presence of local-heat systems. Appl. Energy 2023, 331, 120408. [Google Scholar] [CrossRef]
  17. Ghaemi, S.; Anvari-Moghaddam, A. Maximizing Value in Power-to-Hydrogen Plants Within Eco-Industrial Clusters Through Internal Heat Market. In Proceedings of the 2024 20th International Conference on the European Energy Market (EEM), Istanbul, Turkey, 10–12 June 2024; pp. 1–7. [Google Scholar] [CrossRef]
  18. Yu, Q.; Hao, Y.; Ali, K.; Hua, Q.; Sun, L. Techno-economic analysis of hydrogen pipeline network in China based on levelized cost of transportation. Energy Convers. Manag. 2024, 301, 118025. [Google Scholar] [CrossRef]
  19. Haggi, H.; Sun, W.; Fenton, J.M.; Brooker, P. Proactive Rolling-Horizon-Based Scheduling of Hydrogen Systems for Resilient Power Grids. IEEE Trans. Ind. Appl. 2022, 58, 1737–1746. [Google Scholar] [CrossRef]
  20. Pingkuo, L.; Junqing, G. Comparative analysis on the development potential of green hydrogen industry in China, the United States and the European Union. Int. J. Hydrogen Energy 2024, 84, 700–717. [Google Scholar] [CrossRef]
  21. Zenith, F.; Flote, M.N.; Santos-Mugica, M.; Duncan, C.S.; Mariani, V.; Marcantonini, C. Value of green hydrogen when curtailed to provide grid balancing services. Int. J. Hydrogen Energy 2022, 47, 35541–35552. [Google Scholar] [CrossRef]
  22. Xiao, P.; Hu, W.; Xu, X.; Liu, W.; Huang, Q.; Chen, Z. Optimal operation of a wind-electrolytic hydrogen storage system in the electricity/hydrogen markets. Int. J. Hydrogen Energy 2020, 45, 24412–24423. [Google Scholar] [CrossRef]
  23. Verstraten, P.; Wevers, M.; Raja, A. The Effects of PPAs on the Electricity Market TNO Public TNO Public Title TNO Public Report Text TNO Public Number of Pages 22 (excl. Front and Back Cover) Number of Appendices 0. 2024. Available online: https://publications.tno.nl/publication/34642473/pHWx3P/TNO-2024-R10051.pdf (accessed on 18 September 2025).
  24. Gonzalez-Aparicio, I.; Vitulli, A.; Krishna-Swamy, S.; Hernandez-Serna, R.; Jansen, N.; Verstraten, P. TNO Whitepaper Offshore Wind Business Feasibility in a Flexible and Electrified Dutch Energy Market by 2030. 2022. Available online: https://publications.tno.nl/publication/34640203/tMlTI0/TNO-2022-offshorewind.pdf (accessed on 18 September 2025).
  25. Schrotenboer, A.H.; Veenstra, A.A.; uit het Broek, M.A.; Ursavas, E. A Green Hydrogen Energy System: Optimal control strategies for integrated hydrogen storage and power generation with wind energy. Renew. Sustain. Energy Rev. 2022, 168, 112744. [Google Scholar] [CrossRef]
  26. Urs, R.R.; Sadiq, M.; Mayyas, A.; Mezher, T. Unlocking the Power of Negative Electricity Prices: Grid Connected Hydrogen Production. In Proceedings of the 2024 2nd Power Electronics and Power System Conference, PEPSC 2024, Singapore, 6–9 November 2024; pp. 58–63. [Google Scholar] [CrossRef]
  27. Ziegler, L.; Schulze, A.; Henning, M.; Steinsultz, N.; Christian, P.; Shaikh, R.A.; Kumar, Y.P.S.; Islam, S.M.M.; Abbott, D. Techno-economic Analysis of Optimal Grid-Connected Renewable Electricity and Hydrogen-to-Power Dispatch. J. Physics Conf. Ser. 2024, 2689, 12013. [Google Scholar] [CrossRef]
  28. Şahin, M.E. An overview of different water electrolyzer types for hydrogen production. Energies 2024, 17, 4944. [Google Scholar] [CrossRef]
  29. Khasawneh, H.J.; Maaitah, R.A.; AlShdaifat, A. Green hydrogen in Jordan: Stakeholder perspectives on technological, infrastructure, and economic barriers. Energies 2025, 18, 3929. [Google Scholar] [CrossRef]
  30. García-Valverde, R.; Espinosa, N.; Urbina, A. Simple PEM water electrolyser model and experimental validation. Int. J. Hydrogen Energy 2012, 37, 1927–1938. [Google Scholar] [CrossRef]
  31. Ulleberg, Ø. Modeling of advanced alkaline electrolyzers: A system simulation approach. Int. J. Hydrogen Energy 2003, 28, 21–33. [Google Scholar] [CrossRef]
  32. Li, C.H.; Zhu, X.J.; Cao, G.Y.; Sui, S.; Hu, M.R. Dynamic modeling and sizing optimization of stand-alone photovoltaic power systems using hybrid energy storage technology. Renew. Energy 2009, 34, 815–826. [Google Scholar] [CrossRef]
  33. Energinet. ENERGI Data Service. 2025. Available online: https://www.energidataservice.dk/tso-electricity/ImbalancePrice (accessed on 15 September 2025).
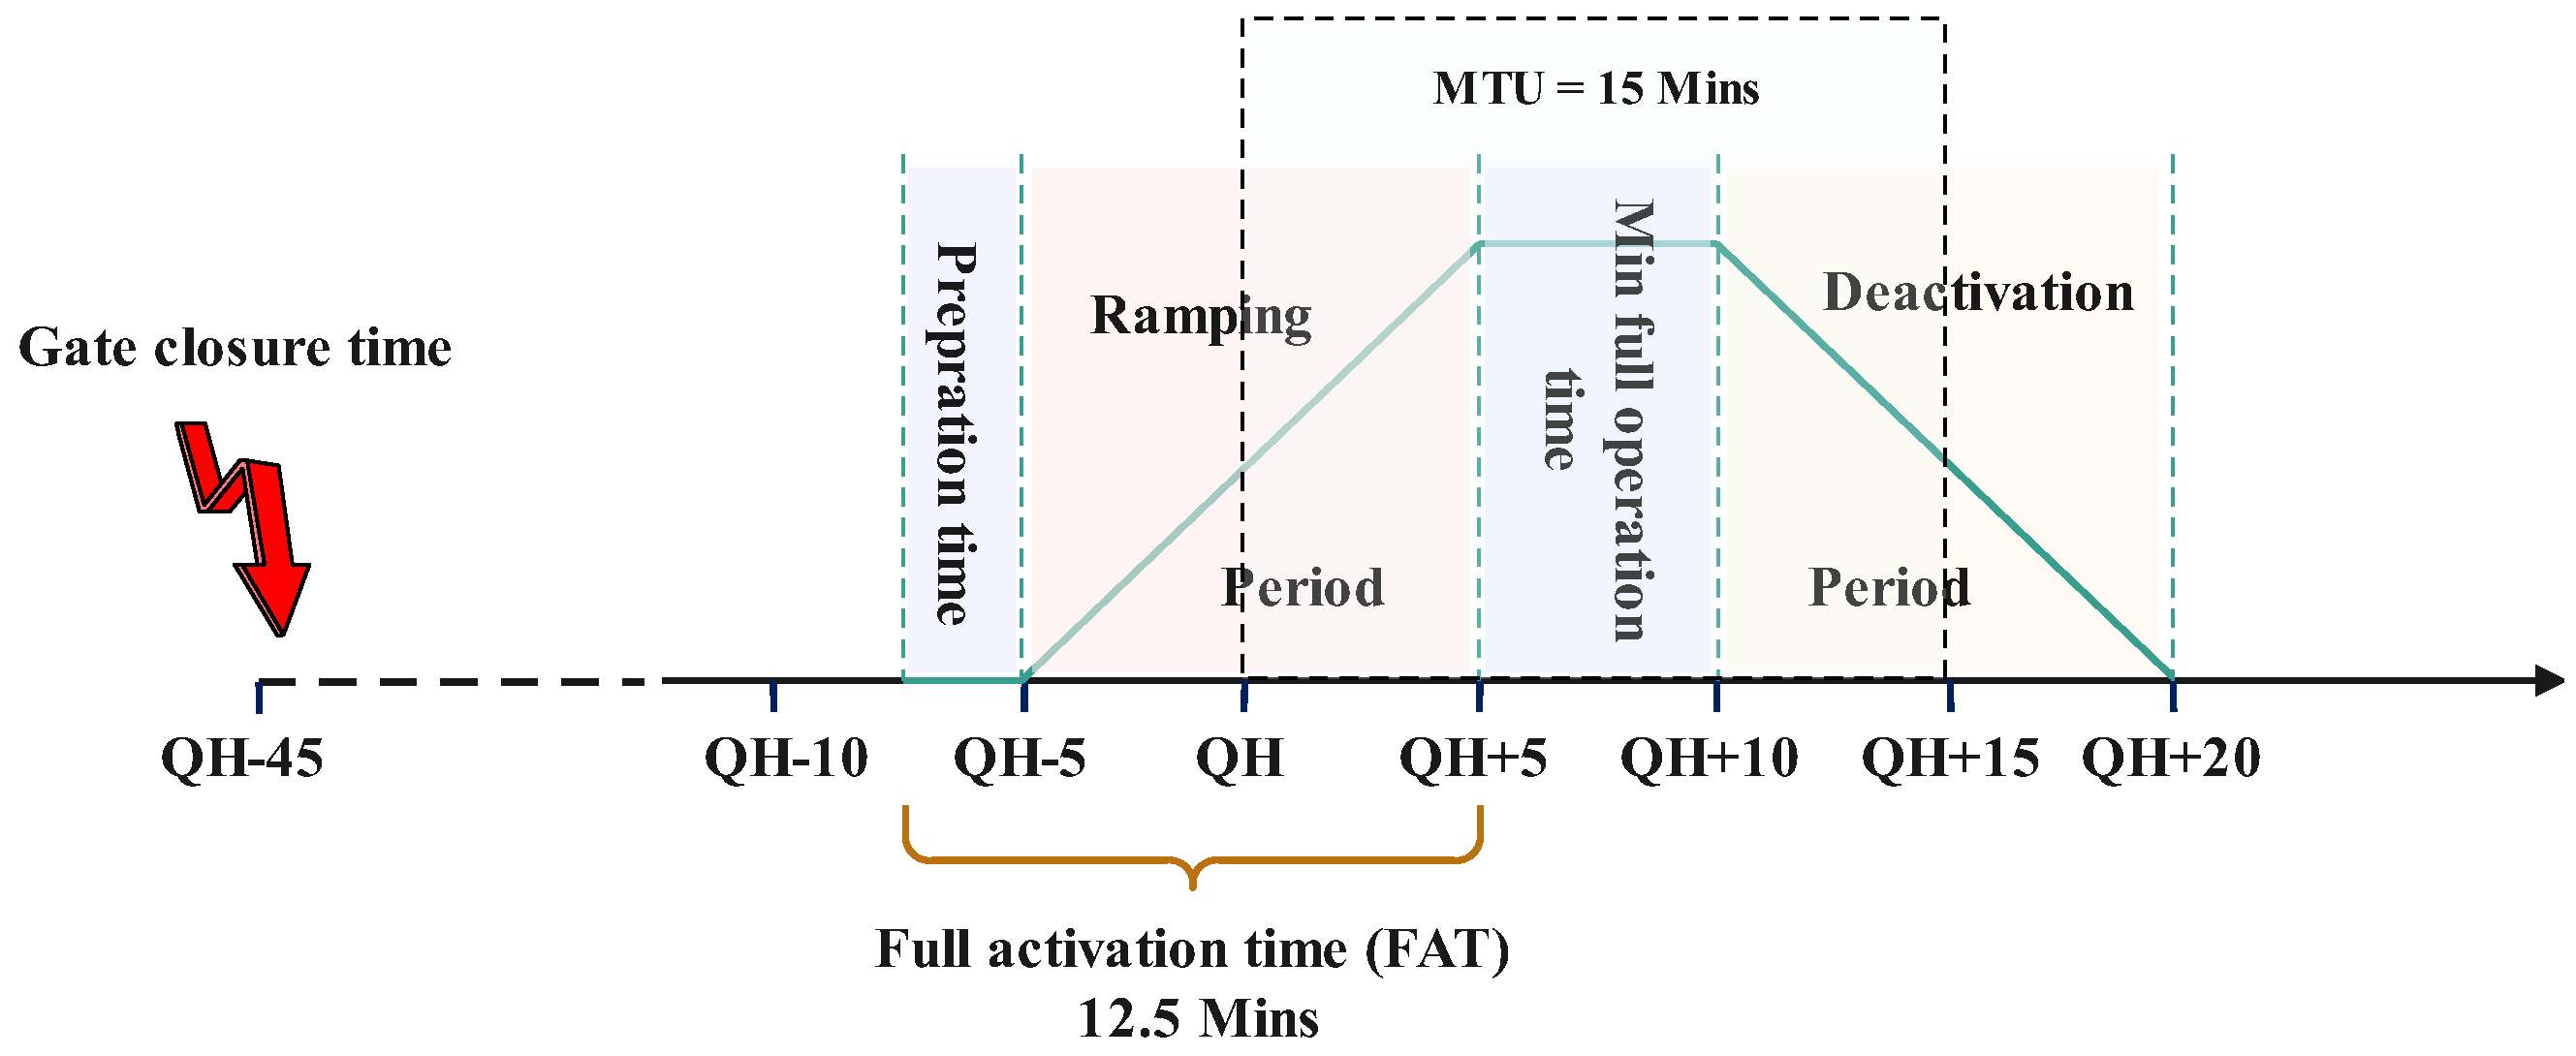
Figure 1. Market timeline in Nordic mFRR EAM for up-/down-regulation products.
Energies 18 05734 g001
Figure 2. Linearized function of the electrolyzer power consumption based on the regression analysis.
Energies 18 05734 g002
Figure 3. Schematic of the case study and its target energy markets.
Energies 18 05734 g003
Figure 4. Actual power production of the two WTs and the spot electricity price.
Energies 18 05734 g004
Figure 5. mFRR upward and downward needed demand and corresponding activation price [33].
Energies 18 05734 g005
Figure 6. Amount of upward and downward mFRR and their cumulative energy production.
Energies 18 05734 g006
Figure 7. Net weekly profit of the case system without participation in the mFRR market.
Energies 18 05734 g007
Figure 8. Net weekly profit of the case system with participation in mFRR market.
Energies 18 05734 g008
Figure 9. Sensitivity analysis of net weekly profit as a function of hydrogen price and PPA values without mFRR market participation.
Energies 18 05734 g009
Figure 10. Sensitivity analysis of net weekly profit as a function of hydrogen price and PPA values with mFRR market participation.
Energies 18 05734 g010
Figure 11. Actual power bought from WTs by the power-to-hydrogen unit with and without providing ancillary services.
Energies 18 05734 g011
Figure 12. Total weekly hydrogen production and net profit of the system under study.
Energies 18 05734 g012
Table 1. Technical characteristics of PtH facility.
ItemValue
Electrolyzer capacity6 MW
Electrolyzer ramping20% of capacity per second
Hydrogen tank size4 ton
Min level of hyrogen tank0.4 ton
Rated power of compressor1.5 MW
Mechanical efficiency0.75
Inlet pressure of compressor30 bar
Outlet pressure of compressor200 bar
Adiabatic efficient coefficient1.4
Table 2. Technical features of the alkaline electrolyzer used in this study [31].
ItemValue
Number of cell1900
Cell area0.37 m 2
Thermal neutral voltage1.473 v
Heat capacity62,500 J °C 1
Thermal resistance0.167 °C   W 1
Normal working temperature90 °C
Ohmic ressistive parameter τ 1 8.05 × 10 5 Ω   m 2
Ohmic ressistive parameter τ 2 2.5 × 10 7 Ω m 2
Overvoltage parameter α 1 −1.002 A 1 m 2 °C
Overvoltage parameter α 2 8.424 A 1 m 2 °C
Overvoltage parameter α 3 247.3 A 1 m 2 °C 2
Min permissible operating current1000 A
Max permissible operating current4500 A
Faraday constant96,485.3 sA mol
Table 3. The net profit of the facility (€) and the total hydrogen production (ton).
DayConnected to GridConnected to WTs
NumberWith EAMWithout EAMWith EAMWithout EAM
111,998.66278.0215,688.80845.14
212,667.241314.587334.3664.37
311,200.681158.096624.626.92
48274.57976.878529.67304.17
59634.941976.116326,62−53.75
610,578.062188.737347.04407.40
77987.55466.0610,024.50595.72
Total weekly profit72,341.728358.4961,875.652170.00
Total H 2 production16.085.0212.966.88
Disclaimer/Publisher’s Note: The statements, opinions and data contained in all publications are solely those of the individual author(s) and contributor(s) and not of MDPI and/or the editor(s). MDPI and/or the editor(s) disclaim responsibility for any injury to people or property resulting from any ideas, methods, instructions or products referred to in the content.