Abstract
Floating offshore wind turbines (FOWTs) face significant challenges in maintaining reliable power generation while mitigating structural loads, which are critical for reducing maintenance costs and extending service life. To address these issues, this study evaluates the effectiveness of a Soft Power Limitation Control (SPLC) strategy through numerical simulations in DNV Bladed. Two representative design load cases were considered, with design load case (DLC) 1.1 representing normal turbulence and DLC 2.3 representing an extreme operating gust. Under DLC 1.1, SPLC substantially reduced tower fatigue loads, lowering the damage equivalent loads (DELs) of side-to-side and fore–aft bending moments by 21 percent and 15.2 percent, respectively, while blade and mooring loads remained nearly unchanged. Platform motions exhibited modest improvements, including a 6.5 percent reduction in surge peak-to-peak, 2.2 percent in surge RMS, and 2.6 percent in pitch peak-to-peak. Under DLC 2.3, SPLC effectively alleviated extreme responses, decreasing the maximum tower side-to-side bending moment by 30.7 percent and the blade flap-wise bending moment by 15.6 percent, without adverse effects on six-degrees-of-freedom (6-DOFs) platform motions. Overall, the results confirm that SPLC enhances both fatigue and extreme load performance while maintaining stability, highlighting its potential as a practical and cost-effective control strategy to improve the reliability, durability, and commercial viability of FOWTs.
1. Introduction
Floating offshore wind turbines (FOWTs) have emerged as a practical solution for harnessing wind resources in deep-water regions where fixed-bottom foundations are infeasible. When water depths exceed approximately 60–80 m, conventional foundation types, such as monopile and jacket structures, encounter technical limitations in maintaining structural stability and constructability, while installation and fabrication costs increase sharply, rendering them economically unattractive [1,2,3]. Consequently, floating systems provide an effective alternative for extending offshore wind deployment into deeper waters. Despite these advantages, operating FOWTs under such conditions introduces significant technical challenges, particularly in maintaining reliable power generation while mitigating structural loads on platforms and support systems. To address these challenges, researchers have developed and applied advanced control strategies, which play a key role in ensuring the reliability and operational lifetime of floating wind systems.
Several studies have contributed to this field from diverse perspectives. Didier et al. [4] reviewed advanced control techniques applicable above the cut-out wind speed, highlighting strategies to balance performance improvements with load mitigation. Basbas et al. [5] classified FOWT models suitable for nonlinear control design, offering a foundation for controller development. Bashetty and Ozcelik [6] provided a comprehensive review of FOWT design, dynamics, and numerical modeling, and Salic [7] examined emerging trends and unresolved challenges in turbine control strategies. In addition, Kim et al. [8] developed a resonance-avoidance control algorithm to reduce fatigue loads on semi-submersible platforms, and Awada et al. [9] surveyed vibration control techniques for wind turbine towers.
Traditional approaches that shut down wind turbines at cut-out wind speed are effective for protecting equipment but they also cause abrupt peak loads and interrupt power generation which creates both mechanical and operational challenges. To overcome these limitations more recent methods focus on gradually reducing generator power and rotor speed above the cut-out threshold which enables turbines to continue operating while alleviating structural loads. These approaches have appeared in the literature under different terms including storm ride-through control gentle power limitation and soft cut-out but in this paper the concept is consistently defined as soft power limitation control (SPLC). Within this framework Jelavić et al. [10] discussed SPLC strategies extending beyond cut-out wind speed and emphasized their potential for enhancing turbine resilience under severe wind conditions and Bossanyi and King [11] demonstrated that SPLC improves wind farm output predictability by mitigating abrupt shutdown effects. Tibaldi and Hansen [12] analyzed SPLC from an aero-servo-elastic perspective showing that it significantly influences turbine structural responses under extreme wind loading and Garzón et al. [13] integrated forecast information into SPLC to improve adaptability to rapidly changing weather events. Singh et al. [14] further employed FAST and MATLAB-Simulink simulations to validate the dynamic behavior of wind turbine generators under SPLC scenarios which provided a technical foundation for model-based analyses. Subsequent investigations expanded this understanding with Petrović and Bottasso [15] showing that SPLC balances the competing objectives of load reduction and energy retention during extreme wind events and Markou and Larsen [16] confirming through HAWC2 simulations that linearly decreasing power and rotor speed from cut-out to 50 m/s effectively mitigates fatigue loads. Empirical evidence supports these findings with Castellani et al. [17] analyzing turbines applying SPLC and observing a trade-off between improved energy yield and increased component fatigue while Murcia Leon [18] demonstrated in an offshore wind farm context that SPLC facilitates smoother ramp-down events and enhances grid stability. Collectively these studies highlight SPLC as a promising strategy that enables continuous operation under high wind conditions while balancing the dual goals of structural load mitigation and reliable energy production.
Despite these advances, most SPLC research has focused on fixed-bottom turbines. Its application to floating systems—where platform motions, coupled dynamics, and control–structure interactions are more complex—remains insufficiently explored. In particular, the combined influence of SPLC on structural loads and platform response under extreme wind conditions has yet to be fully assessed.
This study addresses this gap by applying SPLC to a high-fidelity FOWT model and evaluating its performance under normal turbulence model (NTM) and extreme operating gust (EOG) conditions. The analysis investigates power production, structural loads, and platform motions through fully coupled aero–hydro–servo–elastic simulations. The remainder of this paper is organized as follows: Section 2 describes the wind turbine modelling; Section 3 presents the control algorithms, including the baseline controller and the Soft Power Limitation Control (SPLC); Section 4 introduces the fatigue estimation methodology; Section 5 outlines the environmental conditions; Section 6 presents the results; Section 7 discusses the findings; and Section 8 concludes with recommendations for future research.
2. Wind Turbine Modelling
This study employs the FOWT model developed under the Offshore Code Comparison Collaboration Continuation (OC4) project. The system comprises the DeepCwind semi-submersible platform integrated with the NREL 5 MW reference wind turbine, a standardized benchmark widely used across numerical simulation tools [19]. This configuration is provided as a built-in example project in DNV Bladed (v4.16.1), and the same setup was adopted in this study without structural modification. DNV Bladed offers an intuitive interface for setting up models and analyzing results, and while other tools such as OpenFAST and HAWC2 could also be applied, it was chosen here to ensure consistency with prior studies and to effectively evaluate the proposed control strategy.
Figure 1 illustrates the geometry of the modeled FOWT in DNV Bladed, along with the six degrees of freedom (6-DOFs) coordinate system. The platform adopts a pontoon-based semi-submersible design, and the mooring system anchoring the structure to the seabed is also depicted. The principal specifications, including turbine, platform, and mooring system parameters, are summarized in Table 1 and were used as input for numerical simulations.
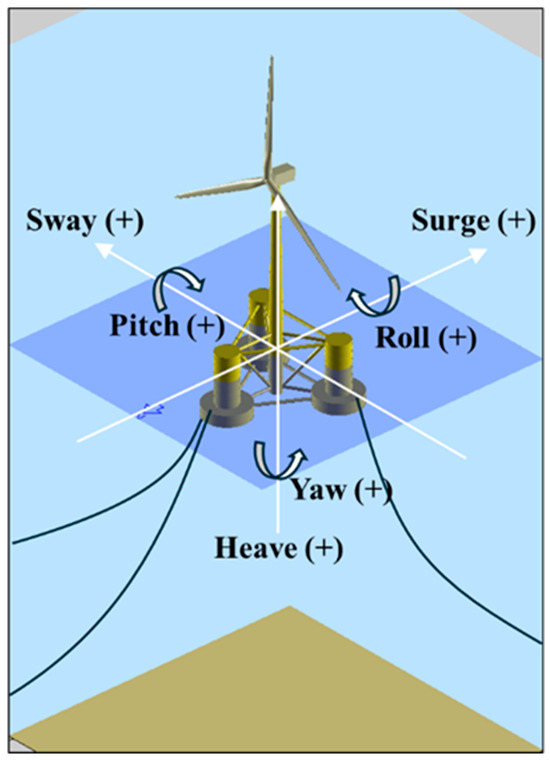
Figure 1.
Modeled geometry of the target FOWT in DNV Bladed.

Table 1.
Specifications of the target FOWT.
Table 1 summarizes the principal specifications of the turbine, platform, and mooring system, which were used as input for the numerical simulations. In this configuration, the hydrodynamic loads are modeled using WAMIT-derived frequency-domain coefficients included in the OC4 example project in DNV Bladed, applying the “Specify different model for each member” option that assigns WAMIT diffraction–radiation data to large-volume members and Morison-type viscous loading to slender members.
3. Control Algorithm
3.1. Control Modes by Operating Region
Wind turbines are classified into distinct operating regions according to wind speed, with each region applying tailored control strategies to maximize energy conversion efficiency while ensuring structural safety.
Figure 2 presents the division of operating regions with respect to wind speed, along with the control strategies applied in each region. Region 1, corresponding to wind speeds below the cut-in threshold, keeps the turbine in standby mode. Region 2, spanning from cut-in to rated wind speed, employs maximum power point tracking (MPPT) to capture the maximum available energy. Region 3, beginning at the rated wind speed, applies pitch control to maintain constant power output. Region 4, representing the high-wind regime beyond the cut-out speed, adopts a SPLC strategy to sustain continuous power generation while alleviating structural loads.
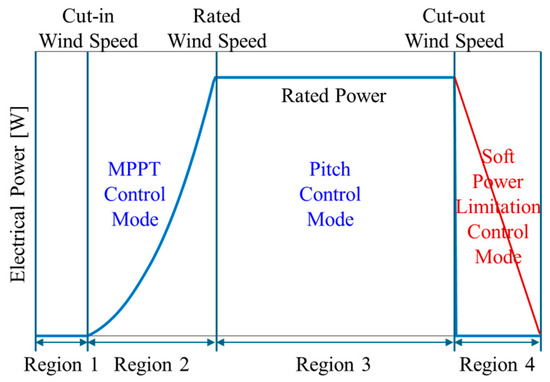
Figure 2.
Control modes by operating region.
3.2. Baseline Control Algorithms
The baseline control (BC) is employed in this study solely for comparison purposes to evaluate the effectiveness of the Soft Power Limitation Control (SPLC). It represents a conventional power regulation approach without any load mitigation capability, providing a reference case to quantify the improvement achieved by SPLC.
Figure 3 illustrates the overall control structure of the baseline control (BC) system used in this study. The control loop consists of three main components: a pitch controller, a torque controller, and a mode switch that determines which control loop is active according to the operating condition of the wind turbine.
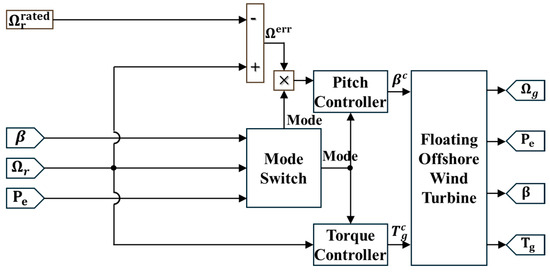
Figure 3.
Baseline control algorithm scheme.
The pitch control loop regulates the rotor speed by adjusting the blade pitch angle . The control action is based on the difference between the measured rotor speed and the reference rotor speed , as defined in Equation (1). The resulting error is processed through a PI controller to generate the pitch command , which includes both the rate limiter and saturation functions to maintain the pitch motion within the actuator’s physical constraints, as expressed in Equation (2). Specifically, the pitch rate is limited to , and the pitch angle is restricted within and .
where and are the proportional and integral gains of the pitch control loop, respectively.
The generator torque control is implemented as a function of the rotor speed to ensure an efficient transition from power optimization to power limitation. In the sub-rated region, the generator torque follows a quadratic law proportional to the rotor speed squared to achieve the MPPT. As the rotor speed approaches the reference value , corresponding to the rated operating condition, a PI controller adjusts the torque to maintain stable rotor speed regulation. Beyond the rated point, the generator torque is fixed at its rated value to prevent overspeed and mechanical overloading. The overall torque control law is summarized in Equation (3).
where denotes the generator torque command, and is the MPPT constant derived from the aerodynamic characteristics of the turbine. and are the proportional and integral gains of the torque controller, respectively.
The mode-switch logic employs an SR flip-flop to determine whether the turbine operates in the sub-rated or above-rated region. The Set input is activated when either the measured generator speed or the generated power reaches its rated value, while the Reset input is triggered when the measured pitch angle exceeds the fine-pitch threshold. The resulting output signal, denoted as , maintains the current operating state until a new switching condition occurs, thereby ensuring a stable transition between torque and pitch control. The switching relationship is summarized by Equation (4).
where represents the previously retained mode value that remains unchanged when neither switching condition is satisfied. denotes the fine-pitch angle corresponding to the blade pitch angle that yields the maximum power coefficient in the sub-rated region. indicates the measured generator power, and represents the rated generator power corresponding to the turbine’s nominal output condition.
3.3. SPLC Algorithm
The aerodynamic power of a wind turbine is defined by Equation (5).
where is air density, the rotor radius, the wind speed, and the power coefficient, which depends on the TSR () and the blade pitch angle (). Equation (5) represents the theoretical upper limit of recoverable wind energy, highlighting the power coefficient as the governing performance parameter.
The TSR is defined in Equation (6).
where denotes the rotor speed. As the pitch angle increases, the aerodynamic efficiency of the rotor decreases, leading to a reduction in rotor speed. This reduction in rotor speed lowers the TSR, which in turn results in a further decrease in the power coefficient.
Figure 4 illustrates the variation in the power coefficient with TSR and pitch angle. In general, both the maximum power coefficient and the optimal TSR decrease as the pitch angle increases. This trend underpins the principle of SPLC gradual pitch adjustments intentionally reduce aerodynamic efficiency. By relying on the dependence of power coefficient on TSR and pitch angle, SPLC suppresses excessive power escalation and mitigates structural loads under high wind conditions.
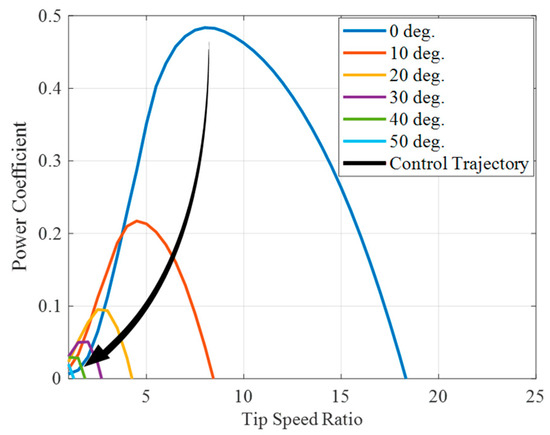
Figure 4.
Power coefficient curve.
The reference rotor speed is defined as Equation (7).
where is the wind speed at which the soft power limitation begins, and is the cut-out wind speed at which the rotor is fully stopped. In this study, soft power limitation begins at 25 m/s, the cut-out is set at approximately 35 m/s, and the rated rotor speed is defined as 12.1 RPM.
Figure 5 illustrates the variation in the reference rotor speed with wind speed according to Equation (7). Once the wind speed exceeds , the reference rotor speed decreases linearly until it reaches zero at .
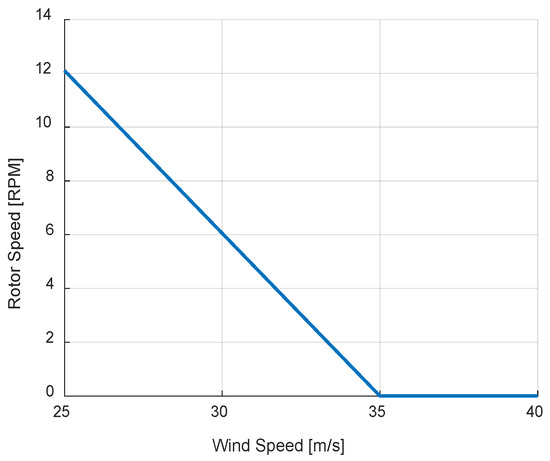
Figure 5.
Soft power limitation schedule.
Figure 6 illustrates the SPLC logic. The SPLC schedule generates a reference rotor speed, which is determined as a function of wind speed. The reference is compared with the measured rotor speed to obtain the rotor speed error. This error is then used to drive the pitch and torque controllers, which are selected through a mode switch, producing the pitch command and generator torque command . Through this process, the SPLC gradually reduces aerodynamic efficiency, ensuring a progressive reduction in power output as wind speed increases.
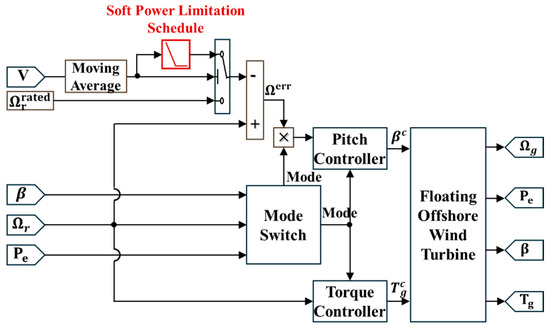
Figure 6.
Soft power limitation control algorithm scheme.
4. Fatigue Estimation Methodology
In this study, the fatigue loads of major structural components are evaluated in the time domain to examine the effectiveness of the SPLC strategy in mitigating fatigue. The analysis procedure consists of two stages, in which the load cycles are first extracted from the simulated load responses using the rainflow-counting algorithm defined in IEC 61400-13 [20], and the corresponding fatigue loads are then represented in terms of the damage equivalent load (DEL).
The rainflow-counting algorithm decomposes each load history into discrete stress ranges and their corresponding cycle counts. The relationship between the stress amplitude and the fatigue life is characterized by the S–N curve, as given in Equation (8).
where is the number of cycles to failure at a given stress range , is the material exponent, and is a material constant derived from fatigue test data.
To represent variable-amplitude loading conditions by an equivalent constant-amplitude load, the DEL is calculated using Equation (9).
where represents the equivalent number of cycles corresponding to the analyzed period, and the exponent is adopted for composite blades, while is used for the tower.
5. Environmental Conditions
The NTM and EOG conditions applied in this study are defined in accordance with the IEC 61400-3-1 [21]. The NTM represents stochastic wind inflow with turbulence characteristics typical of offshore environments, while the EOG corresponds to a short-duration, high-intensity gust superimposed on the mean wind speed, which is used to evaluate extreme aerodynamic loads on the turbine. The parameters and formulations of these conditions are applied following the guidelines in the IEC standards, ensuring compliance with international offshore wind turbine design practices.
Under the NTM, wind speed turbulence was modeled using the Kaimal spectrum [22], which represents the frequency-dependent spectral density of longitudinal wind speed fluctuations. The Kaimal spectrum is expressed as Equation (10).
where is the spectral density of the longitudinal wind speed component, is the frequency, is the standard deviation of the wind speed, is the turbulence length scale, and is the mean wind speed. The turbulent wind time series were generated through linear superposition of Fourier components sampled from this spectrum.
Irregular waves were generated based on the JONSWAP spectrum [23], which characterizes the energy distribution of wind-driven waves. The spectral density is defined as Equation (11).
where is the wave angular frequency, is the significant wave height, is the peak spectral period, , is the JONSWAP peakedness parameter, for and for , and the Phillips constant is defined as Equation (12).
The wind environment employed in this study was selected to evaluate the SPLC strategy, with the mean wind speed set near the cut-out wind speed, and the turbulence intensity under NTM conditions defined according to the class IB wind turbine specifications. Ocean environmental data were obtained from the comprehensive metocean database compiled by Stewart et al. [24], which includes measurements from multiple sites along the U.S. coast. For the present study, data representing the East Coast region were used to provide realistic conditions for the numerical simulations.
Table 2 summarizes the environmental parameters used in DLC 1.1 and DLC 2.3. The DLC 1.1 case represented the Normal Turbulence Model (NTM) condition, with a mean wind speed of 23 m/s, a turbulence intensity of 14.6%, and a Kaimal spectrum. DLC 2.3 corresponded to the Extreme Operating Gust (EOG) condition, defined by a base wind speed of 25 m/s and an additional gust amplitude of 8.04 m/s, resulting in a peak gust of approximately 33 m/s sustained over 10.5 s, as specified in IEC 61400-1 [25].
Table 2.
Summary of environmental parameters for DLC 1.1 and DLC 2.3.
In both cases, waves were modeled using a JONSWAP spectrum. The significant wave height and peak period were 4.27 m and 9.22 s for DLC 1.1, and 4.92 m and 9.95 s for DLC 2.3, respectively, with peak enhancement factors of 1.86 and 1.81. A steady current aligned with the wave direction was applied (0.30 m/s for DLC 1.1 and 0.33 m/s for DLC 2.3), while the water level was fixed at mean sea level (MSL). The simulation time was set to 3600 s for the NTM case to evaluate fatigue-related coupled aerodynamic–hydrodynamic loads, and 60 s for the EOG case to assess transient turbine responses under severe gusts and to examine the performance of the SPLC strategy in improving operational stability.
Figure 7 illustrates the time-series inputs of wind speed, sea surface elevation, and current velocity that were applied in the simulations. These inputs were generated based on the parameters summarized in Table 2 and used to define the external environmental conditions for DLC 1.1 and 2.3. The figure provides a visual representation of the stochastic turbulent environment for the NTM case and the transient gust event for the EOG case, which were employed to evaluate the controller performance under different operating scenarios.
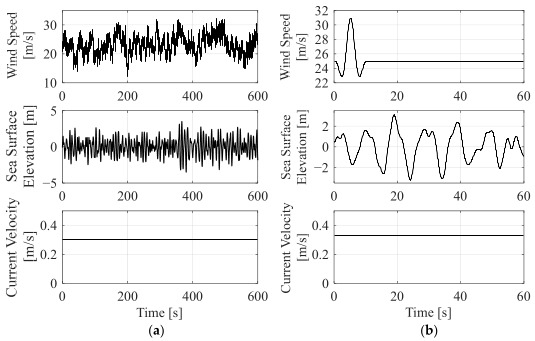
Figure 7.
Time histories of environmental inputs under (a) the NTM and (b) the EOG conditions.
6. Results
6.1. NTM Condition
Although the simulations were performed for 3600 s, only the first 600 s are presented in Figure 8, Figure 9 and Figure 10 for clarity. Figure 8 presents the time histories of performance variables under the NTM condition. In BC, generator torque and electrical power remain at their rated levels even when the wind speed exceeds 25 m/s. In contrast, SPLC responds with larger pitch angles than BC whenever the wind speed exceeds 25 m/s, which lowers the rotor speed and leads to intervals where generator torque and electrical power decrease.
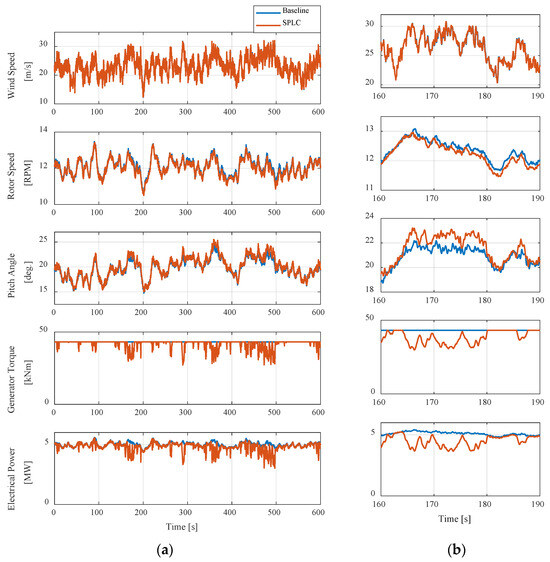
Figure 8.
Time histories of operational responses under the NTM condition for BC and SPLC. (a) Range 0–600 s; (b) Zoom 160–190 s.
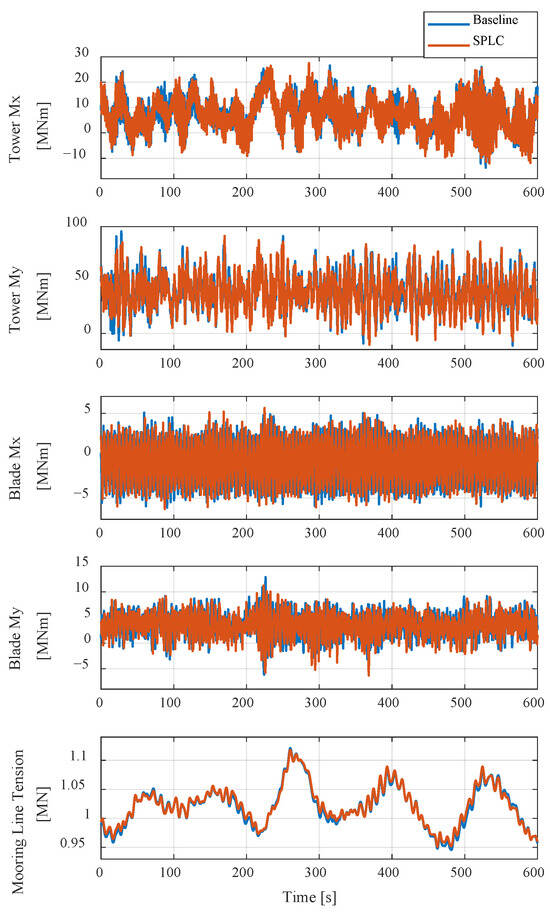
Figure 9.
Time histories of structural loads and mooring line tension under the NTM condition for BC and SPLC.
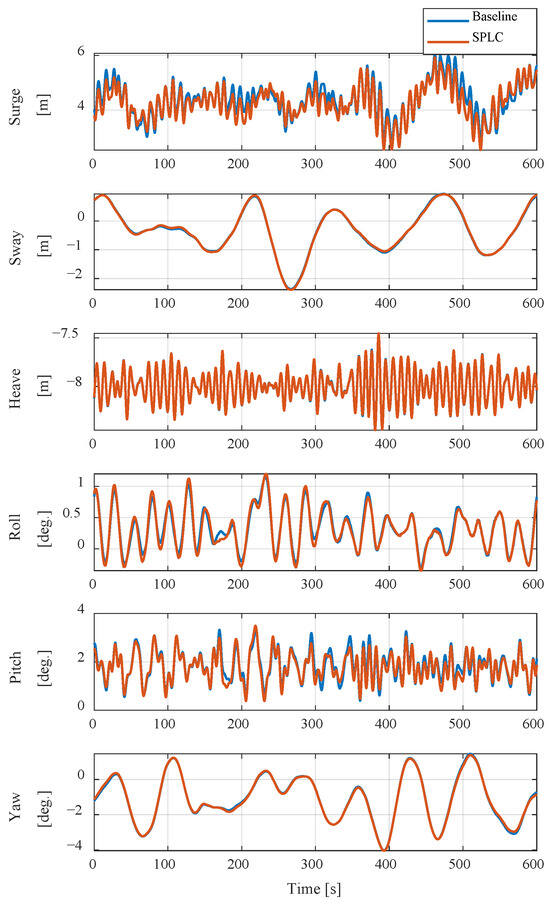
Figure 10.
Time histories of platform motions under the NTM condition for BC and SPLC.
Table 3 summarizes the key performance parameters under the NTM condition. With SPLC, the peak pitch angle increases by 4.9%, while the maximum rotor speed shows no difference between the two cases. The maximum electrical power is also unchanged at 5.7 MW, whereas the mean decreases by about 4.0%. Overall, SPLC increases the pitch angle and reduces mean electrical power.
Table 3.
Variation in key performance variables under the NTM condition.
Figure 9 presents the time histories of structural loads under the NTM condition for both the BC and SPLC cases. Side-to-side bending moment (Tower Mx) and fore–aft bending moment (Tower My) exhibit smaller oscillation amplitudes with SPLC during certain intervals, while other load responses remain similar between the two cases. The mooring line tension also remains similar, showing no clear differences throughout the simulation.
Table 4 summarizes the structural load responses under the NTM condition. For tower loads, SPLC reduces fatigue-related responses substantially, with DEL values of Tower Mx and Tower My decreasing by 21.0% and 15.2%, respectively. Although their maximum loads increase slightly by 8.6% and 6.5%, the standard deviations remain nearly unchanged. For blade loads, the differences are small. Blade Mx DEL increases by 0.9% with a 4.3% rise in standard deviation, and Blade My DEL increases by 2.1% with a 4.8% rise in standard deviation. The maximum mooring line tension remains identical in both cases. Overall, SPLC is particularly effective in reducing tower fatigue loads while having limited influence on blade and mooring loads.
Table 4.
Variation in structural load and mooring line response variables under the NTM condition.
Figure 10 presents the time histories of platform motions under the NTM condition for both the BC and SPLC cases. Surge motion shows smaller variations with SPLC compared to BC, and pitch motion also exhibits reduced fluctuations. In contrast, sway, heave, roll, and yaw responses remain similar between the two cases, with no noticeable differences.
Table 5 summarizes the platform motion responses under the NTM condition. Surge motion decreases with SPLC, with reductions of 6.5% in the peak-to-peak value and 2.2% in the RMS value. Pitch motion also decreases slightly, with a 2.6% reduction in the peak-to-peak angle. In contrast, sway motion exhibits a slight 2.9% increase in the peak-to-peak value, with no change in the RMS. Heave, roll, and yaw motions show no differences between the two cases. Overall, SPLC introduces only limited changes in global platform motions, yielding modest improvements in surge and pitch while leaving other responses unaffected.
Table 5.
Variation in platform motion response variables under the NTM condition.
6.2. EOG Condition
Figure 11 presents the time histories of performance variables under the EOG condition for both the BC and SPLC cases. With SPLC, the pitch angle increases sharply once the wind speed exceeds 25 m/s, reaching a higher peak than in BC. As a result, the rotor speed remains lower, showing a smaller peak before stabilizing. Generator torque and electrical power also decline progressively beyond 25 m/s and reach zero at the time of grid loss, whereas in BC they stay at rated levels until the grid fault and then drop abruptly to zero.
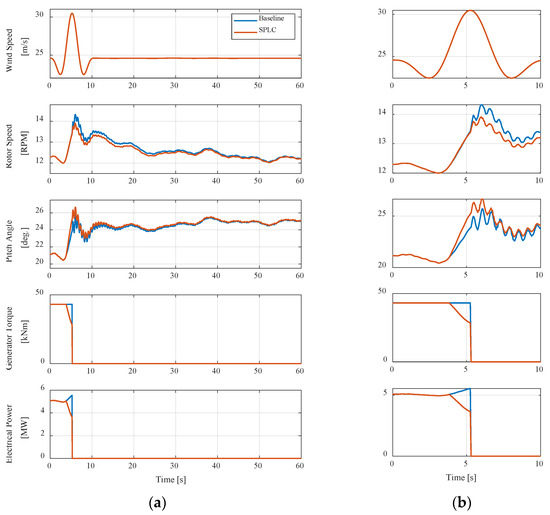
Figure 11.
Time histories of operational responses under the EOG condition for BC and SPLC. (a) Range 0–60 s; (b) Zoom 0–10 s.
Table 6 summarizes the key performance parameters under the EOG condition. With SPLC, the peak pitch angle increases by 3.9%, while the maximum rotor speed decreases by 2.8%. Immediately after grid loss, the maximum electrical power decreases by 32.7%. Overall, SPLC increases the pitch angle, which in turn reduces rotor speed and electrical power.
Table 6.
Variation in key performance variables under the EOG condition.
Figure 12 presents the time histories of structural loads under the EOG condition for both the BC and SPLC cases. Tower Mx shows a pronounced peak after the gust in BC, whereas SPLC exhibits a noticeably lower peak and smoother variations throughout the transient period. This attenuation in fluctuation amplitude implies that SPLC effectively mitigates cyclic loading on the tower base, which is expected to alleviate fatigue damage under gust conditions. In contrast, Tower My responses are nearly identical in both cases, showing no noticeable differences. For blade loads, Blade Mx peaks higher in BC than in SPLC, whereas Blade My remains almost unchanged. Mooring line tension appears similar in both cases, with only minor deviations.
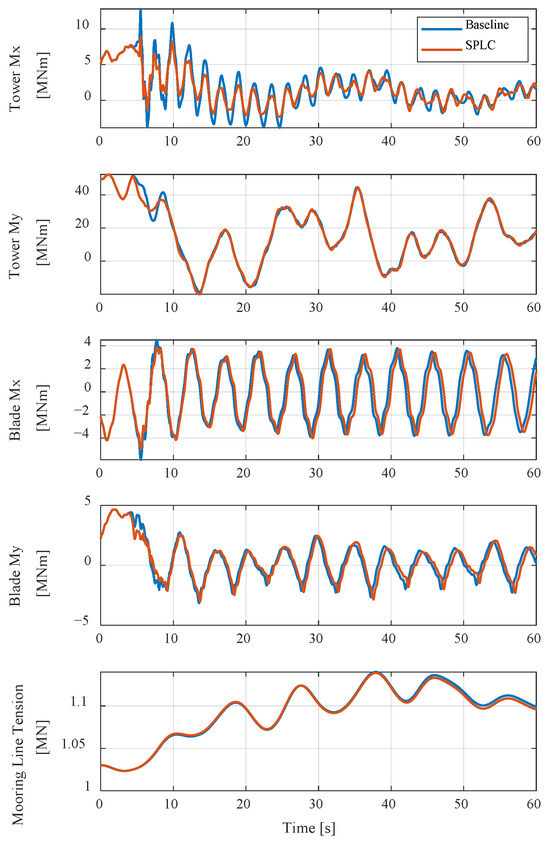
Figure 12.
Time histories of structural loads and mooring line tension under the EOG condition for BC and SPLC.
Table 7 summarizes the variations in structural loads and mooring line responses under the EOG condition. Tower Mx decreases markedly, with reductions of 30.7% in the maximum, 18.2% in the standard deviation, and 33.7% in the DEL, indicating that SPLC effectively mitigates both instantaneous and fatigue-related bending moments at the tower base. Tower My exhibits negligible variations, with differences below 1% across all metrics. For the blades, Blade Mx shows a 15.6% reduction in the maximum and a 7.0% decrease in the DEL, while its standard deviation remains unchanged. Blade My remains constant in the maximum but exhibits small decreases of 7.1% in the standard deviation and 1.4% in the DEL. The maximum mooring line tension is identical in both cases, confirming that SPLC does not significantly influence the global platform motions.
Table 7.
Variation in structural load and mooring line response variables under the EOG condition.
Figure 13 presents the time histories of platform motions under the EOG condition for both the BC and SPLC cases. Surge, sway, and heave responses remain similar in the two cases, with no noticeable differences. Roll motion also shows little variation. In contrast, pitch and yaw responses exhibit visible deviations, with BC showing slightly higher values in certain intervals.
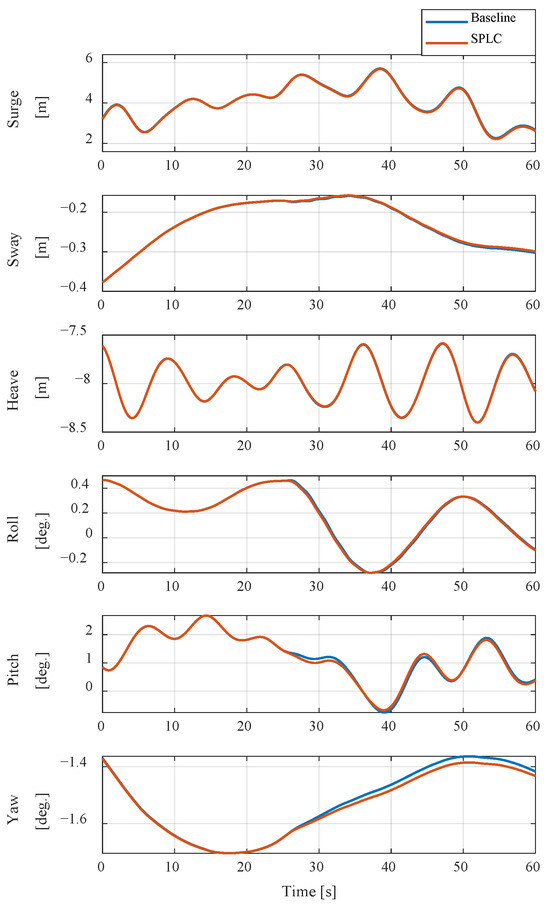
Figure 13.
Time histories of platform motions under the EOG condition for BC and SPLC.
Table 8 summarizes the platform motion responses under the EOG condition. Surge motion shows a slight 2.9% increase in the peak-to-peak value with SPLC, while the RMS remains unchanged. All other motions, including sway, heave, roll, pitch, and yaw, exhibit no significant differences between BC and SPLC. Overall, SPLC produces negligible changes in global platform responses under the EOG condition.
Table 8.
Variation in platform motion response variables under the EOG condition.
7. Discussion
The results of this study demonstrated that the Soft Power Limitation Control (SPLC) strategy effectively improved the load behavior of the floating offshore wind turbine in the Region 4 operating region, corresponding to high-wind conditions beyond the terminal wind speed. In this region, the baseline controller maintained rated power through pitch regulation. Although this approach was effective in stabilizing power output, it was limited in mitigating structural loads. As wind speed increased, variations in thrust induced by pitch adjustments became more pronounced, leading to cyclic loading on the tower and blades and accelerating fatigue accumulation. The SPLC addressed these limitations by applying a control scheme that gradually reduced power output once the terminal wind speed was exceeded. According to the predefined SPLC schedule, the blade pitch angle increased progressively with wind speed, resulting in a gradual reduction in both the power coefficient and thrust coefficient. This reduction in aerodynamic efficiency alleviated the aerodynamic thrust acting on the rotor, thereby decreasing load fluctuations and mitigating cyclic stresses on structural components. Through this mechanism, the SPLC reduced fatigue loads without significant loss of power generation and maintained stable dynamic responses of the overall system.
Under gust conditions, the SPLC also exhibited more stable control behavior than the baseline controller. Because the output reduction followed the predefined SPLC schedule, the aerodynamic thrust did not change abruptly, preventing excessive transient loads during gust inflow. This characteristic effectively mitigated both extreme and short-term fatigue loads. Overall, the SPLC can be characterized as a control approach that achieves a balance between power regulation and load alleviation. By gradually reducing power through progressive pitch adjustments in high-wind conditions, the SPLC improved both efficiency and structural stability compared with the baseline controller, demonstrating its potential as a practical and effective strategy for enhancing the operational reliability and extending the service life of floating offshore wind turbines.
8. Conclusions
This study investigated the effectiveness of the SPLC strategy for FOWTs through simulations in DNV Bladed. Under NTM, SPLC reduced tower fatigue loads by 21.0% and 15.2% in side-to-side and fore–aft bending moments, while slightly alleviating surge motion without compromising stability. Under EOG, SPLC reduced the maximum tower side-to-side bending moment by 30.7% and the blade flap-wise bending moment by 15.6%, while maintaining stable platform dynamics. These results demonstrate that SPLC simultaneously mitigates fatigue loads and alleviates extreme structural responses.
Beyond these quantitative improvements, SPLC offers practical value by providing effective load reduction with simpler implementation than conventional control strategies. This dual benefit—extending structural lifetime and enhancing operational safety—has direct implications for reducing maintenance costs and improving the reliability of commercial FOWTs. Nevertheless, further validation across additional design load cases, fault conditions, and experimental testing is required. Ultimately, SPLC stands out as a promising control solution that can contribute to more durable and economically viable offshore wind energy systems.
Author Contributions
Conceptualization, K.K.; methodology, K.K.; software, K.K.; validation, H.-G.K., J.-H.L. and J.S.; investigation, H.-G.K.; data curation, J.S.; writing—original draft preparation, K.K.; writing—review and editing, H.-G.K., J.-H.L., and J.S.; visualization, J.-H.L.; supervision, K.K.; project administration, K.K. All authors have read and agreed to the published version of the manuscript.
Funding
The research presented in this study was supported by the KAIA Research program on the Development of Marine Bridges Operation using Green Energy, funded by the Ministry of Land, Infrastructure and Transport [Grant number: RS-2024-00401101].
Data Availability Statement
Data are contained within the article.
Conflicts of Interest
The authors declare no conflicts of interest.
Abbreviations
The following abbreviations are used in this manuscript:
| BC | Baseline Control |
| COD | Co-Directional |
| DEL | Damage Equivalent Load |
| DLC | Design Load Case |
| DOF | Degree of Freedom |
| EOG | Extreme Operating Gusts |
| FOWT | Floating Offshore Wind Turbine |
| MPPT | Maximum Power Point Tracking |
| MSL | Mean Sea Level |
| NCM | Normal Current Model |
| NSS | Normal Sea State |
| NTM | Normal Turbulence Model |
| RMS | Root Mean Square |
| SPLC | Soft Power Limitation Control |
| Std. Dev. | Standard Deviation |
| SWL | Still Water Level |
| UNI | Uni-Directional |
References
- Butterfield, S.; Musial, W.; Jonkman, J.; Sclavounos, P. Engineering Challenges for Floating Offshore Wind Turbines; National Renewable Energy Laboratory (NREL): Golden, CO, USA, 2007.
- Jonkman, J.M.; Matha, D. Dynamics of offshore floating wind turbines—Analysis of three concepts. Wind Energy 2011, 14, 557–569. [Google Scholar] [CrossRef]
- Myhr, A.; Bjerkseter, C.; Ågotnes, A.; Nygaard, T.A. Levelised cost of energy for offshore floating wind turbines in a life cycle perspective. Renew. Energy 2014, 66, 714–728. [Google Scholar] [CrossRef]
- Didier, F.; Liu, Y.-C.; Laghrouche, S.; Depernet, D. A Comprehensive Review on Advanced Control Methods for Floating Offshore Wind Turbine Systems above the Rated Wind Speed. Energies 2024, 17, 2257. [Google Scholar] [CrossRef]
- Basbas, H.; Liu, Y.-C.; Laghrouche, S.; Hilairet, M.; Plestan, F. Review on Floating Offshore Wind Turbine Models for Nonlinear Control Design. Energies 2022, 15, 5477. [Google Scholar] [CrossRef]
- Bashetty, S.; Ozcelik, S. Review on Dynamics of Offshore Floating Wind Turbine Platforms. Energies 2021, 14, 6026. [Google Scholar] [CrossRef]
- Salic, T.; Charpentier, J.F.; Benbouzid, M.; Le Boulluec, M. Control Strategies for Floating Offshore Wind Turbine: Challenges and Trends. Electronics 2019, 8, 1185. [Google Scholar] [CrossRef]
- Kim, K.; Kim, H.; Kim, H.; Son, J.; Kim, J.; Park, J. Resonance Avoidance Control Algorithm for Semi-Submersible Floating Offshore Wind Turbine. Energies 2021, 14, 4138. [Google Scholar] [CrossRef]
- Awada, A.; Younes, R.; Ilinca, A. Review of Vibration Control Methods for Wind Turbines. Energies 2021, 14, 3058. [Google Scholar] [CrossRef]
- Jelavić, M.; Petrović, V.; Barišić, M.; Ivanović, I. Wind Turbine Control beyond the Cut-Out Wind Speed. In Proceedings of the European Wind Energy Conference (EWEC 2013), Vienna, Austria, 4–7 February 2013. [Google Scholar]
- Bossanyi, E.; King, J. Improving Wind Farm Output Predictability by Means of a Soft Cut-Out Strategy. In Proceedings of the European Wind Energy Conference and Exhibition (EWEA 2012), Copenhagen, Denmark, 16–19 April 2012. [Google Scholar]
- Tibaldi, C.; Hansen, M.H. Aeroservoelastic Analysis of Storm Ride-Through Control Strategies for Wind Turbines. In Proceedings of the 34th Wind Energy Symposium, AIAA SciTech Forum, San Diego, CA, USA, 4–8 January 2016. [Google Scholar] [CrossRef][Green Version]
- Garzón, B.B.; Petrović, V.; van Wingerden, J.W.; Amon, E. Using Forecast Information for Storm Ride-Through Control. In Proceedings of the European Wind Energy Conference (EWEC 2013), Vienna, Austria, 4–7 February 2013. [Google Scholar]
- Singh, M.; Muljadi, E.; Jonkman, J.; Gevorgian, V.; Girsang, I.; Dhupia, J. Simulation for Wind Turbine Generators—With FAST and MATLAB-Simulink Modules; Technical Report NREL/TP-5D00-59195; National Renewable Energy Laboratory (NREL): Golden, CO, USA, 2014. [CrossRef]
- Petrović, V.; Bottasso, C.L. Wind turbine optimal control during storms. J. Phys. Conf. Ser. 2014, 524, 012052. [Google Scholar] [CrossRef]
- Markou, H.; Larsen, T.J. Control Strategies for Operation of Pitch Regulated Turbines above Cut-Out Wind Speeds. In Proceedings of the European Wind Energy Conference and Exhibition (EWEC 2009), Marseille, France, 16–19 March 2009. [Google Scholar]
- Castellani, F.; Natili, F.; Astolfi, D.; Cianetti, F. Mechanical Behaviour of Wind Turbines Operating above Design Conditions. Procedia Struct. Integr. 2019, 24, 495–509. [Google Scholar] [CrossRef]
- Murcia Leon, J.P.; Koivisto, M.J.; Sørensen, P.; Magnant, P. Power Fluctuations in High-Installation-Density Offshore Wind Fleets. Wind Energy Sci. 2021, 6, 461–476. [Google Scholar] [CrossRef]
- Robertson, A.; Jonkman, J.; Masciola, M.; Song, H.; Goupee, A.; Coulling, A.; Luan, C. Definition of the Semisubmersible Floating System for Phase II of OC4; National Renewable Energy Laboratory: Golden, CO, USA, 2014.
- IEC 61400-13; Wind Turbines—Part 13: Measurement of Mechanical Loads. International Electrotechnical Commission (IEC): Geneva, Switzerland, 2015.
- IEC 61400-3-1: 2019; Wind Energy Generation Systems—Part 3-1: General Requirements. IEC: Geneva, Switzerland, 2019.
- Kaimal, J.C.; Wyngaard, J.C.; Izumi, Y.; Coté, O.R. Spectral characteristics of surface-layer turbulence. Q. J. R. Meteorol. Soc. 1972, 98, 563–589. [Google Scholar] [CrossRef]
- Hasselmann, K.; Barnett, T.P.; Bouws, E.; Carlson, H.; Cartwright, D.E.; Enke, K.; Ewing, J.A.; Gienapp, H.; Hasselmann, S.; Kruseman, P.; et al. Measurements of wind-wave growth and swell decay during the Joint North Sea Wave Project (JONSWAP). Ergaenzungsheft zur Deutschen Hydrographischen Zeitschrift, Reihe A. 1973, 25, 1–95. [Google Scholar]
- Stewart, G.M.; Robertson, A.; Jonkman, J.; Lackner, M.A. The creation of a comprehensive metocean data set for offshore wind turbine simulations. Wind Energy 2016, 19, 1151–1159. [Google Scholar] [CrossRef]
- IEC 61400-1; Wind Turbines—Part 1: Design Requirements. International Electrotechnical Commission: Geneva, Switzerland, 2005.


Disclaimer/Publisher’s Note: The statements, opinions and data contained in all publications are solely those of the individual author(s) and contributor(s) and not of MDPI and/or the editor(s). MDPI and/or the editor(s) disclaim responsibility for any injury to people or property resulting from any ideas, methods, instructions or products referred to in the content. |
© 2025 by the authors. Licensee MDPI, Basel, Switzerland. This article is an open access article distributed under the terms and conditions of the Creative Commons Attribution (CC BY) license (https://creativecommons.org/licenses/by/4.0/).