Abstract
With increasing energy demand and advancing carbon neutrality goals, arid regions—key areas for centralized photovoltaic (PV) station development in China—urgently require efficient and accurate remote sensing techniques to support spatial distribution monitoring and ecological impact assessment. Although numerous studies have focused on PV station extraction, challenges remain in arid regions with complex surface features to develop extraction frameworks that balance efficiency and accuracy at a regional scale. This study focuses on the Inner Mongolia Yellow River Basin and develops a PV extraction framework on the Google Earth Engine platform by integrating spectral bands, spectral indices, and topographic features, systematically comparing the classification performance of support vector machine, classification and regression tree, and random forest (RF) classifiers. The results show that the RF classifier achieved a high Kappa coefficient (0.94) and F1 score (0.96 for PV areas) in PV extraction. Feature importance analysis revealed that the Normalized Difference Tillage Index, near-infrared band, and Land Surface Water Index made significant contributions to PV classification, accounting for 10.517%, 6.816%, and 6.625%, respectively. PV stations are mainly concentrated in the northern and southwestern parts of the study area, characterized by flat terrain and low vegetation cover, exhibiting a spatial pattern of “overall dispersion with local clustering”. Landscape pattern indices further reveal significant differences in patch size, patch density, and aggregation level of PV stations across different regions. This study employs Sentinel-2 imagery for regional-scale PV station extraction, providing scientific support for energy planning, land use optimization, and ecological management in the study area, with potential for application in other global arid regions.
1. Introduction
In the context of global energy transition and carbon neutrality strategies, solar photovoltaics (PV) are becoming a key pathway to providing low-carbon, clean, and renewable energy. If carbon emissions remain at current levels, the carbon budget for global warming of 2 °C [] is projected by bp Energy Outlook 2024 to be exhausted by the early 2040s [], highlighting the urgent need for energy restructuring. By the end of 2023, global renewable energy capacity had reached 3.87 billion kilowatts, with solar PV generation taking a dominant share []. As the world’s largest PV market, China is accelerating the deployment of centralized PV stations, particularly in the arid and semi-arid regions of Northwest China, where solar irradiance and land availability are abundant. These developments go beyond energy supply—they are closely tied to land use optimization and ecosystem recovery. Therefore, efficient and accurate extraction of PV station distribution is critical for regional energy planning and land management.
Advances in remote sensing technology have provided multi-scale data support for PV station identification. Medium- and low-resolution satellite imagery, such as the Landsat series, offers broad spatial coverage, long periods, and high accessibility. However, its limited spatial resolution makes it difficult to accurately delineate PV station boundaries, and it is prone to spectral confusion with bare land, buildings, and other surface features [,]. In contrast, high-resolution imagery (e.g., GF, Sentinel) significantly improved the ability to extract texture and spatial structural features of PV stations, making it more effective for identifying small-scale targets [,]. Sentinel-1 radar imagery has also shown potential under all-weather conditions []. For small-scale applications, drone imagery combining visible and thermal infrared bands has been widely applied for fine-scale identification of rooftop PV systems [,]. Sentinel-2 imagery, with its high spatial resolution, short revisit cycle, and multispectral characteristics, has become an essential data source for large-scale PV identification. However, the highly heterogeneous surface conditions in arid regions, such as Gobi, sandy, bare rocks, and low-coverage grasslands, often lead to subtle spectral differences and fuzzy boundaries between land use types, increasing the risk of misclassification. This complex surface background places higher demands on the selection and processing of remote sensing data. Therefore, choosing and preparing appropriate data sources is the foundation for improving PV extraction accuracy.
Methods for identifying PV stations have rapidly progressed from manual visual interpretation to deep learning algorithms. Early manual interpretation relied heavily on expert experience and required substantial human and time resources, making it unsuitable for large-scale, dynamic monitoring []. Traditional machine learning methods (e.g., Random Forest (RF), Support Vector Machines (SVMs)) introduced the use of multi-dimensional features such as spectral, geometric, textural, and topographic attributes, enabling more accurate identification of PV stations in medium- and high-resolution remote sensing imagery [,]. These features vary with atmospheric conditions, illumination, satellite sensors, observation scale, and surrounding environments, which may affect model performance []. Among them, the RF algorithm has shown strong robustness and generalization ability in high-dimensional feature spaces and has been widely applied in PV extraction tasks using remote sensing data [,]. Recently, deep learning models (e.g., semantic segmentation networks-U-Net, DeepLabV3+, Convolutional Neural Networks (CNNs)) can show superior performance on object detection and image classification by automatically learning hierarchical features. Several studies have successfully applied these models to PV identification, achieving high accuracy []. However, the practical application of deep learning at regional scales remains limited by the demand for large-scale labeled datasets and high computational resources, which constrain accuracy and scalability []. In comparison, machine learning methods based on the Google Earth Engine (GEE) platform have become an efficient and cost-effective approach for regional-scale PV extraction due to their computational efficiency and data accessibility. Although some studies have applied RF on the GEE platform for PV extraction, most have focused on national or urban scales, lacked systematic feature selection, and provided limited comparison among classifiers under highly heterogeneous surfaces. Therefore, it is necessary to develop a PV extraction framework that integrates optimized feature construction and model selection, tailored to the complex surface environments of arid regions.
To address these challenges, this study focuses on the Inner Mongolia Yellow River Basin. This region lies at the ecological transition zone between the Qinghai–Tibet Plateau, the Mongolian Plateau, and the North China Plain. It features a mosaic of ecosystems—mountains, rivers, forests, farmland, lakes, grasslands, and deserts—and plays a vital role in northern China’s ecological security. At the same time, it serves as a core area for national renewable energy deployment in arid and semi-arid zones []. PV construction has contributed to local economic growth and energy security. With careful planning, PV stations can improve solar energy efficiency while promoting vegetation growth by providing shading and moisture retention []. However, the unregulated expansion of PV stations may lead to competition for land resources, exacerbating land degradation in ecologically fragile areas [], altering local microclimates [], and causing biodiversity loss []. Therefore, studying PV extraction methods in this region is essential for monitoring arid landscapes, optimizing spatial layouts, and balancing energy development with ecological protection. However, current extraction methods remain inadequate for arid regions with complex surface features, particularly in achieving both efficiency and accuracy at the regional scale.
In this context, the Inner Mongolia Yellow River Basin, a key intersection of China’s northern ecological security barrier and energy base []. We propose a PV station extraction framework on the GEE platform, integrating spectral bands, spectral indices, and topographic variables to enhance classification performance. A systematic comparison of the classification performance of Classification and Regression Tree (CART), SVM, and RF classifiers under heterogeneous surface conditions in arid zones identifies the optimal classifier and quantifies the importance of each feature variable to produce a 10 m resolution PV station distribution map for the study area. In addition, we combine land use data and landscape pattern indices to analyze the spatial clustering and land use context of PV development. Compared with previous studies, this research develops a systematic extraction framework tailored to arid regions and integrates it with landscape pattern analysis, thereby enhancing the methodological approach. Our results can support regional energy planning and ecological impact assessments, while also serving as a contribution to remote sensing surveillance of renewable energy in arid zones.
2. Materials and Methods
2.1. Study Area
The Inner Mongolia Yellow River Basin (37°37′–41°50′ N, 106°20′–112°47′ E) is located in the south-central part of the Mongolian Plateau, situated in the upper and middle reaches of the Yellow River. It is characterized by a typical arid to semi-arid climate (Figure 1a). The terrain in this region is undulating, dominated by high plains, with elevations ranging from 839 to 2351 m (Figure 1b). The region is characterized by a temperate continental climate. Mean annual temperature shows a decreasing gradient from the southwest toward the northeast, ranging from approximately 1.2 °C to 10.7 °C (Figure 1c). Annual precipitation varies from 58 mm to 407 mm (Figure 1d), mostly concentrated in summer, while evaporation far exceeds precipitation. Abundant solar radiation is a key advantage for PV development in the study area, with annual sunshine duration reaching approximately 2700 h. Due to the fertile land along the Yellow River, cropland constitutes the primary land use type in the region. Other land use categories include unused land, grassland, construction land, forest, and water bodies. This basin covers a vast area, with unused land accounting for over 15% [], creating favorable conditions for large-scale PV station construction.
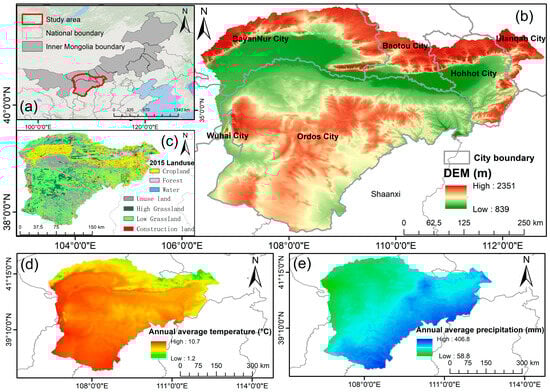
Figure 1.
Location and natural conditions of the study area. (a) Geographical location of the Inner Mongolia Yellow River Basin. (b) Digital Elevation Model (DEM, m). (c) Map of land use types in 2015. (d) Mean annual temperature in 2023 (°C). (e) Annual precipitation in 2023 (mm).
2.2. Data Sources and Image Preprocessing
Satellite remote sensing images were obtained from the Sentinel-2 Level-2A surface reflectance product (10 m) released by the European Space Agency (ESA) [], with images having less than 20% cloud cover selected for radiometric normalization and median compositing to generate quarterly composite data for training sample selection. As some PV stations in the study area have implemented ecological restoration measures between PV panel arrays, data were selected before the vegetation growing season to suppress confusion between vegetation and PV panels during extraction []. In addition, snow accumulation on PV panels during winter may cause reflectance distortion []; therefore, imagery from March to May 2024 was selected, when the contrast between PV panels and surrounding environments is more pronounced, making them easier to distinguish. However, the current image selection is limited to spring, and therefore may not fully capture potential seasonal spectral variations in PV station appearance across the full annual cycle. Topographic data were derived from the ALOS World 3D-30 m (AW3D30) DEM, and all aforementioned data were accessed through the GEE platform []. The validation data were obtained from the remote sensing-derived dataset for large-scale ground-mounted PV stations in China for the year 2020 (accuracy 89.1%), published in Scientific Data [], which was used to construct a historical benchmark validation framework. The 1 km resolution average precipitation and temperature data for the study area in 2023 were sourced from the National Tibetan Plateau Data Center (https://data.tpdc.ac.cn/ accessed on 1 August 2025). The land use data are derived from the 2015 30 m resolution raster dataset provided by the Resource and Environment Science and Data Center, Chinese Academy of Sciences (https://www.resdc.cn, accessed on 1 August 2025).
2.3. Sample Selection and Feature Extraction
2.3.1. Sample Selection
To support the selection of representative samples, the 2020 PV station dataset constructed by Feng et al. [], a national-scale 10 m Sentinel-2-based product that maps ground-mounted PV stations across China, was used to provide spatial reference for locating candidate PV sites. This dataset, combined with our field survey results and high-resolution imagery from Google Earth Pro [], facilitated the visual identification of PV sample points in the 2024 Sentinel-2 imagery. A total of 300 positive sample (PV) points and 600 negative sample (non-PV) points were manually labeled. Non-PV points were evenly distributed across land use types, including grasslands, forests, shrubs, croplands, construction land, unused land, and water bodies. The resulting sample set is randomized into a training set and validation set in a ratio of 70:30. The spatial distribution of sample points is shown in Supplementary Figure S1.
2.3.2. Spectral and Topographic Features
Based on DEM data, slope and aspect were calculated on the GEE platform implementation of the Horn algorithm. Spectral bands and indices were derived from Sentinel-2 imagery. Six bands relevant to PV extraction were selected: blue (B2), green (B3), red (B4), near-infrared (B8), and shortwave infrared (B11–B12). A total of ten spectral indices were constructed (Table 1), including the Normalized Difference Vegetation Index (NDVI), Built-Up Area Index (BUAI), Land Surface Water Index (LSWI), and Normalized Difference Tillage Index (NDTI). NDVI and the Enhanced Vegetation Index (EVI) were used to enhance the contrast between vegetation and PV areas. The Soil-Adjusted Vegetation Index (SAVI) was used to further correct NDVI values affected by soil brightness in areas with sparse vegetation cover. LSWI is a land surface water index, while the Modified Normalized Difference Water Index (MNDWI) is a modified version that improves the separability between PV and water bodies. BUAI and the Normalized Built-Up Index (NDBI) were employed to distinguish PV stations from built-up areas. NDTI was used to enhance the contrast between PV areas and croplands. The Shadow Index (SI) was used to improve the separability between PV arrays and shadows. The Normalized Difference PV Index (NDPI) is a spectral index specifically designed for PV identification.

Table 1.
Formulas and descriptions of variables used in feature extraction.
The importance of each feature was calculated using the RF classifier’s built-in Gini importance metric, which quantifies the total decrease in node impurity contributed by each variable across all trees in the forest. This value was then normalized into a relative percentage to facilitate comparison.
2.4. Classification Model Training
GEE is an open platform that integrates multi-source remote sensing data resources. Relying on high-performance computing capabilities and an open-source code ecosystem, it supports the rapid processing and analysis of large-scale geoscientific data []. In this study, three classifiers with different modeling mechanisms, namely SVM, CART, and RF, were selected. The aim was to compare the performance differences of linear or nonlinear, single-tree or ensemble algorithms in the interpretation of PV spectral features, and to select the most robust recognition model.
SVM seeks an optimal separating hyperplane that enlarges the margin between categories [], using the default linear kernel to balance classification accuracy and computational efficiency. CART employs a recursive binary splitting strategy to divide the feature space, using the Gini index as the splitting criterion to build a binary tree structure []. The maximum number of leaf nodes was limited to 10, and pruning was applied to improve generalization, as recommended in Chen et al. []. RF [] builds an ensemble of 80 decision trees using bootstrap sampling of training data. At each node split, seven feature variables were randomly selected, following standard settings used in previous studies [], and final predictions were obtained through majority voting across all trees. To further validate the robustness of the classification models, a 5-fold cross-validation experiment was performed (Table S2).
2.5. Accuracy Assessment
A confusion matrix was constructed based on 30% of the validation dataset to quantify the accuracy of PV extraction using the following metrics:
Overall Accuracy (OA):
where is the number of correctly classified samples for class i and N is the total number of samples, reflecting the overall classification capability of the model [].
Producer’s Accuracy (PA):
For the PV class, TP refers to the number of correctly identified PV samples, and FNdenotes the number of PV samples that were omitted. PA characterizes the completeness of the model’s identification of actual PV areas.
User’s Accuracy (UA):
FP refers to the number of non-PV samples that were incorrectly classified as PV, indicating the reliability of the extraction results.
F1 Score (F1):
The F1 is the harmonic mean of PA and UA, balancing omission and incorrectly classified [,].
Kappa Coefficient:
where represents random consistency probability. The Kappa evaluates the variability of the model classification results from the randomized classification, with values closer to 1 indicating stronger agreement.
2.6. Image Post-Processing Workflow
After selecting the optima classifier, the preliminary classification results were further refined through the following post-processing steps to enhance the precision of PV extraction: Firstly, the DEM data were imported into the GEE platform to calculate slope and mountain shadow, and areas with a slope > 30% and mountain shadow < 150 were excluded, mainly referring to Lyu et al. []. Secondly, the classification output was binarized, and a focal minimum filter with a 1-pixel neighborhood window was applied to remove isolated PV pixels (those with fewer than 9 neighboring pixels), effectively mitigating salt-and-pepper noise []. A focal maximum filter was subsequently employed to reconnect fragmented PV patches. To further refine the results, a focal mode filter with a 1-pixel neighborhood was used to smooth boundaries and fill internal gaps. The final classification results were vectorized and imported into ArcGIS 10.2, where manual inspection using Sentinel-2 composite imagery was conducted to eliminate incorrectly classified PV polygons []. The overall technical workflow is presented in Figure 2.
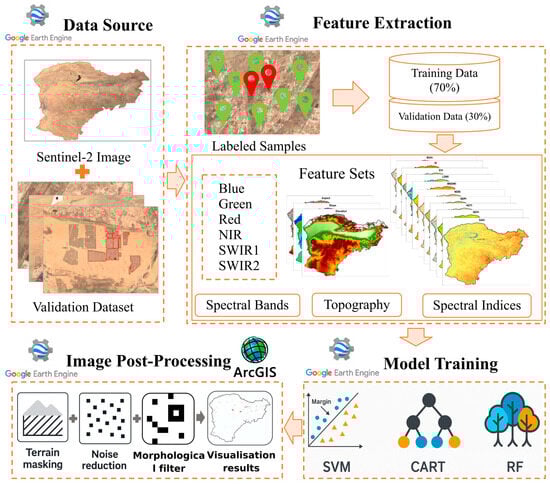
Figure 2.
Technical workflow of this study.
2.7. Spatial Distribution and Landscape Pattern Analysis of Photovoltaic Stations
Based on the extracted results, further analysis was conducted on the spatial distribution and landscape patterns of PV stations. To better reveal regional differences in PV station layouts, the study area was subdivided into multiple sub-regions according to league-level administrative boundaries, and landscape indices were calculated separately in Fragstats 4.2. The landscape indices were selected from both patch and landscape metrics indices [,], including Patch Area (AREA), Largest Patch Index (LPI), Perimeter (PERIM), Landscape Shape Index (LSI), Patch Density (PD), Euclidean Nearest-Neighbor Distance (ENN), and the Division Index (DIVISION), as listed in Table 2. These indices collectively reflect the spatial extent, shape complexity, distribution density, spatial aggregation, and landscape fragmentation of PV patches.
Table 2.
Formulas of landscape pattern indices and their ecological implications.
In addition, Kernel Density Estimation was performed using ArcGIS 10.2 to identify the spatial clustering characteristics of PV stations in the study area []. The analysis used the centroid of each PV patch as the input data, with a search radius of 50 km. To further understand the land use background of PV development, overlay analysis was performed in ArcGIS 10.2 by combining the 2015 land use data with the 2024 PV distribution results. The area and proportion of PV stations in each land-use category were then calculated [].
3. Results
3.1. Model Comparison and Selection
The OA, Kappa, and F1 of the three classifiers were calculated based on the validation sample set, as shown in Table 3. The results indicate that all three models achieved Kappa coefficients greater than 0.75, suggesting their effectiveness in extracting PV stations in the study area. Among the three classifiers, the RF classifier yielded the highest F1. Based on the combined evaluation metrics, the extraction performance of the classifiers ranked as follows: RF > CART > SVM. The RF achieved an OA of 97.27%, a Kappa coefficient of 0.94, and an F1 of 0.98 for non-PV (F1-nPV) and 0.96 for PV (F1-PV), indicating its high accuracy and suitability for PV station extraction. Compared with the other two classifiers, the RF significantly reduced omission (96.25%) and incorrectly classified (95.06%) in PV areas. It was able to extract PV stations more completely and produced shapes that were more consistent with the real situation configurations.
Table 3.
Accuracy comparison of the three classifiers.
To validate the feasibility and superiority of the RF classifier, eight Sentinel-2 remote sensing images were randomly selected, and the extraction results of the three classifiers are presented in Figure 3. The results show that, compared with the SVM and CART classifiers, the RF effectively reduces omission and incorrectly classified (Figure 3(a.4–h.4)). The SVM classifier resulted in a large number of incorrectly classified, misclassifying regions with similar spectral characteristics to PV as PV in images of low coverage vegetation, mountain shadows, and mining areas (Figure 3(a.2,e.2,h.2)). It also suffered from significant omission errors, failing to delineate the complete shapes of PV stations (Figure 3(d.2)). However, the SVM classifier performed relatively well in extracting small-scale PV stations (Figure 3(c.2,g.2–h.2)). Although the CART classifier also exhibited both omission and incorrectly classified, it generally outperformed SVM. It was able to more completely extract the shapes of PV stations (Figure 3(a.3–d.3)), but performed poorly when identifying small-scale PV areas (Figure 3(g.3–h.3)). In contrast, the RF accurately and completely extracted the morphology of PV stations, including small-sized installations, indicating its strong applicability for extracting PV stations from high-resolution remote sensing imagery in the study area.
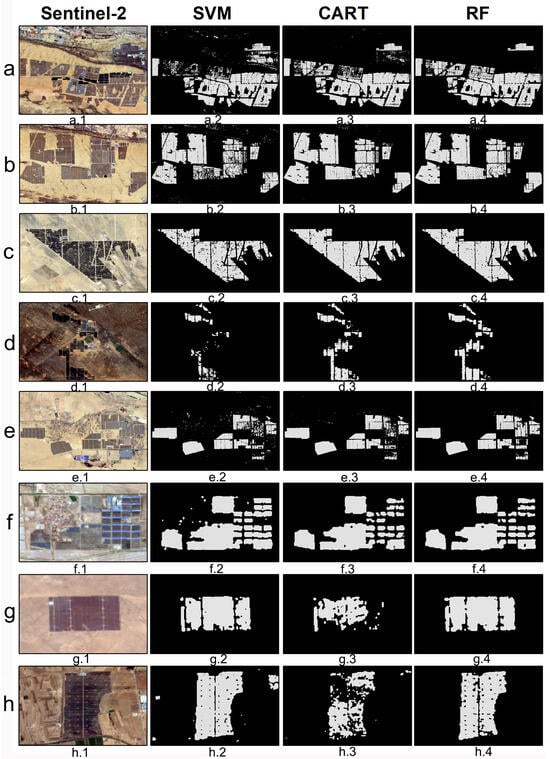
Figure 3.
Sentinel-2 imagery and extraction results using SVM, CART, and RF classifiers. Each row (a–h) represents one PV station, with four panels: “.1” Sentinel-2 imagery, “.2” SVM extraction result, “.3” CART extraction result, and “.4” RF extraction result (e.g., a.1–a.4 for station a, b.1–b.4 for station b, etc.).
3.2. Influence of Variables on Classifier Performance
After identifying the optimal classifier, the RF classifier was used to evaluate the influence of each variable on the model performance. A total of 19 variables across three categories contributed to PV extraction in the study area (Figure 4). Among these, NDTI had the highest contribution to PV extraction, with an importance value of 10.517%. This was followed by B8 (6.816%), LSWI (6.625%), NDPI (6.615%), B2 (6.200%), and NDBI (6.012%). Variables such as MNDWI, AVE, SAVI, EVI, B4, B12, SI, NDVI, B3, BUAI, slope, and B11 had importance values ranging from 4% to 6%. Aspect had the lowest importance, accounting for only 2.162%. Overall, spectral indices had the most significant influence on PV extraction in the study area. The importance rankings of NDTI, LSWI, NDPI, NDBI, and MNDWI were 1st, 3rd, 4th, 6th, and 7th, respectively. In terms of spectral bands, the importance ranking of variables for PV extraction was B8, B2, B4, B12, B3, and B11. The three topographic variables had varying degrees of influence on PV extraction.
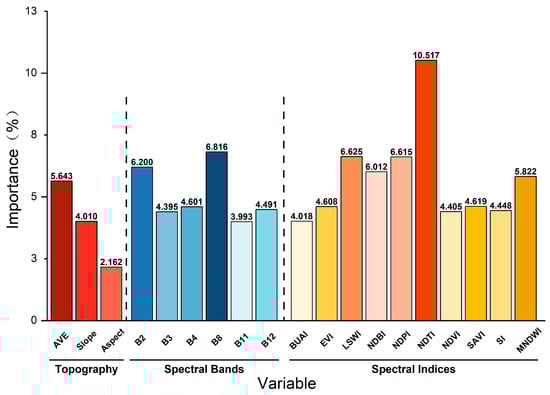
Figure 4.
Importance of different variables in PV extraction using the RF classifier. Variables are color-coded by type: red for topographic factors, blue for spectral bands, and yellow for spectral indices. The shade intensity reflects the variable’s relative importance within each group.
3.3. Spatial Distribution and Landscape Pattern of Photovoltaic Stations in the Inner Mongolia Yellow River Basin in 2024
According to the extraction results generated by the RF classifier (Figure 5a), the spatial distribution of PV stations in the study area in 2024 generally exhibited an “overall dispersion with local clustering” pattern, with concentrations primarily in the northern and western parts of the region—particularly in Bayannur, Baotou, Hohhot, and Ordos. Kernel density analysis further revealed the core areas of PV development (Figure 5b). Overall, four high-density clusters of PV stations were identified, primarily located in the northern and southwestern parts of the study area. These clusters exhibited significantly higher spatial density values compared to other regions, indicating that they represent hotspots of PV development.
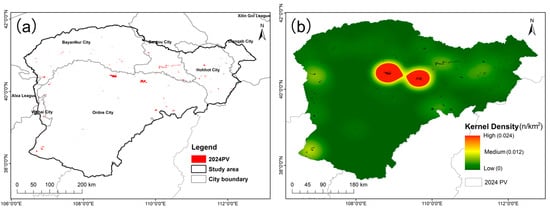
Figure 5.
PV station extraction results in the study area using the RF classifier. (a) Spatial distribution of PV stations in 2024. (b) Kernel density map. Red indicates high patch density of PV stations, while green represents low density.
The landscape pattern indices and extraction statistics indicate significant spatial differences in PV station distribution across different regions (Table 4). In terms of patch area, excluding Alxa League, the total PV AREA in Ordos City reached 167.58 km2, which was significantly higher than that in other regions, accounting for 61.59% of the total PV area in the study region. Moreover, its LPI reached 15.83%. By contrast, the PV AREA in Ulanqab City was only 0.86 km2, representing just 0.32% of the total, yet its LPI was as high as 60.68%. Regarding shape characteristics, the SHAPE index of PV patches in each league or city ranged from 1.49 to 1.70, indicating that most PV patches were irregular in shape. Among them, Ulanqab exhibited the highest SHAPE value. Baotou City had the highest PD at 16.14 patches/km2, significantly exceeding that of other regions, whereas Ordos had the lowest PD, at only 1.42 patches/km2. The DIVISION index was generally high throughout the study area, with Baotou ranking first at 98.54%. Overall, Ordos not only dominated in terms of PV station area and quantity, but also exhibited a highly aggregated landscape pattern.
Table 4.
Landscape pattern indices and extraction statistics of PV stations in each league and city within the study area.
4. Discussion
This study utilized Sentinel-2 imagery and the GEE platform, employing an RF classifier to achieve high-accuracy extraction of PV stations in the Inner Mongolia Yellow River Basin. Compared to manual visual interpretation, our method offers higher efficiency and accuracy. Manual visual interpretation relies on high-resolution imagery and expert experience. Although it provides relatively high accuracy, it is time-consuming, costly, and susceptible to subjective human bias, making it difficult to apply in large-scale dynamic monitoring []. The method proposed in this study enables automated identification of PV stations within a cloud-based parallel computing environment, substantially enhancing data processing capacity while reducing errors caused by human intervention. Moreover, comparison with satellite imagery of varying spatial resolutions indicates that Sentinel-2’s 10 m resolution offers a favorable balance for PV station extraction tasks. Due to their relatively coarse 30 m resolution, Landsat imagery tends to struggle in accurately capturing small-scale PV stations, often leading to confusion with other surface features such as biological soil crusts, plastic-covered sheds, regularly textured mining sites, and mountain shadows []. In contrast, high-resolution imagery (e.g., GF, drone-based aerial images) can provide more precise boundary delineation, but it incurs substantial computational costs in large-scale studies. Therefore, Sentinel-2 imagery strikes a favorable balance between accuracy and efficiency, offering an effective and scalable solution for regional-scale PV extraction.
In this study, the superiority of RF in the extraction of PV stations is verified by comparing three classifiers, SVM, CART, and RF. Experimental results showed that the RF achieved an OA of 97.27% and a Kappa of 0.94, significantly outperforming SVM (92.19%) and CART (93.36%). This finding is consistent with previous studies. For instance, Chen et al. [] reported that RF outperforms SVM in PV station extraction, and Feng et al. [] demonstrated that RF exhibits greater stability and generalization capacity on the GEE platform. This is mainly attributed to the ensemble learning characteristics of the RF model and its strong adaptability to high-dimensional features. Firstly, the RF integrates multiple decision trees via the Bagging mechanism, which provides greater resistance to overfitting compared to the single-tree-based CART []. Due to its structural limitations, CART may fail to fully exploit the high-dimensional spectral features of Sentinel-2 imagery. Secondly, unlike SVM, which relies on hyperplane separation, RF splits nodes by randomly selecting features, enhancing its robustness in handling high-dimensional data. In contrast, SVM depends on kernel functions for nonlinear classification [], which may lead to reduced classification accuracy under heterogeneous PV environments due to suboptimal parameter selection. Moreover, mislabeled training samples can severely compromise the classification performance of the SVM model []. In contrast, the RF classifier can enhance classification performance by adjusting based on feature importance, exhibiting stronger adaptability to complex PV scenarios. Comparative experiments on multiple representative remote sensing images indicated that the SVM classifier was prone to misclassification under complex background conditions, although it performed relatively well in identifying small-scale PV stations. The CART classifier, on the other hand, exhibited considerable omission in detecting small targets. In contrast, the RF classifier demonstrated strong stability and accuracy across PV stations of different scales. However, the RF classifier may introduce instability when trained on imbalanced datasets or when sample sizes for certain land use types are limited. Compared with similar RF-based PV extraction studies conducted in arid regions, which reported overall accuracies ranging from 91.8% to 99.47% at the regional scale [,], the OA of 97.27% achieved in this study under complex dryland conditions demonstrates the stronger generalization and representational capability of the proposed framework. In contrast, deep learning models such as CNNs and semantic segmentation networks have demonstrated strong performance in extracting complex objects, but their application to large-scale PV extraction remains constrained by the need for large volumes of high-quality labeled data and substantial computational resources.
The variable importance results indicate that spectral indices play a crucial role in the extraction of PV stations. Among these, the NDTI contributes the most (10.517%), suggesting that the spectral differentiation of PV stations from bare soil and cropland primarily relies on shortwave infrared (SWIR) band information. Since water in plant leaves strongly absorbs energy in the SWIR region, while bare soil and dry vegetation exhibit high reflectance, NDTI effectively highlights these spectral differences []. In addition, PV panels are typically made of silicon, which absorbs substantial energy in the visible and near-infrared (NIR) bands but reflects more in the SWIR region []. Hence, NDTI demonstrates strong discriminative power in PV classification. Moreover, the B8 band and the LSWI also show high importance in PV extraction. The B8 band effectively distinguishes vegetation from PV panels, while LSWI is primarily used to detect water bodies and moist surfaces, implying that PV station construction in the arid and semi-arid study area may be influenced by local moisture conditions. The NDBI and NDPI also show high importance, as they are used to distinguish built-up areas and PV facilities, which aligns with the fact that PV stations are often built in non-vegetated areas. Although the aspect variable has relatively low importance in this study, it is still retained, consistent with the findings of Chen et al. []. This is because PV station construction aims to maximize solar radiation, which is typically achieved by situating installations on sun-facing slopes in mountainous regions. The aspect variable can distinguish slope orientation and thereby differentiate between sunny and shady slopes. However, PV stations in this study area are mainly distributed in relatively flat or gently sloping terrain, rendering slope orientation less influential in classification. Similar to Feng et al. [] and Zhang et al. [], we initially considered incorporating texture features to improve classification accuracy. However, these variables did not substantially enhance performance in this study, likely because the 10 m spatial resolution of Sentinel-2 imagery weakens the local textural contrast between PV panel arrangements and surrounding surfaces. Nevertheless, texture metrics have demonstrated promise in higher-resolution scenarios (e.g., GF imagery) for capturing the regular geometric patterns of PV arrays, and thus represent a potential enhancement direction for future PV extraction tasks.
Analysis of the spatial distribution and landscape pattern of PV stations in 2024 reveals an overall pattern of dispersed distribution with localized clustering, with the northern and southwestern parts of the study area serving as the main concentration zones. Kernel density analysis further identifies distributional hotspots of PV stations, indicating that these areas possess abundant solar irradiance and land resources, as well as relatively developed energy infrastructure, which facilitates grid connection and electricity consumption []. By overlaying the extracted PV distribution with the 2015 land use data (Table S1), we found that the majority of PV stations were located on unused land (52.68%) and low-coverage grasslands (27.57%), which are typically ecologically fragile zones such as sandy areas, Gobi, and degraded grasslands in arid regions. These areas offer low competition for land use and high solar potential, making them ideal for centralized PV development [,]. Moreover, analysis of landscape pattern indices shows that significant spatial heterogeneity exists in the distribution of PV stations across different leagues and cities. Ordos City has the largest total PV AREA, with an LPI of 15.83% and an ENN of only 1.49 km, indicating a high development intensity but relatively low spatial aggregation. This may be due to the city’s complex topography, with many mountainous areas unsuitable for PV construction, resulting in a relatively centralized layout that is easier to manage and restore ecologically. In Baotou City, the PD is 16.14 n/km2 and ENN is 0.24 km, suggesting a high density of PV patches and proximity between them, which indicates strong connectivity and a pattern of dense clustering. This compact layout improves land use efficiency but may increase the difficulty of coordination with ecological restoration and infrastructure. The SHAPE index is generally high across all leagues and cities, which may be attributed to the need for PV station construction to avoid irregular terrain or land use type, resulting in more complex geometric boundaries. The DIVISION index is also relatively high, indicating a certain degree of spatial integration among PV stations. Overall, the spatial layout of PV stations in the study area exhibits a diversified configuration. These observed differences suggest that regional natural conditions, land availability, and local development policies play crucial roles in shaping the spatial distribution of PV stations. This finding is consistent with the results of Chen et al. [], who noted that in regions with relatively uniform natural conditions, policy incentives and infrastructure often become the dominant factors influencing PV station distribution. For example, the national “14th Five-Year Plan for Renewable Energy Development” (2021) explicitly calls for the construction of large-scale wind and solar bases in deserts, the Gobi, and arid regions, emphasizing the synergy between ecological restoration and clean energy development [,]. Current policies promote PV development in the desert and Gobi areas to reduce wind erosion and enhance vegetation restoration []. Therefore, the PV industry in the Inner Mongolia Yellow River Basin not only contributes to energy supply but also plays a role in ecological restoration and environmental governance.
Despite the promising results and valuable insights, this study has several limitations that should be acknowledged. First, although the RF classifier performed well in this study, the accuracy of PV extraction still depends on the quality and representativeness of training samples, which may vary across time and regions. Second, the current analysis mainly focused on the spatial distribution and landscape patterns in 2024; temporal dynamics and long-term ecological impacts of PV expansion remain to be explored in future studies. Finally, future research could further integrate or compare machine learning and deep learning frameworks to systematically evaluate their differences in extraction accuracy and other performance aspects.
5. Conclusions
This study developed an RF classifier integrating multi-source features on the GEE platform, enabling the remote sensing extraction and spatial identification of PV stations in the Inner Mongolia Yellow River Basin in 2024. The results indicate that the RF classifier demonstrates high accuracy in PV identification, with features such as NDTI, B8, and LSWI contributing significantly to the classification. The spatial distribution of PV stations in the study area exhibits an overall pattern of “overall dispersion with local clustering,” with notable heterogeneity across different leagues and cities and a large-scale clustering trend driven by policy guidance. This study enriches the framework of feature selection and model application for remote sensing-based identification of centralized PV systems in arid and semi-arid regions, offering a quantitative basis for understanding site selection preferences. These findings suggest that policymakers and land-use planners should prioritize PV development in unused or low-coverage grasslands, while strengthening monitoring and restoration measures in densely clustered areas to balance renewable energy expansion with sustainable land management in arid regions. Future studies could further incorporate long-term time series and high-resolution remote sensing data to achieve multi-temporal dynamic monitoring and more detailed spatial identification of PV stations.
Supplementary Materials
The following supporting information can be downloaded at https://www.mdpi.com/article/10.3390/en18174464/s1: Figure S1: Spatial distribution of positive (PV) and negative (non-PV) sample points; Table S1: Overlay analysis of PV station distribution with 2015 land use types in the Inner Mongolia Yellow River Basin; Table S2: Results of 5-fold cross-validation for CART, RF, and SVM classifiers.
Author Contributions
Conceptualization, Q.Z. and L.Z.; methodology, L.Z., Z.W. and N.Z.; software, L.Z.; validation, H.Z. and N.Z.; formal analysis, L.Z., N.Z., T.Z., H.B. and H.C.; writing—original draft preparation, L.Z.; writing—review and editing, Q.Z. and H.Z.; visualization, L.Z.; funding acquisition, Q.Z. All authors have read and agreed to the published version of the manuscript.
Funding
This work was supported by the Ordos City Science and Technology Major Project (ZD20232305), the National Center of Pratacultural Technology Innovation (under preparation) Special Fund for Innovation Platform Construction, and the Development Plan for Innovation Teams in Higher Educational Institutions of the Inner Mongolia Autonomous Region (NMGIRT2409).
Data Availability Statement
Sentinel-2 remote sensing imagery is available from (https://browser.dataspace.copernicus.eu/ accessed on 1 August 2025). ALOS World 3D-30 m DEM is available from (https://www.eorc.jaxa.jp/ALOS/en/index_e.htm accessed on 1 August 2025). The China PV dataset is obtained from (http://doi.org/10.57760/sciencedb.o00121.00001, accessed on 19 August 2025). Temperature and precipitation data were obtained from the National Tibetan Plateau Data Center (https://data.tpdc.ac.cn/ accessed on 1 August 2025). The land use data are provided by the Resource and Environment Science and Data Center, Chinese Academy of Sciences (https://www.resdc.cn accessed on 1 August 2025). The GEE code written and used in this study can be obtained from the corresponding authors.
Conflicts of Interest
Author Zhaoming Wang was employed by the company Inner Mongolia Pratacultural Technology Innovation Center Co., Ltd. Authors Tianyu Zhang and Hailong Bao were employed by the company Meng Grass Ecological Environment (Group) Co., Ltd. The remaining authors declare that the research was conducted in the absence of any commercial or financial relationships that could be construed as a potential conflict of interest.
References
- IPCC. Climate Change 2023: Synthesis Report. In A Report of the Intergovernmental Panel on Climate Change. IPCC2023. Available online: https://www.ipcc.ch/report/ar6/syr/ (accessed on 1 August 2025).
- bp. bp Energy Outlook: 2024 Edition. 2024. Available online: https://www.bp.com/en/global/corporate/energy-economics/energy-outlook.html (accessed on 1 August 2025).
- Irena, E.C.S.; WEMC; Inside Climate Service SRL. 2023 Year in Review: Climate-Driven Global Renewable Energy Potential Resources and Energy Demand, Technical Report 2025. Available online: https://www.irena.org/ (accessed on 1 August 2025).
- Wang, X.X.; Xiao, X.M.; Zhang, X.; Ye, H.; Dong, J.W.; He, Q.; Wang, X.B.; Liu, J.Q.; Li, B.; Wu, J.H. Characterization and mapping of photovoltaic solar power plants by Landsat imagery and random forest: A case study in Gansu Province, China. J. Clean. Prod. 2023, 417, 138015. [Google Scholar] [CrossRef]
- Zhang, X.H.; Xu, M.; Wang, S.J.; Huang, Y.K.; Xie, Z.Y. Mapping photovoltaic power plants in China using Landsat, random forest, and Google Earth Engine. Earth Syst. Sci. Data 2022, 14, 3743–3755. [Google Scholar] [CrossRef]
- Shimada, S.; Takeuchi, W. Revealing a Shift in Solar Photovoltaic Planning Sites in Vietnam from 2019 to 2022. Remote Sens. 2023, 15, 2756. [Google Scholar] [CrossRef]
- Zhang, H.T.; Tian, P.; Zhong, J.; Liu, Y.C.; Li, J.L. Mapping Photovoltaic Panels in Coastal China Using Sentinel-1 and Sentinel-2 Images and Google Earth Engine. Remote Sens. 2023, 15, 3712. [Google Scholar] [CrossRef]
- Lee, S.H.; Yoon, D.H.; Lee, S.K.; Oh, K.Y.; Lee, M.J. Development of a Technique for Classifying Photovoltaic Panels Using Sentinel-1 and Machine Learning. J. Sens. 2022, 2022, 1121971. [Google Scholar] [CrossRef]
- Garcia, G.; Aparcedo, A.; Nayak, G.K.; Ahmed, T.; Shah, M.; Li, M. Generalized deep learning model for photovoltaic module segmentation from satellite and aerial imagery. Sol. Energy 2024, 274, 112539. [Google Scholar] [CrossRef]
- Jiang, H.; Yao, L.; Lu, N.; Qin, J.; Liu, T.; Liu, Y.; Zhou, C. Multi-resolution dataset for photovoltaic panel segmentation from satellite and aerial imagery. Earth Syst. Sci. Data 2021, 13, 5389–5401. [Google Scholar] [CrossRef]
- Wang, X.X.; Xiao, X.M.; Zou, Z.H.; Hou, L.Y.; Qin, Y.W.; Dong, J.W.; Doughty, R.B.; Chen, B.Q.; Zhang, X.; Cheng, Y.; et al. Mapping coastal wetlands of China using time series Landsat images in 2018 and Google Earth Engine. ISPRS J. Photogramm. Remote Sens. 2020, 163, 312–326. [Google Scholar] [CrossRef]
- Feng, Q.; Niu, B.; Ren, Y.; Su, S.; Wang, J.; Shi, H.; Yang, J.; Han, M. A 10-m national-scale map of ground-mounted photovoltaic power stations in China of 2020. Sci. Data 2024, 11, 198. [Google Scholar] [CrossRef]
- Chen, Z.H.; Kang, Y.W.; Sun, Z.X.; Wu, F.; Zhang, Q. Extraction of Photovoltaic Plants Using Machine Learning Methods: A Case Study of the Pilot Energy City of Golmud, China. Remote Sens. 2022, 14, 2697. [Google Scholar] [CrossRef]
- Ji, S.; Wei, S.; Lu, M. Fully Convolutional Networks for Multisource Building Extraction from an Open Aerial and Satellite Imagery Data Set. IEEE Trans. Geosci. Remote Sens. 2019, 57, 574–586. [Google Scholar] [CrossRef]
- Xia, Z.L.; Li, Y.J.; Chen, R.S.; Sengupta, D.; Guo, X.N.; Xiong, B.; Niu, Y.L. Mapping the rapid development of photovoltaic power stations in northwestern China using remote sensing. Energy Rep. 2022, 8, 4117–4127. [Google Scholar] [CrossRef]
- Zhu, R.; Guo, D.X.; Wong, M.S.; Qian, Z.; Chen, M.; Yang, B.S.; Chen, B.Y.; Zhang, H.R.; You, L.L.; Heo, J.; et al. Deep solar PV refiner: A detail-oriented deep learning network for refined segmentation of photovoltaic areas from satellite imagery. Int. J. Appl. Earth Obs. Geoinf. 2023, 116, 103134. [Google Scholar] [CrossRef]
- Ball, J.; Anderson, D.; Chan, C.S. Comprehensive survey of deep learning in remote sensing: Theories, tools, and challenges for the community. J. Appl. Remote Sens. 2017, 11, 042609. [Google Scholar] [CrossRef]
- Tanner, K.E.; Moore-O’leary, K.A.; Parker, I.M.; Pavlik, B.M.; Hernandez, R.R. Simulated solar panels create altered microhabitats in desert landforms. Ecosphere 2020, 11, e03089. [Google Scholar] [CrossRef]
- Meng, R.B.; Meng, Z.J.; Ren, X.M.; Cai, J.L.; Tong, X.F. Positive impacts of typical desert photovoltaic scenarios in China on the growth and physiology of sand-adapted plants. Front. Plant Sci. 2025, 15, 1515896. [Google Scholar] [CrossRef]
- Rabaia, M.K.H.; Abdelkareem, M.A.; Sayed, E.T.; Elsaid, K.; Chae, K.J.; Wilberforce, T.; Olabi, A.G. Environmental impacts of solar energy systems: A review. Sci. Total Environ. 2021, 754, 141989. [Google Scholar] [CrossRef]
- Wu, Z.Y.; Hou, A.P.; Chang, C.; Huang, X.; Shi, D.Q.; Wang, Z.F. Environmental impacts of large-scale CSP plants in northwestern China. Environ. Sci. Process. Impacts 2014, 16, 2432–2441. [Google Scholar] [CrossRef] [PubMed]
- Grodsky, S.M.; Hernandez, R.R. Reduced ecosystem services of desert plants from ground-mounted solar energy development. Nat. Sustain. 2020, 3, 1036–1043. [Google Scholar] [CrossRef]
- Yun, J.; Liu, H.M.; Xu, Z.C.; Cao, X.A.; Ma, L.Q.; Wen, L.; Zhuo, Y.; Wang, L.X. Assessing Changes in the Landscape Pattern of Wetlands and Its Impact on the Value of Wetland Ecosystem Services in the Yellow River Basin, Inner Mongolia. Sustainability 2022, 14, 6328. [Google Scholar] [CrossRef]
- Gao, W.; Zhang, S.; Rao, X.; Lin, X.; Li, R. Landsat TM/OLI-Based Ecological and Environmental Quality Survey of Yellow River Basin, Inner Mongolia Section. Remote Sens. 2021, 13, 4477. [Google Scholar] [CrossRef]
- Gascon, F.; Bouzinac, C.; Thépaut, O.; Jung, M.; Francesconi, B.; Louis, J.; Lonjou, V.; Lafrance, B.; Massera, S.; Gaudel-Vacaresse, A.; et al. Copernicus Sentinel-2A Calibration and Products Validation Status. Remote Sens. 2017, 9, 584. [Google Scholar] [CrossRef]
- Andenæs, E.; Jelle, B.P.; Ramlo, K.; Kolås, T.; Selj, J.; Foss, S.E. The influence of snow and ice coverage on the energy generation from photovoltaic solar cells. Sol. Energy 2018, 159, 318–328. [Google Scholar] [CrossRef]
- Gorelick, N.; Hancher, M.; Dixon, M.; Ilyushchenko, S.; Thau, D.; Moore, R. Google Earth Engine: Planetary-scale geospatial analysis for everyone. Remote Sens. Environ. 2017, 202, 18–27. [Google Scholar] [CrossRef]
- Laso Bayas, J.C.; Lesiv, M.; Waldner, F.; Schucknecht, A.; Duerauer, M.; See, L.; Fritz, S.; Fraisl, D.; Moorthy, I.; McCallum, I.; et al. A global reference database of crowdsourced cropland data collected using the Geo-Wiki platform. Sci. Data 2017, 4, 170136. [Google Scholar] [CrossRef]
- Rediske, G.; Siluk, J.C.M.; Gastaldo, N.G.; Rigo, P.D.; Rosa, C.B. Determinant factors in site selection for photovoltaic projects: A systematic review. Int. J. Energy Res. 2019, 43, 1689–1701. [Google Scholar] [CrossRef]
- Rondeaux, G.; Steven, M.; Baret, F. Optimization of soil-adjusted vegetation indices. Remote Sens. Environ. 1996, 55, 95–107. [Google Scholar] [CrossRef]
- Huete, A.; Didan, K.; Miura, T.; Rodriguez, E.P.; Gao, X.; Ferreira, L.G. Overview of the radiometric and biophysical performance of the MODIS vegetation indices. Remote Sens. Environ. 2002, 83, 195–213. [Google Scholar] [CrossRef]
- Qin, Y.; Xiao, X.; Dong, J.; Zhou, Y.; Zhu, Z.; Zhang, G.; Du, G.; Jin, C.; Kou, W.; Wang, J.; et al. Mapping paddy rice planting area in cold temperate climate region through analysis of time series Landsat 8 (OLI), Landsat 7 (ETM+) and MODIS imagery. ISPRS J. Photogramm. Remote Sens. 2015, 105, 220–233. [Google Scholar] [CrossRef]
- Zha, Y.; Gao, J.; Ni, S. Use of normalized difference built-up index in automatically mapping urban areas from TM imagery. Int. J. Remote Sens. 2003, 24, 583–594. [Google Scholar] [CrossRef]
- Wang, S. Application of Machine Learning Method in Remote Sensing Extraction of Photovoltaic Power Plants. Master’s Thesis, School of Geography, Geomatics and Planning, Jiangsu Normal University, Xuzhou, China, 2018. [Google Scholar]
- Van Deventer, A.P.; Ward, A.D.; Gowda, P.H.; Lyon, J.G. Using Thematic Mapper Data to Identify Contrasting Soil Plains and Tillage Practices. Photogramm. Eng. Remote Sens. 1997, 63, 87–93. [Google Scholar]
- Tucker, C.J. Red and photographic infrared linear combinations for monitoring vegetation. Remote Sens. Environ. 1979, 8, 127–150. [Google Scholar] [CrossRef]
- Lyu, X.; Li, X.; Wei, H.; Wu, J.; Dang, D.; Zhang, C.; Wang, K.; Lou, A. Mapping of Utility-Scale Solar Panel Areas From 2000 to 2022 in China Using Google Earth Engine. IEEE J. Sel. Top. Appl. Earth Obs. Remote Sens. 2024, 17, 18083–18095. [Google Scholar] [CrossRef]
- Xu, H. Modification of normalised difference water index (NDWI) to enhance open water features in remotely sensed imagery. Int. J. Remote Sens. 2006, 27, 3025–3033. [Google Scholar] [CrossRef]
- Cortes, C.; Vapnik, V. Support-vector networks. Mach. Learn. 1995, 20, 273–297. [Google Scholar] [CrossRef]
- Loh, W.Y. Classification and regression trees. WIREs Data Min. Knowl. Discov. 2011, 1, 14–23. [Google Scholar] [CrossRef]
- Breiman, L. Random Forests. Mach. Learn. 2001, 45, 5–32. [Google Scholar] [CrossRef]
- Congalton, R.G. A review of assessing the accuracy of classifications of remotely sensed data. Remote Sens. Environ. 1991, 37, 35–46. [Google Scholar] [CrossRef]
- Chen, Y.; Zhou, J.; Ge, Y.; Dong, J. Uncovering the rapid expansion of photovoltaic power plants in China from 2010 to 2022 using satellite data and deep learning. Remote Sens. Environ. 2024, 305, 114100. [Google Scholar] [CrossRef]
- Schumaker, N.H. Using Landscape Indices to Predict Habitat Connectivity. Ecology 1996, 77, 1210–1225. [Google Scholar] [CrossRef]
- Su, N.; Jarvie, S.; Yan, Y.; Gong, X.; Li, F.; Han, P.; Zhang, Q. Landscape context determines soil fungal diversity in a fragmented habitat. Catena 2022, 213, 106163. [Google Scholar] [CrossRef]
- Liu, L.Y.; Liu, P.T.; Yu, J.W.; Feng, G.; Zhang, Q.; Svenning, J.C. Wind farms increase land surface temperature and reduce vegetation productivity in the Inner Mongolia. Geogr. Sustain. 2024, 5, 319–328. [Google Scholar] [CrossRef]
- Mountrakis, G.; Im, J.; Ogole, C. Support vector machines in remote sensing: A review. ISPRS J. Photogramm. Remote Sens. 2011, 66, 247–259. [Google Scholar] [CrossRef]
- Zhang, X.H.; Zeraatpisheh, M.; Rahman, M.M.; Wang, S.J.; Xu, M. Texture Is Important in Improving the Accuracy of Mapping Photovoltaic Power Plants: A Case Study of Ningxia Autonomous Region, China. Remote Sens. 2021, 13, 3909. [Google Scholar] [CrossRef]
- Ji, L.; Wu, Y.X.; Sun, L.J.; Zhao, X.H.; Wang, X.Q.; Xie, Y.L.; Guo, J.H.; Huang, G.R. Solar photovoltaics can help China fulfill a net-zero electricity system by 2050 even facing climate change risks. Resour. Conserv. Recycl. 2022, 186, 106596. [Google Scholar] [CrossRef]
- Shang, W.; Zhang, Z.P.; Fu, G.Q.; Wang, Q.; Li, Y.Q.; Chang, L. Spatial Heterogeneity of Vegetation Communities and Soil Properties in a Desert Solar Photovoltaic Power Station of the Hexi Corridor, Northwestern China. Pol. J. Environ. Stud. 2023, 32, 2795–2807. [Google Scholar] [CrossRef] [PubMed]
- Zhang, Y.; Tian, Z.Q.; Liu, B.L.; Chen, S.Y.; Wu, J.H. Effects of photovoltaic power station construction on terrestrial ecosystems: A meta-analysis. Front. Ecol. Evol. 2023, 11, 1151182. [Google Scholar] [CrossRef]
- National Development and Reform Commission. The 14th Five-Year Plan for Renewable Energy Development. Available online: https://www.ndrc.gov.cn/ (accessed on 1 August 2025).
- Zhang, H.; Song, Y.; Zhang, M.; Duan, Y.; Zhao, D. Ecological environmental impact assessment of photovoltaic and “photovoltaic +” development in China. Renew. Energy 2025, 252, 123509. [Google Scholar] [CrossRef]
- Wang, Y.; Liu, B.; Xing, Y.; Peng, H.; Wu, H.; Zhong, J. Ecological construction status of photovoltaic power plants in China’s deserts. Front. Environ. Sci. 2024, 12, 1406546. [Google Scholar] [CrossRef]
Disclaimer/Publisher’s Note: The statements, opinions and data contained in all publications are solely those of the individual author(s) and contributor(s) and not of MDPI and/or the editor(s). MDPI and/or the editor(s) disclaim responsibility for any injury to people or property resulting from any ideas, methods, instructions or products referred to in the content. |
© 2025 by the authors. Licensee MDPI, Basel, Switzerland. This article is an open access article distributed under the terms and conditions of the Creative Commons Attribution (CC BY) license (https://creativecommons.org/licenses/by/4.0/).