Abstract
Electricity demand forecasting is essential for smart grid management, yet it presents challenges due to the dynamic nature of consumption trends and regional variability in usage patterns. While federated learning (FL) offers a privacy-preserving solution for handling sensitive, region-specific data, traditional FL approaches struggle when local datasets are limited, often leading models to overfit noisy peak fluctuations. Additionally, many regions exhibit stable, periodic consumption behaviors, further complicating the need for a global model that can effectively capture diverse patterns without overfitting. To address these issues, we propose Federated Hybrid Graph Attention Network with Two-step Optimization for Electricity Consumption Forecasting (FedHMGAT), a hybrid modeling framework designed to balance periodic trends and numerical variations. Specifically, FedHMGAT leverages a numerical structure graph with a Gaussian encoder to model peak fluctuations as dynamic covariance features, mitigating noise-driven overfitting, while a multi-scale attention mechanism captures periodic consumption patterns through hybrid feature representation. These feature components are then fused to produce robust predictions. To enhance global model aggregation, FedHMGAT employs a two-step parameter aggregation strategy: first, a regularization term ensures parameter similarity across local models during training, and second, adaptive dynamic fusion at the server tailors aggregation weights to regional data characteristics, preventing feature dilution. Experimental results verify that FedHMGAT outperforms conventional FL methods, offering a scalable and privacy-aware solution for electricity demand forecasting.
1. Introduction
The rapid evolution of smart grid technologies [1] has elevated electricity demand forecasting to a pivotal operational requirement. Although existing approaches predominantly focus on temporal pattern recognition [2,3], the inherently sensitive nature of industrial energy data mandates robust privacy-preserving solutions. Federated learning (FL) emerges as a compelling paradigm, effectively addressing both forecasting accuracy and data confidentiality through decentralized model training [4].
While federated learning (FL) has emerged as a promising distributed machine learning framework for electricity consumption prediction [5], traditional FL approaches face significant challenges when local datasets are limited, often forcing models to overfit noisy peak fluctuations. This issue is further exacerbated by the existence of stable, periodic consumption patterns in many regions, creating a need for a global model capable of capturing diverse patterns without compromising accuracy. The root cause lies in the inherent limitations of client datasets, where sparse historical records frequently fail to represent the full spectrum of consumption behaviors, particularly the irregular and noise-prone extreme peak variations [6]. Such data scarcity compels local models to overfit idiosyncratic noise, severely undermining their generalization to new scenarios [7]. Furthermore, during global model aggregation, a new challenge arises: some client models must adapt to local data with strong periodic trends, while others must handle data dominated by peak fluctuations [8]. This divergence in data characteristics introduces substantial parameter heterogeneity among local models, leading to a critical aggregation problem: when models with excessively varied parameters are combined, their ability to accurately fit client-specific electricity consumption patterns becomes diluted [9].
To address the aforementioned challenges, this paper proposes Federated Hybrid Graph Attention Network with Two-step Optimization for Electricity Consumption Forecasting (FedHMGAT), a hybrid modeling framework designed to enhance cross-regional electricity demand forecasting. By simultaneously optimizing local model training and global model aggregation, FedHMGAT aims to achieve superior adaptability across diverse consumption patterns. At the local model level, FedHMGAT innovates through a hybrid approach: (1) hybrid feature representation, employing a numerical structure graph paired with a Gaussian encoder to dynamically model peak fluctuations as covariance features, effectively suppressing noise-induced overfitting, and (2) hybrid model architecture, integrating a multi-scale attention mechanism that captures periodic consumption behaviors through adaptive feature fusion. These feature components are then fused to produce robust predictions. For global model aggregation, FedHMGAT implements a two-step parameter aggregation strategy: (1) training-stage regularization enforces parameter consistency across local models to mitigate heterogeneity; and (2) server-side adaptive dynamic fusion dynamically adjusts aggregation weights based on regional data characteristics, thereby preserving model discriminability while preventing feature dilution. This integrated approach ensures FedHMGAT’s robustness in handling both periodic consumption trends and volatile peak fluctuations across different regions. Experimental validation confirms FedHMGAT’s superior performance over conventional methods, particularly in handling erratic peak demands and maintaining prediction consistency across distributed clients.
The main contributions of this paper are as follows:
- (1)
- The paper introduces FedHMGAT’s novel hybrid approach for local model training, combining (1) a numerical structure graph with Gaussian encoding to transform volatile peak fluctuations into stable covariance features (reducing noise sensitivity), and (2) a multi-scale attention mechanism that extracts periodic consumption patterns through hierarchical feature fusion. This dual-component architecture enables simultaneous modeling of both erratic peaks and periodic trends while preventing overfitting to local noise.
- (2)
- To address parameter heterogeneity in federated aggregation, FedHMGAT proposes a two-step strategy: (1) regularization during local training aligns model parameters across clients, while (2) server-side dynamic fusion customizes aggregation weights according to regional data characteristics. This preserves specialized feature representations while preventing dilution during global model updates, improving cross-regional generalization.
The structure of this paper is as follows: Section 2 reviews related work on electricity consumption forecasting. In Section 3, we present the proposed FedHMGAT framework. Section 4 provides experimental validation of the effectiveness of the proposed FedHMGAT, while the final section concludes the paper.
2. Related Works
2.1. Traditional Electricity Consumption Prediction Methods
Traditional electricity consumption prediction methods mainly include time-series-based methods, regression-based methods, and gray prediction methods [2]. Time-series methods analyze the historical time-series data of electricity consumption to predict future values. However, these methods assume that data has certain statistical regularities and are sensitive to data outliers [3]. Regression-based methods, like multiple linear regression, establish a functional relationship between electricity consumption and influencing factors [2,10]. But they often face difficulties in dealing with complex nonlinear relationships. Gray prediction methods are suitable for predicting situations with limited data, but their prediction accuracy is relatively low for long-term predictions [11].
2.2. Machine Learning-Based Prediction Methods
With the development of machine learning technology, methods such as neural networks, support vector machines, and random forests have been widely used in electricity consumption prediction [12]. Neural networks, especially deep neural networks, can automatically extract features from data and have strong nonlinear fitting capabilities [13]. For example, the Long Short-Term Memory (LSTM) network can effectively handle time-series data and has achieved good results in electricity consumption prediction [14]. However, these machine-learning-based methods usually require a large amount of centralized data for training, which is difficult to achieve in the face of data islanding problems [3]. The advent of deep learning marked a transformative shift in the field, followed by innovations like multi-scale LSTM architectures for hierarchical feature extraction and Bidirectional LSTM (BiLSTM) models [15], which incorporate bidirectional context to improve short-term forecasting accuracy. Concurrently, frequency-domain methods, such as signal decomposition through Empirical Mode Decomposition (EMD) [16] and Fourier analysis [17], have gained traction. While Fourier-based neural architectures are effective at capturing cyclical patterns, they often struggle with the trade-off between temporal resolution and frequency localization, which can lead to the loss of transient features. Wavelet-based multi-resolution analysis [18] mitigates this issue by using adaptive basis functions tailored for heterogeneous time-series data.
2.3. Federated Learning Applications
Federated learning (FL) has emerged as a privacy-preserving machine learning paradigm that enables collaborative model training across decentralized data sources while maintaining data confidentiality [19]. Unlike traditional centralized approaches, FL employs a client–server architecture where clients (e.g., mobile devices, hospitals, or industrial sensors) train local models using their own data and share only model updates with a central server for aggregation [20]. Key challenges include handling non-IID data distributions, optimizing communication efficiency, and mitigating security vulnerabilities [21]. Recent advances propose solutions such as Federated Averaging (FedAvg) [22], adaptive aggregation algorithms, and differential privacy mechanisms [23], demonstrating FL’s applicability in healthcare, finance, and IoT domains. Smart grids present a compelling use case for FL due to their distributed infrastructure and stringent data privacy requirements [24]. FL enables utilities and consumers to collaboratively train models for electricity demand forecasting and load balancing [25] without centralized data collection.
3. Proposed Methodology
This paper proposes Federated Hybrid Graph Attention Network with Two-step Optimization for Electricity Consumption Forecasting (FedHMGAT) for electricity consumption demand forecasting.
The model structure of FedHMGAT is shown in Figure 1.
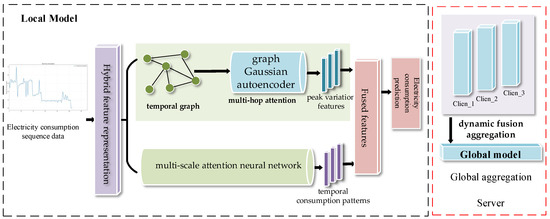
Figure 1.
The structure of the proposed FedHMGAT.
The FedHMGAT methodology workflow is as follows:
- (1)
- Local Model Architecture
- A.
- Hybrid Feature Representation:
- a.
- Constructs numerical structure graphs.
- B.
- Hybrid Model Design:
- a.
- Implements Gaussian encoder for dynamic peak fluctuation modeling, and generates covariance features to suppress noise-induced overfitting.
- b.
- Incorporates multi-scale attention mechanism to capture periodic consumption patterns.
- c.
- Performs adaptive feature fusion for robust predictions.
- (2)
- Two-step Global Optimization
- A.
- Training-stage Regularization to enforce parameter consistency across local models.
- B.
- Server-side Adaptive Fusion.
- (3)
- Integrated Framework Benefits:
- A.
- Simultaneously optimizes local training and global aggregation.
3.1. Problem Formulation and Setup
Federated learning is a decentralized machine learning approach that enables multiple clients to collaboratively train a shared model while keeping their raw data private. In this study, K clients are involved in each communication round, each holding its own private dataset, represented as D = {D1, D2, …, DK}. The primary task for each client is to forecast electricity consumption demand, where the input is a sequence of historical consumption data, denoted as x, and the output is the predicted consumption for the next time slice. Each client is responsible for making predictions based on its own data. The ultimate aim of this federated learning process is to create a globally aggregated model that can accurately predict electricity consumption across all clients, addressing the main objective of the task.
where Li is the loss of the i-th local model. In federated electricity consumption demand forecasting, Ci is the weight of the i-th client, and the distribution of electricity consumption sequence can vary significantly across different clients.
This paper proposes FedHMGAT. The specific process is as follows.
3.2. Electricity Consumption Demand Forecasting Model Construction
For model construction, FedHMGAT is a hybrid modeling framework designed to balance periodic trends and numerical variations. FedHMGAT leverages a numerical structure graph with a Gaussian encoder to model peak fluctuations as dynamic covariance features, mitigating noise-driven overfitting, while a multi-scale attention mechanism captures periodic consumption patterns through hybrid feature representation. The specific details are as follows.
3.2.1. Data Preprocessing and Numerical Structure Graph Construction
In the preprocessing, the feature fusion enhancement is applied, with statistical features calculated using a sliding window to compute the mean/variance. Then, Ensemble Empirical Mode Decomposition (EEMD) is applied to the electricity consumption data to obtain the IMF components. As a result, for each time slice, the data vector f consists of [data, Mean, Variance, IMF1, …, IMFk, Add-features], thus constructing the representation of the electricity consumption data. Add-features are the additional environmental information related to electricity consumption.
Next, the numerical structure graphs for electricity consumption data are constructed in Formula (2).
Let the time series be X = {x1,x2, …, xn} ∈ Rn×d, where each time point xt corresponds to a graph node vt, and the node feature vector is ft = [xt, meant, variancet, IMF1t, …, IMFkt, Add-featurest]. The edges in NumSG models the numerical correlations in the electricity data, represented as E, with the corresponding adjacency matrix A. Specifically, the edge calculation process is the following.
To ensure accuracy in the predicted values while modeling the temporal patterns of electricity consumption, we need to model the numerical correlations during the electricity consumption process. Based on these correlations, we define the feature similarity edges E as follows (Formula (3)):
where sim represents the Cosine similarity. To prevent interference from overly smooth, easily predictable electricity data, we set a threshold τ to filter out the data without obvious volatility, and |t − s| means that the greater the time interval, the weaker the interaction. Then, based on the correlation of this data, we model the numerical relationships in the electricity consumption process.
Next, we design a prediction model based on hybrid graph attention networks.
3.2.2. Hybrid Graph Attention Network for Electricity Consumption Demand Forecasting
FedHMGAT designs a hybrid graph attention mechanism to model the constructed electricity consumption features.
- (1)
- For modeling peak fluctuations in numerical structure graphs:
FedHMGAT designs a graph Gaussian autoencoder based on multi-hop attention to model the numerical features of electricity consumption. The multi-hop attention-based encoder designed in this paper is divided into 3 hops, filtering out the features most closely related to the current electricity consumption value.
- ➢
- First Hop: Numerical Correlation Information Filtering
Taking the attention features of node i as an example, the graph nodes of the input numerically correlated graph are first globally scanned to calculate the preliminary attention weights, and then significant regions or nodes are selected.
Here, A is the adjacency matrix, f is the feature, and T is the Transposition operation.
- ➢
- Second Hop: Dependency Relationship Modeling
Based on the results of the first hop, the substructures within the selected regions are further analyzed.
Here, W is a learnable mask matrix that is randomly initialized.
- ➢
- Third Hop: Higher-order Reasoning Integration as parameterized Gaussian distribution
The multi-hop results are aggregated through a gating mechanism to form the final attention distribution.
Here, W1 and W2 are learnable parameters, and the features are parameterized as the mean and covariance of a Gaussian distribution. The decoder subsequently reconstructs attention-enhanced representations by synthesizing these weighted associations.
- (2)
- Multi-scale attention mechanism captures periodic consumption patterns:
A multi-scale self-attention neural network is designed to extract attention features at different scales, modeling temporal features with varying time series lengths. Specifically, FedHMGAT leverages a multi-scale attention network to extract multi-scale attention features; it contains three scales, and for the first scale, the attention feature is calculated as Formula (7):
where the ADJ(i, 1) means the 1 scale adjacent neighbor of the fi, W(1) is the learnable weight, and SLP is a neural network used for calculating the attention feature. Then, the multi-scale attention feature can be calculated as Formula (8):
where the Concat operation concatenates the feature vectors.
3.2.3. Electricity Consumption Forecasting Based on All Components
After the above steps, the final forecasting for the electricity consumption data is calculated by synthetizing the 2 forecasted components, as shown in Formula (9).
Here, SLP_layer is a fully connected output layer that outputs the prediction result, with representing the element-wise product of Z and the feature. The goal of the task is to minimize the following loss as Formula (10).
3.3. Two-Step Parameter Aggregation Strategy for Global Model
For global model aggregation, FedHMGAT implements a two-step parameter aggregation strategy: (1) training-stage regularization enforces parameter consistency across local models to mitigate heterogeneity; and (2) server-side adaptive dynamic fusion dynamically adjusts aggregation weights based on regional data characteristics, thereby preserving model discriminability while preventing feature dilution.
- (1)
- Training-Stage Regularization
This component addresses client-side model divergence by introducing constrained optimization. The key insight is that while local models need to adapt to regional data distributions, their parameter spaces should not deviate excessively from the global consensus. Therefore, we introduce the regularized loss function:
where D(·||·) is the Bregman divergence measuring parameter deviation, and adaptive coefficient λ = λmax·(1 − t/T). Based on this regularized loss, the parameter update can be calculated as follows:
The gradient ∇D pushes local parameters toward global consensus while preserving local feature extraction capability.
- (2)
- Server-side adaptive dynamic fusion
This mechanism aims to solve the feature dilution where naive averaging degrades model discriminability. It employs sequence-entropy-aware weighting that considers both statistical and topological characteristics of regional data. For each client, it calculates the region characterization vector:
where are the parameters of the SLP layer in Formula (9) in the i-th client, and λj is the j-th sequence entropy; we choose the top 10 entropies. Based on the region characterization vector, the adaptive weight can be expressed as:
where β is the scaling factor β = log(Ni/ΣNj). Therefore, the global aggregation can be calculated:
where is the hyper-parameter and is set to 0.05 in this paper.
4. Experiments
Our experiments evaluate three key conclusions through comparative analyses: (1) the proposed FedHMGAT performs better than benchmarks for prediction, (2) the proposed dual-branch graphs exhibit advantages over conventional sequential modeling approaches, and (3) the similarity-based adaptive parameter aggregation is effective for alleviating the parameter inconsistency.
4.1. Dataset and Experiment Settings
This paper employs the experiments using three datasets.
- (1)
- The Individual Household Electric Power Consumption Dataset (Data_IHE) records a Parisian family’s electricity usage over nearly four years (December 2006–November 2010) with minute-level sampling, containing detailed attributes including date (dd/mm/yyyy format), time (hh:mm format), global_active_power (minute-averaged active power in kilowatts), global_reactive_power (minute-averaged reactive power in kilowatts), voltage (minute-averaged in volts), global_intensity (minute-averaged current in amperes), and three sub-metering measurements—sub_metering_1 (kitchen appliances like dishwasher, oven, and microwave in watt-hours), sub_metering_2 (laundry room equipment including washing-machine, tumble-drier, refrigerator, and light in watt-hours), and sub_metering_3 (electric water-heater and air-conditioner consumption in watt-hours). Seven of the above nine attributes can be used as features; date and time are removed. The last three attributes are not the electricity consumption of all the circuits in the home. The total electric energy consumptions can be calculated by the following formula:
The consumption trends are visualized in Figure 2. Here, the X-axis indicates the number of collected data points, and the Y-axis represents normalized electricity consumption.
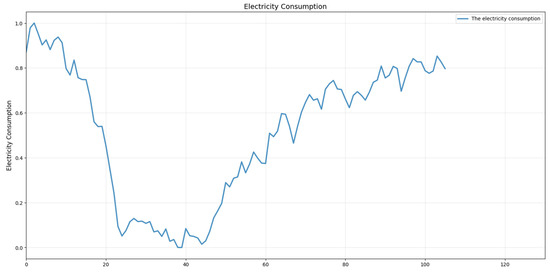
Figure 2.
Electricity consumption data in Data_IHE.
- (2)
- The electricity consumption dataset from Tetouan, Morocco (Kaggle: Electric Power Consumption [26]) comprises 52,416 observations recorded at 10 min intervals (Data_Kaggle), each characterized by nine features: timestamp (10 min window), ambient temperature, relative humidity, wind speed, and general diffuse flows—a term describing low-temperature fluid emissions (<0.2 °C to ~100 °C) typically associated with geological formations like sulfide mounds and bacterial mats. The dataset also includes power consumption metrics for three designated zones (Zones 1–3), while environmental variables (temperature, humidity, wind speed, and diffuse flows) serve as auxiliary attributes in feature vector f. Zone 3 consumption trends are visualized in Figure 3. Here, the X-axis indicates the number of collected data points, and the Y-axis represents normalized electricity consumption.
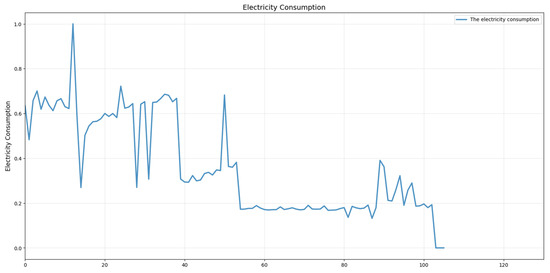 Figure 3. Electricity consumption data in Zone 3.
- (3)
- The second electricity consumption dataset is obtained from the five regions of China Southern Power Grid’s operational jurisdiction (1 December–31 May 2025) across seven administrative divisions (Data_Southern) (https://pan.baidu.com/s/1F7diPhFfdCIZG01tmRIOeg?pwd=r2vy, accessed on 5 July 2025). The electricity consumption data comes from five regions of the Southern Power Grid, with hourly level consumption records for each region. The user structure, including industries, residents, and others, varies across different regions, resulting in distinct electricity consumption distribution characteristics. Figure 4 shows the consumption data in a region of the China Southern Power Grid, including May Day holiday. Here, the X-axis indicates the number of collected data points (this dataset employs an hour-window), and the Y-axis represents normalized electricity consumption.
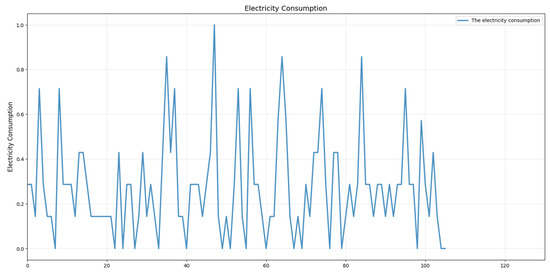 Figure 4. Consumption data in an area of the China Southern Power Grid.
As shown in Figure 4, the electricity consumption data exhibits approximate periodicity and peak variations.
These 3 datasets can be used for electricity prediction tasks. In experiments, the first dataset consists of minute-level electricity consumption data, the second dataset contains electricity consumption data from three different regions, while the third dataset contains electricity consumption data from five different regions. To construct the federated learning data framework, we split the first dataset by year using each half-year period as a local dataset, resulting in eight local datasets in total. For the second and third datasets, we divided the original sampling period into two parts (converting the 15 min sampling window into 30 min windows, thereby splitting into two datasets), thus transforming Data_Kaggle into six local datasets and Data_Southern into ten local datasets, and we used these three datasets to validate the effectiveness of the algorithm proposed in this paper.
4.2. Baselines
This paper employs a set of benchmark models under FL to evaluate and compare their performance.
- (1)
- The first group combines common electricity consumption forecasting methods with typical federated learning frameworks such as Average Federated Learning AvgFL and Correlation-Based Active Client Selection Strategy FedCor, forming models like AvgFL-SVR, AvgFL-BiLSTM, AvgFL-Multi-Scale attention model (AvgFL-MSattention), FedCor-SVR, FedCor-BiLSTM, and FedCor-Multi-Scale attention model (FedCor-MSattention). Among these, SVR refers to the Support Vector Regression model, BiLSTM refers to the Bidirectional LSTM model, and Multi-Scale attention model refers to the Multi-Scale Attention model.
- (2)
- CNN-LSTM FED [27]: This is a forecasting model based on the augmented Smart* dataset. In this study, electricity consumption data is generated using GANs (Generative Adversarial Networks) to alleviate the overfitting problem of client data through data augmentation.
- (3)
- Adaptive Stacked LSTM [28]: This framework for energy consumption forecasting leverages adaptive learning, federated learning, and edge computing concepts.
- (4)
- SparseMoE [29]: The expert network of the Mixture of Experts (MoE) architecture is implemented through a transformer-based deep learning model called Metaformer. It utilizes Exponential Moving Average (EMA) operations and pooling operators for prediction.
4.3. Discussion on FedHMGAT
4.3.1. Validation on Data_IHE
For electricity consumption prediction, we verify the effectiveness of FedHMGAT using the Data_IHE. Table 1 and Figure 5 record the prediction results, showing the electricity consumption forecasts.

Table 1.
Test MSE of electricity consumption in Data_IHE. The number should be bold to show the best results.
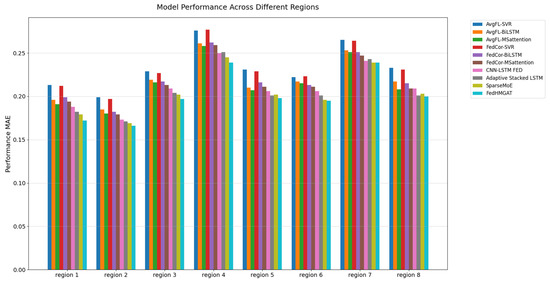
Figure 5.
Test MAE of electricity consumption in Data_IHE dataset.
The results in Table 1 and Figure 5 for the Data_IHE dataset confirm that the proposed FedHMGAT achieves the lowest MSE and MAE across all regions. FedHMGAT outperforms traditional federated learning methods such as FedCor and AvgFL. Additionally, FedHMGAT performs better than data-augmented FL methods like CNN-LSTM FED and adaptive FL methods such as Adaptive Stacked LSTM.
Next, we provide a detailed description of the experiments, including an analysis of how the global model influences the local model, thereby validating that the aggregation of the global model positively enhances learning on local data. The experimental results are given in Table 2.
Table 2.
The influence of the global model for clients (Test MSE) on Data_IHE. The number should be bold to show the best results.
As Table 2 shows, FedHMGAT-local means the FedHMGAT which uses a local model without global aggregation. FedHMGAT outperforms FedHMGAT-local, which verifies that the aggregation of the global model positively enhances learning on local data.
4.3.2. Validation on Data_kaggle
For electricity consumption prediction, we verify the effectiveness of FedHMGAT using the Tetouan-Electricity-Consumption data (Data_kaggle). Table 3 and Figure 6 record the prediction results, showing the electricity consumption forecasts.
Table 3.
Test MSE of electricity consumption in Tetouan-Electricity-Consumption dataset. The number should be bold to show the best results.
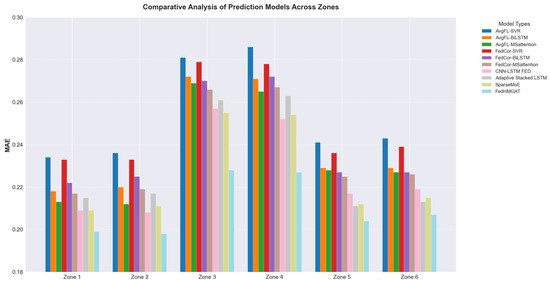
Figure 6.
Test MAE of electricity consumption in Tetouan-Electricity-Consumption dataset.
The results in Table 2 and Figure 6 for the Tetouan-Electricity-Consumption dataset confirm that the proposed FedHMGAT achieves the lowest MSE and MAE across all zones. FedHMGAT outperforms traditional federated learning methods such as FedCor and AvgFL. Additionally, FedHMGAT performs better than data-augmented FL methods like CNN-LSTM FED and adaptive FL methods such as Adaptive Stacked LSTM. Next, we provide an analysis of how the global model influences the local model, thereby validating that the aggregation of the global model positively enhances learning on local data. The experimental results are given in Table 4.
Table 4.
The influence of the global model for clients (Test MSE) on Data_kaggle. The number should be bold to show the best results.
As Table 4 shows, FedHMGAT-local means the FedHMGAT which uses a local model without global aggregation. FedHMGAT outperforms FedHMGAT-local, which verifies that the aggregation of the global model positively enhances learning on local data.
4.3.3. Validation on Data_Southern
In the following experiments, we show the forecasting performance of the FedHMGAT on the electricity consumption data in the China Southern Power Grid dataset. Table 5 shows the forecasting performance of the FedHMGAT using the electricity consumption data in the China Southern Power Grid dataset. The results are presented in Table 5 in terms of the MSE, and the test MAE is shown in Figure 7.
Table 5.
The global MSE of the FedHMGAT model on the China Southern Power Grid dataset. The number should be bold to show the best results.
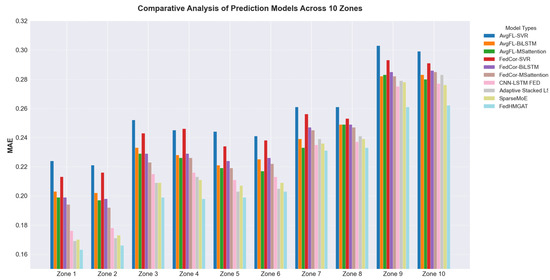
Figure 7.
Test MAE of electricity consumption in the China Southern Power Grid dataset.
As evidenced in Table 5 and Figure 7, FedHMGAT achieves the lowest MSE and MAE across all zones. This performance underscores FedHMGAT’s enhanced capability in data fitting and predictive accuracy compared to conventional electricity consumption forecasting frameworks. Next, we provide an analysis of how the global model influences the local model, thereby validating that the aggregation of the global model positively enhances learning on local data. The experimental results are given in Table 6.
Table 6.
The influence of the global model for clients (Test MSE) on Data_Southern. The number should be bold to show the best results.
As Table 6 shows, FedHMGAT-local means the FedHMGAT which uses a local model without global aggregation. FedHMGAT outperforms FedHMGAT-local, which verifies that the aggregation of the global model positively enhances learning on local data.
4.3.4. Discussion
The experimental results verify the performance of the proposed FedHMGAT model in electricity consumption forecasting across three datasets. FedHMGAT consistently achieves the lowest MSE and MAE values compared to baseline models, including traditional FL methods (AvgFL and FedCor), data-augmented approaches (CNN-LSTM FED), and adaptive frameworks (Adaptive Stacked LSTM and SparseMoE). Notably, FedHMGAT exhibits robust predictive accuracy during consumption spikes and periodic fluctuations. This performance advantage stems from FedHMGAT’s enhanced ability to model baseline consumption patterns while dynamically capturing anomalous peaks, validating its effectiveness in federated learning environments with heterogeneous client data. The model’s generalizability is further confirmed by its consistent outperformance across all geographic zones, underscoring its potential for real-world deployment in diverse energy distribution systems.
4.4. Ablation Experiments for FedHMGAT
To validate the efficacy of the proposed FedHMGAT framework, we conduct ablation studies targeting its core components: the numerical structure graph, the Gaussian Graph Attention Autoencoder for modeling peak variations, and the fusion aggregation method. Four ablated variants are evaluated: (1) FedHMGAT-temproal (removing the numerical structure graph), (2) FedHMGAT-AE (replacing the Gaussian Graph Attention Autoencoder with AE), (3) FedHMGAT-Avg (replacing the dynamic fusion aggregation method with standard AvgFL), and (4) FedHMGAT-AttAE (substituting hierarchical encoding with conventional attention mechanisms). These variants are benchmarked against the full FedHMGAT model for electricity consumption forecasting. The experimental results are as follows.
As Table 7 shows, the experiments quantify the individual contributions of each architecture to overall performance. The designed components improve the performances for electricity consumption forecasting.
Table 7.
The ablation MSE of FedHMGAT on the China Southern Power Grid dataset. The number should be bold to show the best results.
5. Conclusions
This paper verifies that FedHMGAT fundamentally addresses the dual challenges of data scarcity-induced overfitting and parameter heterogeneity in federated electricity consumption forecasting. Three key contributions emerge from our work: First, the hybrid architecture successfully reconciles the conflicting demands of modeling periodic patterns (through multi-scale attention) and volatile peaks (via Gaussian-encoded graph features), achieving MAE reduction compared to baseline FL methods in peak-heavy regions. Second, the two-step aggregation strategy proves critical in resolving the “feature dilution dilemma”, as evidenced by cross-regional validation. Third, the framework establishes a new paradigm for FL applications in energy systems, where heterogeneous data distributions are the norm rather than the exception. The effectiveness of FedHMGAT carries important implications: (1) For practitioners, it provides a deployable solution that accommodates both grid-operated regions (with strong periodicity) and industrial zones (dominated by erratic demand), requiring no client-side data sharing. (2) For researchers, the covariance feature encoding technique opens new avenues for noise-resistant FL implementations beyond energy domains. Future work will explore lightweight variants for edge devices and extend the hybrid approach to probabilistic forecasting scenarios.
Author Contributions
Conceptualization, L.Z.; methodology, H.Y., X.J. and L.Z.; software, H.Y., X.J. and Q.L.; validation, H.Y., X.J., Q.L. and H.D.; investigation, Y.A.; data curation, Q.L., Y.A. and H.D.; writing—original draft, L.Z.; writing—review and editing, L.Z.; visualization, Y.A. All authors have read and agreed to the published version of the manuscript.
Funding
This work was supported by the Science and Technology Project of China Southern Power Grid Co. Ltd. (035900KK52222003).
Institutional Review Board Statement
Not applicable.
Informed Consent Statement
Not applicable.
Data Availability Statement
The data supporting this study’s findings are available.
Conflicts of Interest
Authors Hao Yang, Xinwu Ji and Qingchan Liu were employed by the company China Southern Power Grid. Authors Lukun Zeng, Yuan Ai and Hang Dai were employed by the company China Southern Power Grid Digital Grid Group Co., Ltd. The remaining authors declare that the research was conducted in the absence of any commercial or financial relationships that could be construed as a potential conflict of interest. The authors declare that this study received funding from Science and Technology Project of China Southern Power Grid Co. Ltd. The funder was not involved in the study design, collection, analysis, interpretation of data, the writing of this article or the decision to submit it for publication.
References
- González, A.M.; Roque, A.S.; García-González, J. Modeling and forecasting electricity prices with input/output hidden Markov models. IEEE Trans. Power Syst. 2005, 20, 13–24. [Google Scholar] [CrossRef]
- Yildiz, B.; Bilbao, J.I.; Sproul, A.B. A review and analysis of regression and machine learning models on commercial building electricity load forecasting. Renew. Sustain. Energy Rev. 2017, 73, 1104–1122. [Google Scholar] [CrossRef]
- Bhattarai, B.P.; Paudyal, S.; Luo, Y.; Mohanpurkar, M.; Cheung, K.; Tonkoski, R.; Hovsapian, R.; Myers, K.S.; Zhang, R.; Zhao, P.; et al. Big data analytics in smart grids: State-of-the-art, challenges, opportunities, and future directions. IET Smart Grid 2019, 2, 141–154. [Google Scholar] [CrossRef]
- Hu, J.; Harmsen, R.; Crijns-Graus, W.; Worrell, E.; van den Broek, M. Identifying barriers to large-scale integration of variable renewable electricity into the electricity market: A literature review of market design. Renew. Sustain. Energy Rev. 2018, 81, 2181–2195. [Google Scholar] [CrossRef]
- Kairouz, P.; McMahan, H.B.; Avent, B.; Bellet, A.; Bennis, M.; Bhagoji, A.N.; Bonawitz, K.; Charles, Z.; Cormode, G.; Cummings, R.; et al. Advances and open problems in federated learning. Found. Trends® Mach. Learn. 2021, 14, 1–210. [Google Scholar] [CrossRef]
- Bousbiat, H.; Bousselidj, R.; Himeur, Y.; Amira, A.; Bensaali, F.; Fadli, F.; Mansoor, W.; Elmenreich, W. Crossing roads of federated learning and smart grids: Overview, challenges, and perspectives. arXiv 2023, arXiv:2304.08602. [Google Scholar] [CrossRef]
- Silva, F.A.; Orang, O.; Erazo-Costa, F.J.; Silva, P.C.; Barros, P.H.; Ferreira, R.P.; Guimarães, F.G. Time Series Classification Using Federated Convolutional Neural Networks and Image-Based Representations. IEEE Access 2025, 13, 56180–56194. [Google Scholar] [CrossRef]
- Cheng, X.; Li, C.; Liu, X. A review of federated learning in energy systems. In Proceedings of the 2022 IEEE/IAS Industrial and Commercial Power System Asia (I&CPS Asia), Shanghai, China, 8–11 July 2022; pp. 2089–2095. [Google Scholar]
- Yang, Q.; Liu, Y.; Chen, T.; Tong, Y. Federated machine learning: Concept and applications. ACM Trans. Intell. Syst. Technol. (TIST) 2019, 10, 1–19. [Google Scholar] [CrossRef]
- Mohd Nizam, M.A.; Sulaiman, S.A.; Ramli, N.A. Predictive Model for Electricity Consumption in Malaysia Using Support Vector Regression. In International Conference on Electrical, Control & Computer Engineering; Springer: Singapore, 2024. [Google Scholar] [CrossRef]
- Chen, H.Y.; Lee, C.H. Electricity consumption prediction for buildings using multiple adaptive network-based fuzzy inference system models and gray relational analysis. Energy Rep. 2019, 5, 1509–1524. [Google Scholar] [CrossRef]
- Gomez, W.; Wang, F.K.; Amogne, Z.E. Electricity Load and Price Forecasting Using a Hybrid Method Based Bidirectional Long Short-Term Memory with Attention Mechanism Model. Int. J. Energy Res. 2023, 2023, 3815063. [Google Scholar] [CrossRef]
- Wang, W.; Shimakawa, H.; Jie, B.; Sato, M.; Kumada, A. BE-LSTM: An LSTM-based framework for feature selection and building electricity consumption prediction on small dataset. J. Build. Eng. 2025, 102, 111910. [Google Scholar] [CrossRef]
- Imani, M. Electrical load-temperature CNN for residential load forecasting. Energy 2021, 227, 120480. [Google Scholar] [CrossRef]
- Wang, S.; Wang, X.; Wang, S.; Wang, D. Bi-directional long short-term memory method based on attention mechanism and rolling update for short-term load forecasting. Int. J. Electr. Power Energy Syst. 2019, 109, 470–479. [Google Scholar] [CrossRef]
- Lotfipoor, A.; Patidar, S.; Jenkins, D.P. Deep neural network with empirical mode decomposition and Bayesian optimisation for residential load forecasting. Expert Syst. Appl. 2024, 237, 121355. [Google Scholar] [CrossRef]
- Gashler, M.; Ashmore, S. Modeling time series data with deep Fourier neural networks. Neurocomputing 2016, 188, 3–11. [Google Scholar] [CrossRef]
- Liu, Y.; Guan, L.; Hou, C.; Han, H.; Liu, Z.; Sun, Y.; Zheng, M. Wind Power Short-Term Prediction Based on LSTM and Discrete Wavelet Transform. Appl. Sci. 2019, 9, 1108. [Google Scholar] [CrossRef]
- Liang, F.; Zhang, Z.; Lu, H.; Leung, V.; Guo, Y.; Hu, X. Communication-efficient large-scale distributed deep learning: A comprehensive survey. arXiv 2024, arXiv:2404.06114. [Google Scholar]
- Huang, W.; Wang, D.; Ouyang, X.; Wan, J.; Liu, J.; Li, T. Multimodal federated learning: Concept, methods, applications and future directions. Inf. Fusion 2024, 112, 102576. [Google Scholar] [CrossRef]
- Jia, N.; Qu, Z.; Ye, B.; Wang, Y.; Hu, S.; Guo, S. A comprehensive survey on communication-efficient federated learning in mobile edge environments. IEEE Commun. Surv. Tutor. 2025. Early access. [Google Scholar] [CrossRef]
- Sun, T.; Li, D.; Wang, B. Decentralized federated averaging. IEEE Trans. Pattern Anal. Mach. Intell. 2022, 45, 4289–4301. [Google Scholar] [CrossRef]
- Geyer, R.C.; Klein, T.; Nabi, M. Differentially private federated learning: A client level perspective. arXiv 2017, arXiv:1712.07557. [Google Scholar]
- Venkataramanan, V.; Kaza, S.; Annaswamy, A.M. DER forecast using privacy-preserving federated learning. IEEE Internet Things J. 2022, 10, 2046–2055. [Google Scholar] [CrossRef]
- Ahmadi, A.; Talaei, M.; Sadipour, M.; Amani, A.M.; Jalili, M. Deep federated learning-based privacy-preserving wind power forecasting. IEEE Access 2022, 11, 39521–39530. [Google Scholar] [CrossRef]
- Electric Power Consumption. Available online: https://www.kaggle.com/datasets/fedesoriano/electric-power-consumption (accessed on 1 March 2017).
- de Moraes Sarmento, E.M.; Ribeiro, I.F.; Marciano, P.R.N.; Neris, Y.G.; de Oliveira Rocha, H.R.; Mota, V.F.S.; da Silva Villaça, R. Forecasting energy power consumption using federated learning in edge computing device. Internet Things 2024, 25, 101050. [Google Scholar] [CrossRef]
- Abdulla, N.; Demirci, M.; Ozdemir, S. Smart meter-based energy consumption forecasting for smart cities using adaptive federated learning. Sustain. Energy Grids Netw. 2024, 38, 101342. [Google Scholar] [CrossRef]
- Wang, R.; Bai, L.; Rayhana, R.; Liu, Z. Personalized federated learning for buildings energy consumption forecasting. Energy Build. 2024, 323, 114762. [Google Scholar] [CrossRef]
Disclaimer/Publisher’s Note: The statements, opinions and data contained in all publications are solely those of the individual author(s) and contributor(s) and not of MDPI and/or the editor(s). MDPI and/or the editor(s) disclaim responsibility for any injury to people or property resulting from any ideas, methods, instructions or products referred to in the content. |
© 2025 by the authors. Licensee MDPI, Basel, Switzerland. This article is an open access article distributed under the terms and conditions of the Creative Commons Attribution (CC BY) license (https://creativecommons.org/licenses/by/4.0/).