Abstract
The requirement for energy transition through the residential sector has increased research on the dissemination of solar thermal power systems in this area. Parabolic Trough Collector (PTC), as one of the matured solar technologies for thermal power generation, has shown huge potential in meeting demands for heating and domestic hot water systems. In this experimental study, several small-scale PTCs have been developed with four alternative absorber shapes: a simple cylindrical absorber, a spiral absorber, and two different configurations of a sinusoidal absorber to examine their performance under domestic application (non-evacuated and non-tracking). The study aims to analyze the applicability of such systems to be used as a water-heating source in buildings and compare the performance of the proposed configurations in terms of thermal efficiency to find the most appropriate design. The experimental results revealed that the simple shape provides a minimum average thermal efficiency of 24%, while the maximum thermal efficiency of 32% is obtained with the spiral shape. Studying various orientations of the sinusoidal shape revealed that thermal efficiencies of 30% and 20% could be achieved using the parallel and the perpendicular shapes, respectively. Finally, a concise economic and environmental analysis is performed to study the proposed systems as solutions for domestic water heating applications, which highlights the suitability of PTCs for integration with future sustainable buildings.
1. Introduction
Solar energy, recognized as a clean, green, renewable, and abundant energy source, is vital for the world to combat the energy crisis and to achieve GHG emission reductions [1]. Solar water heating (SWH) systems are one of the common solar applications that have been widely used for residential, commercial, and industrial purposes [2]. The latest statistics show that 84% of water cooling and heating energy relies on fossil fuels, with only 16% from renewables [3].
More recently, concentrating solar collectors have attracted more attention over other collector technologies, primarily because of their superior efficiency and heat transfer rates. Utilizing concentrating systems such as PTC offers several advantages in the power and energy sectors, including adaptability to various purposes and higher energy production. These benefits have notable economic, social, and environmental implications [4]. In a typical PTC, solar irradiation is concentrated onto the absorber tube using a reflective concentrator. The absorbed thermal energy is subsequently conveyed by a running fluid inside the receiver tube, producing useful heat through the system [5].
Principally, PTCs are applied to medium to high-temperature systems in CSP and (concentrating solar thermal) CST sectors, which fundamentally require sun tracking and an evacuated enclosure for the absorbers [6]. However, as far as PTC applications are concerned for domestic water heating, where the temperature range is low (<100 °C), stationary and non-evacuated systems could be applied in order to reduce the technology costs and simplify the operation [7]. In this regard, scientists have used stationary PTCs in applications with modest requirements for efficiency and temperature [8]. Under these circumstances, the employment of enhancement techniques (on the absorber unit) could be beneficial in keeping PTC operations at high-efficiency levels. In this context, the boosting technologies can be divided into optical and thermal modifications [9]. The second approach usually deals with the reduction in the collector thermal losses or the increase in the heat convection coefficient inside the flow. In this regard, flow modification is one of the promising methods, which provides lower receiver temperature and leads to lower thermal losses. For this aim, either modifying the absorber tubes or equipping them with an insert gives a special structure to disrupt normal flowing patterns. However, thermal enhancement techniques obtained by absorber modifications correspond to a relatively minimal pressure drop penalty compared to flow inserts [10].
Focusing on previous studies where modified shapes of the receiver are investigated, Mustafa et al. [11] studied a helical absorber design for double-fluid PTCs using non-Newtonian nanofluids. The study highlighted the superior efficiency of PTCs equipped with helical absorber tubes, achieving a maximum efficiency of 58.2% with 4% nanofluid volume fraction and 50 nm nanoparticle diameter at a Reynolds number of 5000. Djenane et al. [12] utilized a circular–trapezoidal shape for the receiver absorber tube and showed a notable increase in efficiency, which reached 5% at a 0.5 degree deviation angle. Bitam et al. [13] conducted a numerical investigation of a sinusoidal tube receiver in PTC technology. The study highlighted the potential of the S-curved/sinusoidal tube designs in improving the collector performance, achieving a 63% and 48% increase in fluid Nu and friction factor. In the case of experimental works, Babapour et al. [14] studied the effects of a helically corrugated absorber on PTC performance. The obtained results show a significant improvement of the Nu and the friction factor by about 220% and 145%, respectively. Al-Rabeeah et al. [15] proposed a PTC with double-evacuated absorber tubes and flat plates to increase thermal efficiency by about 53% and 59% at 60 L/h and 120 L/h working fluid mass flow rates, respectively. Nain et al. [16] investigated the performance of a U-shaped absorber within a PTC air heater. The copper and aluminum absorbers were placed inside the evacuated tubes, while employing the fins led to further improvements in the system. Results indicated a maximum increase of 9.29% in thermal efficiency, achieved by the copper absorber. In further studies, scientists have explored more alternative designs such as V-cavity receivers [17], corrugated tubes [18], asymmetric outward convex corrugated tubes [19], helical coil absorbers [20], and tube-bundle cavities [21].
Using water as the Heat Transfer Fluid (HTF) in PTCs has also been studied for a wide range of applications. Bortolato et al. [22] used water to examine a flat bar-and-plate PTC absorber for process heat and direct steam generation and achieved a thermal efficiency of 64%. A water-based nanofluid (multi-walled carbon nanotube) was employed with a PTC, and results were compared with the distilled water. Experimental results demonstrated that the proposed nanofluid enables an 11% increase in the collector thermal efficiency [23]. Vengadesan et al. [24] evaluated experimentally a PTC operating with water as the HTF. Utilizing a modified absorber with a semicircular multitube design, the thermal and exergy efficiencies were improved, respectively, by 43.9% and 33.6%, than conventional ones. Upadhyay et al. [25] developed a small-scale PTC for low-temperature water heating applications and tested it under manual tracking without a glass cover, manual tracking with a glass cover, and automatic tracking without a glass cover. Results indicated a thermal efficiency range of 11 to 15% based on various working conditions, and a payback period of 4–5 years was estimated for the system. Further environmental analyses revealed that PTC applications for domestic water heating led to annual CO2 reduction ranging from 0.18 to 0.21 (tCO2e), while the carbon credit earned per year is 330 to 370 INR.
Building upon the literature works in the field of water-based PTC systems for SWH purposes, this study aims to consider a small-scale non-evacuated PTC for a residential application and assess its operation with stationary conditions. The results obtained from these experiments will clarify the plausibility of the proposed system as a new solution for energy transition in the residential sector. To compensate for lower efficiency during stationary and non-evacuated operations, several novel tubular absorber configurations have been proposed and implemented in this study. These experiments examine and compare the effects of three alternative receiver designs, such as a spiral absorber, sinusoidal absorbers with two orientations, as well as the conventional design on PTC performance. Therefore, a set of experiments was designed to assess the operation of the proposed stationary and non-evacuated PTCs under real weather conditions in the region of Gabes in Tunisia.
2. Solar Collector
Figure 1 shows a prototype photograph, in which the solar collector consists of a parabolic mirror to reflect sunlight onto a receiver tube, and a metallic tubular absorber with a transparent cylindrical glazing to control thermal losses. The manufactured parabolic concentrator has dimensions of 1 m × 1 m, providing an aperture area of 1 m2. To enhance the reflective properties of the parabolic concentrator, aluminum duct tape was applied to its surface. This material was chosen due to its high reflectivity, which improves the efficiency of sunlight concentration onto the receiver tube. The smooth surface of the tape ensures minimal optical loss and maximizes the amount of solar radiation captured. In our case, the receiver was provided by a copper tube, with a length of 1 m and a diameter of 10 mm for the simple configuration, as detailed in Table 1. A black paint was applied to the copper tubes to maximize the amount of solar absorption on the receiver unit [26]. Moreover, the absorber was partially designed to minimize heat losses from the receiver tube, using a glass tube with an outer diameter of 50 mm. This helps maintain a controlled environment and ensures an efficient heat transfer to the water. The collector assembly was securely installed on a support structure that allows for daily adjustments in tilt angles, see Figure 1. The test structure was installed in the Gabes region, Tunisia, which is characterized by latitude and longitude coordinates of 33°52′53.26″ N and 10°05′53.52″ E, respectively. Experimental tests were performed during March and April of 2023, ranging from 09:15 am to 04:15 pm. To avoid any obstructions in solar absorption, the collector was strategically placed in an open area to capture the maximum available radiation. Distilled water was used as the HTF, running in a closed circuit using a centrifugal pump. The use of distilled water is necessary to prevent the deposition of scale and limestone on the inner wall of the copper tubes.
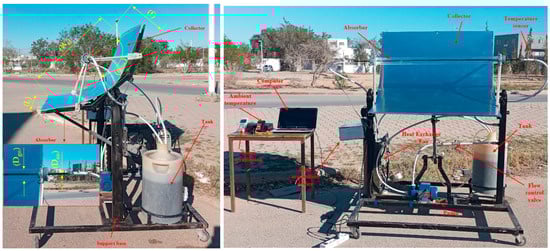
Figure 1.
Photograph of the experimental test rig with the studied PTC prototype.

Table 1.
Parameters and specifications of the studied PTC.
Alternative designs, including spiral absorber and sinusoidal absorber with two orientations, as well as the standard design, are shown in Figure 2. The simple absorber configuration (C1) was positioned similarly to the conventional PTC designs, along the focal line of the parabolic trough. The spiral absorber configuration (C2) involves a cylindrical absorber tube coiled in a spiral pattern containing 76 rings. This design maximizes the effective length of the absorber within the constraints of the receiver’s dimensions. The sinusoidal absorber configurations (C3 or C4) provide a sinusoidal-shaped absorber, which contains seven wave cycles. Although the surface extension is medium in this design, oscillations induced in flow direction are beneficial, due to the emergent secondary flow (vortex), which promotes the heat transfer augmentation [13]. In more detail, C3 represents the parallel sinusoidal absorber, indicating the shape of the absorber aligned parallel with the concentrator at a 0° angle, while C4 represents the perpendicular sinusoidal absorber, signifying the tube oriented perpendicular to the concentrator at a 90° angle. For the alternative absorber configurations, the copper was selected as the material, while a diameter of 10 mm remained in the designs but with different effective lengths based on each design, which have been reported in Table 2.
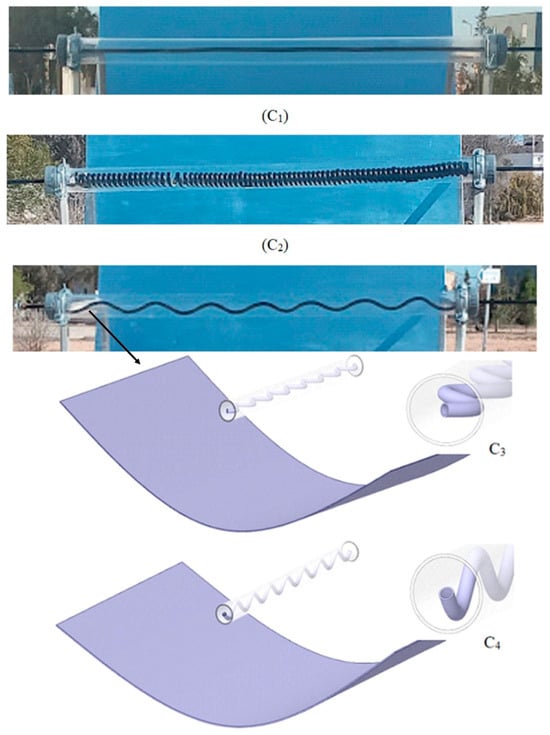
Figure 2.
Different absorber designs: (C1) simple, (C2) spiral, (C3 or C4) sinusoidal.
Table 2.
Specifications of different absorber configurations for the studied PTC.
3. Methodology
3.1. Experimental Setup
A data acquisition system and several measuring instruments were used to evaluate the PTC performance, as shown in Figure 3. In this regard, the ambient temperature was measured using a digital thermometer, while the global solar radiation was measured by a solarimeter, and the water temperature at the inlet and the outlet of the receiver were measured using two temperature sensors connected to an Arduino microcontroller. Furthermore, the fluid flow rate was obtained by a flowmeter, with a range from 0 to 8 L/min. In addition, the installation contains a 20 L capacity tank to store the water circulating in a closed circuit, an accelerating water centrifugal pump (370 W) to ensure the flow in the closed circuit, as well as a water cooling system (radiator + fan) with pipes and connection fittings.
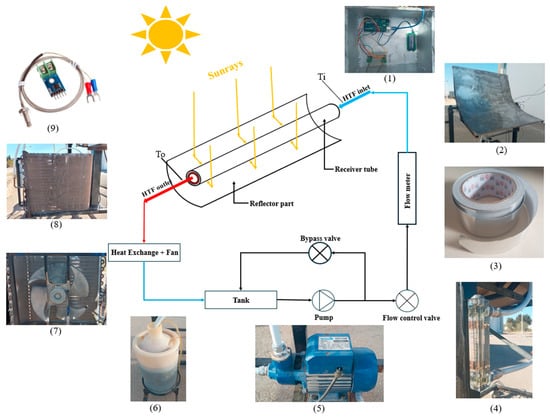
Figure 3.
Layout and photographs of the instrumentation and various measuring tools used in this study, including (1) data acquisition device, (2) PTC, (3) aluminum duct tape, (4) flow meter, (5) pump, (6) water tank, (7) fan, (8) radiator, and (9) temperature sensor.
Table 3 summarizes the experimental details for the different absorber configurations, including the corresponding test dates. The experiments were conducted on various dates, allowing for a comparison of performance under different environmental conditions.
Table 3.
Experimental details and test dates for different absorber configurations.
3.2. Data Analysis
3.2.1. Beam Radiation on the Collector Surface
One of the critical steps in evaluating the stationary PTCs is to calculate the amount of beam radiation () achieved on the aperture surface of the inclined collector [27]. As a result, Figure 4 illustrates different various angles, acting on the collector in order to achieve based on global radiation recorded by the solarimeter. To accurately calculate this value, it is essential to consider the geometric relationship between solar radiation and the orientation of the collector. The ratio, , which represents the proportion of beam radiation on a tilted surface to that on a horizontal surface, plays a crucial role in this calculation. This ratio depends on several solar angles, including latitude (), declination (), slope (), surface azimuth angle (), hour angle (), and zenith angle ().
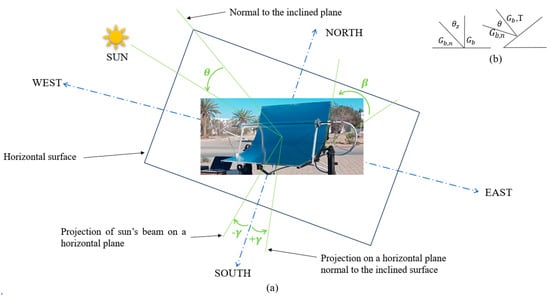
Figure 4.
(a) Section of collector, showing θ, β, γ, (b) plan view showing beam radiation on horizontal and titled surfaces.
The incidence angle (), which represents the angle between the beam radiation and the normal to the tilted surface, is computed using the following equation:
This factor can be expressed as Equation (2) [28]:
Thus, the beam radiation on the titled surface () is given by:
where is the beam radiation incident on a surface normal to the sun rays.
In the next step, it is necessary to estimate the amount of beam and diffuse radiation from the global radiation measured by the solarimeter on the horizontal plane. In this regard, an hourly clearness index (kT), which is known as the ratio between average hourly radiation on a horizontal surface (I) and average hourly extraterrestrial radiation (Io), was obtained based on Equation (4) [27].
According to [29], an estimation can be made based on Equation (5), to calculate the amount of diffuse radiation from the global values measured by the solarimeter on a horizontal plane (I).
Finally, considering the Equation (6), the values of was estimated to be used in Equation (3) and achieve .
3.2.2. Thermal Efficiency
The thermal efficiency of a PTC represents the amount of useful heat generated by the collector compared to the solar radiation received by the collector. It evaluates the extent to which the collector produces useful heat from solar radiation. The thermal efficiency equation can be summarized as [19]:
where Qu is the useful heat generated by the PTC, which is calculated using Equation (8).
Qs is the solar radiation received by the PTC, is calculated based on Equation (9).
3.3. Evaluation of Experimental Uncertainty
Experimental uncertainty arises from the limitations of measuring instruments and the inherent variability in measurements. These uncertainties, which are frequently linked to a system’s independent variables, affect the dependent outcomes that are derived from them. Accurately understanding experimental results depends on the assessment of such uncertainty. Suppose a result R depends on independent variables , expressed as R = R. The total uncertainty in R, denoted as , can be determined using the following expression:
Here, are the uncertainties of the independent variables , and represents the sensitivity of R to each variable . In this study, the total uncertainty includes contributions from the uncertainties in fluid mass flow rate, solar concentrated flux, and temperatures at various points (ambient, inlet, and outlet) as listed in Table 4. For energy efficiency, the relative uncertainties are described by the equations:
Table 4.
Range and uncertainty of the instruments used in the experimental parameters.
4. Results
4.1. Solar Flux Analyses
Figure 5 depicts the global solar radiation and ambient temperature measured for the entire test period. As indicated, some variations in the measured solar radiation are seen, which is an uncontrolled testing condition and is common in real field solar assessments. The observed trends for both the solar radiation and ambient temperature represent an ascending trend from the morning, reaching the hottest time point at 13:15 for the C1 tests and 12:15 for all the other designs, followed by a decrease as it proceeds toward the afternoon. As a result, a minimum solar radiation of 200 W/m2 was achieved at 16:15 devoted to the test of Day 1 (C4), and the maximum was recorded as 1200 W/m2 at 13:15, testing Day 1 (C1). In the same context, Day 1 (C1) and Day 2 (C2) are the two hottest testing days, while Day 1 (C2) is the coolest day with the minimum temperatures.
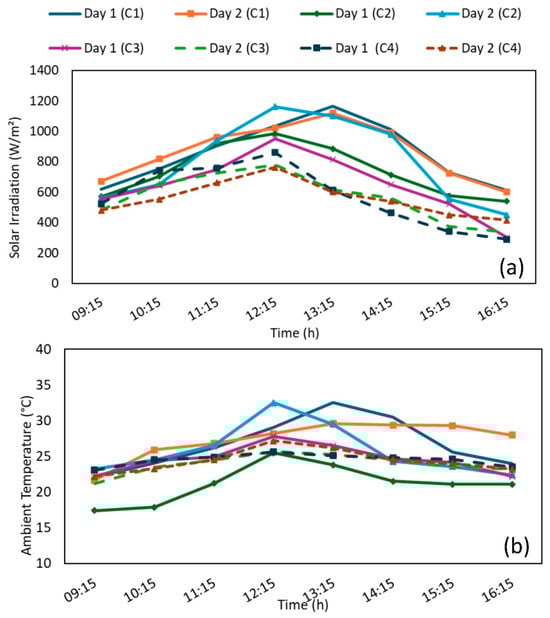
Figure 5.
(a) Variation of solar global radiation for different configurations over the entire testing period, (b) variation of ambient temperature for different configurations.
However, as mentioned earlier, the beam solar radiation arriving at the inclined collector aperture is the most important parameter in assessing the PTC collector performance. Figure 6 depicts the values obtained for each time point on each testing day. Since the experiments were conducted in the summertime, when most of the received solar radiation is in the form of a beam, only a small fraction of the measured values is subtracted compared to the global radiation (Figure 5a). Therefore, the maximum solar beam radiation has been achieved from nearly 600 W/m2 for the case Day 2 (C4) to 900 W/m2, considering Day 2 (C2).
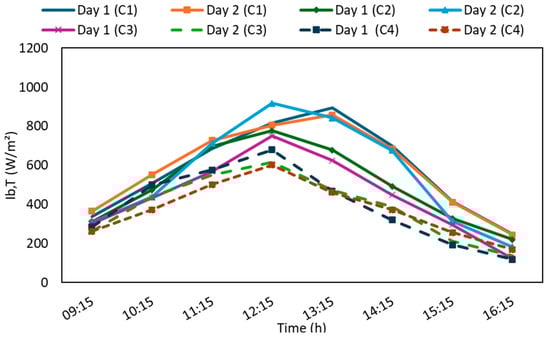
Figure 6.
Variation of Ib,T estimated for different test days.
To provide a better description of the performance, the linear power, (W/m), was calculated by dividing the total beam radiation received by the length of the receiver (L), the length for each configuration is given in Table 2. As shown in Figure 7, C1 exhibited the highest power intensity with values of ~800 W/m, due to its lowest absorbing area. Thus, it is expected that this design provides the highest heat losses, especially because of its limited ability for heat transfer. Meanwhile, C2, with a spiral-shaped absorber, achieves a minimum linear power output of 120 W/m on Day 1 and 140 W/m on Day 2, with a length of 6.6 m. As C2 has the longest receiver, the energy intensity becomes smaller, leading to a limited available thermal energy to be transferred to the fluid. However, having a coiled structure promotes enhanced heat transfer, so it is expected that the absorber thermal losses will reduce owing to turbulence in the working fluid. Considering C3 and C4, the receivers of which are 1.1 m long, the solar intensity maintains nearly high levels, while the heat transfer is also augmented by sinusoidal absorbers. As a result, the obtained linear powers are achieved as 680–560 W/m and 620–550 W/m for the cases C3 and C4, respectively. However, it is not expected that the performance of the two tubes lies in equal values, as the orientations of the tubes will show different solar absorption from the non-uniform concentrated solar flux.
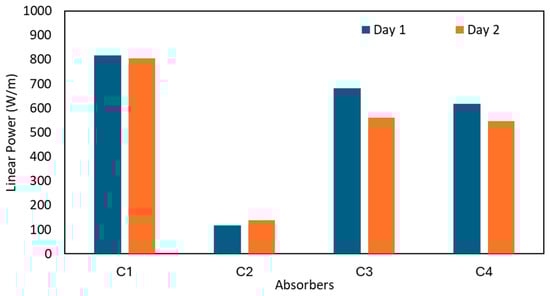
Figure 7.
Linear power output for different absorber configurations C1, C2, C3, and C4 based on different days, computed at 12:15.
4.2. Water Temperature Analyses
Water inlet temperature and the rise obtained at the collector outlet, known as temperature difference (ΔT), are depicted in Figure 8, considering the operation of PTC with the C2 absorber and along the two testing days. In the case of Day 1 (Figure 8a), from the starting moments (9:15), the proposed PTC has the ability to provide heated water, increasing the water temperature by at least 2 °C, at a very low amount of beam radiation (~200 W/m2). This implies that using a modified absorber could be beneficiary in maximizing the heat removal capacity of the collector when the available solar energy is limited. As the day proceeds, resulting in a lower incidence angle, a higher fraction of the direct solar radiation is concentrated on the absorber, proving a higher temperature difference, where the maximum reaches up to ~15 °C at 12:15. However, in the afternoon, as the incidence angle grows, ΔT reduces due to less absorbed energy by a minimum of 4 °C. Analyzing the inlet temperature revealed that the variations do not exceed the 25% difference, which likely happens at midday (12:15). This could be a reason for having a constant cooling load in the system, while solar input is changing upon the time of the day. The lower temperatures observed on the first day compared to the second day could be due to slightly reduced solar irradiation levels (Figure 5) as well as lower ambient temperature (Figure 6), which affects the heat losses from the receiver to the environment. Figure 8 also explicitly indicates how various incident angles and their impacts as incidence angle modifiers (IAM) could affect the outlet temperature. Using this parameter, the value of could be determined based on the incidence angle. As a result, ΔT decreases sharply as the incident angle grows from 0 to 15° and 30°, which reflects how glass (τα) affects the results by changing the incidence angle. Further results regarding the other absorber designs are presented in Appendix A and Appendix B.
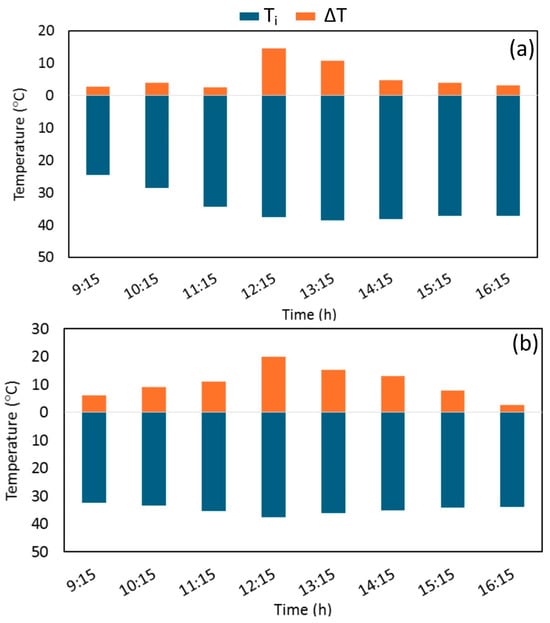
Figure 8.
Variations of water inlet temperature and water temperature difference obtained by C2 absorber at a mass flow rate of 0.005 kg/s; (a) day 1, (b) day 2.
4.3. Thermal Efficiency Analyses
Figure 9 illustrates the variations of thermal efficiency computed over the two days for the test with the C2 absorber, as a typical test. The difference between the two plots, shown by the shaded area, reflects the range of efficiency that can be achieved by this absorber. The reason for such a huge variation refers to the nature of the operation, with minimum control over environmental factors, simulating domestic operations. Basically, the values obtained on the second day outweigh those achieved on the first day. This is a result of the higher temperature difference produced during the second day, due to slightly higher solar radiation. In other words, in the case of a spiral shape, where the solar intensity along the absorber length (linear power) is the lowest, most of the absorbed energy is utilized by an enhanced fluid circulation inside the tube. As a result, any increase in solar power will promote a relatively significant augmentation in the thermal efficiency. In addition, as observed, increasing solar absorption along the day provides more thermal energy to be transformed into useful heat because of the decreased angle of incidence during this period, leading to a local peak at noon (12:15). However, in the afternoon and despite the reductions occur in the absorbed solar radiation, useful heat production remains less affected, keeping the thermal efficiency at higher levels with another peak at 15:15. This could be attributed to the fraction of the energy stored in the collector elements, which compensates for the sacrifice in the absorbed solar energy and is utilized for hot water production. As an example, comparing the results of the three time points of 9:15, 12:15, and 15:15 shows that from the morning to noon, when the solar radiation increases by nearly 70%, the useful heat production increases by 70%. While, in the afternoon, when solar radiation decreases by 70%, the useful heat generation diminishes by 60%, reflecting that 10% of the heat generation is provided by the stored energy. Details of the other configurations for the thermal efficiency obtained through the two testing days are summarized in Appendix A and Appendix B.
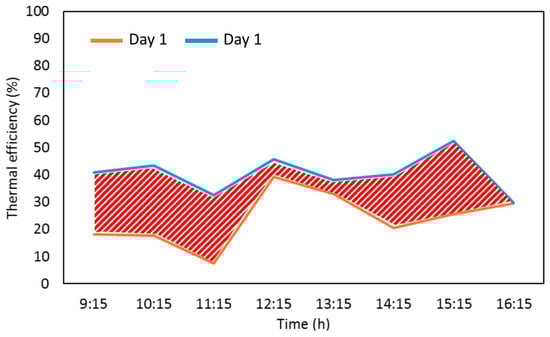
Figure 9.
Variations of thermal efficiency along the daytime for the C2 absorber, operating on two different days.
In further analyses, and if the different absorber configurations are compared, the distinctive features of each design will emerge. Therefore, a comparison between all investigated designs is presented in Figure 10, focusing on the time point of 12:15, where the incident angle is minimum and PTC operates closest to its principles. This figure shows that cases C2 and C3 perform better than C1 and C4 shapes. Clearly, each design displays a different thermal efficiency. Experiment results demonstrated that the maximum thermal efficiency equals 45%, 43%, 30%, and 30% for shapes C2 (Day 2), C3 (Day 1), C1 (Day 2), and C4 (Day 2), respectively. These results indicate that the spiral shape gives the best efficiency, whereas the perpendicular sinusoidal shape is characterized by the minimum thermal efficiency among the modified designs. The enhanced thermal efficiency of C2 is not merely due to the length or surface area but also stems from improved fluid dynamics within the absorber, which enhances heat transfer. Previous studies have also shown that spiral configurations improve fluid turbulence and promote better heat exchange by increasing the contact area and uniform exposure to solar radiation [30]. The differences observed between days for the same configuration are attributed to fluctuating climatic factors, including changes in solar radiation levels and ambient temperatures, which significantly affect thermal performance. Enhanced performance in C2 stems not just from its longer tube length but also from improved fluid dynamics and heat transfer mechanisms, where the spiral design promotes better turbulence and uniform radiation exposure. The findings underscore that performance cannot solely be predicted based on surface area or length; absorber geometry, fluid flow behavior, and daily climatic variations are crucial determinants of thermal efficiency.
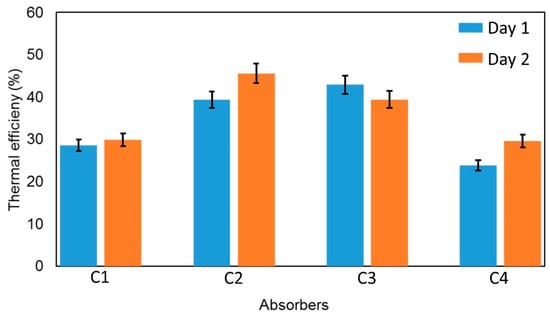
Figure 10.
Variations of thermal efficiency along the daytime for all the investigated absorber configurations, operating on two different days.
Figure 11 illustrates the daily thermal efficiency averaged all along the two days for each design, with the associated fluctuation ranges. Comparing the median values, it was revealed that the C2 design, with an average value of 32%, outperforms the other designs, which are followed by C3, C1, and C4, with, respectively, 30%, 24%, and 20%. This demonstrates that the trend found at 12:15 (Figure 10) could be a representation of average values for the day. The daily average results also confirm the advantage of spiral shape configuration in promoting thermal performance and minimizing heat losses. One of the important conclusions derived from these results is that in the stationary operation of PTCs, spiral geometry with an expanded maximum receiving area could be a preferable option to maximize solar absorption from different incident angles throughout the day. Moreover, comparing the two sinusoidal shapes displays that the parallel configuration provides a higher effective area for absorbing the concentrated heat flux than perpendicular designs. In more detail, up to a 10% reduction in the daily average thermal efficiency is reached by changing the orientation from parallel to perpendicular. As a result, using the C4 design leads to a huge reduction in effective solar absorption, which overcomes the enhancing effects in flow conditions promoted by the sinusoidal flow. It should be noted that the large error bars refer to the fact that the data have been computed for a wide range of incidence angles and two different testing days, which could promote significant differences in the thermal efficiency of the collector. Moreover, the larger error bars are seen on the alternative geometries than in the simple case, which suggests that the modifications in the absorber geometry have made them more dependent on the angle of incidence.
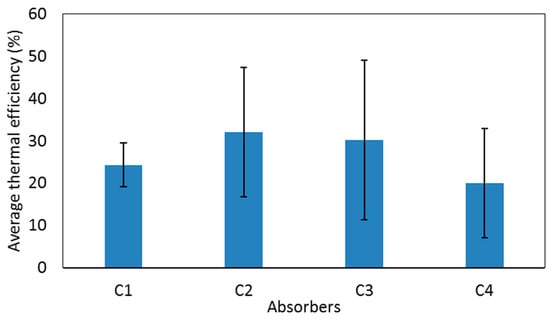
Figure 11.
Comparative analysis of average daily thermal efficiency computed for various absorber configurations (C1, C2, C3, and C4).
The efficiency curves of four different collectors are presented in Figure 12, showing average values computed for the two testing days. This analysis displays the rate of efficiency loss depending on the increase in temperature difference between the inlet and ambient temperature. In this context, C2 reflects the steepest slope, representing higher efficiency reduction as the absorber’s temperature increases. This could be attributed to the geometrical characteristics of this design, where the C2 absorber has the maximum extended surface area, and this makes it lose a higher rate of thermal power as the absorber’s temperature increases. Moreover, the y-intercept indicates the mean optical efficiency of each design, where C2 (spiral shape) shows the maximum optical efficiency with 37%, and C1 (simple design) renders the minimum optical efficiency as 22%. Measuring the maximum optical efficiency by spiral shape should be reasonable, as more surface area means more opportunity to absorb radiation. However, C1 with the lowest surface area brings the minimum optical efficiency.
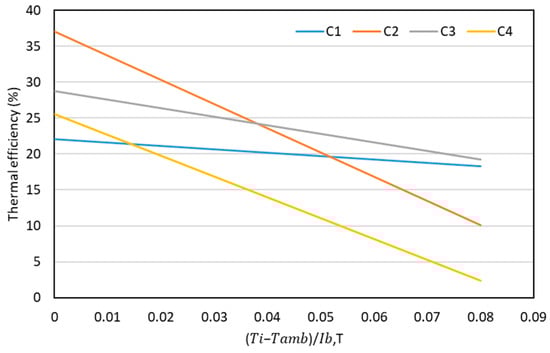
Figure 12.
Collector efficiency curve computed for various absorber configurations (C1, C2, C3, and C4).
Figure 13 depicts the total daily solar energy received by the collector as well as the thermal energy generated by different absorbers. Results indicate that the maximum solar energy obtained during the tested days refers to the two days devoted to C1 absorber, as 4.5 kWh, while the minimum has been achieved by C4 configuration, nearly 3 kWh. The solar energy produced by the C2 absorber, with an average of 1.37 kWh, is found to be the maximum, twice that of the C4 design. Assuming that a typical electric water heating system consumes 3 kWh/d per household on average [31], the C2 configuration with the current setting could meet nearly 50% of the total energy needed for domestic hot water systems. To further discuss the benefits of the proposed PTC over the current technologies, Section 4.4 addresses the economic and environmental factors.
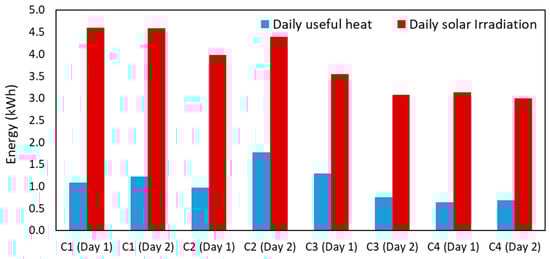
Figure 13.
Daily thermal energy production and solar radiation for the studied days.
Table 5 illustrates several similar experimental studies that have investigated water-based PTCs, providing their relative design information with maximum thermal efficiency achieved in each case. As observed, the solution proposed in this study could perfectly stand in a good position compared to the peer works. It should be noted that although a spiral absorber is found as the second choice compared to the absorber with intermittent rotation [32], the employment of mechanical devices such as an electrical motor for the rotation of the collector would be an issue for long-term operations, which is essential in the domestic application of PTC water heaters. As a result, surface modification as proposed in this study could be a cheap and sustainable strategy to compensate for the reduction in energy production in the non-evacuated and non-tracking applications of PTCs.
Table 5.
Summary of some studies on different types of PTCs for water heating applications.
4.4. Economic and Environmental Analyses
In this section, an economic analysis is conducted, considering the costs of purchased components and equipment, operation and maintenance, and energy input. Thermo-economic analysis is a combination of energy and economic analysis that offers essential information that cannot be provided using traditional and simplistic thermodynamic analysis [35]. Costs are based on the prototype, with expected reductions of around 50% through mass production. Additionally, it is assumed that the system would not be salvaged when its life is over, and it is not taken into account in this study. Table 6 presents the key assumptions and considerations included in the economic evaluation of the system.
Table 6.
Economic cost assumptions for the proposed PTC used in SWH.
The objective is to conduct an economic comparative study on several absorber designs that have been previously introduced and to find which one is the most economical adaptation that will be identified as optimal. Hence, the Discounted Cash Flow (DCF) is employed through which three requirements of selection for a more tolerable and profitable project are alike [36].
Net Present Value (NPV) is a parameter used to compare present-day investments by evaluating the present value of expected future cash flows, while accounting for the interest rate over time. This widely used method helps determine the current value of a project’s future earnings and includes the initial capital investment in the calculation. NPV value is given by:
where C0 represents initial capital investment, Ci denotes the expected cash flow in i-th year, r displays the interest rate and i is the time of the project life (months or years). The annual cash flow throughout the project’s lifespan includes various costs and revenues. Income is primarily derived from the annual savings in electricity costs resulting from the implementation of the proposed systems, as opposed to conventional electric heating devices. In the NPV analysis, a positive NPV indicates a profitable and acceptable project, while a negative NPV suggests that the project is financially unviable.
As shown in Figure 14, different absorbers would influence the economic efficiency of the solar collector. The first impression indicates that regardless of the absorber design, the employment of such low-technology PTC could be beneficiary along the operation life cycle, where the payback period ranges from 3 to 6 years. At the starting point (i = 0), different designs have the same value, and this implies the constant initial capital investment for all configurations. Using various operations revealed that the C4 case will become profitable after 6 years of operation. However, other adjustments indicate positive values before 4 years, where the highest value is for the C2 absorber, which is before the third year. As a result, the spiral absorber could be the most cost-effective mode under the test conditions from the NPV point of view, which is followed by the standard and parallel sinusoidal designs.
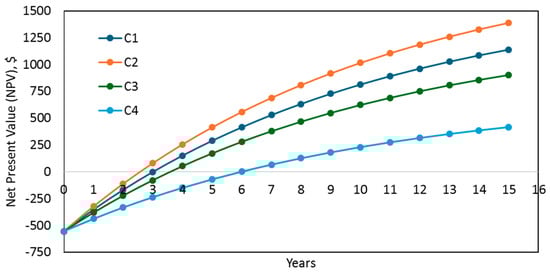
Figure 14.
Net Present Values for different absorber designs during life cycle of the system.
Another crucial factor in sustainable technologies is the amount of CO2 that can be captured by the implementation of a system. According to the data provided by Bongungu et al. [31], domestic water heating accounts for 7–20% of total electricity consumption for a single-family residential home, which results in an average of 1–8 kWh/day electricity consumption and 26–208 L of hot water per day. Hence, in order to investigate the environmental impacts of the proposed technology for domestic hot water production, the above assumptions were considered and compared as follows:
From Table 7, it can be observed that the integration of a stationary PTC system with a conventional electric system would reduce the amount of carbon emissions, which is one of the most prominent goals of sustainable systems. C2 with the highest CO2 reduction (220 kgCO2/yr) is recognized as the most efficient design in terms of economic factors, while C4 configuration with a reduction of 109 kgCO2/yr is found as the least beneficial design. Therefore, it can be concluded that employing a non-evacuated PTC with low fabrication technology and simple raw materials can be economically efficient and also an eco-friendly technology with a 17–35% reduction in carbon emission compared to electric systems.
Table 7.
Carbon emissions and energy consumption for solar and electric domestic water heating systems.
5. Conclusions
This study presented the application of a stationary, low-technology PTC collector with several modified absorbers for domestic hot water production. This design aimed to improve the collector’s ability for heat absorption and heat transfer while experiencing simple operation conditions (non-tracking). A set of experimental tests was conducted to evaluate the system’s thermal performance under real-world conditions and compare various absorber designs from different perspectives. Employing a standard tube (C1), as well as three alternative designs, including a spiral tube (C2), and a sinusoidal tube with two orientations, parallel (C3) and perpendicular (C4), the following results were obtained.
- The fraction of the solar radiation that arrives on the collector aperture in the form of beam radiation was computed at each time point with different incident angles. This led to the appropriate determination of the thermal efficiency throughout the day.
- Linear power analyses showed that each alternative configuration provides various flux intensities, resulting in different heat transfer behavior on the solar absorbers. In this case, C2 with the lowest flux intensity of the tube wall enables a large heat transfer area between the solid and fluid.
- The comparison of different absorbers in terms of thermal efficiency demonstrated the superiority of C2 over all the proposed designs, with a daily average of 32%, which is 8% higher than those obtained for a conventional absorber. Moreover, the sinusoidal absorber with an orientation parallel to the collector axis could be a better choice compared to the perpendicular orientation, which reduces the thermal efficiency by nearly 10%.
- Economic and environmental factors have also supported the advantage of employing the proposed system for the domestic hot water sector. The minimum payback period of the collector was achieved as 3 years, using the C2 absorber, while the maximum was obtained by the C4 absorber as 6 years. Moreover, in the case of environmental assessment, the application of PTC for the domestic hot water was compared with electric-only systems, and results showed that the integration of the C2 absorber would decrease carbon production from 627 to 408 kg in an annual cycle.
From the perspective of this work, a comprehensive numerical study with the utilization of computational fluid dynamics (CFD) tools is planned to provide further detailed analyses of the proposed collectors. Performing thermo-hydraulic simulation for each design, and validating the numerical models against experimental results, heat transfer characteristics such as heat transfer coefficient will be analyzed in each case to further optimize the collector for the application in the domestic sector.
Author Contributions
Conceptualization, J.M. and A.B.; methodology, R.E.; software, F.H.; validation, J.M., H.E. and L.S.; formal analysis, R.E.; investigation, R.E. and L.S.; resources, A.B.; data curation, J.M., H.E. and L.S.; writing—original draft preparation, J.M.; writing—review and editing, H.E., R.E. and L.S.; visualization, H.E. and L.S.; supervision, R.E. and L.S.; project administration, A.B., R.E. and L.S.; funding acquisition, A.B. and R.E. All authors have read and agreed to the published version of the manuscript.
Funding
This research received no external funding.
Data Availability Statement
The data used in this study are available from the corresponding author upon reasonable request.
Conflicts of Interest
The authors declare no conflicts of interest.
Appendix A
Figure A1, Figure A2 and Figure A3 depict the values of the water inlet temperature and the temperature difference obtained by using various absorbers along the two distinctive test days.
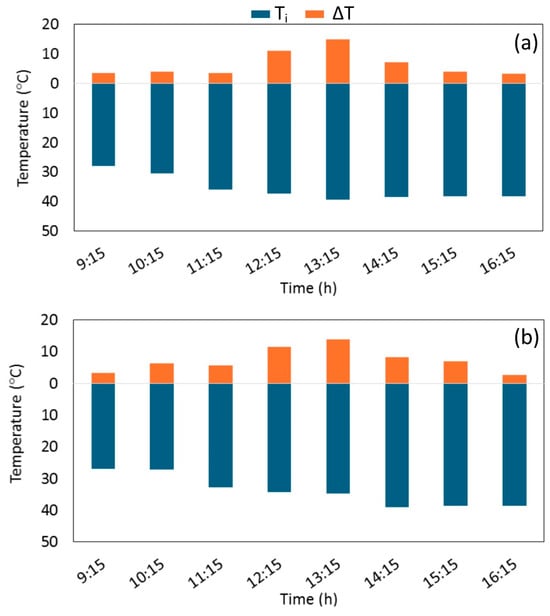
Figure A1.
Variations of water inlet temperature and water temperature difference obtained by C1 absorber at a mass flow rate of 0.005 kg/s; (a) day 1, (b) day 2.
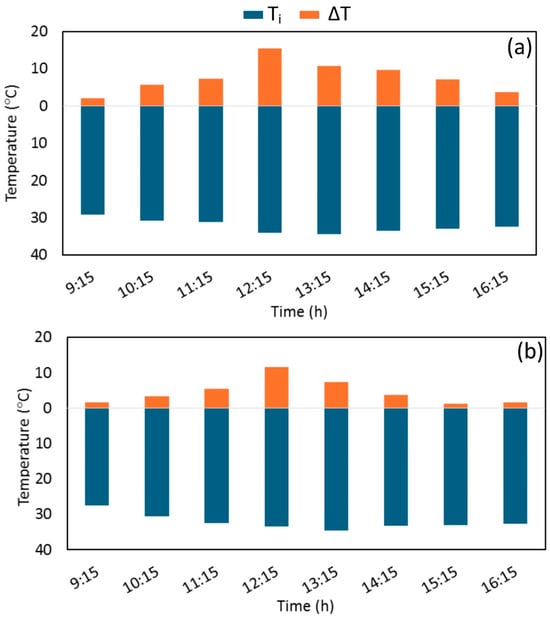
Figure A2.
Variations of water inlet temperature and water temperature difference obtained by C3 absorber at a mass flow rate of 0.005 kg/s; (a) day 1, (b) day 2.
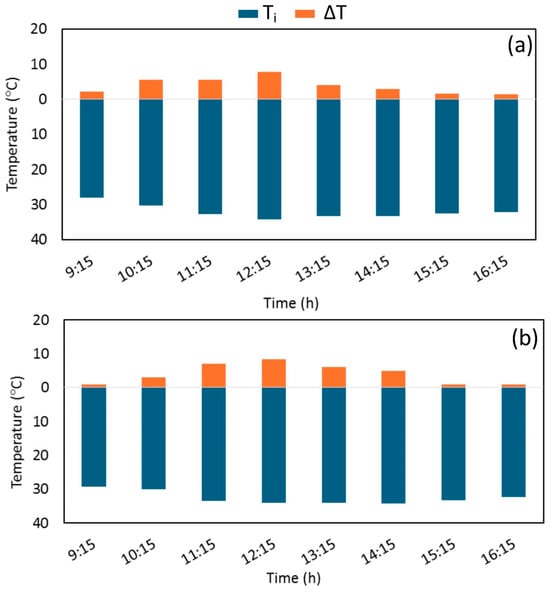
Figure A3.
Variations of water inlet temperature and water temperature difference obtained by C4 absorber at a mass flow rate of 0.005 kg/s; (a) day 1, (b) day 2.
More data on the thermal efficiency obtained by different absorber designs are presented in Figure A4, which displays a similar trend to that observed in the case of C2.
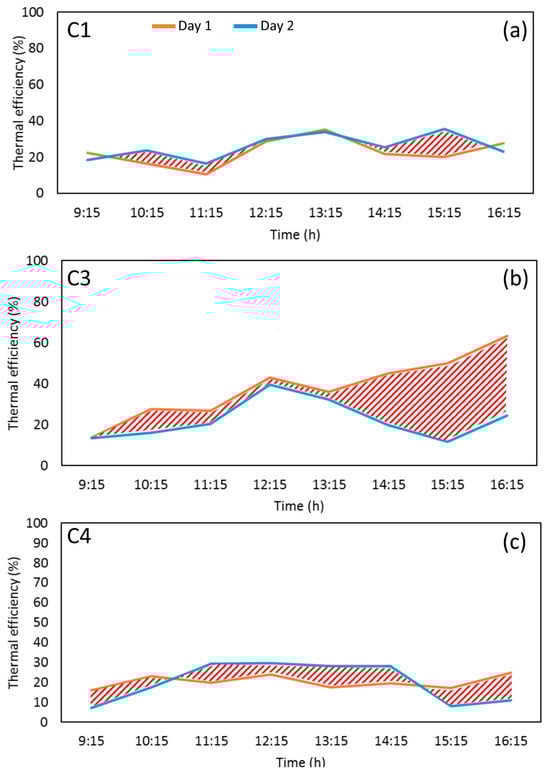
Figure A4.
Variations of thermal efficiency along the two testing day times for (a) C1, (b) C3, and (c) C4 absorbers.
Appendix B
Detailed experimental results are presented in Table A1, Table A2, Table A3 and Table A4, reporting the measured values of the temperatures as well as the computed solar parameters for all the tested cases and dates.
Table A1.
Experimental measurements for C1 absorber on Day 1 and Day 2 at a mass flow rate of 0.005 kg/s.
Table A1.
Experimental measurements for C1 absorber on Day 1 and Day 2 at a mass flow rate of 0.005 kg/s.
| Time (h) | Hour Angle (°) | (°C) Day 1 | (°C) Day 1 | (°C) Day 1 | (W/m2) Day 1 | (°C) Day 2 | (°C) Day 2 | (°C) Day 2 | (W/m2) Day 2 |
|---|---|---|---|---|---|---|---|---|---|
| 9:15 | −46.2 | 27.9 | 31.5 | 22.1 | 337.87 | 27 | 30.25 | 21.7 | 397.55 |
| 10:15 | −31.2 | 30.5 | 34.5 | 24.1 | 507.17 | 27.2 | 33.5 | 25.9 | 578.97 |
| 11:15 | −16.2 | 36 | 39.5 | 26.2 | 685.30 | 32.75 | 38.5 | 26.8 | 743.73 |
| 12:15 | −1.2 | 37.25 | 48.4 | 29.1 | 816.27 | 34.253 | 45.75 | 28.2 | 803.28 |
| 13:15 | 13.8 | 39.5 | 54.5 | 32.5 | 892.97 | 34.75 | 48.7 | 29.6 | 836.76 |
| 14:15 | 28.8 | 38.5 | 45.75 | 30.5 | 698.69 | 39 | 47.25 | 29.4 | 648.50 |
| 15:15 | 43.8 | 38.25 | 42.25 | 25.6 | 414.61 | 38.5 | 45.5 | 29.3 | 376.32 |
| 16:15 | 58.8 | 38.2 | 41.5 | 24 | 249.41 | 38.5 | 41.2 | 28 | 208.52 |
Table A2.
Experimental measurement data for C2 absorber on Day 1 and Day 2 (mass flow rate = 0.005 kg/s).
Table A2.
Experimental measurement data for C2 absorber on Day 1 and Day 2 (mass flow rate = 0.005 kg/s).
| Time (h) | Hour Angle (°) | (°C) Day 1 | (°C) Day 1 | (°C) Day 1 | (W/m2) Day 1 | (°C) Day 2 | (°C) Day 2 | (°C) Day 2 | (W/m2) Day 2 |
|---|---|---|---|---|---|---|---|---|---|
| 9:15 | −46.2 | 24.5 | 27.2 | 17.4 | 311.22 | 32.5 | 38.5 | 23.2 | 306.32 |
| 10:15 | −31.2 | 28.5 | 32.5 | 17.9 | 475.14 | 33.4 | 42.5 | 24.5 | 438.65 |
| 11:15 | −16.2 | 34.25 | 36.75 | 21.2 | 697.5 | 35.4 | 46.5 | 26.5 | 712.50 |
| 12:15 | −1.2 | 37.5 | 52.1 | 25.5 | 776.43 | 37.5 | 57.5 | 32.5 | 917.09 |
| 13:15 | 13.8 | 38.5 | 49.2 | 23.8 | 678.2 | 36.1 | 51.4 | 29.5 | 842.94 |
| 14:15 | 28.8 | 38.2 | 43 | 21.5 | 492.7 | 35.2 | 48.2 | 24.3 | 677.27 |
| 15:15 | 43.8 | 37.1 | 41.1 | 21.1 | 327.54 | 34.2 | 42.1 | 23.6 | 314.98 |
| 16:15 | 58.8 | 37.1 | 40.2 | 21.1 | 219.72 | 33.9 | 36.5 | 22.4 | 183.11 |
Table A3.
Hourly experimental data for C3 absorber on Day 1 and Day 2 (mass flow rate = 0.005 kg/s).
Table A3.
Hourly experimental data for C3 absorber on Day 1 and Day 2 (mass flow rate = 0.005 kg/s).
| Time (h) | Hour Angle (°) | (°C) Day 1 | (°C) Day 1 | (°C) Day 1 | (W/m2) Day 1 | (°C) Day 2 | (°C) Day 2 | (°C) Day 2 | (W/m2) Day 2 |
|---|---|---|---|---|---|---|---|---|---|
| 9:15 | −46.2 | 29.25 | 31.25 | 22.2 | 302.18 | 27.5 | 29.2 | 21.2 | 263.28 |
| 10:15 | −31.2 | 30.75 | 36.5 | 24.4 | 433.73 | 30.5 | 33.9 | 23.5 | 439.33 |
| 11:15 | −16.2 | 31.25 | 38.5 | 24.9 | 568.63 | 32.5 | 37.9 | 24.5 | 550.38 |
| 12:15 | −1.2 | 34.1 | 49.5 | 27.8 | 750.40 | 33.4 | 45 | 25.7 | 615.50 |
| 13:15 | 13.8 | 34.5 | 45.3 | 26.5 | 624.51 | 34.5 | 41.8 | 25.3 | 472.57 |
| 14:15 | 28.8 | 33.5 | 43.2 | 24.7 | 449.25 | 33.2 | 36.9 | 24.5 | 387.76 |
| 15:15 | 43.8 | 33 | 40.1 | 24.2 | 296.79 | 33.1 | 34.3 | 23.5 | 213.24 |
| 16:15 | 58.8 | 32.5 | 36.2 | 22.2 | 122.51 | 32.6 | 34.2 | 23.2 | 136.58 |
Table A4.
Hourly experimental data for C4 absorber on Day 1 and Day 2 (mass flow rate = 0.005 kg/s).
Table A4.
Hourly experimental data for C4 absorber on Day 1 and Day 2 (mass flow rate = 0.005 kg/s).
| Time (h) | Hour Angle (°) | (°C) Day 1 | (°C) Day 1 | (°C) Day 1 | (W/m2) Day 1 | (°C) Day 2 | (°C) Day 2 | (°C) Day 2 | (W/m2) Day 2 |
|---|---|---|---|---|---|---|---|---|---|
| 9:15 | −46.2 | 28.05 | 30.25 | 23.1 | 285.07 | 29.2 | 30.1 | 22.2 | 261.64 |
| 10:15 | −31.2 | 30.25 | 35.75 | 24.5 | 500.02 | 30.1 | 33.2 | 23.3 | 372.37 |
| 11:15 | −16.2 | 32.75 | 38.2 | 24.9 | 575.91 | 33.5 | 40.5 | 24.5 | 500.98 |
| 12:15 | −1.2 | 34.25 | 42 | 25.6 | 679.40 | 34 | 42.5 | 27.2 | 601.61 |
| 13:15 | 13.8 | 33.25 | 37.2 | 25.1 | 468.51 | 34 | 40.2 | 26.2 | 461.00 |
| 14:15 | 28.8 | 33.2 | 36.2 | 24.8 | 320.39 | 34.2 | 39.2 | 24.5 | 373.25 |
| 15:15 | 43.8 | 32.6 | 34.2 | 24.6 | 193.52 | 33.2 | 34.2 | 24 | 255.87 |
| 16:15 | 58.8 | 32.2 | 33.6 | 23.5 | 118.03 | 32.3 | 33.2 | 23.2 | 169.33 |
References
- Norouzi, A.M.; Siavashi, M.; Khaliji Oskouei, M. Efficiency enhancement of the parabolic trough solar collector using the rotating absorber tube and nanoparticles. Renew. Energy 2020, 145, 569–584. [Google Scholar] [CrossRef]
- Salunkhe, P.B.; Devanuri, J.K. Investigations on latent heat storage materials for solar water and space heating applications. J. Energy Storage 2017, 12, 243–260. [Google Scholar] [CrossRef]
- Al-Mamun, M.R.; Roy, H.; Islam, M.S.; Ali, M.R.; Hossain, M.I.; Saad Aly, M.A.; Hossain Khan, M.Z.; Marwani, H.M.; Islam, A.; Haque, E.; et al. State-of-the-art in solar water heating (SWH) systems for sustainable solar energy utilization: A comprehensive review. Sol. Energy 2023, 264, 111998. [Google Scholar] [CrossRef]
- Guerraiche, D.; Guerraiche, K.; Driss, Z.; Chibani, A.; Merouani, S.; Bougriou, C. Heat Transfer Enhancement in a Receiver Tube of Solar Collector Using Various Materials and Nanofluids. Eng. Technol. Appl. Sci. Res. 2022, 12, 9282–9294. [Google Scholar] [CrossRef]
- Heyhat, M.M.; Valizade, M.; Abdolahzade, S.; Maerefat, M. Thermal efficiency enhancement of direct absorption parabolic trough solar collector (DAPTSC) by using nanofluid and metal foam. Energy 2020, 192, 116662. [Google Scholar] [CrossRef]
- Gharzi, M.; Kermani, A.M.; Tash Shamsabadi, H. Experimental investigation of a parabolic trough collector-thermoelectric generator (PTC-TEG) hybrid solar system with a pressurized heat transfer fluid. Renew. Energy 2023, 202, 270–279. [Google Scholar] [CrossRef]
- Maatallah, T.; Houcine, A.; El Alimi, S.; Ben Nasrallah, S. A novel solar concentrating system based on a fixed cylindrical reflector and tracking receiver. Renew. Energy 2018, 117, 85–107. [Google Scholar] [CrossRef]
- Barbosa, E.G.; Martins, M.A.; Viana de Araujo, M.E.; Renato, N.d.S.; Zolnier, S.; Pereira, E.G.; de Oliveira Resende, M. Experimental evaluation of a stationary parabolic trough solar collector: Influence of the concentrator and heat transfer fluid. J. Clean. Prod. 2020, 276, 124174. [Google Scholar] [CrossRef]
- Ebadi, H.; Kamfiroozi, S.; Cammi, A.; Savoldi, L. Optical Performance of a Novel Tube-Bundle Cavity Receiver for Solar Parabolic Trough Collectors. In Proceedings of the ASME 2022 Power Conference. ASME 2022 Power Conference, Pittsburgh, PA, USA, 18–19 July 2022. [Google Scholar] [CrossRef]
- Bellos, E.; Tzivanidis, C. Alternative designs of parabolic trough solar collectors. Prog. Energy Combust. Sci. 2019, 71, 81–117. [Google Scholar] [CrossRef]
- Mustafa, J.; Alqaed, S.; Sharifpur, M. Numerical study on performance of double-fluid parabolic trough solar collector occupied with hybrid non-Newtonian nanofluids: Investigation of effects of helical absorber tube using deep learning. Eng. Anal. Bound. Elem. 2022, 140, 562–580. [Google Scholar] [CrossRef]
- Djenane, M.S.; Hadji, S.; Touhami, O.; Zitouni, A.H. A Novel Design of Parabolic Trough Solar Collector’s Absorber Tube. J. Sol. Energy Eng. 2023, 146, 4063700. [Google Scholar] [CrossRef]
- Bitam, E.W.; Demagh, Y.; Hachicha, A.A.; Benmoussa, H.; Kabar, Y. Numerical investigation of a novel sinusoidal tube receiver for parabolic trough technology. Appl. Energy 2018, 218, 494–510. [Google Scholar] [CrossRef]
- Babapour, M.; Akbarzadeh, S.; Valipour, M.S. An experimental investigation on the simultaneous effects of helically corrugated receiver and nanofluids in a parabolic trough collector. J. Taiwan Inst. Chem. Eng. 2021, 128, 261–275. [Google Scholar] [CrossRef]
- Al-Rabeeah, A.Y.; Seres, I.; Farkas, I. Experimental investigation of improved parabolic trough solar collector thermal efficiency using novel receiver geometry design. Int. J. Thermofluids 2023, 18, 100344. [Google Scholar] [CrossRef]
- Nain, S.; Ahlawat, V.; Kajal, S.; Anuradha, P.; Sharma, A.; Singh, T. Performance analysis of different U-shaped heat exchangers in parabolic trough solar collector for air heating applications. Case Stud. Therm. Eng. 2021, 25, 100949. [Google Scholar] [CrossRef]
- Chen, F.; Li, M.; Zhang, P.; Luo, X. Thermal performance of a novel linear cavity absorber for parabolic trough solar concentrator. Energy Convers. Manag. 2015, 90, 292–299. [Google Scholar] [CrossRef]
- Venkatesaperumal, R.; Syed Jafar, K.; Elumalai, P.V.; Abbas, M.; Cuce, E.; Shaik, S.; Saleel, C.A. Heat Transfer Studies on Solar Parabolic trough Collector Using Corrugated Tube Receiver with Conical Strip Inserts. Sustainability 2023, 15, 378. [Google Scholar] [CrossRef]
- Fuqiang, W.; Zhexiang, T.; Xiangtao, G.; Jianyu, T.; Huaizhi, H.; Bingxi, L. Heat transfer performance enhancement and thermal strain restrain of tube receiver for parabolic trough solar collector by using asymmetric outward convex corrugated tube. Energy 2016, 114, 275–292. [Google Scholar] [CrossRef]
- Said, S.; Mellouli, S.; Alqahtani, T.; Algarni, S.; Ajjel, R. New Evacuated Tube Solar Collector with Parabolic Trough Collector and Helical Coil Heat Exchanger for Usage in Domestic Water Heating. Sustainability 2023, 15, 11497. [Google Scholar] [CrossRef]
- Ebadi, H.; Alarcón-Padilla, D.-C.; Contreras Keegan, J.J.; Guedez Mata, R.E.; Trevisan, S.; Valenzuela Gutiérrez, L.; Zarza Moya, E.; Savoldi, L. Optical Analysis and Optimization of a New Receiver for Solar Parabolic Trough Collectors (DETECTIVE). In Proceedings of the ASME 2024 Heat Transfer Summer Conference Collocated with the ASME 2024 Fluids Engineering Division Summer Meeting and the ASME 2024 18th International Conference on Energy Sustainability, Anaheim, CA, USA, 15–17 July 2024. [Google Scholar] [CrossRef]
- Bortolato, M.; Dugaria, S.; Del Col, D. Experimental study of a parabolic trough solar collector with flat bar-and-plate absorber during direct steam generation. Energy 2016, 116, 1039–1050. [Google Scholar] [CrossRef]
- Talugeri, V.; Pattana, N.B.; Nasi, V.B.; Shahapurkar, K.; Soudagar, M.E.M.; Ahamad, T.; Kalam, M.A.; Chidanandamurthy, K.M.; Mubarak, N.M.; Karri, R.R. Experimental investigation on a solar parabolic collector using water-based multi-walled carbon-nanotube with low volume concentrations. Sci. Rep. 2023, 13, 7398. [Google Scholar] [CrossRef]
- Vengadesan, E.; Ismail Rumaney, A.R.; Mitra, R.; Harichandan, S.; Senthil, R. Heat transfer enhancement of a parabolic trough solar collector using a semicircular multitube absorber. Renew. Energy 2022, 196, 111–124. [Google Scholar] [CrossRef]
- Upadhyay, B.H.; Patel, A.J.; Sadasivuni, K.K.; Mistry, J.M.; Ramana, P.V.; Panchal, H.; Ponnamma, D.; Essa, F.A. Design, development and techno economic analysis of novel parabolic trough collector for low-temperature water heating applications. Case Stud. Therm. Eng. 2021, 26, 100978. [Google Scholar] [CrossRef]
- Drinčić, A.; Noč, L.; Merzel, F.; Jerman, I. Future Parabolic Trough Collector Absorber Coating Development and Service Lifetime Estimation. Coatings 2024, 14, 1111. [Google Scholar] [CrossRef]
- Duffie, J.A.; Beckman, W.A. Solar Engineering of Thermal Processes: Fourth Edition; John Wiley and Sons: Hoboken, NJ, USA, 2013. [Google Scholar] [CrossRef]
- Vignola, F.; McDaniels, D.K. Direct radiation: Ratio between horizontal and tilted surfaces. Sol. Energy 1989, 43, 183–190. [Google Scholar] [CrossRef]
- Erbs, D.G.; Klein, S.A.; Duffie, J.A. Estimation of the diffuse radiation fraction for hourly, daily and monthly-average global radiation. Sol. Energy 1982, 28, 293–302. [Google Scholar] [CrossRef]
- Chakraborty, O.; Roy, S.; Das, B.; Gupta, R. Computational analyses of parabolic trough solar collector in the presence of helical coil-insert. Int. J. Environ. Sci. Technol. 2023, 20, 683–702. [Google Scholar] [CrossRef]
- Bongungu, J.L.; Francisco, P.W.; Gloss, S.L.; Stillwell, A.S. Estimating residential hot water consumption from smart electricity meter data. Environ. Res. Infrastruct. Sustain. 2022, 2, 45003. [Google Scholar] [CrossRef]
- Naveenkumar, R.; Sharma, A.; Venkateshkumar, R.; Mohanavel, V.; Veerababu, K.; Ravichandran, M.; Rajesh, A.S.; Kannan, S.; Soudagar, M.E.M. Performance evaluation of modified parabolic trough collector based solar water heater. Results Eng. 2025, 26, 105110. [Google Scholar] [CrossRef]
- Abbood, M.; Radhi, R.; Shaheed, A. Design, construction, and testing of a parabolic trough solar concentrator system for hot water and moderate temperature steam generation. Kufa J. Eng. 2018, 9, 42–59. [Google Scholar] [CrossRef]
- Benmenine, D.; Ghodbane, M.; Soudani, M.E.; Abdelouahed, H.; Massiv, A.; Elsharif, N. A small parabolic trough collector as a solar water heater: An experimental study in Ouargla region, Algeria. Int. J. Energ. 2020, 5, 1–6. [Google Scholar] [CrossRef]
- Baral, S.; Kim, D.; Yun, E.; Kim, K.C. Experimental and thermoeconomic analysis of small-scale solar organic rankine cycle (SORC) system. Entropy 2015, 17, 2039–2061. [Google Scholar] [CrossRef]
- Sokhansefat, T.; Kasaeian, A.; Rahmani, K.; Heidari, A.H.; Aghakhani, F.; Mahian, O. Thermoeconomic and environmental analysis of solar flat plate and evacuated tube collectors in cold climatic conditions. Renew. Energy 2018, 115, 501–508. [Google Scholar] [CrossRef]
- Menzies, G.F.; Roderick, Y. Energy and carbon impact analysis of a solar thermal collector system. Int. J. Sustain. Eng. 2010, 3, 9–16. [Google Scholar] [CrossRef]
Disclaimer/Publisher’s Note: The statements, opinions and data contained in all publications are solely those of the individual author(s) and contributor(s) and not of MDPI and/or the editor(s). MDPI and/or the editor(s) disclaim responsibility for any injury to people or property resulting from any ideas, methods, instructions or products referred to in the content. |
© 2025 by the authors. Licensee MDPI, Basel, Switzerland. This article is an open access article distributed under the terms and conditions of the Creative Commons Attribution (CC BY) license (https://creativecommons.org/licenses/by/4.0/).