Abstract
In today’s world, power distribution systems and information and communication technology (ICT) systems are increasingly interconnected, forming cyber–physical power systems (CPPSs) at the core of smart grids. Ensuring the resilience of these systems is essential for maintaining reliable performance under disasters, failures, or cyber-attacks. Identifying critical nodes within these interdependent networks is key to preserving system robustness. This paper applies complex network (CN) theory—specifically degree centrality (DC), closeness centrality (CC), and betweenness centrality (BC)—to a real-world distribution grid integrated with an ICT layer in northeastern Italy. Simulations are conducted across three scenarios: a directed power network, an undirected power network, and an undirected ICT network. Each centrality metric generates a ranking of nodes which is validated using node removal performance (NRP) analysis. In the directed power network, in-closeness centrality and out-degree centrality are the most effective in identifying critical nodes, with correlations of 84% and 74% with NRP, respectively. DC and BC perform best in the undirected power network, with correlation values of 67% and 53%, respectively. In the ICT network, BC achieves the highest correlation (64%), followed by CC at 55%. These findings demonstrate the potential of centrality-based methods for identifying critical nodes and support strategies for enhancing CPPS resilience and fault recovery by distribution system operators.
1. Introduction
The integration of power systems with information and communication technologies (ICTs) is advancing rapidly, transforming traditional electrical grids into smart grids. This convergence has given rise to cyber–physical power systems (CPPSs), where physical and cyber components are tightly interlinked, forming complex systems of systems with intricate interdependencies and behaviors [1,2,3]. In CPPSs, power systems rely on ICT for monitoring, control, and decision-making, while ICT infrastructures depend on the power grid for energy supply. This bidirectional dependency requires careful coordination to ensure system-wide reliability and efficiency [4,5].
While ICT integration improves observability and operational responsiveness, it also introduces new vulnerabilities. CPPSs are now more susceptible to cyber threats, faults, and cascading failures. The 2015 cyber-attack on Ukraine’s power grid, executed via the Black Energy malware, disrupted power for thousands and highlighted the real-world consequences of CPPS vulnerabilities [6,7]. Additionally, large-scale blackouts in North America and Europe in 2003, though not cyber-induced, underscore the systemic risks in tightly interconnected power networks [8,9].
Power systems are foundational to modern society, and their secure, resilient operation is critical for sustaining economic and social activity. With increasing cyber and physical threats, there is an urgent need to identify and protect the most critical components within CPPSs to prevent large-scale disruptions [10,11].
Various modeling frameworks have been proposed to analyze CPPS behavior and vulnerabilities, including agent-based models [12,13], Petri nets [14], Markov chains and reliability block diagrams [15,16], and complex network (CN) theory [17]. CN theory has emerged as a particularly powerful and scalable approach for examining the structure, resilience, and failure propagation in CPPSs. In CN-based models, nodes represent components such as substations, generators, or loads, while edges denote electrical or communication links [17,18]. CN models facilitate topological analysis, vulnerability assessment, and the evaluation of interdependencies across power and ICT layers.
Compared to agent-based simulations, which require extensive computational resources, CN analysis provides a more tractable way to explore system-wide properties. While reliability diagrams and Markov models focus on failure probabilities, and Petri nets model discrete processes, CN theory allows for a broader exploration of structure–function relationships, cascading failure potential, and robustness under various conditions [19,20,21].
A critical challenge in CPPS analysis is identifying critical nodes, components whose failure would most significantly impact system operation. Finding critical nodes in a CPPS is highly beneficial for power system operators, enabling them to prioritize resources to strengthen and protect these nodes, thereby improving resilience. Network science offers centrality metrics such as betweenness centrality (BC), degree centrality (DC), and closeness centrality (CC) to quantify node importance, each capturing distinct aspects of topological influence [10,22,23]. For instance, DC identifies nodes with the most direct connections, highlighting components vulnerable to targeted attacks or cascading failures. BC pinpoints nodes that act as bridges in information flow, whose removal could fragment network communication. CC locates nodes with the shortest average distance to others, critical for maintaining operational efficiency and rapid response. Together, these metrics provide a multi-dimensional perspective, addressing vulnerabilities from structural (DC), functional (BC), and operational (CC) viewpoints.
1.1. Related Works
Several studies have applied centrality metrics to assess the vulnerability of CPPSs. In [1], the authors considered BC-based centrality metrics for a power system integrated with an ICT system with a small number of nodes in power and ICT layers in a directed and undirected scheme, identifying critical components according to the topology of each network. The authors in [24] applied complex network theory to model interdependent power and ICT systems using a synthetic IEEE 30-bus testbed, assessing vulnerability through centrality metrics like degree, closeness, and betweenness to rank node importance. However, these metrics reveal different aspects of structural criticality; the study is limited by its use of IEEE standards.
In [25], BC, DC, and clustering coefficients were used to evaluate vulnerable nodes in a power system with renewable energy resources, focusing on the IEEE 118-bus system and focusing on the electrical layer but overlooking cyber-layer vulnerabilities. Similarly, [26] investigated CC, DC, and eigenvector centrality metrics to identify critical nodes in power systems, applying their methods to IEEE 5-bus and 57-bus case studies without considering and designing an important node evaluation of the ICT layer. The authors in [27] determined the optimal location for microgrid placement in the modified IEEE 30-bus case study using BC, CC, and the clustering coefficient without considering the modeling and evaluation of the cyber layer. The results show that centrality-based placement of microgrids achieves the optimal location of microgrids that have better load satisfaction during outages, demonstrating the effectiveness of CNA in guiding MG deployment. In [28], CN theory was employed to model and analyze the vulnerability of the Nordic transmission grid, identifying weak points based on BC, DC, and CC for both weighted and unweighted graphs. The study in [29] used BC to identify vulnerable transmission lines in a power grid prone to wildfires, demonstrating BC’s role in mitigating grid vulnerabilities by pinpointing transmission lines whose failure could isolate entire communities. In [30], the authors used BC to quantify node importance by measuring how many shortest paths pass through a node, in which nodes with high BC are critical for network connectivity, and their failure can disrupt the power flow in a real-world isolated distribution grid in Cordova, Alaska. However, they only applied BC and did not consider other centrality methods or models or account for the ICT components.
1.2. Contributions
Table 1 provides a comparison of the aforementioned related works. While existing studies offer valuable insights, most rely heavily on IEEE standard test cases, which fall short in representing the complexities of real-world cyber–physical power systems (CPPSs)—especially at large scales or when accounting for interdependencies with information and communication technology (ICT) networks. Many focus solely on the power network, neglecting the ICT layer, significantly influencing system operations. Only a few studies model real distribution grids with integrated ICT, and even fewer validate centrality metrics against actual system performance indicators, such as the impact of node removal, revealing a notable gap in the literature regarding the analysis of large-scale, interconnected CPPSs.

Table 1.
Comparison of related works on CPPS vulnerability analysis using centrality metrics with our paper.
This study addresses the aforementioned research gaps by making the following key contributions:
- A real-world power distribution network integrated with an ICT network in northeastern Italy is analyzed, providing practical insights beyond synthetic test cases.
- Complex network theory is applied to model CPPSs, employing three centrality metrics—betweenness centrality (BC), degree centrality (DC), and closeness centrality (CC)—to assess node importance and vulnerability across various aspects of the model within an extensive real-case analysis.
- The centrality metrics are validated through node removal simulations, in which correlation coefficients between each metric and the resulting performance degradation are calculated to determine which metrics most accurately identify critical nodes.
- Actionable insights for system operators are provided, supporting more effective resource allocation, investment prioritization, and the development of resilience-enhancing strategies.
1.3. Paper Organization
The rest of the paper is structured as follows: Section 2 presents the methodology employed in this study to evaluate critical nodes in complex systems. Section 3 provides a comprehensive description of the case study. Section 4 details the simulation results, highlighting the advantages and disadvantages of the different approaches. Section 5 provides a discussion to analyze the correlation of centrality metrics with node removal performance. Lastly, Section 6 concludes the paper.
2. Methodology
2.1. An Overview of Complex Network Theory
Complex networks, rooted in the branch of applied mathematics known as graph theory, provide a valuable framework for examining the intricate connections and dependencies between global power systems and ICT networks [10]. This methodology facilitates the comprehension and modeling of interconnected systems, the identification of key nodes and potential vulnerabilities, and the enhancement of system robustness and resilience. A graph is denoted as , where represents the nodes, with n being their total number, and E signifies the edges linking these nodes. The set of neighbors for the i-th node, , includes all nodes directly connected to it. The degree of a node, indicated by , represents the number of its neighbors. Each graph is also characterized by an adjacency matrix A, which details the connections between nodes with elements such that if an edge exists between nodes i and j. Furthermore, graphs have a degree matrix D, a diagonal matrix where each diagonal entry corresponds to the degree of a node. The Laplacian matrix L, defined as , encapsulates the graph’s structure [31,32,33]. In addition, all graphs are divided into two categories: directed and undirected [34]. In directed graphs, edges have a direction, and the flow can only pass through the defined direction. In contrast, in an undirected graph, the flow can pass in any direction.
A power network combined with an ICT network, forming a cyber–physical power system (CPPS), is illustrated in the interdependent graph representation in Figure 1. In this CPPS, each layer consists of nodes and edges. In the physical layer, representing the power system, each substation serves as a node, while the electrical cables connecting these substations act as the edges of the graph. Similarly, in the cyber layer, also known as the ICT layer, the ICT substations are considered nodes, and the communication links between them are regarded as edges. The ICT network transmits control and monitoring signals to the power network, which, in turn, sends operational information back to the ICT network, ensuring seamless integration and coordination between the two systems.
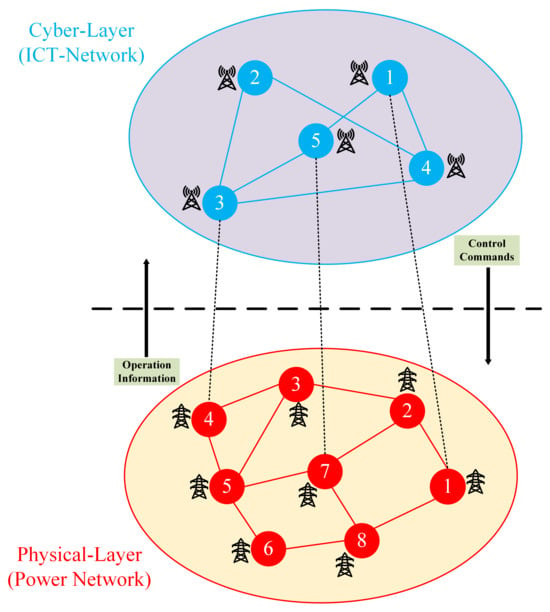
Figure 1.
General graph of a cyber–physical power system: red nodes and edges represent power substations and power lines, blue nodes and edges represent ICT substations and telecommunication links, and the cross-links are interdependent links between the two layers for operation, information, and control commands.
Centrality is a fascinating and essential concept in graph theory, functioning as a critical analytical tool to identify key nodes and edges within a network. As previously discussed, several centrality measures are available to evaluate the importance and influence of nodes in a graph. These measures include betweenness centrality (BC), which indicates the frequency at which a node appears on the shortest paths between other nodes; node degree centrality (DC), which counts the number of direct connections a node has; and closeness centrality (CC), which measures how quickly a node can reach all other nodes in the network. In the following subsection, we will delve into each of these centrality measures in greater detail, exploring their definitions.
2.2. Degree Centrality
Degree centrality (DC) is a widely utilized measure in the realm of centrality metrics, focusing on the degree of each node within a network. In this context, the degree of a node refers to the number of direct connections, or edges, it has to other nodes. Nodes with more connections are deemed more significant and thus possess higher DC. This measure is particularly useful in identifying the most influential nodes in terms of their immediate connectivity. The DC of a node can be mathematically represented by Equation (1) [35], which quantifies the importance of a node based on its direct connections. By identifying nodes with high DC, one can gain insights into the structure and dynamics of the network, facilitating more effective analysis and decision-making.
In this equation, denotes the count of edges linked to the node v, while N represents the overall number of nodes within the graph network. To illustrate, consider node 5 in the power network graph depicted in Figure 1. This particular node has more edges than the other nodes, indicating that its DC is higher. A higher DC suggests that the node plays a more crucial role in the network’s connectivity and may be more influential in transmitting information or resources.
DC can be subdivided into in-degree centrality and out-degree centrality within directed graph networks. In such networks, the DC of a node is determined by the number of edges directed towards the node (in-degree) and the number of edges emanating from the node (out-degree). These measures are represented by Equations (2) and (3), respectively [36]:
Here, denotes the count of edges incoming to node v. This quantifies the number of connections from other nodes directed toward node v, illustrating its ability to receive information or resources.
Conversely, in Equation (3) signifies the count of edges outgoing from node v. This measure reflects node v’s capacity to transmit information or resources to other nodes in the network.
Understanding these distinct facets of DC is crucial for analyzing node roles within directed networks. Nodes with high in-degree centrality are often perceived as influential or central since many nodes are directed toward them. Conversely, nodes with high out-degree centrality are typically viewed as influential in disseminating information or power, as they direct numerous connections outward. This differentiation aids in a comprehensive evaluation of interaction dynamics within the network.
2.3. Betweenness Centrality
Betweenness centrality (BC) measures a node’s importance in a network based on its position in the shortest paths (actual distance) between other nodes. Essentially, this metric evaluates how crucial a node is in facilitating connections across different parts of the graph network. For example, node 4 in the power network graph shown in Figure 1 exhibits low BC because removing it from the grid would not disrupt the shortest paths between other nodes, indicating its limited role in network connectivity. In contrast, node 5 demonstrates higher BC because it lies on multiple shortest paths between other nodes. This node acts as a bridge or intermediary, enhancing communication and interaction between different regions of the graph.
Here, represents the number of shortest paths between nodes i and j that pass through node v, and denotes the total number of shortest paths between nodes i and j. This formula quantifies how frequently a node serves as a critical link on shortest paths between pairs of nodes, thus revealing its centrality in network communication dynamics.
2.4. Closeness Centrality
Closeness centrality (CC) is a widely used measure that evaluates a node’s centrality within a network based on its average distance to all other nodes. Put simply, it indicates how quickly a node can connect with or access other nodes in the network. This centrality measure is computed using Equation (5) [38]:
Here, represents the CC of node v. The term denotes the shortest path distance between node v and node i. This distance is measured in terms of the number of edges in the shortest path connecting the two nodes. For example, if node v is directly connected to node i, the distance would be 1. If there is one intermediary node (e.g., v to w to i), the distance would be 2, and so on. N stands for the total number of nodes in the graph. This formula provides a quantitative assessment of how central or influential a node is within the network based on its proximity to other nodes.
CC can be subdivided into in-closeness centrality and out-closeness centrality within directed graph networks. In such networks, the CC of a node is determined by the average shortest path length from the node to all other nodes (out-closeness) and from all other nodes to the node (in-closeness). The length of a path in a directed graph refers to the total number of edges (or directed connections) that must be traversed to reach one node from another. For in-closeness centrality, the term in Equation (5) denotes the shortest distance from node v to node i, considering only incoming paths. This quantifies the efficiency of reaching node v from other nodes in the network, illustrating its accessibility for incoming information or resources. Conversely, for out-closeness centrality, the shortest distance from node v to node i only considers outgoing paths. This measure reflects node v’s efficiency in reaching other nodes in the network, highlighting its capacity to transmit information or resources effectively.
CC offers valuable insights into the efficiency of information or resource dissemination in a network. Nodes with higher closeness centrality are typically more central and can efficiently spread information or influence due to their shorter average path distances to other nodes. Understanding CC helps identify key nodes that play crucial roles in maintaining network cohesion and facilitating communication.
In this study, topological closeness centrality is employed to assess structural vulnerability, capturing how efficiently each node can reach others based on network connectivity. This measure reflects the graph-theoretical importance of nodes within the system, independent of electrical properties, and is consistent with standard practices in complex network analysis.
2.5. Node Removal Performance
In the node removal performance evaluation (NRP) procedure, the loss of supply continuity caused by a grid fault is assessed. To this purpose, the node supposed to be affected by a failure is removed from the network, and its impact on the grid operation is evaluated in terms of the number of nodes remaining disconnected from the main power supply. For simplicity and to adopt an approach coherent with the other centrality metrics, each node of the distribution network is assumed to have an equal number of users. Afterward, the removed node is restored, and the procedure continues by removing another node from the network and repeating the calculation until all nodes in the network are processed (Algorithm 1).
| Algorithm 1: Node Removal Performance. |
for each node of the network 1. Remove the node from the network 2. Calculate the number of nodes still supplied 3. Insert the removed node back into the network 4. Go to remove the next node in the network |
Figure 2 shows the flowchart of the proposed methodology. After constructing the graph using real data, both directed and undirected topologies are created for the power network, and an undirected topology is created for the ICT network. Centrality metrics are then calculated to rank the nodes based on their mathematical formulations.
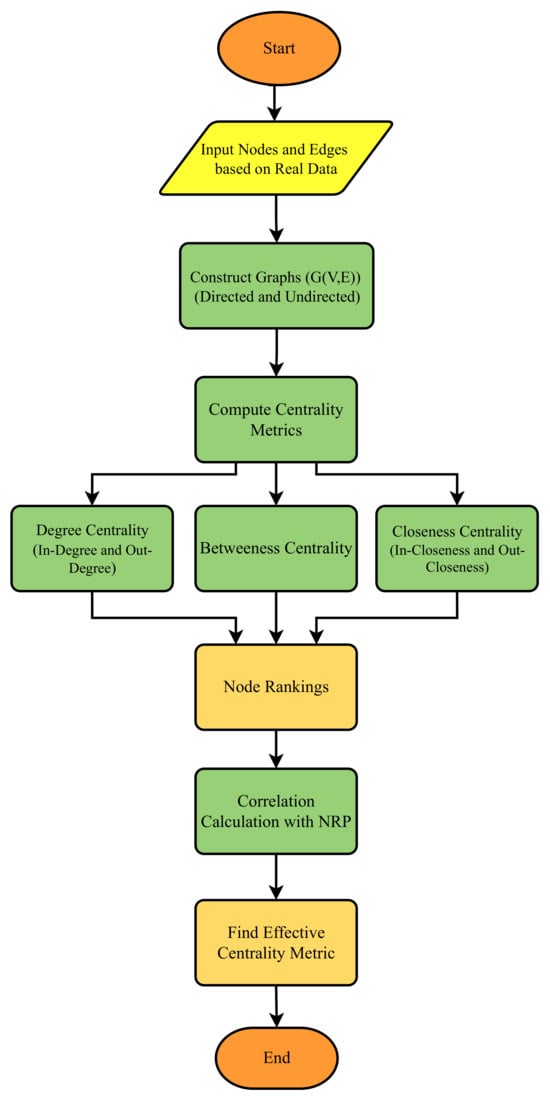
Figure 2.
The flowchart of the proposed methodology.
For the directed power network, the in-degree, out-degree, in-closeness, out-closeness, and betweenness centrality metrics are computed, each providing a node ranking based on its respective values. For the undirected power and ICT networks, the degree, closeness, and betweenness centrality metrics are calculated similarly to derive node rankings.
These centrality metric values for the three scenarios—directed power network, undirected power network, and undirected ICT network—are then compared with the NRP using Pearson correlation. Finally, the correlation results identify the most effective centrality metric for determining the critical nodes in the CPPS case study.
Pearson correlation is employed as a foundational and interpretable measure to examine the association between node centrality and NRP. While it assumes linearity and normality, it remains widely used in network science for first-order assessments. This study focuses on exploring the structural alignment between classical centrality metrics and robustness outcomes. Pearson correlation serves this purpose effectively, offering clarity and avoiding the complexity, data demands, and interpretability issues of nonlinear alternatives. Moreover, it provides a meaningful baseline for comparative analysis without overfitting risks.
All centrality metrics were computed offline on static, unweighted network topologies. In-degree and out-degree centralities were calculated through direct node counts. Closeness centrality was computed on the original and reversed graphs to capture out- and in-closeness, respectively. Betweenness centrality was derived using Brandes’ algorithm, which has a time complexity of O(nm), which is high compared to the other centrality metrics. However, given the modest network size (169 nodes), computational complexity was not a limiting factor.
3. Case Study
In order to assess similarities and differences among the different approaches, each centrality metric is applied to a real case study involving a power distribution network located in northeastern Italy (Figure 3). The medium voltage distribution grid is connected to the transmission system via a high-voltage/medium-voltage substation. It comprises a total of 154 power nodes, supplying secondary substations and medium-voltage users, interconnected by 158 power lines.
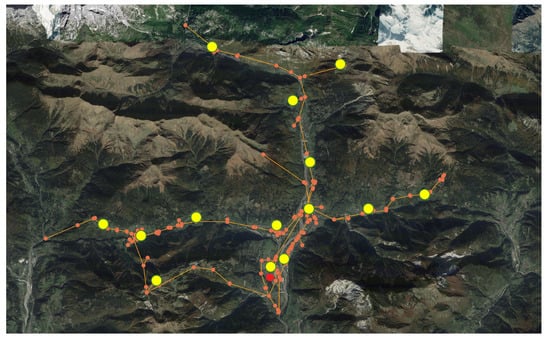
Figure 3.
Case study (orange nodes are power nodes and RTUs; yellow nodes are MBSs; and the red node is the data or control center).
The power network is operational and managed by distribution system operators. It is supplemented by a realistic model of the information and communication technology (ICT) layer. The ICT layer in this case study comprises 154 remote terminal units (RTUs), each associated with a power node, and 14 mobile base stations (MBSs) connected to a data or control center. In Figure 3, power nodes and RTUs are shown as orange nodes, indicating that each power node is equipped with an RTU. The MBSs, represented by yellow nodes, are strategically positioned within approximately 2 km radius zones, with RTUs in each zone connected to their respective MBS. Extra MBSs are typically deployed in urban regions, particularly in areas with a higher concentration of power stations or RTUs, to enhance system performance, ensure full coverage, and improve reliability. A red node represents the data or control center. Each RTU installed at a power substation connects to the MBSs in its vicinity, and the MBSs are interconnected and linked to the data or control center.
Figure 4 illustrates the power network integration with the ICT network under study through graph network modeling. In this modeling approach, power nodes and lines form the graph of the power distribution system, while RTUs, MBSs, and the data center, along with their communication links, create the ICT network graph. The nodes’ geographical positions reflect the actual power and ICT substation’s locations. In detail, red nodes and edges symbolize power-related components, while blue nodes and edges denote ICT elements. Node 29 within the power network graph is the connection point to the high-voltage system, i.e., the primary substation, where the high-voltage/medium-voltage transformers are placed. Within the ICT network graph, each MBS is connected to surrounding RTUs, and MBSs are interconnected with one another and the central data center. This layout enables the transmission of control signals and the receipt of monitoring feedback for the power network.
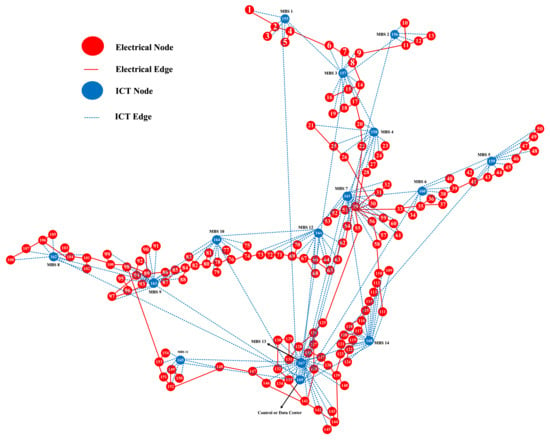
Figure 4.
The graph model of the cyber–physical power network case study.
It is important to note that the model excludes direct electrical connections between the power and ICT nodes required for supplying power to ICT devices. This is because, during power outages, ICT equipment is supposed to remain functional on backup power sources (i.e., batteries).
In the graph modeling of the case study, edge weights in both the power and communication networks were treated as uniform (i.e., unweighted), focusing on the structural aspects of vulnerability rather than the dynamic electrical or communication properties. However, the proposed methodology is flexible and can be extended to incorporate weighted edges.
The entire system is implemented and simulated using the Python 3.11 programming language, which utilizes its open-source capabilities through the NetworkX, Pandas, and Matplotlib libraries.
4. Simulation Results
In this research, we conducted an in-depth analysis of DC, BC, and CC metrics for three different conditions of the CPPS case study.
- The first condition is relevant to a directed power network, where the power is supposed to specifically flow from the primary substation (node 29) downstream, reflecting the constraints of hierarchical (radial) power distribution systems in the standard operation condition.
- The second scenario considers an undirected power network where all edges are bidirectional. It represents a flexible grid where electricity can flow in both directions, simulating real-world scenarios where energy can be redistributed for reliability and resilience. For example, this scenario represents the case of a distribution grid that, after a fault, can be reconfigured by the distribution system operator (DSO) to counterfeed the healthy portion of the network.
- The third condition is a bidirectional ICT network, where the control and data center must send control commands and receive operational information from the power network.
These three conditions were chosen because each centrality metric produces unique results depending on whether the network is undirected or directed. For example, BC in a graph with a specific topology can vary based on the direction of edges and the flow of power or information through the network.
4.1. Directed Power Network Graph
Figure 5 shows the centrality metrics calculated for the real distribution network under analysis in the case of a directed power network. Table 2 reports the centrality metrics of the 20 nodes with the highest centrality based on DC, BC, and CC metrics.
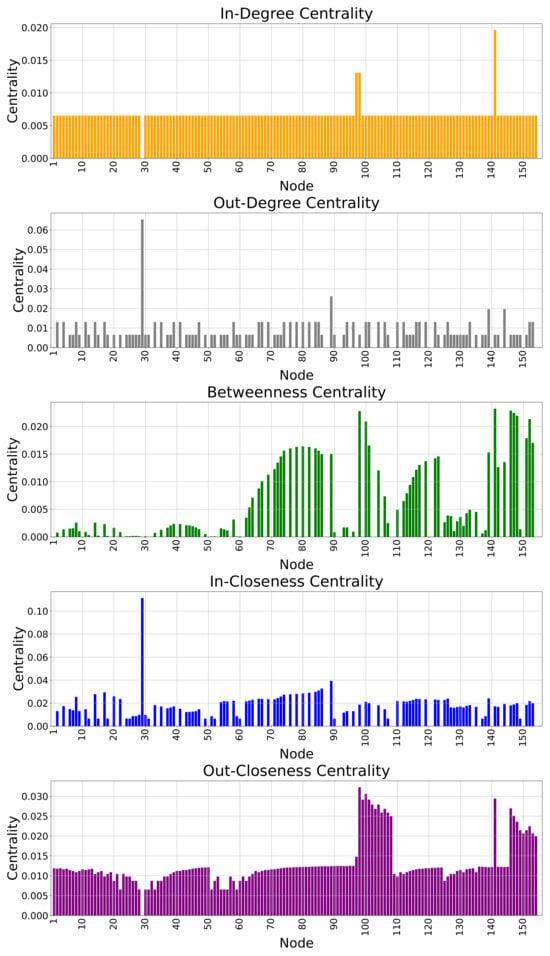
Figure 5.
Centrality metrics for the directed power network.

Table 2.
The 20 nodes with the highest centrality metrics in the directed power network graph.
As already introduced, this scenario is relevant to a radial power distribution system where the power flows from the primary substation to the nodes where the electrical load is connected. This centrality analysis is useful for identifying nodes of the system to be considered more critical for network reliability: in particular, the assumption of the directed power network graph is coherent to a scenario in which the power supplied to users can just flow from the interface with the high-voltage system (primary substation) to the single nodes of the network. Since the grid of the considered case study has a radial layout, this implies that if a node of the grid fails, all the nodes downstream are disconnected from the main supply without the possibility of reverse feeding.
The DC in the directed power network is calculated based on in- and out-degree centrality. In the in-degree centrality, node 141 has more centrality because it receives electricity flow from three nodes (nodes 142, 135, and 133). Therefore, this node has three edges with incoming electricity flow. Also, nodes 97 and 98 have more in-degree centrality after node 141. Node 29 (primary substation) has an in-degree centrality equal to zero because no other nodes send electricity flow to this node. Other nodes in the power network have the same in-degree centrality because they are just connected to one node that sends the electricity flow to them. In the out-degree centrality analysis, node 29 has the highest value because it distributes power to the whole network. Node 89 has the second highest out-degree centrality because this node has four edges that distribute power to other nodes. Nodes 139 and 134 also have higher centrality and play an important role in the power network. Many nodes have out-degree centrality equal to zero, which means that these nodes are located at the end of collaterals.
The BC metrics results for the directed power network show that nodes 141, 146, 98, 147, 148, 152, and 100 have approximately equal and the highest BC compared to other nodes in the power network. However, many other nodes have BC values that are not very dissimilar from the top-ranking ones: these are in Table 2, and all the nodes are from 151 to 86. When nodes have high BC, it means that they have an important role in the stability, connection of radials, and robustness of the power network. According to Figure 5, many nodes have BC equal to zero because they are not critical for direct connectivity between other nodes.
CC in the directed power network is calculated using both in-closeness centrality and out-closeness centrality. The results for the in-closeness centrality (In-CC) metric show that node 29 stands out significantly, with an in-closeness centrality of 0.111, far higher than the others. The second-highest in-closeness centrality belongs to node 89, underscoring its importance as the second most central node in terms of in-closeness. Nodes 86 through 116 also exhibit high in-closeness centrality values, though these values decrease gradually, with little variation between them. This indicates that these nodes can be reached quickly by others, emphasizing their importance in the network’s overall connectivity. The out-closeness centrality analysis reveals that node 98 has the highest out-closeness centrality, indicating that it can reach other nodes more quickly than any other node in the network. Node 100 follows closely, demonstrating its significant role in efficiently transmitting to the rest of the network. Nodes 141, 99, and 101 have nearly identical out-closeness values, around 0.029, suggesting they are similarly positioned as efficient distributors within the network. The remaining nodes, from 102 to 153, have slightly lower but still relatively high out-closeness values, ranging from 0.027 to 0.020. This gradual decrease in centrality indicates that while these nodes remain crucial for network transmission, their ability to reach others quickly is slightly lower than the top nodes. It means they require longer paths (potentially involving more intermediate nodes) to distribute power to the rest of the network.
Node Removal Performance for Directed Power Network
Figure 6 shows the results for the NRP for the directed power network, and Table 3 shows the top 20 nodes with the highest performance reduction.
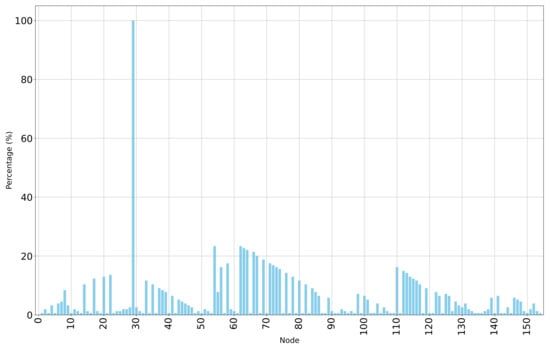
Figure 6.
Node removal performance for the directed power network.

Table 3.
The 20 nodes with the highest centrality metrics for node removal performance for the undirected power network.
As expected, the results of the node removal approach applied to the directed power network indicate that removing node 29 (primary substation) leads to a complete failure in network performance. This occurs because all network users lose access to energy when node 29 is removed. Nodes 54 and 62, with the same performance reduction, are the other important nodes and ranked the second most critical stage in the table, as their removal disconnects 36 nodes from the network and results in a 23.37% decrease in network performance. Other important nodes in the power network include nodes 63 and 64 and nodes down to 20, as shown in Table 3.
4.2. Undirected Power Network Graph
The centrality metrics for the undirected power network are shown in Figure 7, and the top 20 nodes with high centrality are shown in Table 4.
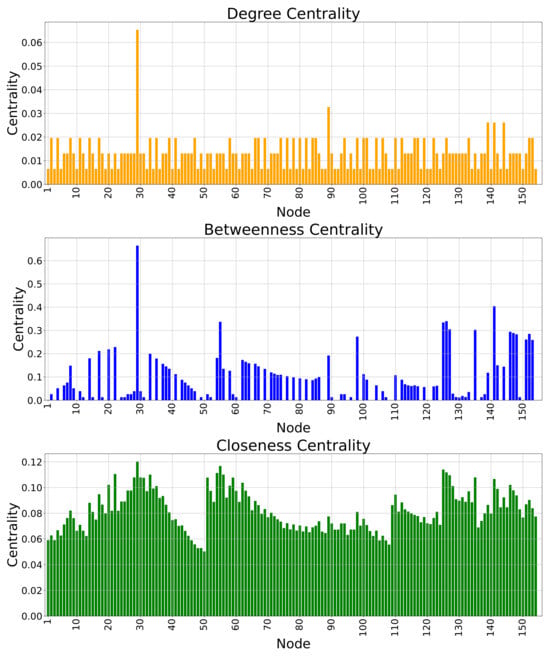
Figure 7.
Centrality metrics for the undirected power network.

Table 4.
The 20 nodes with the highest centrality metrics in the undirected power network graph.
As expected, the DC metric shows that node 29 (the primary substation) has the highest centrality compared to all of the other nodes in the power network. Since this node is where the medium voltage distribution system originates, it is connected to many nodes (10 nodes) in the network. Node 89 is the second node in the DC ranking because it is connected to five nodes. Nodes 139, 141, and 144 have a DC index very close to node 89 for the high number of nodes interconnected with them. Thus, they have an important role in the network’s reliability and safety. Nodes from 2 to 69 show a significant DC value. Consequently, they are important for the network operation and reliability: these are nodes interconnected with three surrounding nodes. Less important nodes are those with fewer interconnections or located at the end of radials. These nodes have less DC compared to other nodes in the network.
The BC metric analysis shows that node 29 has the highest centrality among all the other power network nodes. This is because this node connects all feeders of the power network and is the main one responsible for influencing and controlling power flow through all parts of the power network. Node 141 also has a high BC after node 29 and plays an important role in the connectivity of the power network. Node numbers 126 to 54, according to Table 4, also have more BC compared to the remaining nodes in the power network, demonstrating that they have an important role in radials’ connectivity and the power network’s robustness. According to Figure 7, many nodes have BC equal to zero, which means that these nodes are not critical for direct connectivity between other nodes.
According to Table 4, the CC metric analysis demonstrates that the top 20 nodes have very similar centrality values. Node 29 has the highest CC. In general, nodes with the highest CC show the shortest average distance to all other nodes, and they can play an important role in ensuring effective power exchange throughout the entire network.
Node Removal Performance for Undirected Power Network
Figure 8 shows the results of node removal performance for the undirected power graph. Table 5 shows the top 20 nodes with the highest performance reduction.
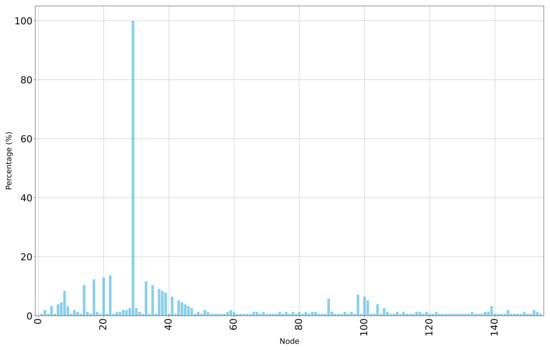
Figure 8.
Node removal performance for the undirected power network.

Table 5.
The 20 nodes with the highest node removal performance for the undirected power network.
The results for node removal in the undirected power network indicate that removing node 29 leads to a complete failure in network performance. This occurs because all users in the network lose access to energy when node 29 is removed. Node 22 is the second most critical, as its removal disconnects 21 nodes from the network, resulting in a 13.63% decrease in network performance. Other important nodes in the power network include nodes 20, 17, and nodes down to 6, as shown in Table 5. Some nodes, such as nodes 14 and 35 or 8 and 38, have the same rank and result in the same percentage reduction in performance because their removal disconnects the same number of nodes in the undirected power network.
4.3. ICT Network Graph
The centrality metrics for the ICT network graph are shown in Figure 9, and the top 20 nodes with more centrality are shown in Table 6.
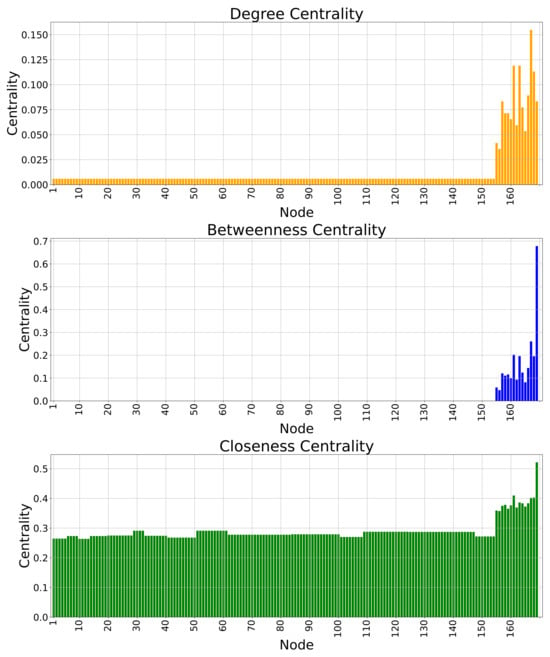
Figure 9.
Centrality metrics for the ICT network.

Table 6.
The 20 nodes with the highest centrality metrics in the ICT network graph.
The results of the DC metric for the ICT graph or the cyber layer demonstrate that node 167 (MBS 13) has the highest DC because this node has more connected edges than other nodes. Additionally, nodes 163 (MBS 9) and 161 (MBS 7) have the same and high DC, and they are important nodes because they also have more edges connected to other nodes. Other nodes from node 168 (MBS 14) to node 156 (MBS 2) have high DC according to Table 6. Other nodes, or the RTUs, have the lowest degree of centrality because they have one edge and are the end nodes of the ICT network graph. The results of the degree centrality for the ICT network graph show that MBSs and the data center have important roles in the ICT network compared to RTUs.
The BC metric results show that the RTUs (Nodes 1 to 154) have a centrality equal to zero, meaning that RTUs do not function as bridges or intermediaries along the shortest paths between other nodes in the network. According to Figure 9 and Table 6, node 169 (data center) has the highest BC and plays a critical role as a central bridge between other nodes in the network. Other nodes, from 167 (MBS 13), which has the second highest BC, down to 156 (MBS 2), which has lower BC among the MBSs, are also important nodes. The results of the BC for the ICT networks show that the MBSs have a critical role in the network compared to the RTUs.
The closeness centrality (CC) metric for the ICT network demonstrates that MBSs have the highest centrality. Node 169 has the highest CC because it is closer to other nodes in the network. Also, nodes from 161 (MBS 7) to 156 (MBS 2) have high CC. Other nodes, which are RTUs, have a lower CC compared to MBS, confirming that MBSs are very important for the data exchange in the network.
Node Removal Performance for the ICT Network
Figure 10 and Table 7 show the node removal performance results for the ICT network graph and the top 20 nodes with high performance reduction, respectively.
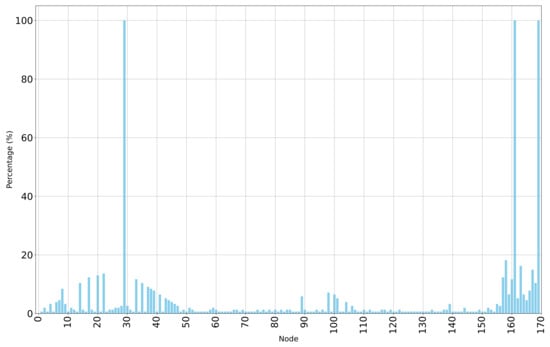
Figure 10.
Node removal performance for the ICT network.

Table 7.
The 20 nodes with the highest node removal performance for the ICT network.
The results for node removal in the cyber network indicate that removing nodes 29 (RTU 29), 161 (MBS 7), or 169 (data/control center) leads to a complete failure in network performance. This is because, without node 29 (RTU), it is supposed that node 29 in the power network becomes disconnected (primary substation), causing a blackout on the whole network. Similarly, removing node 161 (MBS 7) in the cyber network renders node 29 uncontrollable and subsequently disconnected, leading to a loss of power and energy across the network. Additionally, if node 169 (data/control center) is removed, the power network loses control and fails entirely. Thus, based on the node removal analysis, these three nodes are the most critical in the cyber network. Other important nodes in the cyber network include nodes 158 (MBS 4), 163 (MBS 9), and 167 (MBS 13). The findings indicate that MBSs affecting control over a greater number of nodes are critical, as are RTUs whose removal impacts multiple nodes’ controllability. Removing these nodes causes multiple power nodes to lose control and disconnect from the power network. Additional important nodes are listed in Table 7.
5. Discussion
This section compares the different centrality metrics with node removal performance, which is a key indicator of overall network resilience for the three scenarios. Node removal performance provides valuable insights for operators. It serves as a primary reference for evaluating network robustness since it measures the number of nodes disconnected from the main supply during a failure of the power or ICT systems. The comparison is based on the correlation between the centrality metrics and the node removal performance. Thus, by analyzing all centrality metrics in relation to node removal performance, we can assess the significance of each metric in ensuring network stability.
Figure 11, Figure 12 and Figure 13 illustrate the Pearson correlation between centrality metrics and node removal performance for the directed power network, undirected power network, and ICT network, respectively. The correlation values for each scenario are presented in Table 8. Note that the correlation for node 29 is not shown in the figures because it differs significantly from the correlations of other nodes.
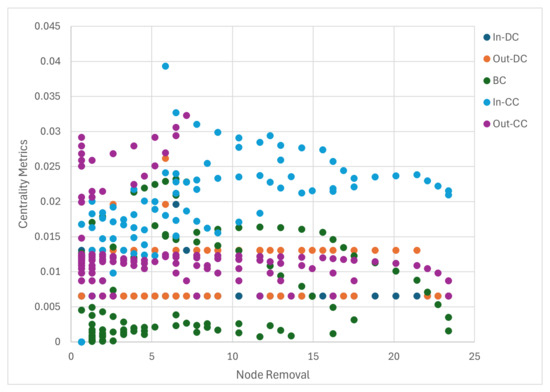
Figure 11.
Correlation of centrality metrics with node removal performance for the directed power network.
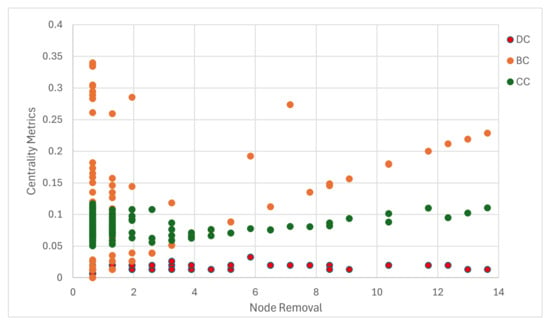
Figure 12.
Correlation of centrality metrics with node removal performance for undirected power network.
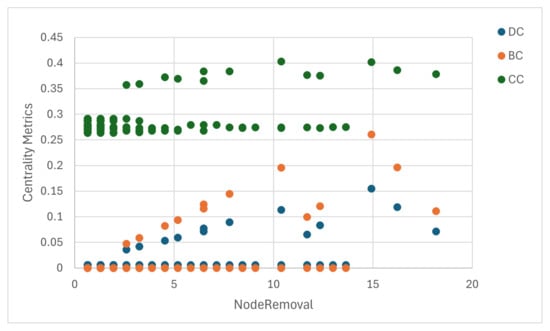
Figure 13.
Correlation of centrality metrics with node removal performance for the ICT network.

Table 8.
Correlation value between centrality metrics and node removal performance.
In the directed power network, In-CC and Out-DC exhibit stronger correlations with node removal performance compared to the other centrality metrics, with values of 0.84 and 0.74, respectively. BC does not demonstrate a strong correlation with node removal performance. Conversely, In-DC and Out-CC have negative correlations, indicating that they are less useful in identifying critical nodes in the power network. These results highlight that In-CC and Out-DC metrics are more effective for identifying critical nodes in the directed power network.
In the undirected power network, DC shows the highest correlation with node removal performance, with a value of 0.67. BC has a correlation of 0.53, which is the second-highest value after DC. On the other hand, CC does not exhibit a high correlation, indicating that CC is not effective in identifying critical nodes. The results demonstrate that DC is the most useful metric for identifying critical nodes in the undirected power network.
BC demonstrates the highest correlation in the ICT network, with a value of 0.64. Following BC, CC exhibits the second-highest correlation value. Conversely, DC has the lowest correlation value. These results indicate that BC is the most effective centrality metric for identifying critical nodes in the ICT network.
As shown in Table 8, the BC correlation drops from 0.53 in the undirected to 0.21 in the directed power network, underscoring the impact of directional constraints. In contrast, BC maintains higher relevance in the ICT network (0.64), which features richer path redundancy.
This research gives a strong practical vision to the distribution system operator to clearly know the vulnerable nodes in the CPPS. For example, for the ICT network, the correlation between the centrality metrics and the node removal performance shows that the best metric for the ICT network for vulnerability assessment is the betweenness centrality. Therefore, according to the betweenness centrality, the MBSs with high BC are very important, and they should be protected based on different strategies based on the opinion of the distribution system operator. For example, if node 169 fails, 100% of the network performance will be down. By failure of node 167, ~15% of the network’s performance would be reduced, and this vision can help the distribution system operator protect more important MBSs regarding different types of disasters.
6. Conclusions and Future Works
In this paper, the topological modeling and assessment of node significance in a large-scale, real-world power distribution system integrated with an ICT network in northeastern Italy were addressed using complex network theory. Degree, betweenness, and closeness centrality metrics were applied to the CPPS and modeled as graph networks to evaluate critical nodes in the system. The results showed that these centrality metrics effectively identified critical nodes across three scenarios: a directed power network, an undirected power network, and an undirected ICT network. The top 20 most important nodes for each centrality metric were identified and presented in dedicated tables. The centrality metrics results were compared to a benchmark metric called NRP to evaluate the effectiveness of each centrality metric in identifying critical nodes. The simulation results indicate that the in-closeness and out-degree centrality metrics were the most effective in the directed power network, showing correlation values of 84% and 74% with NRP, respectively. In the undirected power network, degree centrality demonstrated the highest effectiveness with a 67% correlation, followed by betweenness centrality at 53%. In the ICT network, betweenness centrality was the most effective (64%), followed by closeness centrality (55%). This analysis can help distribution system operators identify the most critical nodes in CPPSs, enabling them to implement precautionary measures that enhance system resilience. For example, the failure of MBS 7 can trigger cascading failures that ultimately isolate node 29, resulting in a widespread grid outage. Similarly, the failure of MBS 4 could fail 28 nodes in the power grid, reducing the network’s performance by 18.18%. These findings validate the proposed centrality metrics as practical tools for resilience planning.
Future work could include planning to explore and evaluate group centrality metrics about various system performance indicators, considering the dynamic behavior of nodes based on voltage and power assessments, including larger-scale case studies, such as those involving metropolitan areas. Additionally, it can include classifying critical nodes using machine learning algorithms combined with centrality metrics and is intended to investigate strategies for enhancing the resilience of these central nodes, including integrating renewable energy resources, microgrids, and energy storage systems, with a particular focus on modeling the impact of disasters such as snowfall and cyber-attacks.
Author Contributions
Conceptualization, M.D.; data curation, M.D.; investigation, M.D.; methodology, M.D.; project administration, D.F.; software, M.D.; supervision, D.F.; validation, D.F., S.B. and G.V.; visualization, M.D.; writing—original draft, M.D.; writing—review and editing, D.F. All authors have read and agreed to the published version of the manuscript.
Funding
This research received no external funding.
Data Availability Statement
Data is unavailable due to privacy or ethical restrictions.
Conflicts of Interest
The authors declare no conflicts of interest.
References
- Myhre, S.F.; Fosso, O.B.; Heegaard, P.E.; Gjerde, O.; Kjølle, G.H. Modeling interdependencies with complex network theory in a combined electrical power and ICT system. In Proceedings of the 2020 International Conference on Probabilistic Methods Applied to Power Systems (PMAPS), Liege, Belgium, 18–21 August 2020; IEEE: Piscataway, NJ, USA, 2020; pp. 1–6. [Google Scholar]
- Lee, E.A.; Seshia, S.A. Introduction to Embedded Systems: A Cyber-Physical Systems Approach; MIT Press: Cambridge, MA, USA, 2017. [Google Scholar]
- Yohanandhan, R.V.; Elavarasan, R.M.; Pugazhendhi, R.; Premkumar, M.; Mihet-Popa, L.; Terzija, V. A holistic review on Cyber-Physical Power System (CPPS) testbeds for secure and sustainable electric power grid–Part–I: Background on CPPS and necessity of CPPS testbeds. Int. J. Electr. Power Energy Syst. 2022, 136, 107718. [Google Scholar] [CrossRef]
- Jimada-Ojuolape, B.; Teh, J. Impact of the integration of information and communication technology on power system reliability: A review. IEEE Access 2020, 8, 24600–24615. [Google Scholar] [CrossRef]
- Mohamed, A.A.A. On the rising interdependency between the power grid, ICT network, and E-mobility: Modeling and analysis. Energies 2019, 12, 1874. [Google Scholar] [CrossRef]
- Wang, S.; Gu, X.; Chen, J.; Chen, C.; Huang, X. Robustness improvement strategy of cyber-physical systems with weak interdependency. Reliab. Eng. Syst. Saf. 2023, 229, 108837. [Google Scholar] [CrossRef]
- Shi, L.; Dai, Q.; Ni, Y. Cyber–physical interactions in power systems: A review of models, methods, and applications. Electr. Power Syst. Res. 2018, 163, 396–412. [Google Scholar] [CrossRef]
- Andersson, G.; Donalek, P.; Farmer, R.; Hatziargyriou, N.; Kamwa, I.; Kundur, P.; Martins, N.; Paserba, J.; Pourbeik, P.; Sanchez-Gasca, J.; et al. Causes of the 2003 major grid blackouts in North America and Europe, and recommended means to improve system dynamic performance. IEEE Trans. Power Syst. 2005, 20, 1922–1928. [Google Scholar] [CrossRef]
- Berizzi, A. The italian 2003 blackout. In Proceedings of the IEEE Power Engineering Society General Meeting, Denver, CO, USA, 6–10 June 2004; IEEE: Piscataway, NJ, USA, 2004; pp. 1673–1679. [Google Scholar]
- Amani, A.M.; Jalili, M. Power grids as complex networks: Resilience and reliability analysis. IEEE Access 2021, 9, 119010–119031. [Google Scholar] [CrossRef]
- Wang, C.; Ju, P.; Wu, F.; Pan, X.; Wang, Z. A systematic review on power system resilience from the perspective of generation, network, and load. Renew. Sustain. Energy Rev. 2022, 167, 112567. [Google Scholar] [CrossRef]
- Hokstad, P.; Utne, I.B.; Vatn, J. Risk and Interdependencies in Critical Infrastructures; Springer: Berlin/Heidelberg, Germany, 2012. [Google Scholar]
- Ganguly, A.R.; Bhatia, U.; Flynn, S.E. Critical Infrastructures Resilience: Policy and Engineering Principles; Routledge: London, UK, 2018. [Google Scholar]
- Ramos, G.; Sanchez, J.L.; Torres, A.; Rios, M. Power systems security evaluation using petri nets. IEEE Trans. Power Deliv. 2009, 25, 316–322. [Google Scholar] [CrossRef]
- Wäfler, J.; Heegaard, P.E. A combined structural and dynamic modelling approach for dependability analysis in smart grid. In Proceedings of the 28th Annual ACM Symposium on Applied Computing, Coimbra, Portugal, 18–22 March 2013; pp. 660–665. [Google Scholar]
- Rausand, M. Risk Assessment: Theory, Methods, and Applications; John Wiley & Sons: Hoboken, NJ, USA, 2013; Volume 115. [Google Scholar]
- Li, Y.; Ge, Y.; Xu, T.; Zhu, M.; He, Z. Controllability evaluation of complex networks in cyber–physical power systems via critical nodes and edges. Int. J. Electr. Power Energy Syst. 2024, 155, 109625. [Google Scholar] [CrossRef]
- Amani, A.M.; Gaeini, N.; Jalili, M.; Yu, X. Which generation unit should be selected as control leader in secondary frequency control of microgrids? IEEE J. Emerg. Sel. Top. Circuits Syst. 2017, 7, 393–402. [Google Scholar] [CrossRef]
- Ankur Bahl, A.S.; Garg, R.K. Comparison of Petri Net and Markov Approach for Availability Analysis of System. Vivechan Int. J. Res. 2018, 9, 63–69. [Google Scholar]
- Trivedi, K.S.; Bobbio, A. Reliability and Availability Engineering: Modeling, Analysis, and Applications; Cambridge University Press: Cambridge, UK, 2017. [Google Scholar]
- Signoret, J.P.; Leroy, A. Reliability Assessment of Safety and Production Systems: Analysis, Modelling, Calculations and Case Studies; Springer Nature: Berlin/Heidelberg, Germany, 2021. [Google Scholar]
- Li, J.; Lin, Y.; Su, Q. Identifying critical nodes of cyber–physical power systems based on improved adaptive differential evolution. Electr. Power Syst. Res. 2024, 229, 110112. [Google Scholar] [CrossRef]
- Narimani, M.R.; Huang, H.; Umunnakwe, A.; Mao, Z.; Sahu, A.; Zonouz, S.; Davis, K. Generalized contingency analysis based on graph theory and line outage distribution factor. IEEE Syst. J. 2021, 16, 626–636. [Google Scholar] [CrossRef]
- Milanović, J.V.; Zhu, W. Modeling of interconnected critical infrastructure systems using complex network theory. IEEE Trans. Smart Grid 2017, 9, 4637–4648. [Google Scholar] [CrossRef]
- Hu, F.; Chen, L.; Chen, J. Robustness evaluation of complex power grids containing renewable energy. Int. J. Electr. Power Energy Syst. 2021, 132, 107187. [Google Scholar] [CrossRef]
- Adebayo, I.; Sun, Y. New approaches for the identification of influential and critical nodes in an electric grid. Arch. Electr. Eng. 2022, 71, 671–686. [Google Scholar]
- Saleh, M.; Esa, Y.; Mohamed, A. Applications of complex network analysis in electric power systems. Energies 2018, 11, 1381. [Google Scholar] [CrossRef]
- Forsberg, S.; Thomas, K.; Bergkvist, M. Power grid vulnerability analysis using complex network theory: A topological study of the Nordic transmission grid. Phys. A Stat. Mech. Its Appl. 2023, 626, 129072. [Google Scholar] [CrossRef]
- Jones, C.B.; Bresloff, C.J.; Darbali-Zamora, R. Electric Grid Vulnerability Analysis to Identify Communities Prone to Wildfires. IEEE Access 2023, 11, 35630–35638. [Google Scholar] [CrossRef]
- Kandaperumal, G.; Pandey, S.; Srivastava, A. AWR: Anticipate, withstand, and recover resilience metric for operational and planning decision support in electric distribution system. IEEE Trans. Smart Grid 2021, 13, 179–190. [Google Scholar] [CrossRef]
- Doostinia, M.; Beheshti, M.T.; Alavi, S.A.; Guerrero, J.M. Distributed event-triggered average consensus control strategy with fractional-order local controllers for DC microgrids. Electr. Power Syst. Res. 2022, 207, 107791. [Google Scholar] [CrossRef]
- Doostinia, M.; Beheshti, M.T.H.; Alavi, S.A. A distributed control strategy with fractional order PI controller for DC microgrid. In Proceedings of the 2019 Smart Grid Conference (SGC), Tehran, Iran, 18–19 December 2019; IEEE: Piscataway, NJ, USA, 2019; pp. 1–6. [Google Scholar]
- Doostinia, M.; Beheshti, M.T.; Alavi, S.A.; Guerrero, J.M. Distributed control strategy for DC microgrids based on average consensus and fractional-order local controllers. IET Smart Grid 2021, 4, 549–560. [Google Scholar] [CrossRef]
- Cuadra, L.; Salcedo-Sanz, S.; Del Ser, J.; Jiménez-Fernández, S.; Geem, Z.W. A critical review of robustness in power grids using complex networks concepts. Energies 2015, 8, 9211–9265. [Google Scholar] [CrossRef]
- Pavel, H.; Roy, A.; Santra, A.; Chakravarthy, S. Degree Centrality Definition, and Its Computation for Homogeneous Multilayer Networks Using Heuristics-Based Algorithms. In Proceedings of the International Joint Conference on Knowledge Discovery, Knowledge Engineering, and Knowledge Management; Springer: Berlin/Heidelberg, Germany, 2022; pp. 28–52. [Google Scholar]
- Doostinia, M.; Falabretti, D.; Verticale, G.; Bolouki, S. Node Centrality Evaluation Based on Complex Network Theory: A Real Case Study for an Integrated Power Distribution and ICT System. In Proceedings of the 2024 AEIT International Annual Conference (AEIT), Trento, Italy, 25–27 September 2024; IEEE: Piscataway, NJ, USA, 2024; pp. 1–6. [Google Scholar]
- Umunnakwe, A.; Sahu, A.; Narimani, M.R.; Davis, K.; Zonouz, S. Cyber-physical component ranking for risk sensitivity analysis using betweenness centrality. IET Cyber-Phys. Syst. Theory Appl. 2021, 6, 139–150. [Google Scholar] [CrossRef]
- Abdalla, O.H.; Eldin, A.N.; Emary, A.A.; Farid, A.W. Power system restoration using closeness centrality and degree of a node. Restoration 2019, 7, 11. [Google Scholar]
Disclaimer/Publisher’s Note: The statements, opinions and data contained in all publications are solely those of the individual author(s) and contributor(s) and not of MDPI and/or the editor(s). MDPI and/or the editor(s) disclaim responsibility for any injury to people or property resulting from any ideas, methods, instructions or products referred to in the content. |
© 2025 by the authors. Licensee MDPI, Basel, Switzerland. This article is an open access article distributed under the terms and conditions of the Creative Commons Attribution (CC BY) license (https://creativecommons.org/licenses/by/4.0/).