
A Spatial Analysis of the Wind and Hydrogen Production in the Black Sea Basin


Abstract
1. Introduction
2. Materials and Methods
3. Results and Discussions
4. Conclusions
Author Contributions
Funding
Data Availability Statement
Acknowledgments
Conflicts of Interest
References
- IEA. Global Energy Review 2025; IEA: Paris, France, 2025. [Google Scholar]
- Jones, C.; Simmons, S.; Moore, J. Geology of the Utah Frontier Observatory for Research in Geothermal Energy (FORGE) Enhanced Geothermal System (EGS) Site. Geothermics 2024, 122, 103054. [Google Scholar] [CrossRef]
- Xue, Z.; Ma, H.; Wei, Y.; Wu, W.; Sun, Z.; Chai, M.; Zhang, C.; Chen, Z. Integrated Technological and Economic Feasibility Comparisons of Enhanced Geothermal Systems Associated with Carbon Storage. Appl. Energy 2024, 359, 122757. [Google Scholar] [CrossRef]
- Djalab, A.; Djalab, Z.; El Hammoumi, A.; Marco TINA, G.; Motahhir, S.; Laouid, A.A. A Comprehensive Review of Floating Photovoltaic Systems: Tech Advances, Marine Environmental Influences on Offshore PV Systems, and Economic Feasibility Analysis. Sol. Energy 2024, 277, 112711. [Google Scholar] [CrossRef]
- Manolache, A.I.; Andrei, G.; Rusu, L. An Evaluation of the Efficiency of the Floating Solar Panels in the Western Black Sea and the Razim-Sinoe Lagunar System. J. Mar. Sci. Eng. 2023, 11, 203. [Google Scholar] [CrossRef]
- Widén, J.; Carpman, N.; Castellucci, V.; Lingfors, D.; Olauson, J.; Remouit, F.; Bergkvist, M.; Grabbe, M.; Waters, R. Variability Assessment and Forecasting of Renewables: A Review for Solar, Wind, Wave and Tidal Resources. Renew. Sustain. Energy Rev. 2015, 44, 356–375. [Google Scholar] [CrossRef]
- Manolache, A.I.; Andrei, G. A Comprehensive Review of Multi-Use Platforms for Renewable Energy and Aquaculture Integration. Energies 2024, 17, 4816. [Google Scholar] [CrossRef]
- Renewable Power Generation Costs in 2023. Available online: https://www.irena.org/Publications/2024/Sep/Renewable-Power-Generation-Costs-in-2023 (accessed on 16 February 2025).
- Maienza, C.; Avossa, A.M.; Picozzi, V.; Ricciardelli, F. Feasibility Analysis for Floating Offshore Wind Energy. Int. J. Life Cycle Assess. 2022, 27, 796–812. [Google Scholar] [CrossRef]
- Vinhoza, A.; Schaeffer, R. Brazil’s Offshore Wind Energy Potential Assessment Based on a Spatial Multi-Criteria Decision Analysis. Renew. Sustain. Energy Rev. 2021, 146, 111185. [Google Scholar] [CrossRef]
- Onea, F.; Rusu, E. An Evaluation of Marine Renewable Energy Resources Complementarity in the Portuguese Nearshore. J. Mar. Sci. Eng. 2022, 10, 1901. [Google Scholar] [CrossRef]
- Diaconita, A.; Chiroșcă, A.; Rusu, L. Assessment of Wind and Wave Climate Dynamics in the Mediterranean and Black Seas for Renewable Energy Potential Analysis. In Trends in Clean Energy Research; Springer: Cham, Switzerland, 2024; pp. 83–90. ISBN 978-3-031-67986-5. [Google Scholar]
- Bonthu, S.; Purvaja, R.; Singh, K.S.; Ganguly, D.; Muruganandam, R.; Paul, T.; Ramesh, R. Offshore Wind Energy Potential along the Indian Coast Considering Ecological Safeguards. Ocean Coast. Manag. 2024, 249, 107017. [Google Scholar] [CrossRef]
- Liu, L.; Wu, M.; Mao, Y.; Zheng, L.; Xue, M.; Bing, L.; Liang, F.; Liu, J.; Liu, B. Offshore Wind Energy Potential in Shandong Sea of China Revealed by ERA5 Reanalysis Data and Remote Sensing. J. Clean. Prod. 2024, 464, 142745. [Google Scholar] [CrossRef]
- Rusu, E. Assessment of the Wind Power Dynamics in the North Sea under Climate Change Conditions. Renew. Energy 2022, 195, 466–475. [Google Scholar] [CrossRef]
- Al-Shaikhi, A.; Rehman, S.; Irshad, K.; Ibrahim, N.I.; Mohandes, M.A. Offshore Windy Potential Sites Prioritization in the Gulf of South Suez. Arab. J. Sci. Eng. 2024, 49, 7307–7326. [Google Scholar] [CrossRef]
- Bhutta, M.S.; Xuebang, T.; Faheem, M.; Almasoudi, F.M.; Alatawi, K.S.S.; Guo, H. Neuro-Fuzzy Based High-Voltage DC Model to Optimize Frequency Stability of an Offshore Wind Farm. Processes 2023, 11, 2049. [Google Scholar] [CrossRef]
- Murcia Leon, J.P.; Koivisto, M.J.; Sørensen, P.; Magnant, P. Power Fluctuations in High-Installation-Density Offshore Wind Fleets. Wind Energy Sci. 2021, 6, 461–476. [Google Scholar] [CrossRef]
- Simpson, J.G.; Hanrahan, G.; Loth, E.; Koenig, G.M.; Sadoway, D.R. Liquid Metal Battery Storage in an Offshore Wind Turbine: Concept and Economic Analysis. Renew. Sustain. Energy Rev. 2021, 149, 111387. [Google Scholar] [CrossRef]
- Wang, X.; Li, L.; Palazoglu, A.; El-Farra, N.H.; Shah, N. Optimization and Control of Offshore Wind Systems with Energy Storage. Energy Convers. Manag. 2018, 173, 426–437. [Google Scholar] [CrossRef]
- Kim, A.; Kim, H.; Choe, C.; Lim, H. Feasibility of Offshore Wind Turbines for Linkage with Onshore Green Hydrogen Demands: A Comparative Economic Analysis. Energy Convers. Manag. 2023, 277, 116662. [Google Scholar] [CrossRef]
- Dute, E.F.; Fokkema, J.E.; Land, M.J.; Wortmann, J.C.; Douwes, M. Determining Onshore or Offshore Hydrogen Storage for Large Offshore Wind Parks: The North Sea Wind Power Hub Case. J. Clean. Prod. 2024, 472, 143395. [Google Scholar] [CrossRef]
- Rasul, M.G.; Hazrat, M.A.; Sattar, M.A.; Jahirul, M.I.; Shearer, M.J. The Future of Hydrogen: Challenges on Production, Storage and Applications. Energy Convers. Manag. 2022, 272, 116326. [Google Scholar] [CrossRef]
- Remme, U. Global Hydrogen Review 2024; IEA: Paris, France, 2024. [Google Scholar]
- Incer-Valverde, J.; Korayem, A.; Tsatsaronis, G.; Morosuk, T. “Colors” of Hydrogen: Definitions and Carbon Intensity. Energy Convers. Manag. 2023, 291, 117294. [Google Scholar] [CrossRef]
- Ajanovic, A.; Sayer, M.; Haas, R. The Economics and the Environmental Benignity of Different Colors of Hydrogen. Int. J. Hydrogen Energy 2022, 47, 24136–24154. [Google Scholar] [CrossRef]
- AlHumaidan, F.S.; Absi Halabi, M.; Rana, M.S.; Vinoba, M. Blue Hydrogen: Current Status and Future Technologies. Energy Convers. Manag. 2023, 283, 116840. [Google Scholar] [CrossRef]
- Lundvall, N. Modelling Hydrogen Production From Offshore Wind Parks: A Techno-Economic Analysis of Dedicated Hydrogen Production. Master’s Thesis, Mälardalen University, Västerås, Sweden, 2022. [Google Scholar]
- Oliveira, A.M.; Beswick, R.R.; Yan, Y. A Green Hydrogen Economy for a Renewable Energy Society. Curr. Opin. Chem. Eng. 2021, 33, 100701. [Google Scholar] [CrossRef]
- Yap, J.; McLellan, B. Exploring Transitions to a Hydrogen Economy: Quantitative Insights from an Expert Survey. Int. J. Hydrogen Energy 2024, 66, 371–386. [Google Scholar] [CrossRef]
- Usman, M.R. Hydrogen Storage Methods: Review and Current Status. Renew. Sustain. Energy Rev. 2022, 167, 112743. [Google Scholar] [CrossRef]
- Benghanem, M.; Mellit, A.; Almohamadi, H.; Haddad, S.; Chettibi, N.; Alanazi, A.M.; Dasalla, D.; Alzahrani, A. Hydrogen Production Methods Based on Solar and Wind Energy: A Review. Energies 2023, 16, 757. [Google Scholar] [CrossRef]
- Rezaei-Shouroki, M.; Mostafaeipour, A.; Qolipour, M. Prioritizing of Wind Farm Locations for Hydrogen Production: A Case Study. Int. J. Hydrogen Energy 2017, 42, 9500–9510. [Google Scholar] [CrossRef]
- Kien, D.T.; Phap, V.M.; Duong, D.N.; Tu, L.; Huong, N.T. The Assessment of Hydrogen Production Potential from Wind Power in Vietnam. Polityka Energ.–Energy Policy J. 2024, 27, 5–18. [Google Scholar] [CrossRef]
- AlZohbi, G.; AlShuhail, L.; Almoaikel, A. An Estimation of Green Hydrogen Generation from Wind Energy: A Case Study from KSA. Energy Rep. 2023, 9, 262–267. [Google Scholar] [CrossRef]
- Paulino de Azevedo, J.H.; Pradelle, F.; Botelho, V.; Torres Serra, E.; Nohra Chaar Pradelle, R.; Leal Braga, S. An Integrated Geospatial Model for Evaluating Offshore Wind-to-Hydrogen Technical and Economic Production Potential in Brazil. Int. J. Hydrogen Energy 2025, 100, 800–815. [Google Scholar] [CrossRef]
- Luo, Z.; Wang, X.; Wen, H.; Pei, A. Hydrogen Production from Offshore Wind Power in South China. Int. J. Hydrogen Energy 2022, 47, 24558–24568. [Google Scholar] [CrossRef]
- Dinh, Q.V.; Dinh, V.N.; Mosadeghi, H.; Todesco Pereira, P.H.; Leahy, P.G. A Geospatial Method for Estimating the Levelised Cost of Hydrogen Production from Offshore Wind. Int. J. Hydrogen Energy 2023, 48, 15000–15013. [Google Scholar] [CrossRef]
- Akdağ, O. The Operation and Applicability to Hydrogen Fuel Technology of Green Hydrogen Production by Water Electrolysis Using Offshore Wind Power. J. Clean. Prod. 2023, 425, 138863. [Google Scholar] [CrossRef]
- Onat, M.R.; Demir, M.E. Techno-Economic Assessment of Green Ammonia and Hydrogen Distribution from Offshore Wind Farms to European Ports. Int. J. Hydrogen Energy 2025. [Google Scholar] [CrossRef]
- Rusu, E. An Evaluation of the Expected Wind Dynamics in the Black Sea in the Context of the Climate Change. e-Prime-Adv. Electr. Eng. Electron. Energy 2023, 4, 100154. [Google Scholar] [CrossRef]
- Çarpar, T.; Ayat, B.; Aydoğan, B. Spatio-Seasonal Variations in Long-Term Trends of Offshore Wind Speeds Over the Black Sea; an Inter-Comparison of Two Reanalysis Data. Pure Appl. Geophys. 2020, 177, 3013–3037. [Google Scholar] [CrossRef]
- Onea, F.; Rusu, L. A Study on the Wind Energy Potential in the Romanian Coastal Environment. J. Mar. Sci. Eng. 2019, 7, 142. [Google Scholar] [CrossRef]
- Koletsis, I.; Kotroni, V.; Lagouvardos, K.; Soukissian, T. Assessment of Offshore Wind Speed and Power Potential over the Mediterranean and the Black Seas under Future Climate Changes. Renew. Sustain. Energy Rev. 2016, 60, 234–245. [Google Scholar] [CrossRef]
- Islek, F.; Yuksel, Y. Evaluation of Future Wind Power Potential and Their Projected Changes in the Black Sea and Possible Stable Locations for Wind Farms. Ocean Eng. 2022, 266, 112832. [Google Scholar] [CrossRef]
- Diaconita, A.I.; Rusu, L.; Andrei, G. A Local Perspective on Wind Energy Potential in Six Reference Sites on the Western Coast of the Black Sea Considering Five Different Types of Wind Turbines. Inventions 2021, 6, 44. [Google Scholar] [CrossRef]
- Rusu, L. The Wave and Wind Power Potential in the Western Black Sea. Renew. Energy 2019, 139, 1146–1158. [Google Scholar] [CrossRef]
- ERA-Interim|ECMWF. Available online: https://www.ecmwf.int/en/forecasts/datasets/archive-datasets/reanalysis-datasets/era-interim (accessed on 18 August 2018).
- Venuti, F.; Rabier, F.; Andersson, E.; Modigliani, U.; English, S.; Kitchen, C.; Berrone, M.; Pinsault, D.; Debrux, J.; Jarraud, M. ECMWF’s Societal Impact through Service Provision, Partnerships and Collaborations. J. Eur. Meteorol. Soc. 2025, 2, 100013. [Google Scholar] [CrossRef]
- C3S ERA5 Hourly Data on Single Levels from 1940 to Present 2018. Available online: https://cds.climate.copernicus.eu/datasets/reanalysis-era5-single-levels?tab=overview (accessed on 24 May 2025).
- Bell, B.; Hersbach, H.; Simmons, A.; Berrisford, P.; Dahlgren, P.; Horányi, A.; Muñoz-Sabater, J.; Nicolas, J.; Radu, R.; Schepers, D.; et al. The ERA5 Global Reanalysis: Preliminary Extension to 1950. Q. J. R. Meteorol. Soc. 2021, 147, 4186–4227. [Google Scholar] [CrossRef]
- Gleixner, S.; Demissie, T.; Diro, G.T. Did ERA5 Improve Temperature and Precipitation Reanalysis over East Africa? Atmosphere 2020, 11, 996. [Google Scholar] [CrossRef]
- Hersbach, H.; Bell, B.; Berrisford, P.; Hirahara, S.; Horányi, A.; Muñoz-Sabater, J.; Nicolas, J.; Peubey, C.; Radu, R.; Schepers, D.; et al. The ERA5 Global Reanalysis. Q. J. R. Meteorol. Soc. 2020, 146, 1999–2049. [Google Scholar] [CrossRef]
- Hu, W.; Scholz, Y.; Yeligeti, M.; Bremen, L.V.; Deng, Y. Downscaling ERA5 Wind Speed Data: A Machine Learning Approach Considering Topographic Influences. Environ. Res. Lett. 2023, 18, 094007. [Google Scholar] [CrossRef]
- ERA5|Technical Documentation. Available online: https://docs.meteoblue.com/en/meteo/data-sources/era5 (accessed on 24 May 2025).
- Alkhalidi, M.; Al-Dabbous, A.; Al-Dabbous, S.; Alzaid, D. Evaluating the Accuracy of the ERA5 Model in Predicting Wind Speeds Across Coastal and Offshore Regions. J. Mar. Sci. Eng. 2025, 13, 149. [Google Scholar] [CrossRef]
- Uit Het Broek, M.A.J.; Veldman, J.; Fazi, S.; Greijdanus, R. Evaluating Resource Sharing for Offshore Wind Farm Maintenance: The Case of Jack-up Vessels. Renew. Sustain. Energy Rev. 2019, 109, 619–632. [Google Scholar] [CrossRef]
- Rezaei, A.; Guo, Y.; Keller, J.; Nejad, A.R. Effects of Wind Field Characteristics on Pitch Bearing Reliability: A Case Study of 5 MW Reference Wind Turbine at Onshore and Offshore Sites. Forsch Ing. 2023, 87, 321–338. [Google Scholar] [CrossRef]
- Ha, Y.-J.; Ahn, H.; Park, S.; Park, J.-Y.; Kim, K.-H. Development of Hybrid Model Test Technique for Performance Evaluation of a 10 MW Class Floating Offshore Wind Turbine Considering Asymmetrical Thrust. Ocean Eng. 2023, 272, 113783. [Google Scholar] [CrossRef]
- Chai, W.; He, L.; Chen, W.; Cao, L.; Shi, W.; Sinsabvarodom, C.; Hu, M.; Liu, Z. Short-Term Extreme Value Prediction for the Structural Responses of the IEA 15 MW Offshore Wind Turbine under Extreme Environmental Conditions. Ocean Eng. 2024, 306, 118120. [Google Scholar] [CrossRef]
- Scotland’s Largest Offshore Wind Farm, Seagreen, Now Fully Operational. Available online: https://www.4coffshore.com/news/scotland27s-largest-offshore-wind-farm2c-seagreen2c-now-fully-operational-nid28159.html (accessed on 24 April 2025).
- EolMed Floating Wind Farm—Under Construction—France|4C Offshore. Available online: https://www.4coffshore.com/windfarms/france/eolmed-france-fr64.html (accessed on 24 April 2025).
- Wind, B. Vestas Completes Installation of 15 MW Offshore Wind Turbine. Baltic Wind. 2024. Available online: https://balticwind.eu/vestas-completes-installation-of-15-mw-offshore-wind-turbine/ (accessed on 24 April 2025).
- Onea, F.; Rusu, E. The Expected Efficiency and Coastal Impact of a Hybrid Energy Farm Operating in the Portuguese Nearshore. Energy 2016, 97, 411–423. [Google Scholar] [CrossRef]
- Kubik, M.L.; Coker, P.J.; Hunt, C. Using Meteorological Wind Data to Estimate Turbine Generation Output: A Sensitivity Analysis. In Proceedings of the World Renewable Energy Congress, Linköping, Sweden, 8–13 May 2011; p. 4081, ISBN 978-91-7393-070-3. [Google Scholar]
- Burton, T.; Jenkins, N.; Sharpe, D.; Bossanyi, E. Wind Energy Handbook, 1st ed.; Wiley: New York, NY, USA, 2011; ISBN 978-0-470-69975-1. [Google Scholar]
- Balaguru, V.S.S.; Swaroopan, N.J.; Raju, K.; Alsharif, M.H.; Kim, M.-K. Techno-Economic Investigation of Wind Energy Potential in Selected Sites with Uncertainty Factors. Sustainability 2021, 13, 2182. [Google Scholar] [CrossRef]
- Baki, H.; Basu, S.; Lavidas, G. Estimating the Offshore Wind Power Potential of Portugal by Utilizing Gray-Zone Atmospheric Modeling. J. Renew. Sustain. Energy 2024, 16, 63306. [Google Scholar] [CrossRef]
- Song, D.; Zheng, S.; Yang, S.; Yang, J.; Dong, M.; Su, M.; Joo, Y.H. Annual Energy Production Estimation for Variable-Speed Wind Turbine at High-Altitude Site. J. Mod. Power Syst. Clean Energy 2021, 9, 684–687. [Google Scholar] [CrossRef]
- Douak, M.; Settou, N. Estimation of Hydrogen Production Using Wind Energy in Algeria. Energy Procedia 2015, 74, 981–990. [Google Scholar] [CrossRef]
- Raileanu, A.B.; Onea, F.; Rusu, E. Implementation of Offshore Wind Turbines to Reduce Air Pollution in Coastal Areas—Case Study Constanta Harbour in the Black Sea. J. Mar. Sci. Eng. 2020, 8, 550. [Google Scholar] [CrossRef]
- Safari, F.; Dincer, I. Assessment and Optimization of an Integrated Wind Power System for Hydrogen and Methane Production. Energy Convers. Manag. 2018, 177, 693–703. [Google Scholar] [CrossRef]
- Roadmap for Romania: Building a New Offshore Wind Industry in the Black Sea. Available online: https://www.worldbank.org/en/news/press-release/2024/09/27/roadmap-for-romania-building-a-new-offshore-wind-industry-in-the-black-sea (accessed on 27 April 2025).
- Data Show Big Gains for Offshore Wind. Available online: https://www.nrel.gov/news/program/2020/2019-offshore-wind-data.html (accessed on 27 April 2025).


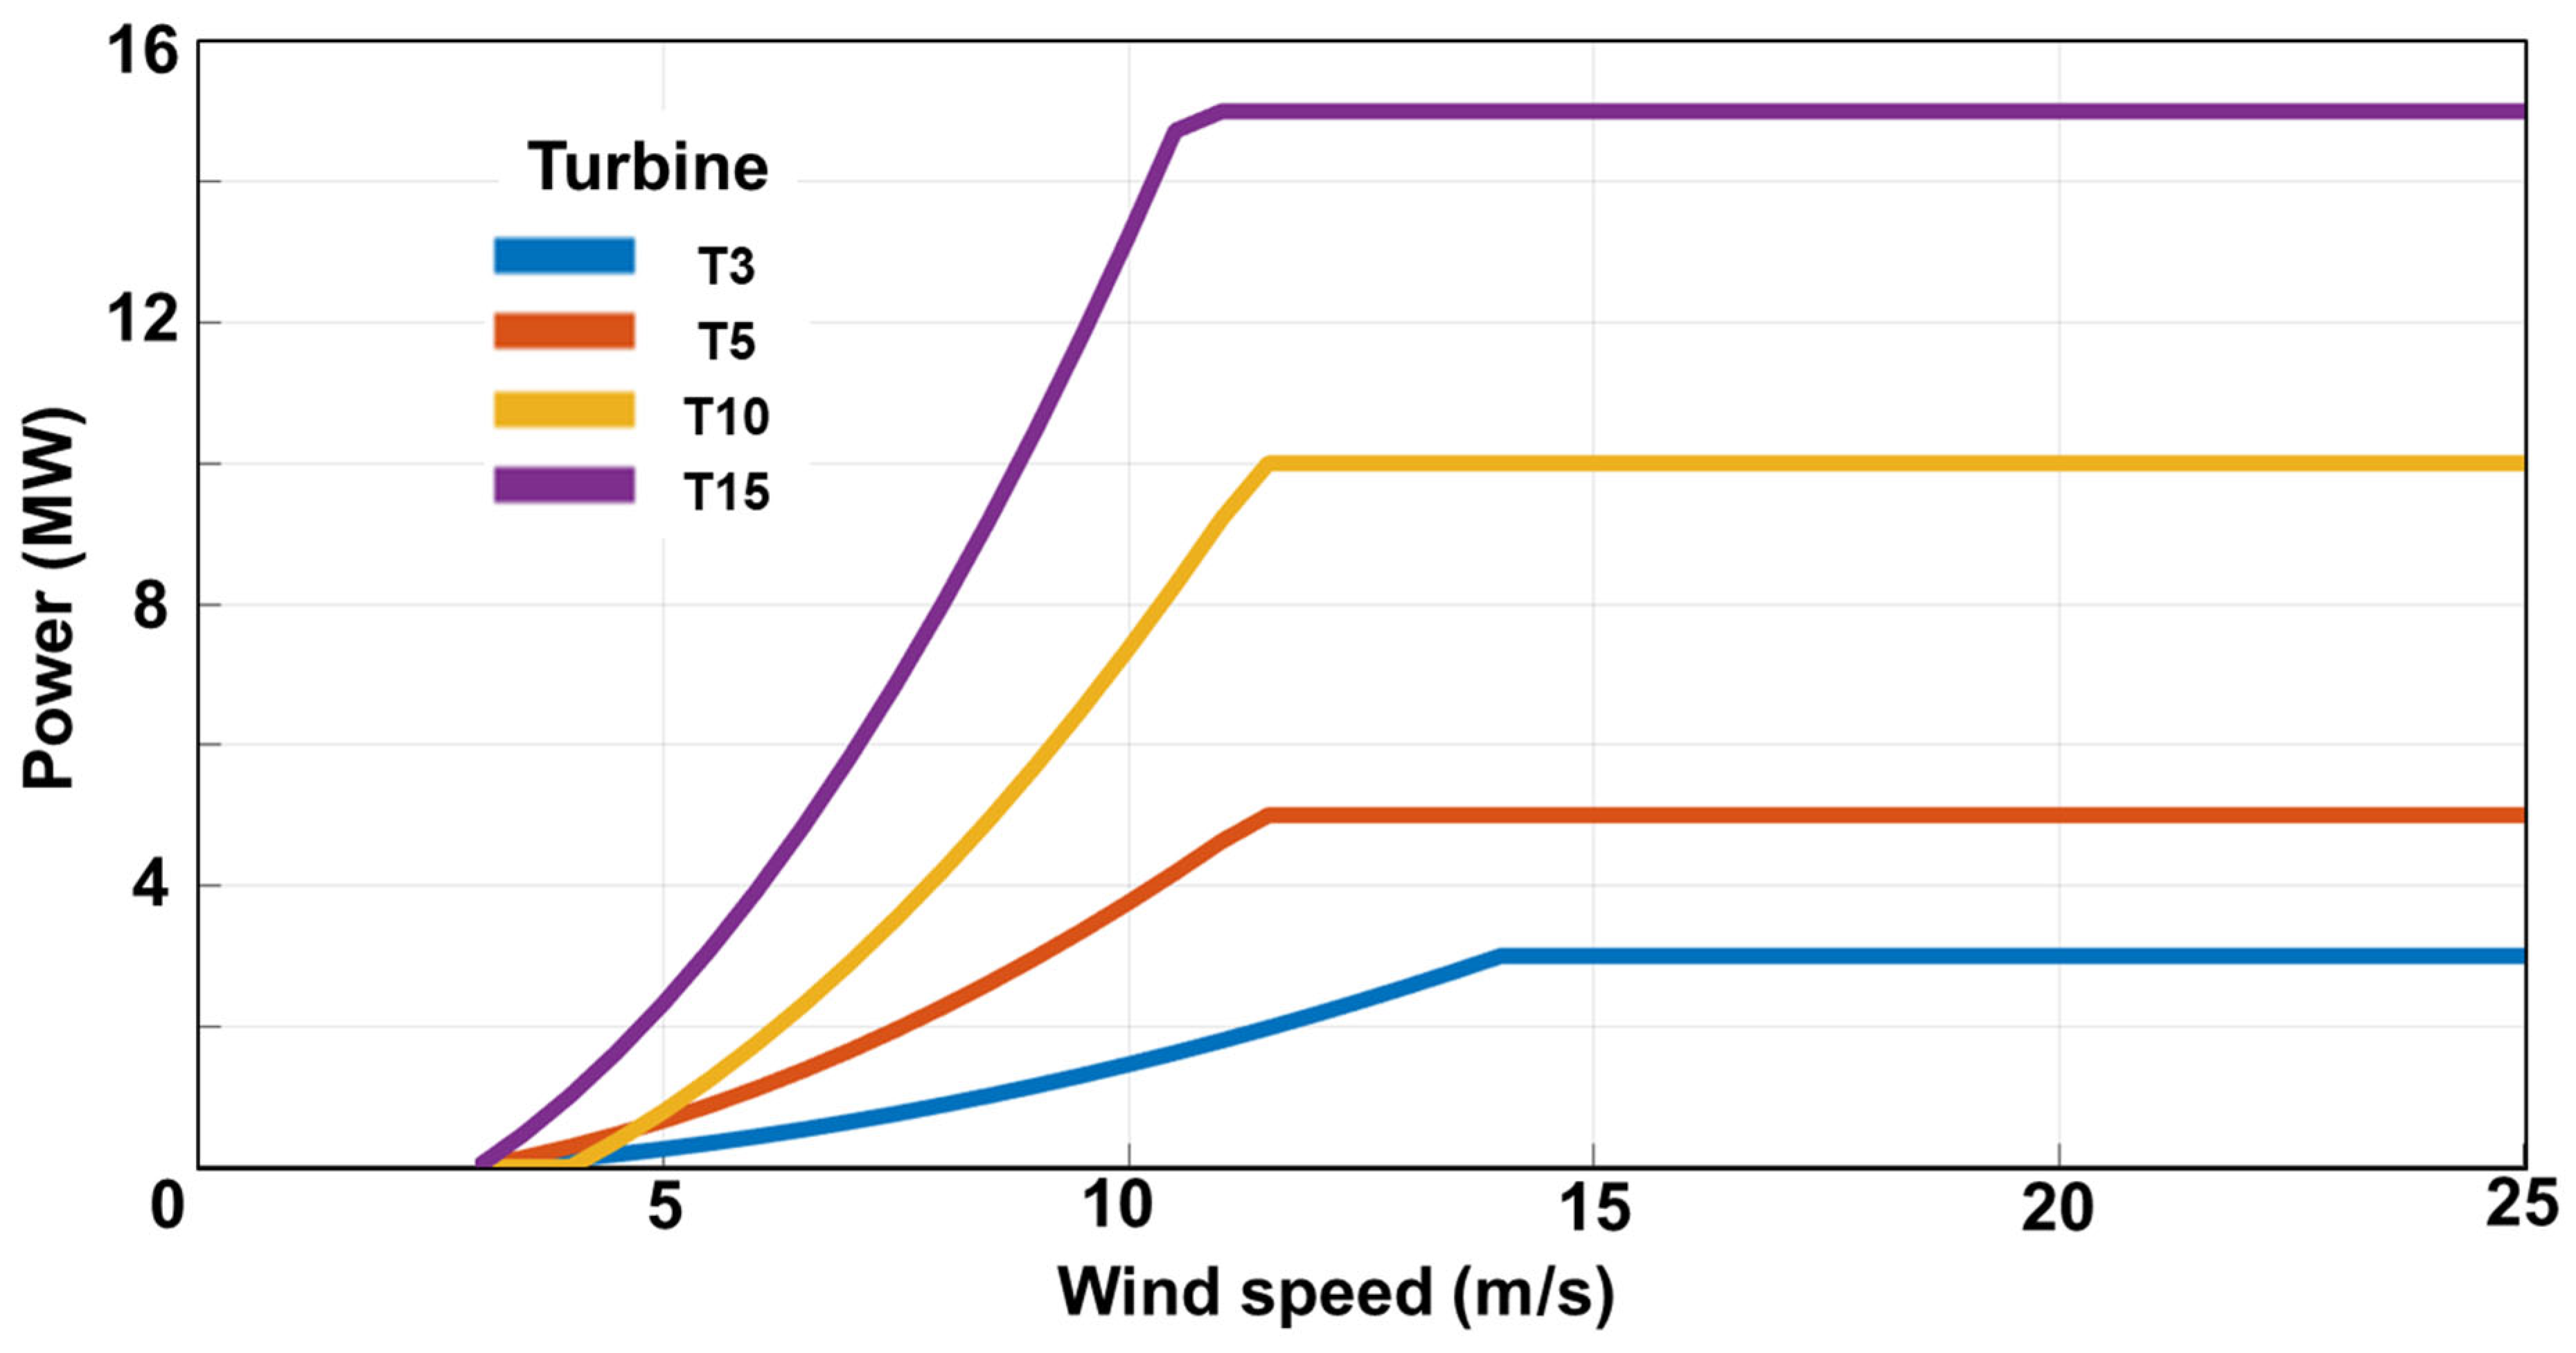
| ID | Turbine | Hub Height (m) | Power Rating (MW) | Wind Speed (m/s) | Reference | ||
|---|---|---|---|---|---|---|---|
| Cut-In | Rated | Cut-Out | |||||
| T3 | 3 MW | 100 | 3 | 3.00 | 14.00 | 25.00 | [57] |
| T5 | NREL 5 MW | 90 | 5 | 3.00 | 11.40 | 25.00 | [58] |
| T10 | DTU-10 MW | 119 | 10 | 4.00 | 11.40 | 25.00 | [59] |
| T15 | IEA 15 MW | 150 | 15 | 3.00 | 10.59 | 25.00 | [60] |
| ID | System | Production Capacity (kg/h) | Energy Consumption (kWh/kgH2) |
|---|---|---|---|
| PEM1 | HyLYZER®—4.000-30 | 330.8 | 51.0 |
| PEM2 | HyLYZER®—1.000-30 | 82.7 | 52.0 |
| PEM3 | HyLYZER®—500-30 | 41.4 | 61.7 |
| PEM4 | SiLYZER 300 | 18.6 | 62.0 |
| Turbine 3 MW | Turbine 5 MW | Turbine 10 MW | Turbine 15 MW | |
|---|---|---|---|---|
| PEM1 | 0.067 | 0.14 | 0.28 | 0.54 |
| PEM2 | 0.26 | 0.55 | 1.11 | 2.13 |
| PEM3 | 0.44 | 0.93 | 1.87 | 3.59 |
| PEM4 | 0.98 | 2.07 | 4.16 | 7.95 |
| PEM → | PEM1 | PEM2 | PEM3 | PEM4 |
| Turbine ↓ | ||||
| 90% | ||||
| T3 | 0.23–196 | 0.23–192 | 0.20–162 | 0.20–161 |
| T5 | 0.37–410 | 0.37–402 | 0.31–339 | 0.31–337 |
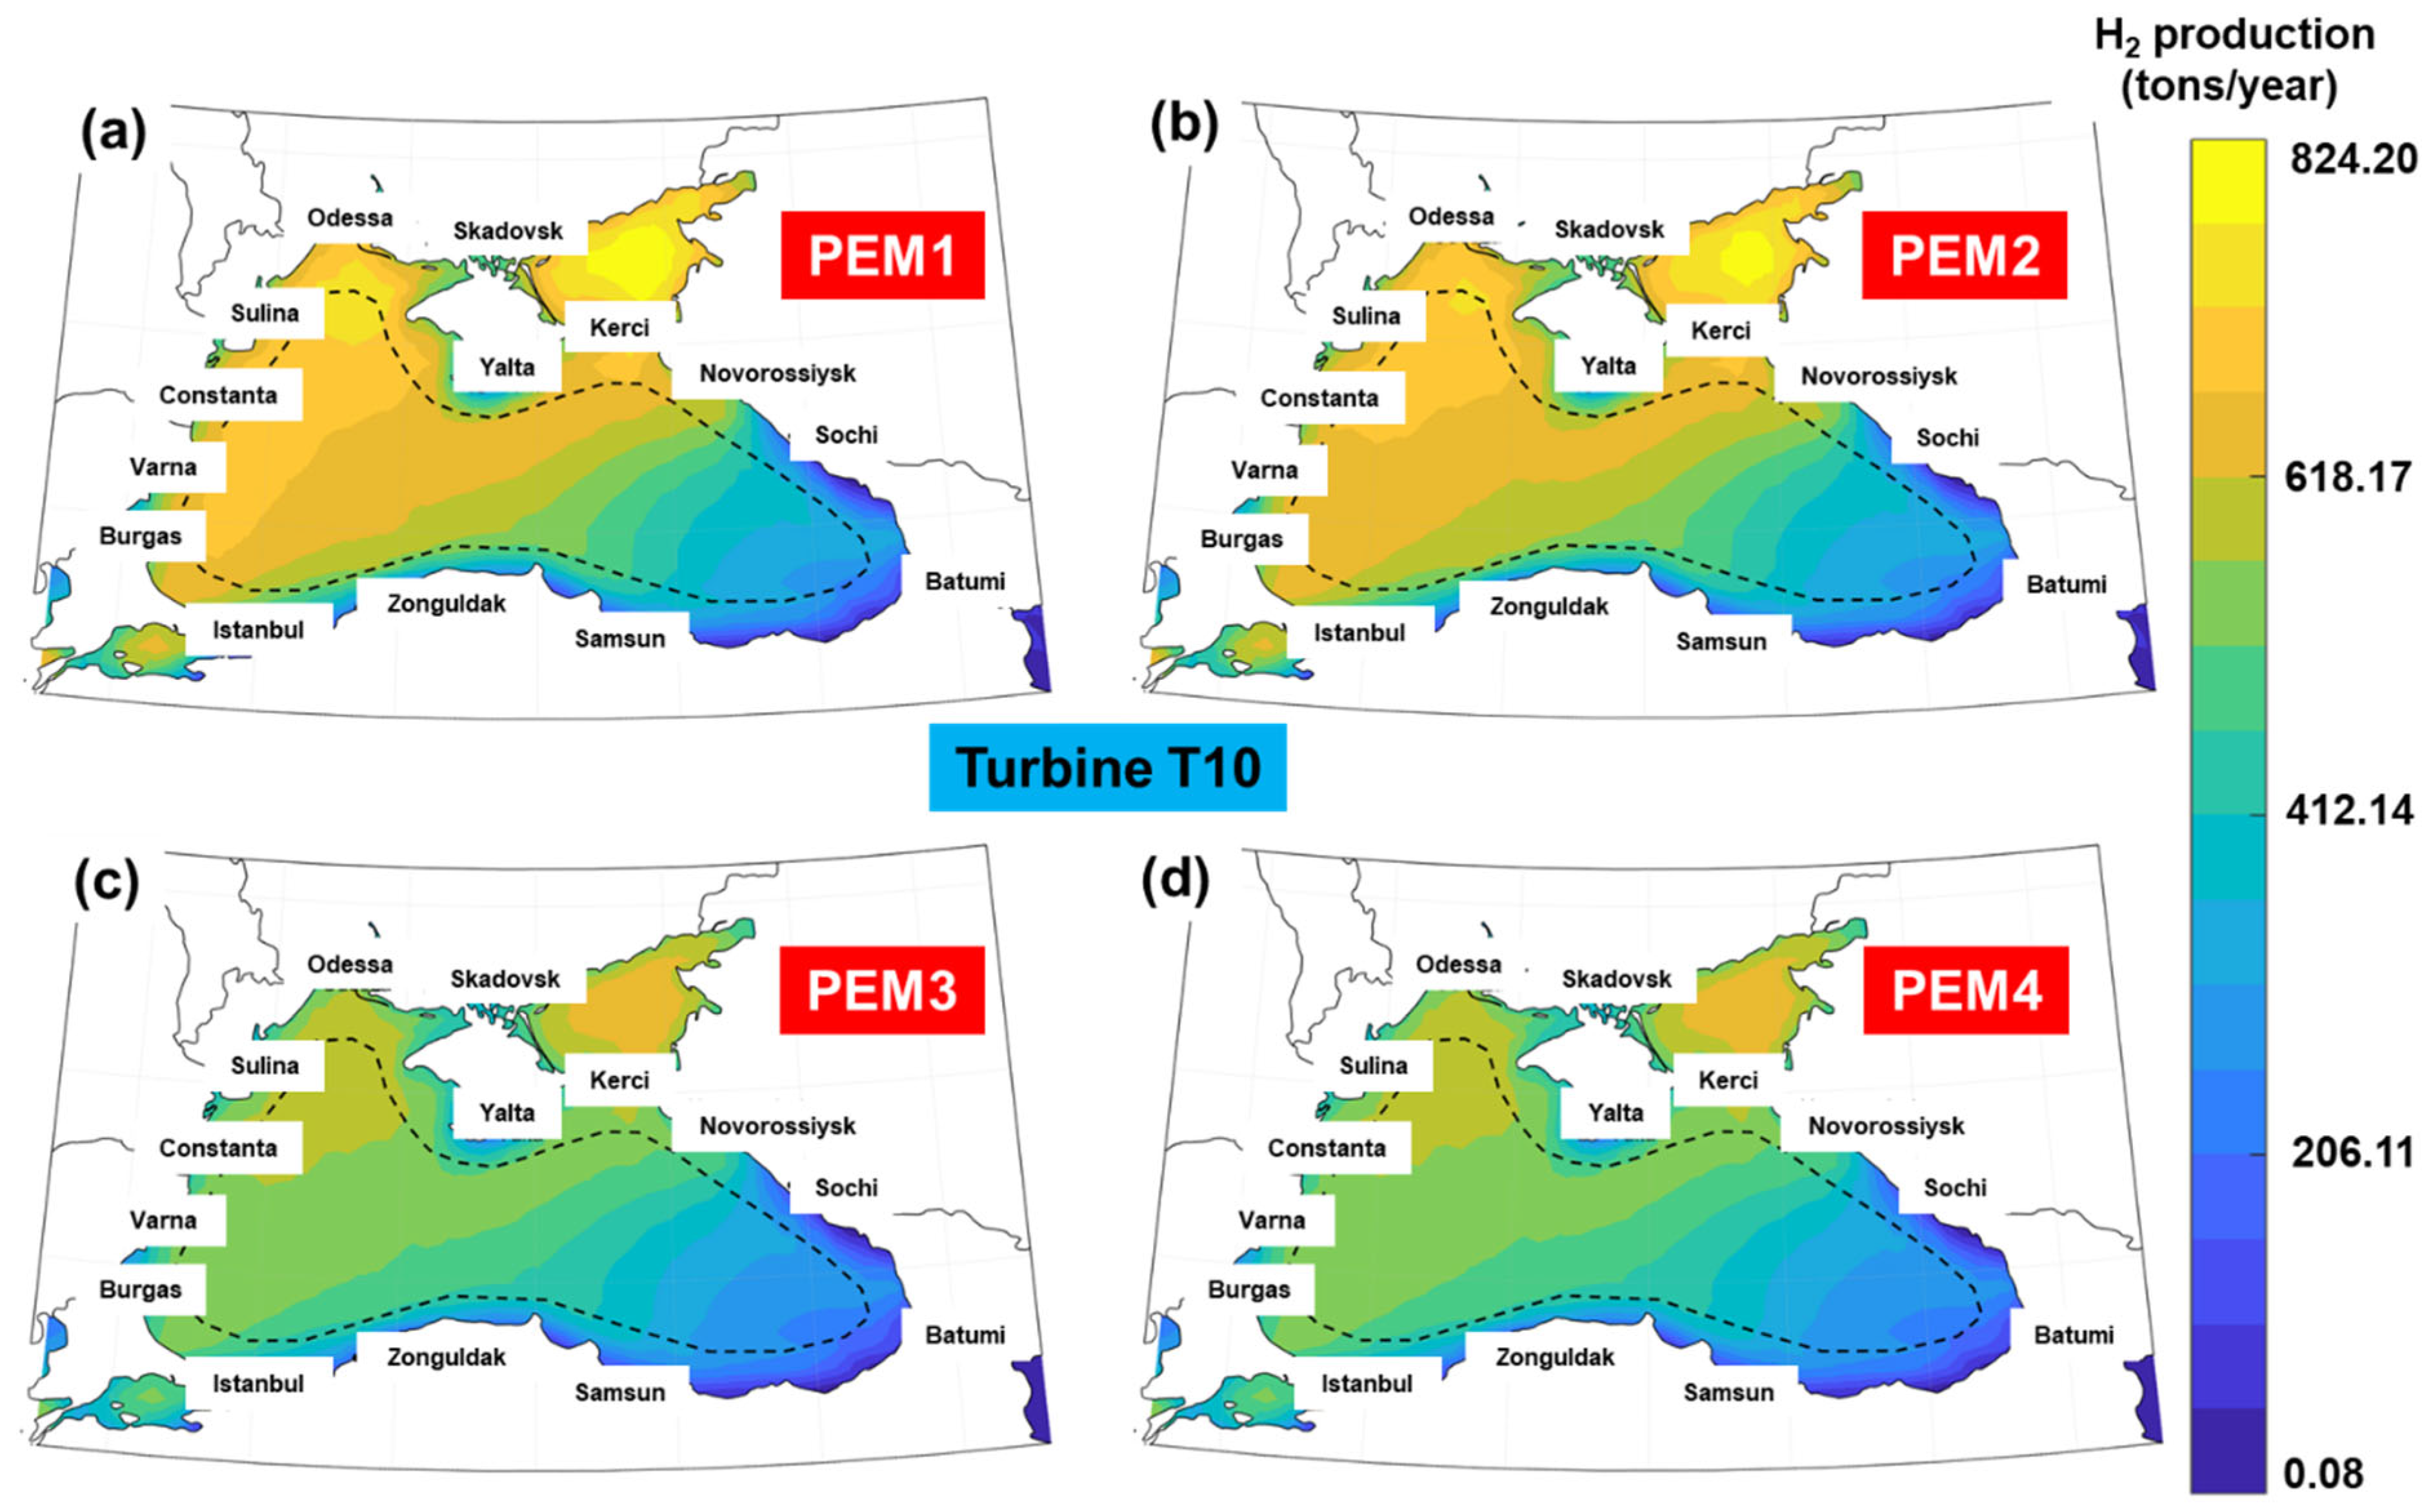
| T10 | 0.1–824 | 0.1–808 | 0.08–681 | 0.08–678 |
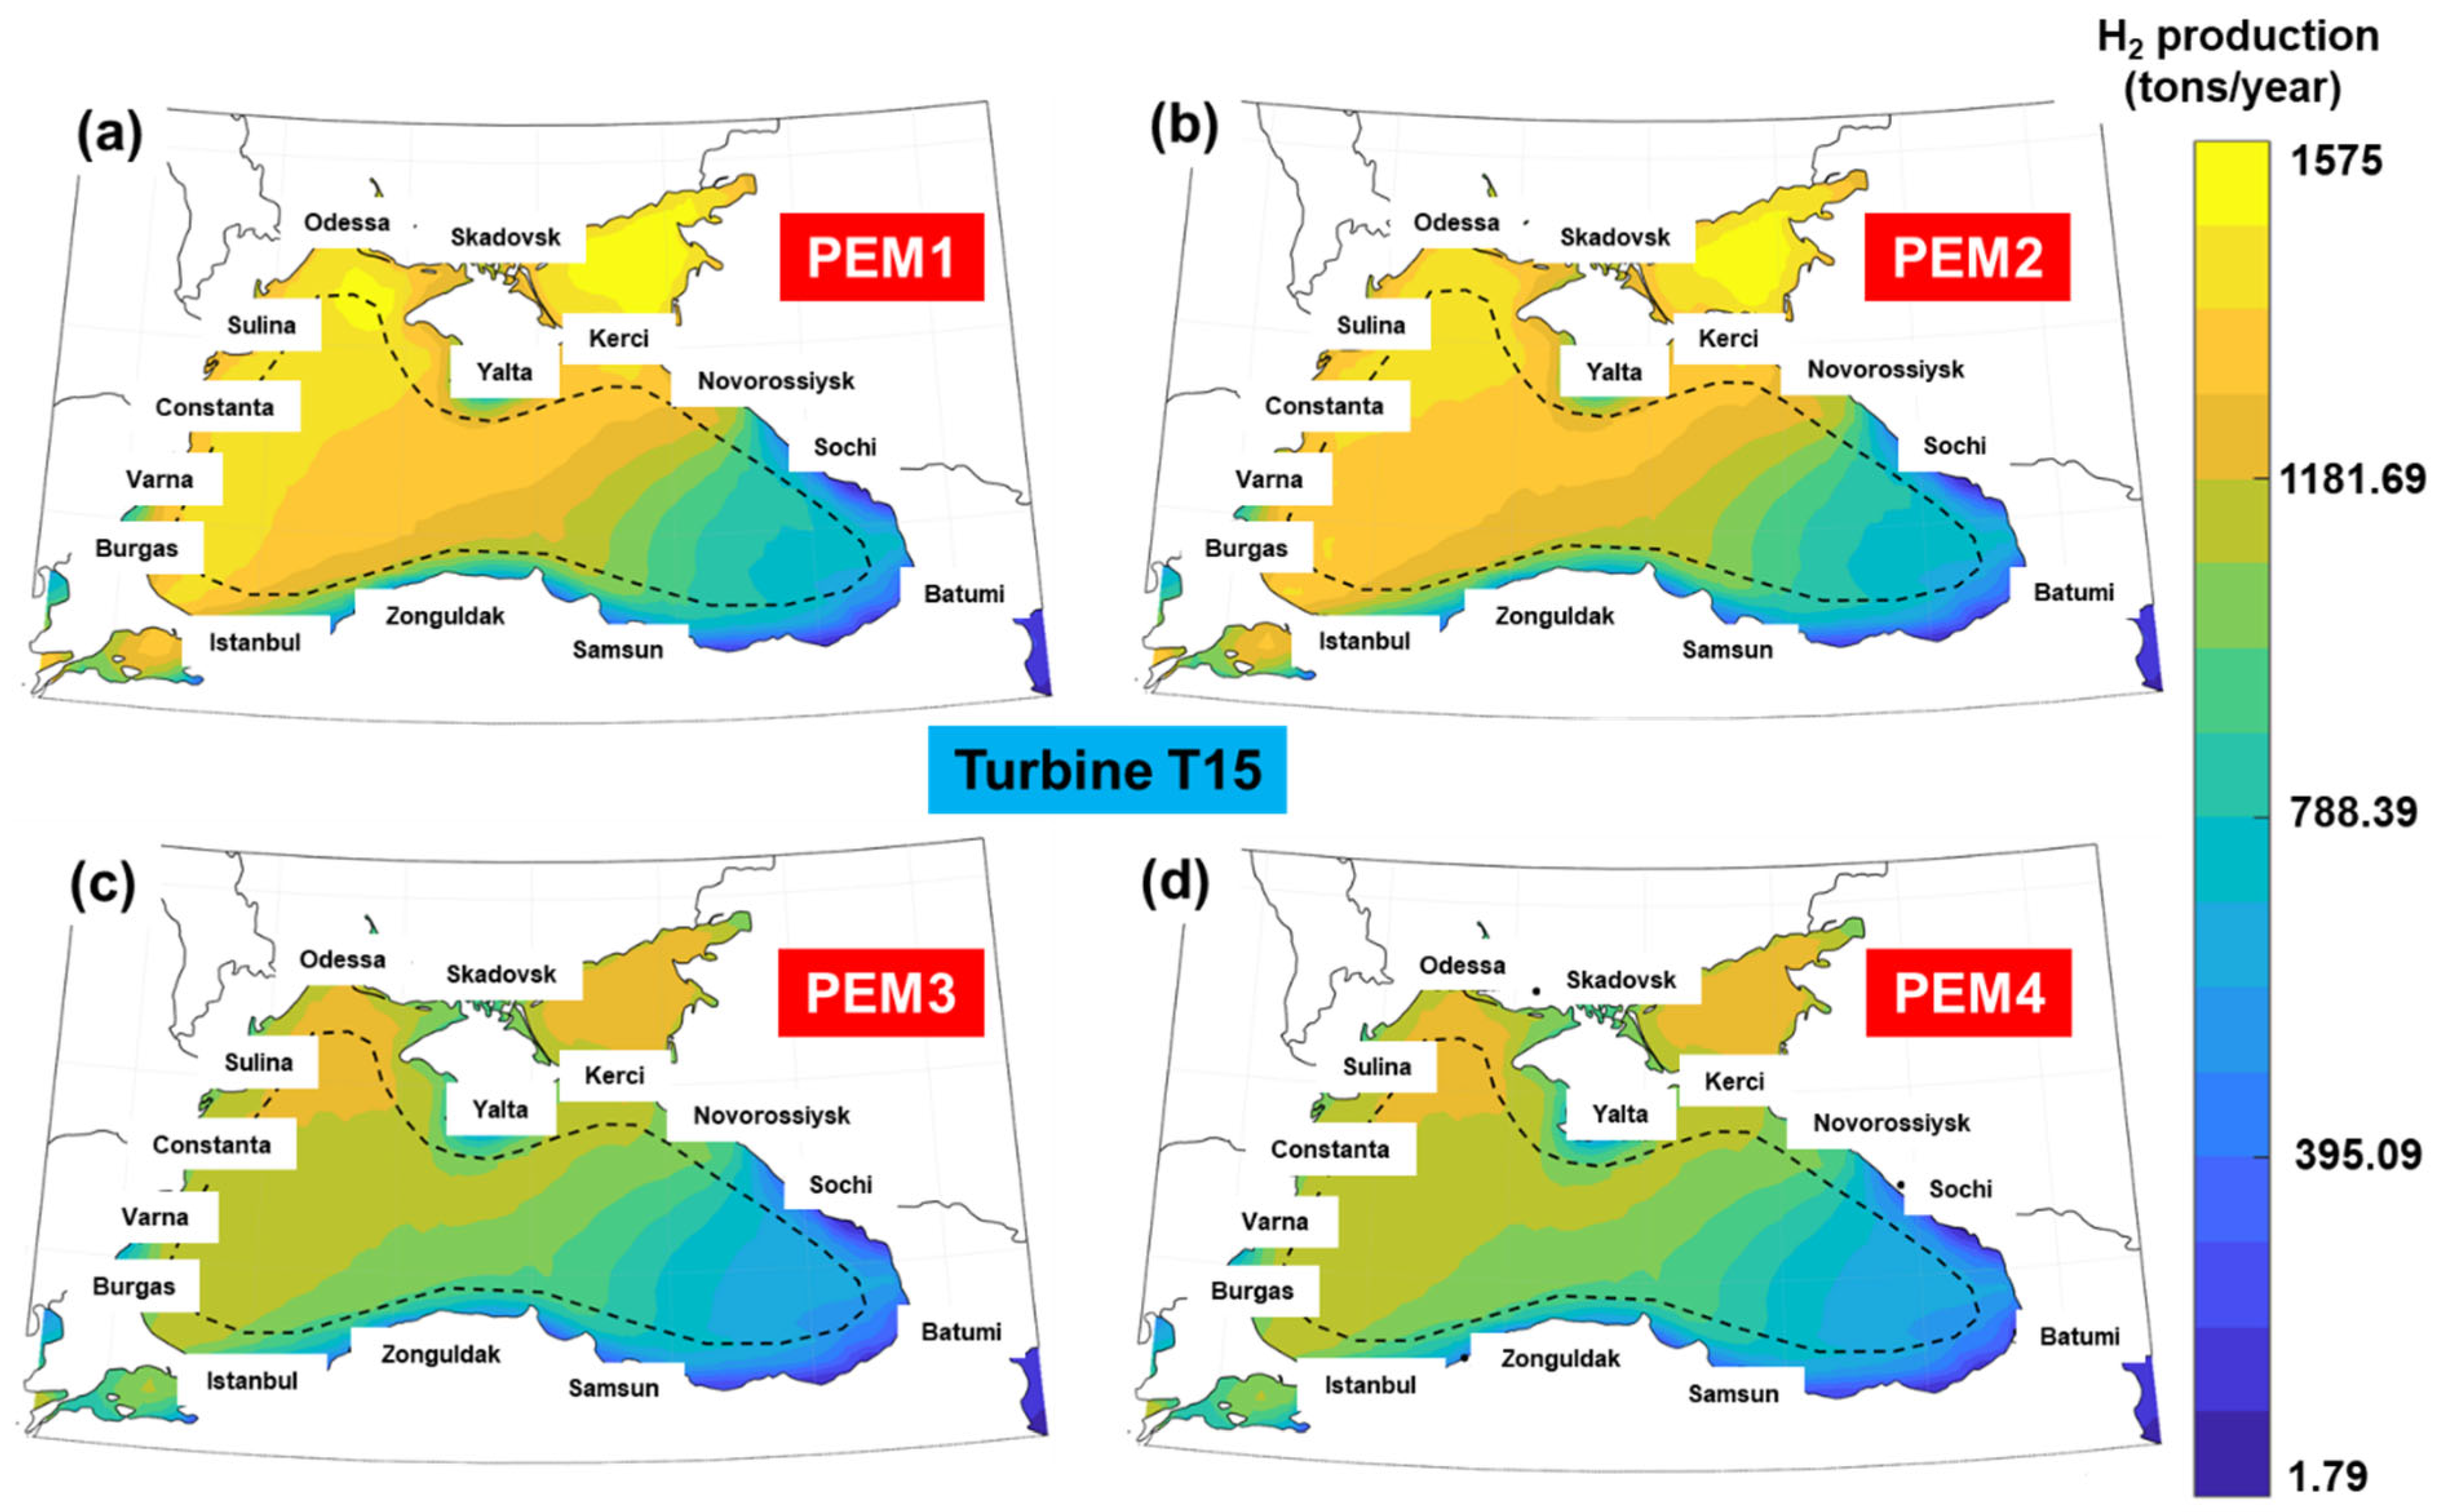
| T15 | 2.18–1575 | 2.14–1545 | 1.81–1302 | 1.80–1296 |
| 65.4% | 64.1% | 54% | 53.8% | |
| T3 | 0.17–142 | 0.16–137 | 0.11–97 | 0.11–96 |
| T5 | 0.27–298 | 0.26–286 | 0.18–203 | 0.18–202 |
| T10 | 0.07–599 | 0.07–576 | 0.04–409 | 0.04–405 |
| T15 | 1.6–1145 | 1.5–1100 | 1.08–781 | 1.07–774 |
Disclaimer/Publisher’s Note: The statements, opinions and data contained in all publications are solely those of the individual author(s) and contributor(s) and not of MDPI and/or the editor(s). MDPI and/or the editor(s) disclaim responsibility for any injury to people or property resulting from any ideas, methods, instructions or products referred to in the content. |
© 2025 by the authors. Licensee MDPI, Basel, Switzerland. This article is an open access article distributed under the terms and conditions of the Creative Commons Attribution (CC BY) license (https://creativecommons.org/licenses/by/4.0/).
Share and Cite
Manolache, A.I.; Onea, F. A Spatial Analysis of the Wind and Hydrogen Production in the Black Sea Basin. Energies 2025, 18, 2936. https://doi.org/10.3390/en18112936
Manolache AI, Onea F. A Spatial Analysis of the Wind and Hydrogen Production in the Black Sea Basin. Energies. 2025; 18(11):2936. https://doi.org/10.3390/en18112936
Chicago/Turabian StyleManolache, Alexandra Ionelia, and Florin Onea. 2025. "A Spatial Analysis of the Wind and Hydrogen Production in the Black Sea Basin" Energies 18, no. 11: 2936. https://doi.org/10.3390/en18112936
APA StyleManolache, A. I., & Onea, F. (2025). A Spatial Analysis of the Wind and Hydrogen Production in the Black Sea Basin. Energies, 18(11), 2936. https://doi.org/10.3390/en18112936