Abstract
The growing demand for electricity, driven by factors such as the shift to carbon neutrality and economic growth, is a challenge shared by South Korea and Japan. South Korea, a peninsula nation, and Japan, an island country, which are both heavily dependent on foreign energy sources and have manufacturing-based industrial structures, are actively working to secure stable power supplies for their economic development. This article carries out a quantitative analysis of the roles of the South Korean and Japanese electric power sectors (EPSs) in their respective economies, seeking to identify differences and generate actionable insights for decision making and policy formulation. Utilizing the input–output (IO) technique with the latest available data, the analysis includes a demand-side model, a supply-side model, and a price-side model to examine various effects of the EPSs. The key findings reveal differences in the production-inducing, value-added creation, and job-creation effects between the two countries, highlighting operational disparities in their electricity sectors. Additionally, South Korea exhibits higher wage-inducing, supply shortage, and price-side effects than Japan, because of its public enterprise-oriented high-wage structure and a substantial manufacturing sector. These quantitative results provide valuable reference material for future government decisions and policy development in the EPS and emphasize the significant role and impact of the power sector in both countries.
1. Introduction
Electricity is one of the energy sources used by humans. Although electricity is not easily stored, it is quite convenient to use. It is not only an essential input into industrial production but also an indispensable partner in human life [1,2]. According to the results from a number of studies, electricity consumption has increased in tandem with economic growth [3,4,5,6]. Electric power consumption has the potential to stimulate industrial production and economic activity. Simultaneously, economic growth fosters surges in electricity usage [6].
In the future, electricity usage is expected to increase further because of two aspects. First, as the COVID-19 pandemic transitions into the endemic phase, human activities are increasing, leading to a rise in electricity consumption worldwide, especially in developing countries [7]. Second, many countries around the world have declared their commitment to carbon neutrality, and electrification is a prominent means of achieving this commitment. Unlike other fossil-fuel energy sources, electricity does not emit greenhouse gases (GHG) during the consumption process [8]. Although GHGs are emitted during the production of electricity, these emissions can be suppressed by using renewable energy (RE), nuclear power, hydrogen, etc., or by using means such as carbon capture and storage.
Ultimately, because of the increased demand for electricity, the importance of the power sector that produces and supplies electricity will become even greater. Meanwhile, the method of generating electricity will change towards utilizing low-carbon energy instead of using high-carbon energy. In addition, ancillary service markets, such as battery storage and pumped hydro, as well as the development and application of sector-coupling technologies like power to gas, will be expanded. Therefore, the electric power sector (EPS) will not only supply electricity but will also become a vital industry for countries, experiencing significant growth beyond its current state [9].
Furthermore, the Russia–Ukraine war that erupted in February 2022 disrupted the global energy supply chain. As the regional conflict between the two countries expanded to a global conflict to secure limited energy, energy supply and demand stabilization or energy security emerged as an important task along with the implementation of carbon neutrality. Countries around the world are now faced with the challenge of overcoming the energy supply network crisis and achieving energy security while participating in the global trend toward carbon neutrality. Efforts are being made to ensure a stable supply of diverse power sources and to restructure the EPS so that there is no disruption to the electricity supply [10,11,12].
The EPS has a crucial role to play in achieving the two goals of reducing GHG emissions and enhancing energy security. In addition, the electric power industry will undergo extensive changes in the future. As national policy on the EPS becomes more important, various types of decisions will need to be made. The important information required at this time is quantitative knowledge about the role and economic effects of the EPS on each sector as well as the national economy. We need to quantitatively and objectively examine the various economic effects of the EPS on the overall economy. This article aims to derive this information [13,14].
There are three main types of roles and economic effects of the EPS in the national economy covered in this study. The first is the amount of production, value-added, and the wages and number of employees that an investment or production in the EPS causes in other sectors. The second is the production disruption in other sectors caused by a supply shortage in the EPS. The third is the price increase in other sectors caused by a price increase in the EPS. The initial aim of this research was to look into the role of the EPS in the South Korean economy. However, the implications of such an investigation would be limited. Therefore, countries with similar electricity supply and demand conditions to those of South Korea were considered as comparison targets. Japan was chosen as the comparison country in this study. Japan is geographically adjacent to South Korea. Various implications can be derived from comparing the economic effects of South Korea’s EPS and those of Japan’s EPS.
There are four reasons why Japan was selected to compare with South Korea in the analysis of the economic effects of the EPS. First, the two countries have similarities as representative electricity islands located in East Asia. Neither country has a power grid connected to neighboring countries. South Korea is on the Korean Peninsula, but there are military tensions between it and North Korea, and Japan is an island country. Second, since South Korea and Japan have few energy sources themselves, they have to import from abroad most of the energy they consume. Third, since the two countries have a manufacturing-oriented industrial structure that consumes electricity intensively, and an export-led economic system, the stable supply of industrial power for 24 h every day is a very important factor in their survival. Fourth, the two countries both use nuclear power as an important means of generating electricity. In addition, they have national plans to increase the utilization of nuclear power plants in the future [15,16,17].
The most important purpose of this research is to delve, using quantitative methods, into the role of the EPS in the South Korean and Japanese national economies. To this end, the input–output (IO) technique, which has been widely adopted in the analysis of energy-policy issues, will be utilized. The IO technique is a research methodology that is applied to obtain the economic effects of a specific industry. Specifically, it is an analysis method that quantitatively grasps the interrelationships between industries through production activities. As is well known, Wassily Leontief, the Nobel laureate in economics in 1993, devised the IO technique. Three models, the demand-side, the supply-side, and the price-side models, will be applied.
This paper contributes to the literature in four aspects. First, in analyzing the economic effects of the South Korean and Japanese EPSs, a framework for applying the three models is presented and used empirically. Moreover, since an approach that treats the EPS as exogenous rather than endogenous is applied, the discussions can be focused on the EPS.
Second, the implications obtained from the comparison between South Korea and Japan enable the authors to present to policy officials the way in which the role of the South Korean EPS can be enhanced. This is the first such attempt in the literature. One could consider the external validity of directly applying the comparison to other electricity island economies. However, this is not feasible because the structure of power sources, the climate, the weather, industrial structures, power consumption patterns, and so on, are very different for each country.
Third, to the best of the authors’ knowledge, as a result of reviewing recent works that applied the IO technique to the energy sectors of South Korea and Japan, nothing similar to this work exists in the literature. For example, for South Korea, Kim et al. [18], Lee and Kim [19], and Lee et al. [20] used the IO technique to analyze the economic effects of the mining, forest, and renewable energy sectors, respectively. Kim and Yoo [21] adopted the IO technique to compare the economic effects of nuclear power generation and renewable energy generation. For Japan, Matsumoto and Matsumura [22] and Yagi et al. [23] addressed the economic effects of the renewable energy sector and earthquakes, respectively, employing the IO technique.
Fourth, the collection and examination of previous studies applying the IO technique and carrying out a comparative analysis between countries shows that the national economic role of EPS, which will play the most important role in the energy sector not only now but also in the future, has rarely been compared between countries. It is quite difficult to find any earlier pieces of research similar to this study. This suggests that this study may have novelty.
Of course, research dealing with other sectors can be found in the literature. For example, Ali et al. [24], Bon and Pietroforte [25], and Ilhan and Yaman [26] applied the IO techniques to the construction sector and derived implications by comparing the results of the analysis for several countries. De Souza et al. [27], Hasanli Salihova [28], and Mun et al. [29] used the IO technique to compare, respectively, the roles of the service sector, the tourism sector, and the software and healthcare sectors across countries. Fotia and Teclean [30], Gorska [31], and Thangavelu et al. [32] adopted the IO technique to analyze the efficiency of innovation, forward and backward linkage effects, and the economic effect of servicification in global value chains and conducted cross-country comparisons. Proops et al. [33], Li et al. [34], and Long [35] attempted cross-country comparisons of carbon dioxide-related issues within the IO framework.
All the works discussed above have something in common with this study, in that the IO technique was applied. They are also connected to this study in that they compare the results of the analysis between different countries. However, they can be differentiated because the topics of interest being analyzed in each study are different. The remainder of this paper contains four sections: Section 2 introduces the IO technique; Section 3 explains the data and results; Section 4 discusses the results; and Section 5 offers conclusions.
2. Materials and Methods
2.1. IO Technique as A Method
As noted above, this study employs the IO technique. An IO table is essential for the application of the technique. The IO table contains all transactions occurring in the process of producing and disposing of goods and services within an economy over one year in accordance with certain principles and formats [36]. The IO technique has two main advantages [37]. First, it can quantitatively produce information on the correlation between industries by utilizing an IO table that expresses input and output between sectors in a matrix structure. Second, the IO technique enables us to delve into the economic effects of one specific sector on other sectors by adopting exogenous specification techniques.
In particular, for the supply of a specific type of energy, the output from various sectors needs to be inputted into the energy sector, and the energy supplied is an essential input factor in industrial production. Therefore, it is necessary to analyze the role of energy not only from the backward perspective but also from the forward perspective. In this case, the IO technique can be quite useful. In fact, there are numerous pieces of research in the literature in which the IO technique has been applied to energy-related issues. Table 1 provides a summary of some of these. From this table, it can be seen that various studies have been conducted on various energy sources in different countries.

Table 1.
Summary of some selected research that studied energy-related issues adopting input–output (IO) technique.
From Table 1, three distinctions between the previous studies and this study can be identified. First, our approach involves a comprehensive application of three models, providing richer insights through their synthesis. Second, unlike studies focusing on a single country, we conduct a comparative analysis of two countries, South Korea and Japan, ensuring meaningful insights due to their similar electricity supply conditions. Third, unlike some previous studies, we employ the exogenous specification method, treating the EPS as an exogenous sector and effectively deriving various economic effects.
The IO technique has not changed basic theory, but various application models have been developed so that it can be applied to a variety of fields. There are good introductions to these models by Casler and Wilbur [50], Leontief [51,52], Fletcher [53], Rose and Miernyk [54], Lahr and Dietzenbacher [55], Ten Raa [56], and Miller and Blair [57].
This article aims to draw implications after analyzing the national economic roles and economic effects of the EPSs in South Korea and Japan by synthesizing the models developed in various previous studies. Therefore, this analysis is different from a meta-analysis, which estimates a single equation by synthesizing the main results of various previous studies. Specifically, the procedure for applying the IO techniques used in this study consists of data, sector classification, theory and model, and derivation of results. Figure 1 presents a flowchart summarizing the entire process followed in this study.
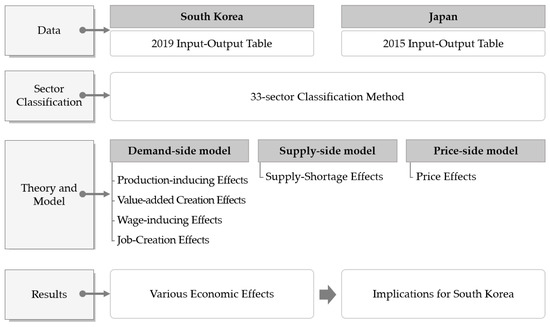
Figure 1.
Flowchart summarizing the entire process of this study.
The models applied in this study include a demand-side model, a supply-side model, and a price-side model. The methods and models adopted in this article are not newly developed or significantly modified by the authors. Therefore, they are not very novel in the literature. However, the significance of this study is that it provides a framework that systematically integrates the various models proposed in previous studies to analyze the national economic role of the EPSs and their various economic effects within a single setting.
2.2. Demand-Side Model
Let be the total output of sector , be the total input of sector , be the final demand for sector , and be the intermediate input from sector to sector . Usually, the input coefficient, , is defined as . refers to the intermediate input from sector to sector as a proportion of the total input of sector . Thus, the input coefficient represents a kind of technical characteristic and is called the technical coefficient. It is assumed that there are a total of sectors in the economy. Let be an matrix whose elements are , be an matrix whose elements are , be an th order identity matrix, and A be matrix composed of . A well-known equation in the IO technique can then be derived as:
in Equation (1) is usually called the input inverse matrix. Let the elements of be ; then, indicates the amount by which should increase/decrease with a one unit increase/decrease of [52]. Equation (1) represents a demand-side model. Usually, instead of Equation (1), a variability model such as the following equation is applied [57,58].
To examine the economic effects of a change in the total output of the EPS on other sectors rather than a change in final demand for the EPS, an exogenous specification is additionally required so that the EPS included in the endogenous sector is in the exogenous sector. When the EPS is treated as an exogenous sector, various economic effects centered around the EPS become easy to obtain. Let the EPS be sector . After manipulating Equation (2) for the exogenous specification of the EPS, and assuming the absence of change in final demand, we can obtain the following equation [47].
where is the matrix remaining except for the row corresponding to sector in , is an th order identity matrix, is the matrix with the column and row associated with sector removed from , is an matrix in which one row, corresponding to sector , is taken from and then th element is eliminated, and means the amount of change in total output in sector . Therefore, , an matrix, in Equation (3) implies the amount by which one dollar of investment or production in the EPS triggers production in other sectors.
Let , the value-added coefficient of sector , be defined as . This refers to the proportion of the value added of sector to the total input of sector . Let be an value-added coefficient matrix comprising . The effects of one dollar of investment or production in the EPS on the value added of other sectors are formulated from Equation (3). To this end, an value-added matrix, , and a value-added coefficient matrix, , can be introduced. indicates the amount by which the value-added matrix, , changes.
where is a diagonal matrix of , and its dimension is .
Thus, , an matrix, indicates the amount that one dollar of investment or production in the EPS creates in the value added of other sectors. The amount of value added is found by comparing the right-hand side (RHS) of Equation (3) with the RHS of Equation (4), where the latter is the former multiplied by .
The effects of one dollar of investment or production in the EPS on inducing the wages of other sectors also come from Equation (3). For this purpose, an wage matrix, , and an wage coefficient matrix, , can be introduced. The elements of are the wages of all sectors except for sector . The th element in is defined as representing the ratio of sector ’s wage to the total input of sector . Let be the changes in the wage of other sectors [50].
where is a diagonal matrix of , and its magnitude is .
Consequently, , an matrix, indicates the amount by which one dollar of investment or production in the EPS affects the wages of other sectors. Comparing the RHS of Equation (3) with the RHS of Equation (5), the latter is the former multiplied by . The effects of one dollar of investment or production in the EPS on the wages of other sectors are computed using Equation (5).
The effects of USD 1.0 million of investment or production in the EPS on creating jobs in other sectors can also inferred from Equation (3). For this purpose, a employment matrix, , and an employment coefficient matrix, , are introduced. The elements of are the number of employees in the sectors, except for sector . The th element in is defined as , which is the ratio of the number of employees in sector to the total input of sector . Let be the changes in the number of employees of other sectors.
where is a diagonal matrix of , and its dimension is .
As a result, , an matrix, indicates the number of employees of other sectors that are added by a USD 1.0 million investment or production in the EPS. Comparing the RHS of Equation (3) with the RHS of Equation (6), the latter is the former multiplied by . The effects of USD 1.0 million investment or production in the EPS on the triggering of jobs in other sectors are calculated by adopting Equation (6).
2.3. Supply-Side Model
As described above, the demand-side model reflects the view that the EPS demands the output of other sectors. This model is appropriate for analyzing the backward economic effects of the EPS, as it notes that the output from other sectors is supplied to the EPS. However, the model does not consider that electricity is used as an essential input for various sectors. An alternative to the demand-side model is, therefore, required. In response, Ghosh [59] proposed a supply-side model. The usefulness of this model has been discussed in some of the literature [60,61,62,63].
The approach that one model is right and the other wrong is absolutely inappropriate. One of the two models can be appropriately selected and applied, taking into account the objective of the study. This subsection seeks to introduce the supply-side model, which can obtain the supply-shortage effect of the EPS. In particular, since power supply can be disrupted by various causes, such as drought, flood, and earthquake, the power authorities need information about the effects of an electricity supply shortage on other sectors’ production. In addition, the model is known to be quite useful in calculating the supply-shortage effect [64,65]. Let the output coefficient, , be defined as and be an matrix composed of . The supply-side model can be expressed as:
where and indicate the transpose matrix of and .
in the RHS of Equation (7) becomes the output inverse matrix. If the element of this matrix are , is defined as . The element of means the amount by which increases/decreases when there are one dollar increases/decreases in . Therefore, may be referred to as the supply-shortage coefficient matrix. As before, Equation (7) can be rewritten as a variability model.
To analyze the economic impacts on other sectors of a change in the output of the EPS, instead of a change in the value added of the EPS. Exogenous specification of making the EPS included in the endogenous sector into the exogenous sector is needed. When the EPS is handled as an exogenous sector, the supply-shortage effects of the EPS are easily obtained. After assuming that there is no change in value added, the model in which the EPS is exogenous is derived as follows.
where is the matrix remaining except for the column corresponding to sector in , is an matrix with the column and row associated with sector is removed from , is an matrix in which only column corresponding to sector is taken from and then th element is eliminated, and means the amount of change in the total output in sector .
Therefore, implies a decrease in the production of the other sectors when the supply of one dollar of output of the EPS to the other sectors is hindered. Its dimension is The supply-shortage effects of one dollar of output of the EPS on other sectors are computed using Equation (9).
2.4. Price-Side Model
The supply-side model, as well as the demand-side model described above, deal with the effects of a change in the monetary unit output of the EPS. As a result, an IO table in monetary units has been used so far. However, the original IO technique started with an IO table in physical units. The description of the price-side model basically begins with an IO table in physical units [39]. Let and be the total output of sector and total input of sector in the physical unit, respectively, and be the intermediate input from sector to sector in the physical units. The input coefficient for the physical unit, , is defined as . An matrix composed of may be referred to as D. In addition, let be the physical unit value added of sector , be the price for , be the price for , and be the physical unit value-added coefficient of sector . , , and can be defined as the ( matrices consisting of , , and , respectively. Then, the basic equation representing the price-side model is derived as:
where is the diagonal matrix of and its dimension .
If the prices per unit of total output, value added, and intermediate input are all normalized to 1, Equation (10) can be rewritten as follows.
where is the matrix diagonalizing the monetary unit value-added coefficient matrix, and is a column vector filled with 1. and mean the results from normalizing and , respectively.
Interestingly, although we started from an IO table in monetary units, Equation (11) consists of matrices in physical units. In fact, a physical unit IO table does not exist in the real world. This is because the units of output in each sector are different. Moreover, the South Korean and Japanese governments do not provide physical unit IO tables. Therefore, even if the explanation of the price-side model starts with the IO table in monetary units, it inevitably results in the use of the IO table in physical units in the final stage. Equation (11) can be re-expressed in the following variability model.
By using Equation (12), the price effect caused by a change in in each sector is obtained even if is not known. For example, the effect on each sector of wage increases in a specific sector can be calculated from Equation (12). However, since Equation (12) refers to the amount by which a 1% increase in the price for value added changes the output price of each sector, its utilization is limited. This is because our main concern is not the effect of price changes in value added, but the effect of a change in the output price of the EPS. Let be a matrix in which the column and row related to sector are removed from . Its dimension is . When no change in is assumed and the EPS is specified as exogenous in Equation (12), the following equation is derived.
where is an matrix in which a value corresponding to sector is removed, is an matrix where the element corresponding to sector is eliminated from the -th column vector of , and is the percentage change in output price of sector .
Using Equation (13), we can find the amount by which a 1% increase in the output price of the EPS raises the price for the output from other sectors. One thing to note is that the economic effects of one monetary unit of investment or production in the EPS on other sectors can be derived from Equations (3) and (9), while the amounts by which a 1% increase in output price of the EPS affects the price levels of other sectors are obtained from Equation (13).
3. Data and Results
3.1. Reconstruction of the IO Table for the Comparative Analysis
IO tables should be used for applying the IO technique. IO tables for a particular country are usually prepared and published by the country’s government agencies. The South Korean and Japanese IO tables come from the Bank of Korea and the Ministry of Internal Affairs and Communications, respectively [66,67]. This study uses the latest IO table published by these two institutions and employs the domestic IO table that removes imports. The reason is that this research aims to delve into the economic effects of EPS on the domestic national economy. The target years of the South Korean and Japanese IO tables adopted for this research are 2019 and 2015, respectively.
Although the years for the two IO tables are different, these two IO tables are used in this study [66,67]. These two IO tables are the latest to be issued. When comparing the results for the two countries, the difference of about four years is not a problem in terms of the stability of the input coefficient. The coefficient of input itself tends to remain relatively unchanged, unlike values such as total output, intermediate demand, and final demand [57]. In addition, the IO technique uses an input inverse matrix and not an input coefficient matrix, and an input inverse matrix is the more stable of the two [37]. An inverse matrix of output is also known to be stable against time changes. While the South Korean IO table adopts a 165-sector classification method or a 33-sector classification method, the Japanese IO table adopts a 187-sector classification method or a 37-sector classification method. Thus, in order to deal with the IO tables of the two countries, one appropriate sector classification method must be selected first and then applied consistently. For convenience, this study adopted the 33-sector classification method.
Since IO results of the analysis may vary slightly depending on how the sector is classified, the sector classification method should not be selected arbitrarily. In this regard, and in order to avoid unnecessary controversy related to determining the sector classification method, this study uses the sector classification method of the Bank of Korea, which issues South Korea’s IO table. Determining the sector classification method through robustness checks was avoided because it would entail too much work and would not be effective. In addition, among the Bank of Korea’s three sector classification methods, the 33-sector classification method is appropriate for showing the results of the analysis. The number of sectors used in the other two sector classification methods is greater than 33. Thus, this study adopted the 33-sector classification method. Japan’s IO table was adjusted to match the 33-sector classification method. Since, of course, the South Korean sector classification method is different from the Japanese one, there may be differences between the results of the analysis based on the former and those based on the latter. However, judging from the authors’ experience, the difference is quite small. Therefore, to save space, this study does not necessarily compare the two results. The 33-sector classification that was finally chosen is reported in Table 2.
Table 2.
Sector classification for this research.
Typically, each country releases a single IO table, and such data generally do not necessitate statistical analysis. Therefore, the size of the sample is not defined for the IO table. Additionally, analysis using IO tables is deterministic. Regardless of who performs the IO analysis, deterministic results are obtained. Of course, if an analysis is conducted by dynamically linking multiple IO tables over several decades, a statistical approach may be applied. However, this study analyzes the IO tables for specific years for two countries and compares the results between the two countries, making any form of statistical approach unfeasible.
3.2. Comparison of the Role of South Korean and Japanese EPSs in the National Economy
This subsection compares the role of the South Korean and Japanese EPSs in their national economies. Regarding the comparison, this paper adopts four economic indicators: total output, value added, wage, and employment. Table 3 shows the results of comparing the four indicators for the EPS and the national economy in South Korea and Japan. Interestingly, the values for South Korea are consistently smaller than those for Japan. In other words, since Japan has a larger economy and a larger population than South Korea, the absolute size of the EPS is larger in Japan than in South Korea. In addition, the relative proportion of the EPS is larger in Japan than in South Korea.
Table 3.
Role of South Korean and Japanese electric power sectors in the national economy.
The total output of the South Korean EPS accounts for 1.4% of the economy, compared to 2.0% for the Japanese EPS. The former is smaller than the latter. In other words, the role of the EPS in South Korea is smaller than its role in Japan. This is because South Korea’s electricity prices have themselves been set low, and are tightly controlled by the government, making the scale of total output itself low. The proportions of value added of the EPS are 1.0% and 1.4% for South Korea and Japan, respectively. The proportion is lower than that of the total output of EPS. The EPS’ wage shares are 0.6% and 1.5% for South Korea and Japan, respectively. The latter is 2.5 times the former. In other words, the difference in the share of wages is larger than the difference in the share of total output or the share of value added.
The employment shares of EPS are 0.2% and 0.3% for South Korea and Japan, respectively. In both South Korea and Japan, the proportion of value added, wage, and employment are all smaller than the proportion of total output. In particular, the share of employment is only one-seventh of the share of total output. This suggests that the EPS creates less value added, wages, and employment than other sectors. This is because the EPS itself plays a greater role in supplying electricity to each sector than in creating value added, wages, and employment.
3.3. Production-Inducing Effects of the EPS
The results of analyzing the effects of one dollar of investment or production in the South Korean and Japanese EPSs on the production of other sectors are presented in the second column of Table 4. This contains values for each sector and their rankings. The total production-inducing effect, which implies the amount by which one dollar of investment or production in the South Korean and Japanese EPSs causes production to rise in the national economy, was analyzed as 1.62449 or 1.71478, respectively. The total production-inducing effects of one dollar of investment or production in the South Korean and Japanese EPSs are shown in Figure 2.
Table 4.
Production-inducing effects, value-added creation effects, and wage-inducing effects of one dollar of investment or production in the South Korean and Japanese electric power sectors (EPSs).
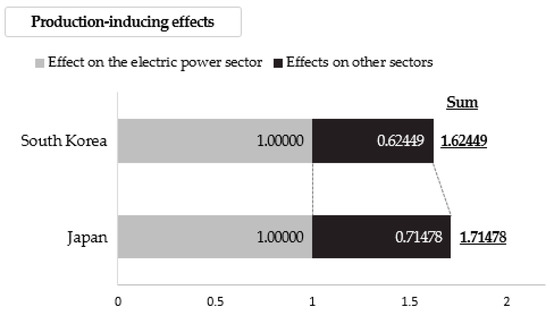
Figure 2.
Total production-inducing effects of one dollar of investment or production in the South Korean and Japanese electric power sectors.
The figure for Japan is slightly larger than the figure for South Korea. However, since IO analysis is a deterministic approach and not a statistical approach, it is unfortunately not possible to test statistically whether the figure for Japan is larger than that for South Korea. South Korea simply imports fuels such as oil, coal, and natural gas (NG) for power generation, rather than directly exploring and producing them from abroad, while Japan directly explores, produces, and then imports some of them from abroad. Since the production-inducing effect is basically an effect on the domestic economy, it would be natural for the direct development and introduction of fuels for power generation to have more economic effects than just importing them, in terms of the backward linkage. Looking at each sector, the results appear to be somewhat different across the two countries. In South Korea, the production-inducing effects of sector 16 (gas and steam supply), sector 7 (chemical products), and sector 6 (petroleum and coal products) are ranked first, second, and third, respectively. Since the percentages of coal- and NG-fired power generation reach about 40% and 30%, respectively, it seems that the production-inducing effects for sectors 16 and 6 are large. Furthermore, the production-inducing effect for sector 7 is also significant because a large amount of chemical products are required for denitrification, desulfurization, and dust collection in the operation of coal- and NG-fired power plants.
Concerning Japan, sector 2 (mined and quarried goods), sector 26 (business support services), and sector 6 (petroleum and coal products) are ranked first, second, and third, respectively. Rather than simply importing NG and coal for power generation, Japan imports them through overseas development by its companies. Thus, Japan shows the greatest production-inducing effect in sector 2. The production-inducing effect of sector 26 is also high because legal services and consulting services are used to a large extent in the process of operating power plants and selling electric power. Because oil and coal products are used widely in power generation, the production-inducing effect on sector 6 is ranked third.
3.4. Value-Added Creation Effects of the EPS
The results from comparing the effects of one dollar of investment or production in the South Korean and Japanese EPSs on creating the value-added are reported in column 3 of Table 4. , the value-added coefficient of the South Korean and Japanese EPSs, are 0.30422 and 0.36567, respectively. The former is smaller than the latter. However, the value-added creation effects of the South Korean and Japanese EPSs on other sectors are 0.21376 and 0.20146, respectively. The former is greater than the latter. The total value-added creation effects, defined as the sum of the value-added coefficient and the value-added creation effect, of the South Korean and Japanese EPSs are 0.51798 and 0.56713, respectively. The latter is larger than the former. The total value-added creation effects of one dollar of investment or production in the South Korean and Japanese EPSs are presented in Figure 3. Although the value-added creation effect of the South Korean EPS is greater than that of the Japanese EPS, Japan’s total value-added creation effect is greater than South Korea’s because the value-added coefficient of the Japanese EPS is much greater than that of the South Korean EPS.
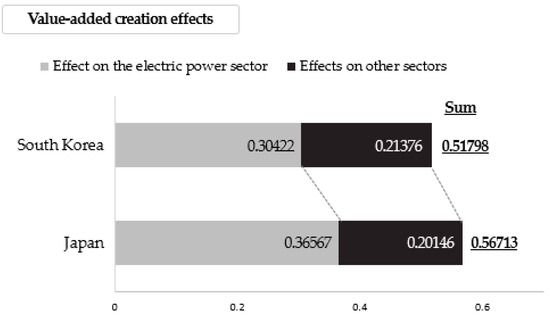
Figure 3.
Total value-added creation effects of one dollar of investment or production in the South Korean and Japanese electric power sectors.
In South Korea, the sector with the greatest value-added creation effect is sector 16 (gas and steam supply), the same as the production-inducing effect, followed by sector 25 (professional, scientific, and technical services), and sector 23 (finance and insurance). However, the value-added creation effects for sector 32 (others) and sector 8 (nonmetallic minor products) are low. As to Japan, the value-added creation effect for sector 26 (Business support services) is the greatest, followed by sector 20 (Transportation) and sector 31 (other services). The value-added creation effects for sector 25 (professional, scientific, and technical services) and sector 21 (food services and accommodation) have relatively low values.
Since South Korea imports all of its NG from overseas in the form of liquefied NG, the price of NG is quite high compared to the price of nuclear energy and coal. Therefore, although the share of NG-fired generation in total power generation is 30%, the share of NG-fired generation costs in total power-generation costs is significantly more than half. When the output of the EPS increases, sector 16 (gas and steam supply) has the largest increase in output and value added among the sectors. In addition, because the proportion of nuclear, coal, and NG power generation in the country is close to 90%, the output and value added of sector 25 (professional, scientific, and technical services), which relates to power-plant maintenance, greatly increases. Basically, in the EPS, a sales company purchases the electricity produced by purchasing fuel in advance, supplying it to the consumer, and collecting the fee later. Accordingly, an increase in EPS output in relation to fuel purchase, power generation, and power purchase has a significant impact on the output and value added of sector 23 (finance and insurance). While South Korea has only one electricity sales company, Japan has introduced competition in the electricity sales market, and a large number of electricity sales companies exist in the electricity market. An increase in Japanese EPS output increases the value added of sector 26 (business support services) by the most among all the sectors. South Korea warrants a revitalization of sector 26 (business support services) by opening up its monopolistic electricity sales market and introducing competition as has been done in Japan.
3.5. Wage-Inducing Effects of the EPS
The results of calculating the wage-inducing effects caused by one dollar of investment or production in the South Korean and Japanese EPSs are shown in column 4 of Table 4. The sums of the wage-inducing effects on other sectors are 0.08422 and 0.08468 in the two countries, showing little difference. However, the wage coefficients, which means the ratio of wages to total input, are 0.08380 and 0.00347, respectively. These values differ considerably. For this reason, the total wage-inducing effects are 0.16802 and 0.08815. The total wage-inducing effects of one dollar of investment or production in the South Korean and Japanese EPSs are given in Figure 4.
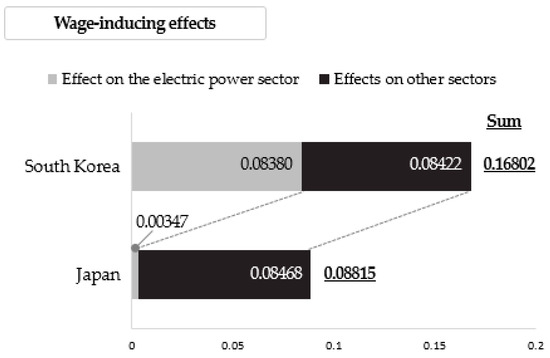
Figure 4.
Total wage-inducing effects of one dollar of investment or production in the South Korean and Japanese electric power sectors.
The figure in South Korea is about twice as high as that in Japan. This seems to reflect that the South Korean EPS has a higher wage level than other sectors. Unlike the Japanese EPS, which is highly competitive, the South Korean EPS has a larger wage coefficient. This is because public power-generation corporations, which account for more than half of the share of power generation and have a monopoly in power sales, play a leading role in the electric power market.
The South Korean sectors with a high wage-inducing effect are sector 25 (professional, scientific, and technical services), sector 26 (business support services), and sector 23 (finance and insurance). However, the wage-inducing effects for sector 32 (others) and sector 8 (nonmetallic mineral products) are low. As for Japan, sector 20 (transportation) has the greatest wage-inducing effect, followed by sector 22 (communications and broadcasting) and sector 31 (other services). The wage-inducing effects for sector 25 (professional, scientific, and technical services), and sector 21 (food services and accommodation) are the lowest.
3.6. Job-Creation Effects of the EPS
The results of examining the job-creation effects of USD 1.0 million worth of investment or production in the EPSs of both countries are shown in Table 5. Since the South Korean currency unit and the Japanese currency unit are different, the job-creation effect was, for convenience, calculated based on the USD using exchange-rate information [69]. The number of people employed in the power sector per USD 1.0 million of production in South Korea and Japan is about 0.10 and 1.04, respectively. The latter is more than 10 times that of the former. South Korea has a relatively small number of employees in the EPS. Compared to the South Korean EPS, the Japanese EPS seems to be more labor intensive. The job-creation effects of the South Korean and Japanese EPSs on other sectors are about 2.44 and 2.96, respectively. The latter is greater than the former. Therefore, the total job-creation effects are 2.54 and 4.00, respectively. The total job-creation effects of USD 1.0 million of investment or production in the South Korean and Japanese EPSs are illustrated in Figure 5. Those in Japan are much greater than those in South Korea. The higher job-creation effect does not necessarily mean that the electric power industry structure is more desirable. However, the fact that the total job-creation effect of the EPS in South Korea is smaller than that in Japan suggests that South Korea needs to enhance the job-creation effect.
Table 5.
Job-creation effects of USD one million of investment or production in the South Korean and Japanese electric power sectors.
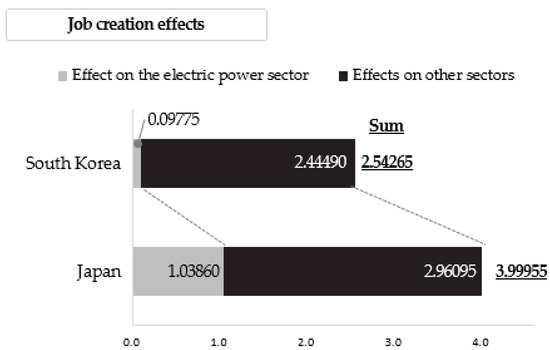
Figure 5.
Total job-creation effects of USD one million of investment or production in the South Korean and Japanese electric power sectors.
The sectors with the greatest job-creation effects in South Korea are sector 25 (professional, scientific, and technical services), sector 19 (wholesale, retail trade, and community brokerage services), and sector 26 (business support services). Sector 32 (others) and sector 8 (nonmetallic mineral products) have small job-creation effects. As to Japan, sector 26 (business support services), sector 31 (other services), and sector 20 (transportation) have the greatest job-creation effects, while sector 25 (professional, scientific, and technical services), and sector 21 (food services and accommodation) show the smallest job-creation effects.
3.7. Supply-Shortage Effects of the EPS
Table 6 shows the results of looking into the supply-shortage effect, which is the production disruption effect that occurs in other sectors when one dollar worth of output in the South Korean or Japanese EPSs is not properly supplied to the economy. The sums for the two countries are 1.63620 and 1.18226, respectively. The former is about 1.4 times greater than the latter. This means that the national effect of an electric power supply shortage in South Korea is 1.4 times that in Japan. The total effects of one dollar of supply shortage in the output of the South Korean and Japanese EPSs are provided in Figure 6. Both South Korea and Japan are manufacturing powerhouses, but the proportion of the gross domestic product of the South Korean manufacturing industry is much larger than that of the Japanese manufacturing industry. In particular, South Korea’s major manufacturing industries consume large quantities of electricity. According to the South Korea Electric Power Corporation (KEPCO), in 2020, 59.2% of the total electricity consumption was attributed to the manufacturing sector. This sector includes steel, oil refining, petrochemicals, semiconductors, and automobiles. Therefore, it seems natural that the supply-shortage effect of the South Korean EPS is greater than that of the Japanese EPS.
Table 6.
Effects of one dollar of supply shortage in the output of the South Korean and Japanese electric power sectors.
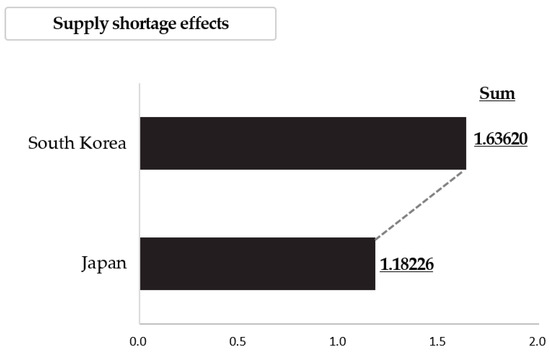
Figure 6.
Total effects of one dollar of supply shortage in the output of the South Korean and Japanese electric power sectors.
Sector 9 (basic metal products), sector 25 (professional, scientific, and technical services), and sector 7 (chemical products) are the sectors suffering the greatest supply-shortage effect in South Korea. Since all three sectors consume high quantities of electricity, this result is natural. On the other hand, sector 32 (others) and sector 2 (mined and quarried goods), which use relatively little electricity, are sectors with low supply-shortage effects. As for Japan, sector 9 (basic metal products), sector 19 (wholesale, retail trade, and community brokerage services), and sector 7 (chemical products) have the largest supply-shortage effects. Sector 2 (mined and quarried goods) and sector 32 (others) reveal the smallest supply-shortage effects. In other words, it can be seen that the structure of the supply-shortage effects in South Korea and Japan is not quite different.
3.8. Price Effects of the EPS
By applying the price-side model, the results from calculating the impacts of a 10% increase/decrease in the output price for the EPS on other sectors’ prices are shown in Table 7. The last row presents the magnitude of the effect on the overall price level. This value is derived as the weighted average of the sector-specific price effects on the total output of each sector. The arithmetic mean may be considered, but this does not properly represent the price effect because it does not reflect the difference in the total output of each sector. The arithmetic averages of the price effect for the two countries are 0.26345% and 0.24359%, respectively. However, the weighted averages are 0.23995% and 0.21873%, respectively. The arithmetic mean values and the weighted mean values are significantly different. The total price effects of a 10% increase in the output price of the South Korean and Japanese EPSs are shown in Figure 7.
Table 7.
Price effects of a 10% increase in the output price of the South Korean and Japanese electric power sectors.
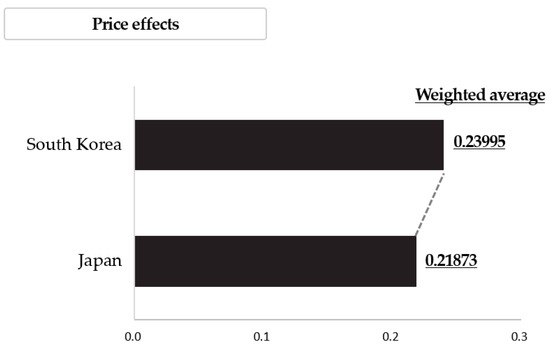
Figure 7.
Total price effects of a 10% increase in the output price of the South Korean and Japanese electric power sectors.
Looking at the price effect for South Korea by sector, sector 9 (basic metal products), sector 17 (water supply, sewage, waste treatment, and disposal services), and sector 8 (nonmetallic mineral products) have the largest values. In these sectors, since electricity bills account for a relatively large fraction of the total production cost of the output, the price effect seems to be large. On the other hand, sector 26 (business support services) and sector 27 (public administration, defense, and social security services) have low price effects. As for Japan, the price effects for sector 9 (basic metal products), sector 17 (water supply, sewage, waste treatment, and disposal services), and sector 8 (nonmetallic mineral products) are large, which is interestingly the same as in South Korea. The sectors with low price effects are sector 2 (mined and quarried goods) and sector 24 (real estate services).
4. Discussion of the Results
The results reported in Section 3 will be discussed from two perspectives: the implications and the potential uses of the results. First, for convenience, several implications can be derived from Table 8, which summarizes the results of investigating the six economic effects. First, with respect to the four economic effects obtained from the demand-side model, Japan shows greater total effects of the EPS on inducing production and creating value added than South Korea. South Korea should make efforts to improve the value-added coefficient of the EPS. The difference is not very large, and it seems to be due to the industrial and market structure of the EPSs in the two countries.
Table 8.
Summary of the economic effects in the South Korean and Japanese electric power sectors.
The South Korean EPS is strongly regulated by the government. Government-established public corporations are in charge of more than 80% of the total power generation. The only electricity distributor is also a government-established public corporation. In other words, the amount of power generated by private power-generation companies is increasing, but the electric power industry structure is still centered on public enterprises. Thus, the scope for improving production-inducing and value-added creation effects is somewhat limited. On the other hand, in Japan, the electricity sales market is open and competitive, and various public and private companies are active in the electric power-generation market. South Korea should make efforts to enhance the effects of the EPS on inducing production and creating value added by making a more competitive market environment. The authors think that competition should be more active in the South Korean EPS. Stimulating competition does not necessarily mean privatization. Even if privatization does not gain ground, more active competition can be promoted through facilitating network neutrality and liberalizing entry and exit.
Second, the total job-creation effect of the Japanese EPS is about 1.57 times greater than that of the South Korean EPS. Not only does the Japanese EPS cause more job creation in other industries, but also the number of employees per USD 1.0 million output in the South Korean EPS is less than a tenth of that in the Japanese EPS. As mentioned earlier, the South Korean EPS is centered on public enterprises. Therefore, competition in the market is weak. It seems that this leads to a high wage structure and reduces employment. In particular, the Japanese electric power sales market employs large numbers of people to expand its share in the market because of the fierce competition. A relatively small number of employees in the South Korean EPS may mean high efficiency, but it is not in line with the government’s plan to create jobs through the growth of the EPS. The authors think that deregulating the electricity industry would make the labor market of the South Korean EPS less monopsonic and more competitive [16].
Third, the total wage-inducing effect of the Japanese EPS is about half that of the South Korean EPS. In fact, the wage-inducing effect on other industries is almost the same for the two countries. However, the wage coefficient in the South Korean EPS is 24 times that in the Japanese EPS. This is an interesting finding. It clearly shows the aforementioned high wage structure of the South Korean EPS. The structure of the South Korean EPS, which is centered on government-owned companies, seems to have raised the wage coefficient compared to Japan.
Fourth, the supply-shortage effect of the South Korean EPS is about 1.4 times that of the Japanese EPS. This means that electric power supply disruptions cause more damage to South Korea than to Japan. The South Korean economic system depends heavily on exports by the manufacturing sectors, and all the major exporting manufacturing industries of South Korea consume more electricity than the manufacturing industries of Japan. Therefore, for the purpose of increasing the price competitiveness of the South Korean manufacturing industry, efforts should be made to reduce the ratio of electricity bills to their total costs by innovating to change the industry’s electricity-consumption structure to a less electricity-consuming structure.
Of course, this is quite difficult, since further development of industry will make firms use more electricity, and the wealth effect from industry upgrades will dominate the substitution effect from phasing out less efficient production machines. Even if the total electricity consumption in the industrial sector increases, various measures to reduce electricity costs as a proportion of total costs are being implemented in South Korea. For example, large-scale generation for self-consumption could be installed. One semiconductor manufacturer has installed and is operating a natural gas-fired power plant with a capacity of 580 MW for its own consumption and is currently constructing an additional power plant of the same capacity. Since generation for self-consumption does not require transmission facilities, spending on electricity can be reduced compared to purchasing electricity. Increasingly, industrial companies with processes that require heating or cooling generated by electricity are reducing their electricity bills by utilizing heating or cooling from sewage or river water [70,71,72]. In addition, electricity bills are being reduced by performing basic processes that consume a lot of electricity in foreign countries where electricity rates are low and performing final processes that consume relatively less electricity domestically.
Fifth, the price effect of an increase in the South Korean electricity bills is 9.7% greater than the effect on Japanese electricity bills. In other words, a rise in electricity bills has a more substantial impact on the production costs of South Korea than it does in Japan. This is because South Korea accounts for a larger share of electricity bills in total production costs than Japan. In addition, curbing the increase in electricity bills in South Korea has a more significant price-stabilization effect compared to Japan. For this reason, the South Korean government is implementing a stronger electricity rate suppression policy than the Japanese government. For example, the cumulative deficit of KEPCO, South Korea’s only electricity distributor, reached about KRW 47.5 trillion (USD 37.0 billion) by the first half of 2023. To the extent of the authors’ knowledge, KEPCO is the only large power seller in the OECD countries that is carrying such a huge deficit. The accumulated deficit is more than three times the market capitalization of KEPCO, which is KRW 13 trillion (USD 10.1 billion). If KEPCO had been a private company, it would have gone bankrupt already. However, since KEPCO is a public company with the government holding a 51% stake, it is still carrying on. Similarly, Taiwan Electric Power Corporation, which is also state owned and suffering enormous deficits owing to government directives to smooth inflation and absorb price hikes, posted a deficit of TWD 400 billion (USD 12.7 billion) in 2023.
The results described above have various potential uses. Various new power-supply projects are being planned because power demand will rise in the future, and the findings from this research can be employed to proactively diagnose the backward economic effects of these projects. For instance, according to the Korea Ministry of Trade, Industry, and Energy [12], the new construction of a number of NG-fired power plants, the phase-out of existing coal-fired power plants, the new construction of nuclear power plants, the extension of the lives of existing nuclear power plants, and the expansion of RE are scheduled. We can predict in advance the effect on production, value added, wages, and jobs that will occur in the national economy when these projects are carried out as planned.
Second, the results of employing the supply-side model enable us to set the priority for supplying electricity to each group of consumers. In the event of electricity rationing, it is important to identify which sectors should be supplied first with electricity when only a limited amount of electricity can be supplied. If the principle of prioritizing supply to sectors that would suffer high levels of damage is socially accepted, the supply-shortage effect by sector presented in this study can be used as an important basis. When the electricity supply was disrupted in the model by the same amount, the hardest-hit sector was basic metal products for both South Korea and Japan. Thus, from an industrial perspective, the rationale for preferentially supplying electricity to the basic metal products sector can be justified in terms of minimizing damage to society.
Third, the results of utilizing the price-side model can be used to predict the price effect of electricity rate hikes or cuts in advance. Fuels such as NG, oil, coal, and uranium are used to generate electricity. The international price of these fuels must be the most important factor for determining electricity bills. Knowing in advance the impact on the overall price level of adjusting electricity rates as fuel prices rise or fall would help industries to take the necessary follow-up measures early. In addition, if price adjustments would result in a significant price effect in a particular sector, consideration could be given to curbing the rise in product prices in that sector by subsidizing some of the electricity bills for that sector. Although KEPCO is already suffering a huge loss, the government operates a large-scale power industry infrastructure fund. Therefore, the government has the capacity to implement a subsidy. In South Korea, the fund, which is equivalent to 3.7% of the electricity bill, is levied on all consumers in addition to the electricity bill. In any case, rather than discussing measures for raising or lowering electricity rates without any information, the measures will be more productive and effective if they are discussed with the benefit of information on price effect by sector.
5. Conclusions
Stabilizing the EPS is a crucial task for national survival in Japan and South Korea, which have similar electric power supply conditions. Moreover, in the ongoing process, the EPS must go beyond its conventional role of supplying electricity and instead function as a growth engine for generating new jobs. This article not only delved into the roles of the South Korean and Japanese EPSs in the national economies through the IO technique but also tried to draw implications by comparing the results. This article makes a significant contribution to the existing literature in two ways. The first is that by utilizing the most recently published IO tables of the two countries as input data, the results have been updated. Furthermore, because the EPS was treated exogenously, not endogenously, the economic impacts of the EPS on other sectors can be quantitatively analyzed, focusing on the EPS. The second is that, by horizontally comparing the results for South Korea and Japan, various implications can be derived.
The production-inducing, value-added creation, and job-creation effects of the South Korean EPS are smaller than those of the Japanese EPS. South Korea and Japan have similar export-led economic systems based on manufacturing, but Japan’s economic capabilities and status are clearly higher than those of South Korea. In addition, Japan pursued modernization and industrialization before South Korea. Consequently, South Korea is adopting an industrial development strategy that seeks to pursue and leapfrog Japan, while referring to Japan’s industrial structure. Assuming that South Korea should pursue Japan, which is a more advanced country than South Korea, the South Korean EPS should strive to enhance these three effects. However, the wage-inducing, supply-shortage, and price effects of the South Korean EPS are greater than those of the Japanese EPS. Since the South Korean EPS has a higher wage structure than the Japanese EPS, South Korea should further boost competition in the electricity sector so that it can increase jobs rather than high wages. Since the supply shortage of electricity in South Korea can cause more economic damage than a shortage in Japan, preemptive investment to stabilize the electric power supply is essential. KEPCO, South Korea’s only electricity transmission, substation, distribution, and sales company, is suffering from large-scale deficits and is unable to invest properly in electricity transmission, substations, and distribution facilities. It is difficult for KEPCO to maintain and repair the existing facilities, let alone invest in new facilities. Thus, concerns are growing about the stability of the power supply. According to the government, approximately KRW 100 trillion (USD 78 billion) needs to be invested in transmission, substation, and distribution facilities by 2036. Furthermore, since the price effect of an increase in the output price of the South Korean EPS is higher than that for the Japanese EPS, careful measures should be taken to reduce the negative impact on prices when the inevitable electricity rate hikes are made. For instance, the government could suppress the overall electricity rate increases by injecting finances into KEPCO. In the past, the South Korean government invested KRW 600 billion (USD 467 million) to suppress electricity rate increases. Alternatively, the government could provide subsidies on electricity bills for specific sectors through finance. Moreover, the government could force KEPCO to provide discounts on electricity rates for essential areas, despite its deficits.
Author Contributions
Conceptualization, S.-Y.L. and K.-M.B.; methodology, S.-H.Y.; validation, S.-Y.L., K.-M.B., and S.-H.Y.; formal analysis, S.-H.Y.; investigation, S.-H.Y.; resources, S.-H.Y.; data curation, S.-Y.L. and S.-H.Y.; writing—original draft preparation, S.-Y.L. and K.-M.B.; writing—review and editing, S.-H.Y.; supervision, S.-H.Y.; project administration, S.-H.Y. All authors have read and agreed to the published version of the manuscript.
Funding
This study was supported by the Research Program funded by the SeoulTech (Seoul National University of Science and Technology) (2023–1000).
Data Availability Statement
Data are contained within the article.
Conflicts of Interest
The authors declare no conflicts of interest.
References
- Balat, M. Electricity from worldwide energy sources. Energy Sources Part B Econ. Plan. Policy 2006, 1, 395–412. [Google Scholar] [CrossRef]
- Zohuri, B.; McDaniel, P.; Zohuri, B.; McDaniel, P. The Electricity: An Essential Necessity in Our Life. In Advanced Smaller Modular Reactors: An Innovative Approach to Nuclear Power; Springer: Cham, Switzerland, 2019; pp. 1–21. [Google Scholar]
- Gbadebo, O.O.; Okonkwo, C. Does energy consumption contribute to economic performance? Empirical evidence from Nigeria. J. Econ. Int. Financ. 2009, 1, 44. [Google Scholar]
- Zhang, C.; Zhou, K.; Yang, S.; Shao, Z. On electricity consumption and economic growth in China. Renew. Sustain. Energy Rev. 2017, 76, 353–368. [Google Scholar] [CrossRef]
- Wolde-Rufael, Y. Electricity consumption and economic growth: A time series experience for 17 African countries. Energy Policy 2006, 34, 1106–1114. [Google Scholar] [CrossRef]
- Yoo, S.H. Electricity consumption and economic growth: Evidence from Korea. Energy Policy 2005, 33, 1627–1632. [Google Scholar] [CrossRef]
- Wolfram, C.; Shelef, O.; Gertler, P. How will energy demand develop in the developing world? J. Econ. Perspect. 2012, 26, 119–138. [Google Scholar] [CrossRef]
- Sugiyama, M. Climate change mitigation and electrification. Energy Policy 2012, 44, 464–468. [Google Scholar] [CrossRef]
- International Energy Agency. Electricity Market Report 2023; International Energy Agency: Paris, France, 2023. [Google Scholar]
- Kim, H.S.; Shin, E.S.; Chung, W.J. Energy demand and supply, energy policies, and energy security in the Republic of Korea. Energy Policy 2011, 39, 6882–6897. [Google Scholar] [CrossRef]
- Kim, C. A review of the deployment programs, impact, and barriers of renewable energy policies in Korea. Renew. Sustain. Energy Rev. 2021, 144, 110870. [Google Scholar] [CrossRef]
- Korea Ministry of Trade, Industry and Energy. The 10th Basic Plan for Electricity Demand and Supply (2022–2036); Korea Ministry of Trade, Industry and Energy: Sejong, Republic of Korea, 2023. [Google Scholar]
- Lee, B.H.; Ahn, H.H. Electricity industry restructuring revisited: The case of Korea. Energy Policy 2006, 34, 1115–1126. [Google Scholar] [CrossRef]
- Kim, J.; Kim, K. The electricity industry reform in Korea: Lessons for further liberalization. In Infrastructure Regulation: What Works, Why and How Do We Know? World Scientific Publishing: Singapore, 2011; pp. 333–358. [Google Scholar]
- Park, J.K.; Kim, Y.J. Status and perspective of electric power industry in Korea. In Proceedings of the IEEE Power Engineering Society General Meeting, San Francisco, CA, USA, 16 June 2005; pp. 2896–2899. [Google Scholar]
- Goto, M.; Sueyoshi, T. Electric power market reform in Japan after Fukushima Daiichi nuclear plant disaster: Issues and future direction. Int. J. Energy Sect. Manag. 2015, 9, 336–360. [Google Scholar] [CrossRef]
- Ofuji, K.; Tatsumi, N. Wholesale and retail electricity markets in Japan: Results of market revitalization measures and prospects for the current. Econ. Energy Environ. Policy 2016, 5, 31–50. [Google Scholar] [CrossRef]
- Lee, C.; Kim, K.D. Effects of the forest industry on the South Korean national economy: Evidence from an Input-Output analysis based on the special classification for the forest industry. For. Sci. Technol. 2022, 18, 56–66. [Google Scholar] [CrossRef]
- Kim, K.H.; Kim, J.H.; Yoo, S.H. An Input-Output Analysis of the Economic Role and Effects of the Mining Industry in South Korea. Minerals 2020, 10, 624. [Google Scholar] [CrossRef]
- Lee, I.; Jang, S.; Chung, Y.; Seo, H. Economic spillover from renewable energy industries: An input-output analysis. Int. J. Green Energy 2022, 19, 809–817. [Google Scholar] [CrossRef]
- Kim, J.H.; Yoo, S.H. Comparison of the economic effects of nuclear power and renewable energy deployment in South Korea. Renew. Sustain. Energy Rev. 2021, 135, 110236. [Google Scholar] [CrossRef]
- Yagi, M.; Kagawa, S.; Managi, S.; Fujii, H.; Guan, D. Supply constraint from earthquakes in Japan in input–output analysis. Risk Anal. 2020, 40, 1811–1830. [Google Scholar] [CrossRef] [PubMed]
- Matsumoto, K.I.; Matsumura, Y. Challenges and economic effects of introducing renewable energy in a remote island: A case study of Tsushima Island, Japan. Renew. Sustain. Energy Rev. 2022, 162, 112456. [Google Scholar] [CrossRef]
- Ali, Y.; Sabir, M.; Muhammad, N. A comparative input-output analysis of the construction sector in three developing economies of South Asia. Constr. Manag. Econ. 2019, 37, 643–658. [Google Scholar] [CrossRef]
- Bon, R.; Pietroforte, R. Historical comparison of construction sectors in the United States, Japan, Italy and Finland using input-output tables. Constr. Manag. Econ. 1990, 8, 233–247. [Google Scholar] [CrossRef]
- Ilhan, B.; Yaman, H. A comparative input-output analysis of the construction sector in Turkey and EU countries. Eng. Constr. Archit. Manag. 2011, 18, 248–265. [Google Scholar] [CrossRef]
- De Souza, K.B.; De Andrade Bastos, S.Q.; Perobelli, F.S. Multiple trends of tertiarization: A comparative input–output analysis of the service sector expansion between Brazil and United States. EconomiA 2016, 17, 141–158. [Google Scholar] [CrossRef][Green Version]
- Hasanli, Y.; Salihova, S. A comparative analysis of tourism sectors of Azerbaijan, Turkey and Kazakhstan through input-output tables. J. Econ. Sci. Theory Pract. 2019, 76, 70. [Google Scholar]
- Mun, J.; Yun, E.; Choi, H.; Kim, J. Comparative study in software and healthcare industries between South Korea and US based on economic input–output analysis. Atmosphere 2022, 13, 209. [Google Scholar] [CrossRef]
- Fotia, A.; Teclean, C. The Innovation efficiency in Central and Eastern European input-output comparative analysis between Czech Republic, Hungary, Poland and Romania. EURINT 2019, 6, 269–287. [Google Scholar]
- Gorska, R. Backward and forward linkages based on an input-output analysis–comparative study of Poland and selected European countries. Appl. Econom. Pap. 2015, 2, 30–50. [Google Scholar]
- Thangavelu, S.M.; Wang, W.; Oum, S. Servicification in global value chains: Comparative analysis of selected Asian countries with OECD. World Econ. 2018, 41, 3045–3070. [Google Scholar] [CrossRef]
- Proops, J.L.; Faber, M.; Wagenhals, G. Reducing CO2 Emissions: A Comparative Input-Output Study for Germany and the UK; Springer Science & Business Media: Berlin/Heidelberg, Germany, 2012. [Google Scholar]
- Li, Z.; Sun, L.; Geng, Y.; Dong, H.; Ren, J.; Liu, Z.; Tian, X.; Yabar, H.; Higano, Y. Examining industrial structure changes and corresponding carbon emission reduction effect by combining input-output analysis and social network analysis: A comparison study of China and Japan. J. Clean. Prod. 2017, 162, 61–70. [Google Scholar] [CrossRef]
- Long, R.; Li, J.; Chen, H.; Zhang, L.; Li, Q. Embodied carbon dioxide flow in international trade: A comparative analysis based on China and Japan. J. Environ. Manag. 2018, 209, 371–381. [Google Scholar] [CrossRef]
- Giaschini, M. Input-output Analysis; Chapman and Hall: London, UK, 1988. [Google Scholar]
- Miller, R.E.; Blair, P.D. Input-Output Analysis: Foundations and Extensions; Prentice-Hall: Hoboken, NJ, USA, 1985. [Google Scholar]
- Hienuki, S. Environmental and socio-economic analysis of naphtha reforming hydrogen energy using input-output tables: A case study from Japan. Sustainability 2017, 9, 1376. [Google Scholar] [CrossRef]
- Ju, H.C.; Yoo, S.H.; Kwak, S.J. The electricity shortage cost in Korea: An input-output analysis. Energy Sources Part B Econ. Plan. Policy 2016, 11, 58–64. [Google Scholar] [CrossRef]
- Lim, S.Y.; Yoo, S.H. The impact of electricity price changes on industrial prices and the general price level in Korea. Energy Policy 2013, 61, 1551–1555. [Google Scholar] [CrossRef]
- Lim, H.J.; Yoo, S.H.; Kwak, S.J. Industrial CO2 emissions from energy use in Korea: A structural decomposition analysis. Energy Policy 2009, 37, 686–698. [Google Scholar] [CrossRef]
- Logar, I.; Van Den Bergh, J.C. The impact of peak oil on tourism in Spain: An input–output analysis of price, demand and economy-wide effects. Energy 2013, 54, 155–166. [Google Scholar] [CrossRef]
- Önder, H.G. Renewable energy consumption policy in Turkey: An energy extended input-output analysis. Renew. Energy 2021, 175, 783–796. [Google Scholar] [CrossRef]
- O’Sullivan, M.; Edler, D. Gross employment effects in the renewable energy industry in Germany—An input–output analysis from 2000 to 2018. Sustainability 2020, 12, 6163. [Google Scholar] [CrossRef]
- Robison, M.H.; Duffy-Deno, K.T. The role of the oil and gas industry in Utah’s economy: An economic base/input-output analysis. Resour. Energy Econ. 1996, 18, 201–218. [Google Scholar] [CrossRef]
- Siala, K.; de la Rúa, C.; Lechón, Y.; Hamacher, T. Towards a sustainable European energy system: Linking optimization models with multi-regional input-output analysis. Energy Strategy Rev. 2019, 26, 100391. [Google Scholar] [CrossRef]
- Sun, C.; Chen, Z.; Guo, Z.; Wu, H. Energy rebound effect of various industries in China: Based on hybrid energy input-output model. Energy 2022, 261, 125147. [Google Scholar] [CrossRef]
- Wang, Q.; Ge, S. Uncovering the effects of external demand on China’s coal consumption: A global input–output analysis. J. Clean. Prod. 2020, 245, 118877. [Google Scholar] [CrossRef]
- Karkacier, O.; Goktolga, Z.G. Input–output analysis of energy use in agriculture. Energy Convers. Manag. 2005, 46, 1513–1521. [Google Scholar] [CrossRef]
- Casler, S.; Wilbur, S. Energy input-output analysis: A sample guide. Resour. Energy 1984, 6, 187–201. [Google Scholar] [CrossRef]
- Leontief, W. Input-output analysis. New Palgrave. A Dict. Econ. 1987, 2, 860–864. [Google Scholar]
- Leontief, W. Input-Output Economics; Oxford University Press: Oxford, UK, 1986. [Google Scholar]
- Fletcher, J.E. Input-output analysis and tourism impact studies. Ann. Tour. Res. 1989, 16, 514–529. [Google Scholar] [CrossRef]
- Rose, A.; Miernyk, W. Input-output analysis: The first fifty years. Econ. Syst. Res. 1989, 1, 229–272. [Google Scholar] [CrossRef]
- Lahr, M.L.; Dietzenbacher, E. (Eds.) Input-Output Analysis: Frontiers and Extensions; Palgrave: New York, NY, USA, 2001; pp. 1–31. [Google Scholar]
- Ten Raa, T. The Economics of Input-Output Analysis; Cambridge University Press: Cambridge, UK, 2006. [Google Scholar]
- Miller, R.E.; Blair, P.D. Input-Output Analysis: Foundations and Extensions, 2nd ed.; Cambridge University Press: New York, NY, USA, 2009. [Google Scholar]
- Wu, X.F.; Chen, G.Q. Energy use by Chinese economy: A systems cross-scale input-output analysis. Energy Policy 2017, 108, 81–90. [Google Scholar] [CrossRef]
- Ghosh, A. Input-output approach in an allocation system. Economica 1958, 25, 58–64. [Google Scholar] [CrossRef]
- Deman, S. Stability of supply coefficients and consistency of supply-driven and demand-driven input—Output models. Environ. Plan. A 1988, 20, 811–816. [Google Scholar] [CrossRef]
- Oosterhaven, J. On the plausibility of the supply-driven input-output model. J. Reg. Sci. 1988, 28, 203–217. [Google Scholar] [CrossRef]
- Gruver, G.W. On the plausibility of the supply-driven input-output model: A theoretical basis for input-co-efficient change. J. Reg. Sci. 1989, 29, 441–450. [Google Scholar] [CrossRef]
- Rose, A.; Allison, T. On the plausibility of the supply-driven input-output model: Empirical evidence on joint stability. J. Reg. Sci. 1989, 29, 451–458. [Google Scholar] [CrossRef]
- Leung, P.; Pooley, S. Regional economic impacts of reductions in fisheries production: A supply-driven approach. Mar. Resour. Econ. 2001, 16, 251–262. [Google Scholar] [CrossRef]
- Zhang, Y. Supply-side structural effect on carbon emissions in China. Energy Econ. 2010, 32, 186–193. [Google Scholar] [CrossRef]
- Bank of Korea. Input-Output Table in 2019 Year. Available online: http://www.bok.or.kr (accessed on 1 December 2022).
- Statistics Bureau of Japan. Input-Output Table in 2015 Year. Available online: http://www.stat.go.jp (accessed on 1 December 2022).
- Bank of Korea. Exchange Rate/International Reserves and Trade. Available online: https://ecos.bok.or.kr (accessed on 21 February 2024).
- Schweizer-Ries, P. Energy sustainable communities: Environmental psychological investigations. Energy Policy 2008, 36, 4126–4135. [Google Scholar] [CrossRef]
- Cecconet, D.; Raček, J.; Callegari, A.; Hlavínek, P. Energy recovery from wastewater: A study on heating and cooling of a multipurpose building with sewage-reclaimed heat energy. Sustainability 2019, 12, 116. [Google Scholar] [CrossRef]
- Kim, M.H.; Kim, D.W.; Han, G.; Heo, J.; Lee, D.W. Ground Source and Sewage Water Source Heat Pump Systems for Block Heating and Cooling Network. Energies 2021, 14, 5640. [Google Scholar] [CrossRef]
- Liu, Z.; Ma, L.; Zhang, J. Application of a heat pump system using untreated urban sewage as a heat source. Appl. Therm. Eng. 2014, 62, 747–757. [Google Scholar] [CrossRef]
Disclaimer/Publisher’s Note: The statements, opinions and data contained in all publications are solely those of the individual author(s) and contributor(s) and not of MDPI and/or the editor(s). MDPI and/or the editor(s) disclaim responsibility for any injury to people or property resulting from any ideas, methods, instructions or products referred to in the content. |
© 2024 by the authors. Licensee MDPI, Basel, Switzerland. This article is an open access article distributed under the terms and conditions of the Creative Commons Attribution (CC BY) license (https://creativecommons.org/licenses/by/4.0/).