1. Introduction
Recognized as a paramount aspect of the Belt and Road Initiative (BRI), energy cooperation holds significant importance. In April 2019, China and 29 nations initiated the establishment of an energy partnership along the BRI. By 2021, a collaborative energy network was unveiled with a primary focus on enhancing bilateral and multilateral cooperation through network expansion. Given the ongoing construction projects and the pursuit of “dual carbon” targets, renewable energy has emerged as a crucial sector to drive sustainable growth in the countries along the BRI [
1]. The most tangible expression of renewable energy collaboration is through foreign direct investment (FDI). This is crucial for addressing the significant capital and technology gaps faced by many BRI countries, particularly those that are still in the process of development. The International Institute of Green Finance at the Central University of Finance and Economics has noted a declining trend in the share of fossil energy in China’s investment and construction projects within the BRI energy sector since 2016, reaching its lowest point in 2020. In contrast, investments in renewable energy such as hydro, photovoltaic, wind, and biomass surpassed investments in fossil energy in 2020, accounting for 58% of the total investments. International trade serves as another avenue for the cross-border movement of renewable energy commodities [
2]. Energy resource trade among the countries along the BRI has experienced steady growth, with its value increasing from USD 1.04 trillion to USD 2.07 trillion between 2013 and 2020 [
3]. The integration of resource endowments and the evolving dynamics of energy systems have led to the growing complexity of renewable energy trade relations. This complexity has resulted in changes in trading partners, reconfiguration of cooperation and competition dynamics, and the emergence of cooperative rivalries [
4,
5,
6,
7].
Coopetition, a combination of cooperation and competition, refers to the interplay of competitiveness in certain areas and collaboration in others. It enables innovation, resource allocation, cost reduction, market expansion, and so on. Unfortunately, the current research on renewable energy systems primarily focuses on analyzing trade and assessing product potential [
8,
9]. For instance, Fu et al. (2017) examined the geographical characteristics and evolution of China’s solar and hydropower products trade from 1988 to 2013 using network analysis methods [
10]. Shuai et al. (2020) empirically tested the trade potential of renewable energy products in BRI countries using a gravity model [
5]. There is relatively limited analysis of competitive or cooperative trade relations among countries [
11,
12,
13], and there is a significant lack of focus on trade relations between countries along the BRI, as well as a unified analytical framework that simultaneously encompasses both competition and cooperation aspects.
The existing studies on renewable energy have primarily focused on cooperation, specifically examining the renewable energy industry within the framework of the BRI. These studies have aimed to summarize China’s energy landscape and its international cooperation in relation to the BRI [
7,
14,
15]. However, research on competition has mainly centered around traditional fossil fuels, particularly oil [
16,
17], with relatively limited attention given to renewable energy [
11,
12,
13]. Recently, Gao et al. (2023) conducted discussions on the coexistence of competition and cooperation in renewable energy trade along the BRI [
7]. Regarding the methods employed in these studies, it has been found that complex network theory (CNT) is prevalent in analyzing energy or renewable energy trade [
18,
19,
20]. The advantages of using CNT in this context primarily revolve around revealing the trade structure [
10,
21].
However, there remains a limited level of in-depth analysis concerning the dynamics of coopetition in this context. To the best of our knowledge, no analysis has been conducted regarding the stability of the renewable energy trade system. The BRI region plays a crucial role as a global energy supply hub, bringing economic prosperity and regional cooperation to countries along its route. However, there are significant uncertainties, such as international disputes, conflicts, and terrorism, which pose threats to the stability of renewable energy trade relations among BRI countries [
22,
23]. Given these challenges, it is essential to analyze the systemic stability and its evolution. Fortunately, research on systemic stability has been supported by the signed network model, primarily guided by the structural balance theory. Signed networks are networks that include positive or negative sign attributes. The utilization of sign attributes allows for a comprehensive analysis of both positive and negative information in understanding the alignment and recognition of complex systems and their applications. Negative edges, in particular, have a significant impact on the formation, structural evolution, and dynamics of networks [
24]. This influence is particularly relevant in trade networks, given the interplay of competition and cooperation among different countries.
Therefore, this study aims to delve into the intricate dynamics of coopetition relationships in renewable energy trade among BRI countries using signed network theory. As the integration of resource endowments and dynamic changes in energy systems continues, the complexity of renewable energy trade relations is increasing. However, the current research lacks a comprehensive framework that simultaneously considers both the competitive and cooperative aspects of trade relations among BRI countries. Furthermore, given the potential impact of international disputes and conflicts on trade relations, it is imperative to uncover the dynamic characteristics of renewable energy trade among BRI countries, understand the evolution of competition and cooperation among these nations, and evaluate the stability of the coopetition relationship system in renewable energy trade under the BRI. Based on the considerations mentioned above, this study makes several contributions: (1) A novel signed network model is constructed. This model contributes to a better understanding of the inherent mechanisms and operational patterns of trade relations. It provides valuable insights and suggestions for ensuring the stability of these trade relationships. (2) An in-depth analysis is conducted by integrating the evolution of competitive and cooperative relationships within a unified framework. This approach enables a comprehensive examination of the dynamics of coopetition, leading to the discovery of novel insights and findings. (3) The study employs a threefold analysis encompassing the single node, local community, and global stability levels. This analysis approach provides a holistic understanding of the characteristics of renewable energy trade relations along the BRI. By considering these diverse scales, the study offers a comprehensive examination of trade dynamics and their implications.
The remainder of the paper is organized as follows:
Section 2 introduces the construction of the coopetition signed network and elaborates on the topological structure indicators.
Section 3 provides an overview of the data selection process.
Section 4 presents the empirical analysis conducted in this study.
Section 5 discusses the results. Finally,
Section 6 concludes the study.
2. Materials and Methods
2.1. Coopetition Signed Network
Originally, research on signed networks was predominantly concentrated in the field of sociology. As early as the 1940s, Heider explored the interaction patterns of positive and negative relationships in triangular relationships involving individuals as cognitive subjects [
25]. Subsequently, scholars such as Cartwright and Harary [
26] described and expanded upon these patterns using graph theory. Since then, the focus has primarily been on studying the structure and evolution of signed networks, with dedicated efforts to understand and uncover factional structures and patterns of development within social groups. Signed networks encompass networks that incorporate positive or negative signed attributes. Positive and negative edges represent positive and negative relationships, respectively. These opposing relationships are observed in numerous complex systems across multiple sectors, including information, biological, and social networks [
27].
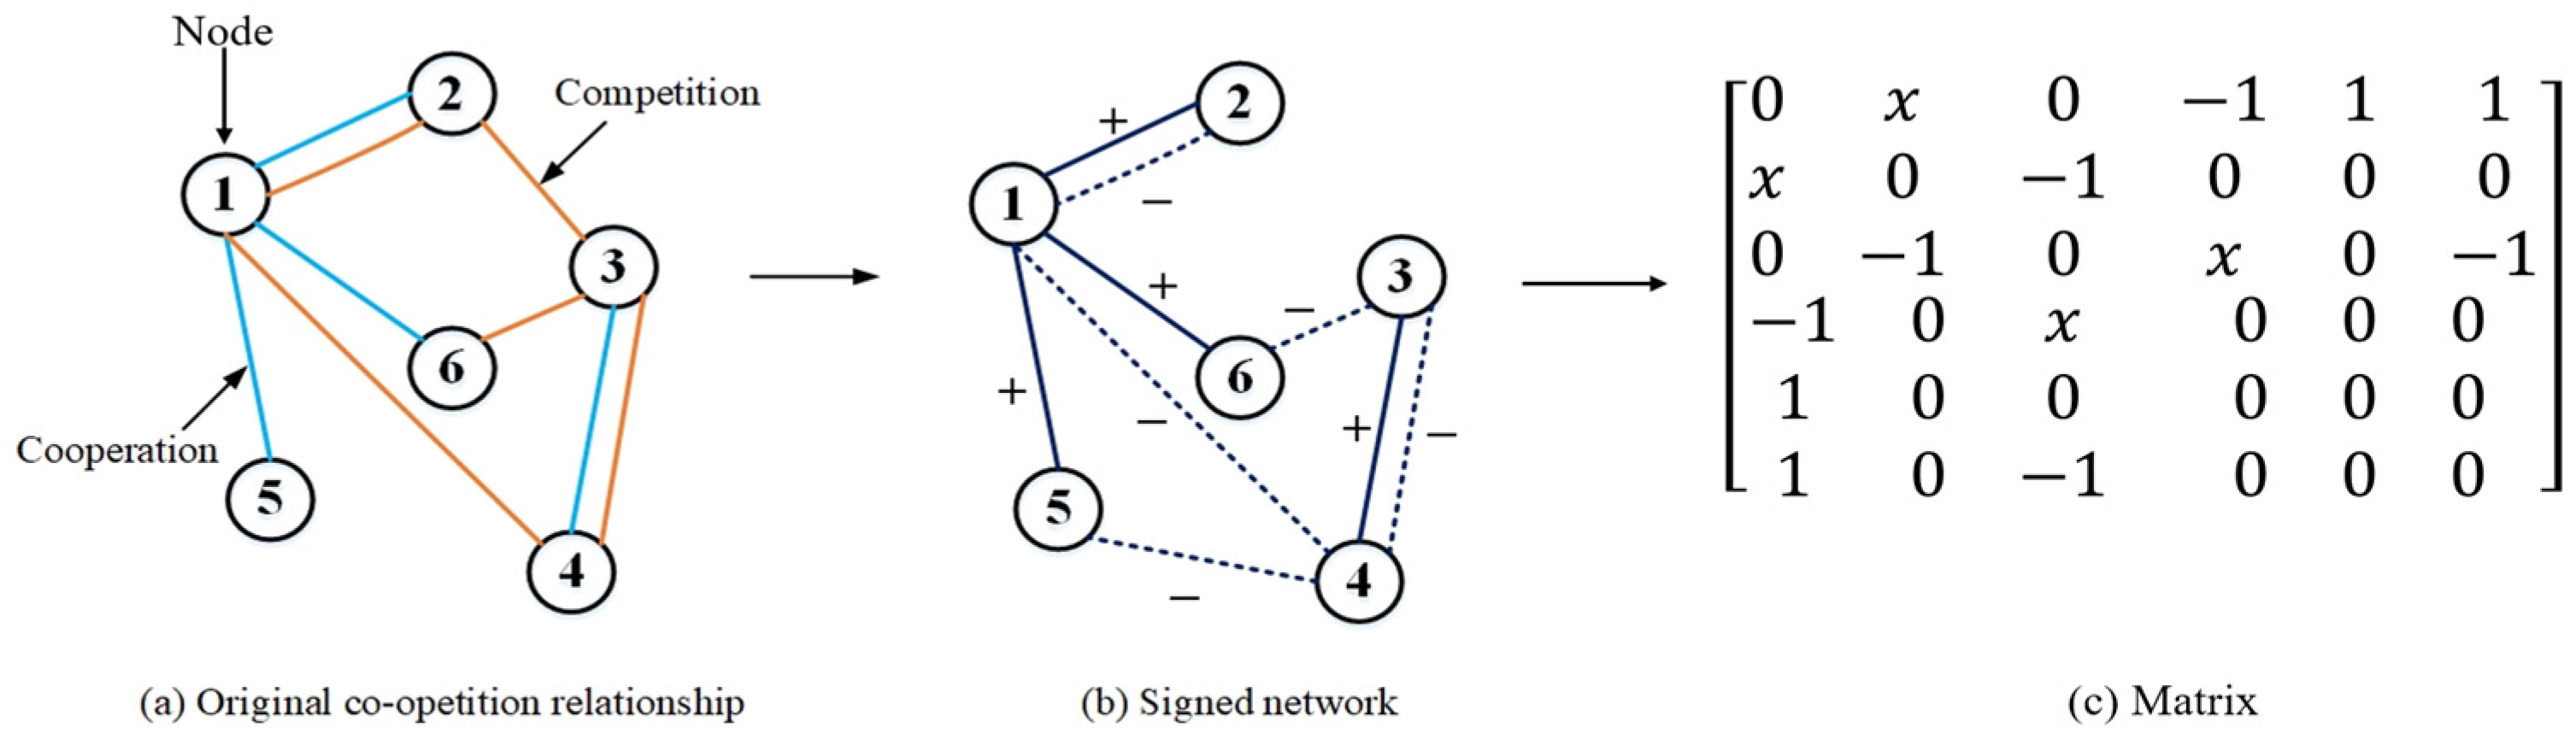
In this study, cooperative and competitive relationships are utilized to depict positive and negative edges among countries, enabling the construction of a signed network with countries as nodes.
Figure 1 illustrates a signed network with six nodes, displaying four distinct edge behavior patterns: positive, negative, mixed positive vs. negative, and disconnection. Let
denote a signed network, where
represents the set of nodes and
represents the set of edges between nodes. The edge relation between node
and
is denoted as
, where
. Therefore, the value of
can have four possible relationships, defined as follows:
If
, the sign of the link between node
and node
is referred to as positive. If
, the sign of the link between node
and node
is referred to as negative. In cases where there is both cooperation and competition between two nodes, this type of edge is defined as a contradictory edge, denoted by
. The matrix representing the coopetition signed network is illustrated in
Figure 1c.
In this study, the measurement of competition and cooperation primarily relies on the Export Similarity Index (ESI) and Trade Complementarity Index (TCI), as outlined in reference [
6]. The ESI assesses the trade competency of a product by analyzing the level of similarity in the composition of exported products. It takes into consideration factors such as export diversification, trade structure, and trade scale, which are widely adopted in the field of international trade [
28,
29,
30]. On the other hand, the TCI quantifies the compatibility between a country’s imports and the exports of another nation [
31,
32]. It considers various factors, including trade structure, trade scale, and revealed comparative advantage (RCA), in its evaluation. These indices provide valuable insights into the level of competition and cooperation between countries in terms of their trade relationships.
2.2. Indicators
When conducting a topological analysis of networks, it is common to approach it from three levels: node, local, and global scales [
33,
34,
35]. This pattern also applies to signed networks. At the node scale, the main focus is on measuring the characteristics of individual nodes or edges. This involves examining properties such as node centrality and connectivity. In terms of the local scale, research efforts primarily revolve around identifying community structures. On the global scale, the emphasis is primarily on determining whether the network is balanced or unbalanced and quantifying the degree of network imbalance. This entails evaluating the overall distribution of positive and negative relationships within the network and assessing whether there is a prevailing tendency towards cooperation or competition. Therefore, in this study, the following indicators will be utilized to identify the features and evolution of the constructed network, considering these different levels of analysis.
2.2.1. Node Degree Features
The characteristics of the nodes in the signed network include the positive degree ratio
, negative degree ratio
and contradictory degree ratio
.
and
represent the proportion of the number of pure cooperative and competitive links of node
to all its neighbors, respectively. Similarly,
is the proportion of the number of contradictory edges of node
to all its neighbors. These three ratios satisfy the equation
. The formulas for calculating these ratios are as follows:
where
,
, and
represent the number of pure cooperative relations, pure competitive relations, and contradictory relations connected to node
, respectively. They are also known as the positive degree, negative degree, and contradictory degree. When
is fixed, a higher
value indicates a smaller
value for a node and vice versa.
2.2.2. Density, Clustering Coefficient, and Community
(1) Network density. Density is a measure of the tightness of relationships among the nodes in a network [
36]. A higher density indicates closer connections between all nodes in the network. The network density is defined as follows:
where
represents the number of nodes in the network, and
represents the number of edges. By calculating the ratio of twice the number of edges to the maximum possible number of edges, we obtain the network density.
(2) Clustering coefficient. The clustering coefficient is used to describe the connectivity and transitivity between nodes in the network, reflecting the local connectivity efficiency [
37]. The clustering coefficient is the ratio of the true number of edges incident to a node to the number of edges that may exist in the ideal case. The average clustering coefficient of the entire network is defined as follows:
where
is the real number of edges between the neighbor nodes of node
.
represents the total relationships for node
.
(3) Community structure. Community structure refers to the observation that certain groups of nodes in empirical networks are densely interconnected, forming distinct clusters or communities. Identifying and analyzing these communities is a crucial aspect of network analysis. One commonly used measure for community detection is modularity (
), which assesses the quality of the partitioning [
38,
39]. A higher modularity value indicates a stronger degree of community structure in the network, while a lower value implies less evident differentiation among communities. Typically, a modularity value greater than 0.3 is considered to indicate a significant community structure in the network. For undirected weighted networks, modularity is calculated using the following formula:
where
represents the weight of the edge between node
and node
. In this paper, the edge weight
is set to 1.
and
denote the node strength of node
and
, respectively, and they satisfy
,
, and
.
represents the community to which node
belongs. When
, the Kronecker delta function
; otherwise,
.
2.2.3. Local and Global Balance
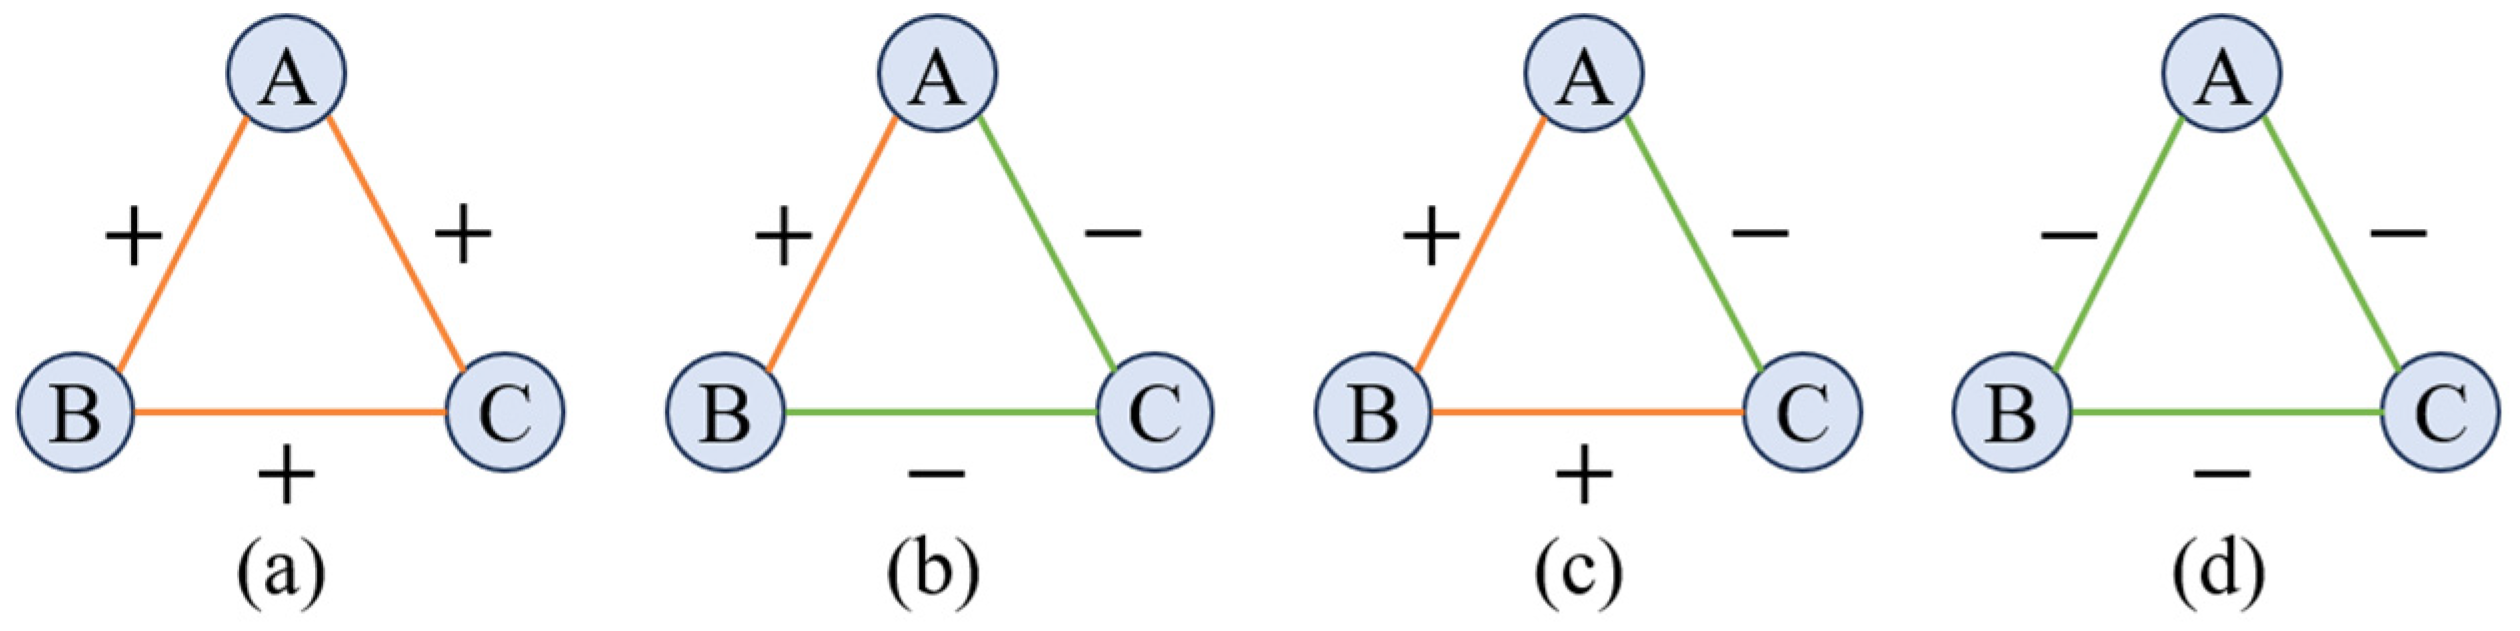
The structural balance theory revolves around the analysis of balance within triangles in a network. In a signed network, the relationships within symbolic triangles can be classified into four patterns, as illustrated in
Figure 2. The first two triangles (
Figure 2a,b) are considered structurally balanced, while the last two triangles (
Figure 2c,d) are considered structurally unbalanced. To quantify the global balance of a signed network, this study utilizes the ratio of balanced triangles [
24,
40] as a measure of the overall balance within the renewable energy trade coopetition system among countries along the route. This ratio is denoted as
and is calculated as follows:
where
represents the number of balanced triangles in the network, and
represents the total number of triangles in the network.
3. Data
This study focuses on four key renewable energy sectors: solar (HS: 841919, 854140, and 850239); wind (HS: 841290, 850231, 850164, 850300, and 730820); hydro (HS: 841011, 841012, 841013, and 841090); and biomass (HS: 220710, 220720, 440110, 440130, and 440200). The analysis covers the period from 2013 to 2020. The selected subproducts and their respective HS codes are based on the research conducted by Gao et al. (2023) [
7]. The data used in the study are obtained from the United Nations Commodity Trade Statistics Database (UN COMTRADE). Palestine was not included in the analysis, as it does not participate in renewable energy trade. As a result, a total of 65 BRI countries were included in the analysis. It is important to note that the dataset concludes in the year 2020 due to the impact of the COVID-19 pandemic.
4. Results
4.1. The Dynamic of Competition–Cooperation Relations
Figure 3 illustrates the number and proportion of links representing pure competition, pure cooperation, and coopetition relations in the renewable energy trade system among the BRI countries from 2013 to 2020. The predominant trend observed is pure cooperation, accounting for over 78% of the relations. Coopetition follows, representing more than 8%, while pure competition makes up less than 8%. In the initial years of the BRI, pure cooperative relations dominated, constituting 85% of the total relations, significantly surpassing the proportions of coopetition relations (8%) and pure competition relations (6%). This indicates a cooperation-oriented system. One year after the initiative was launched, there was a notable decline in pure competition relations, particularly in Southeast Asian. This decline was accompanied by a 40% increase in the count of pure cooperation relations and a 3% increase in their proportion. These changes suggest the emergence of new cooperation ties facilitated by the BRI initiative.
The BRI is seen to promote and enhance renewable energy trade cooperation among participating countries. However, it also introduces concurrent competition, leading to a continuous rise in the proportion of coopetition relationships. Notably, since 2018, there has been a decrease in cooperative relations, resulting in an increase in the proportion of coopetition relations from 11% to 15% in 2020. This change suggests that a significant portion (almost 10%) of previous cooperative relationships has transformed into competitive or coopetition status.
In summary, the BRI fosters cooperation in renewable energy trade among countries along the route. However, as the initiative progresses, new trade dynamics are emerging, characterized by a growing prevalence of coopetition, where competition and cooperation coexist, among the BRI countries. This significant increase in coopetition relationships has drawn attention.
4.2. Country Analysis
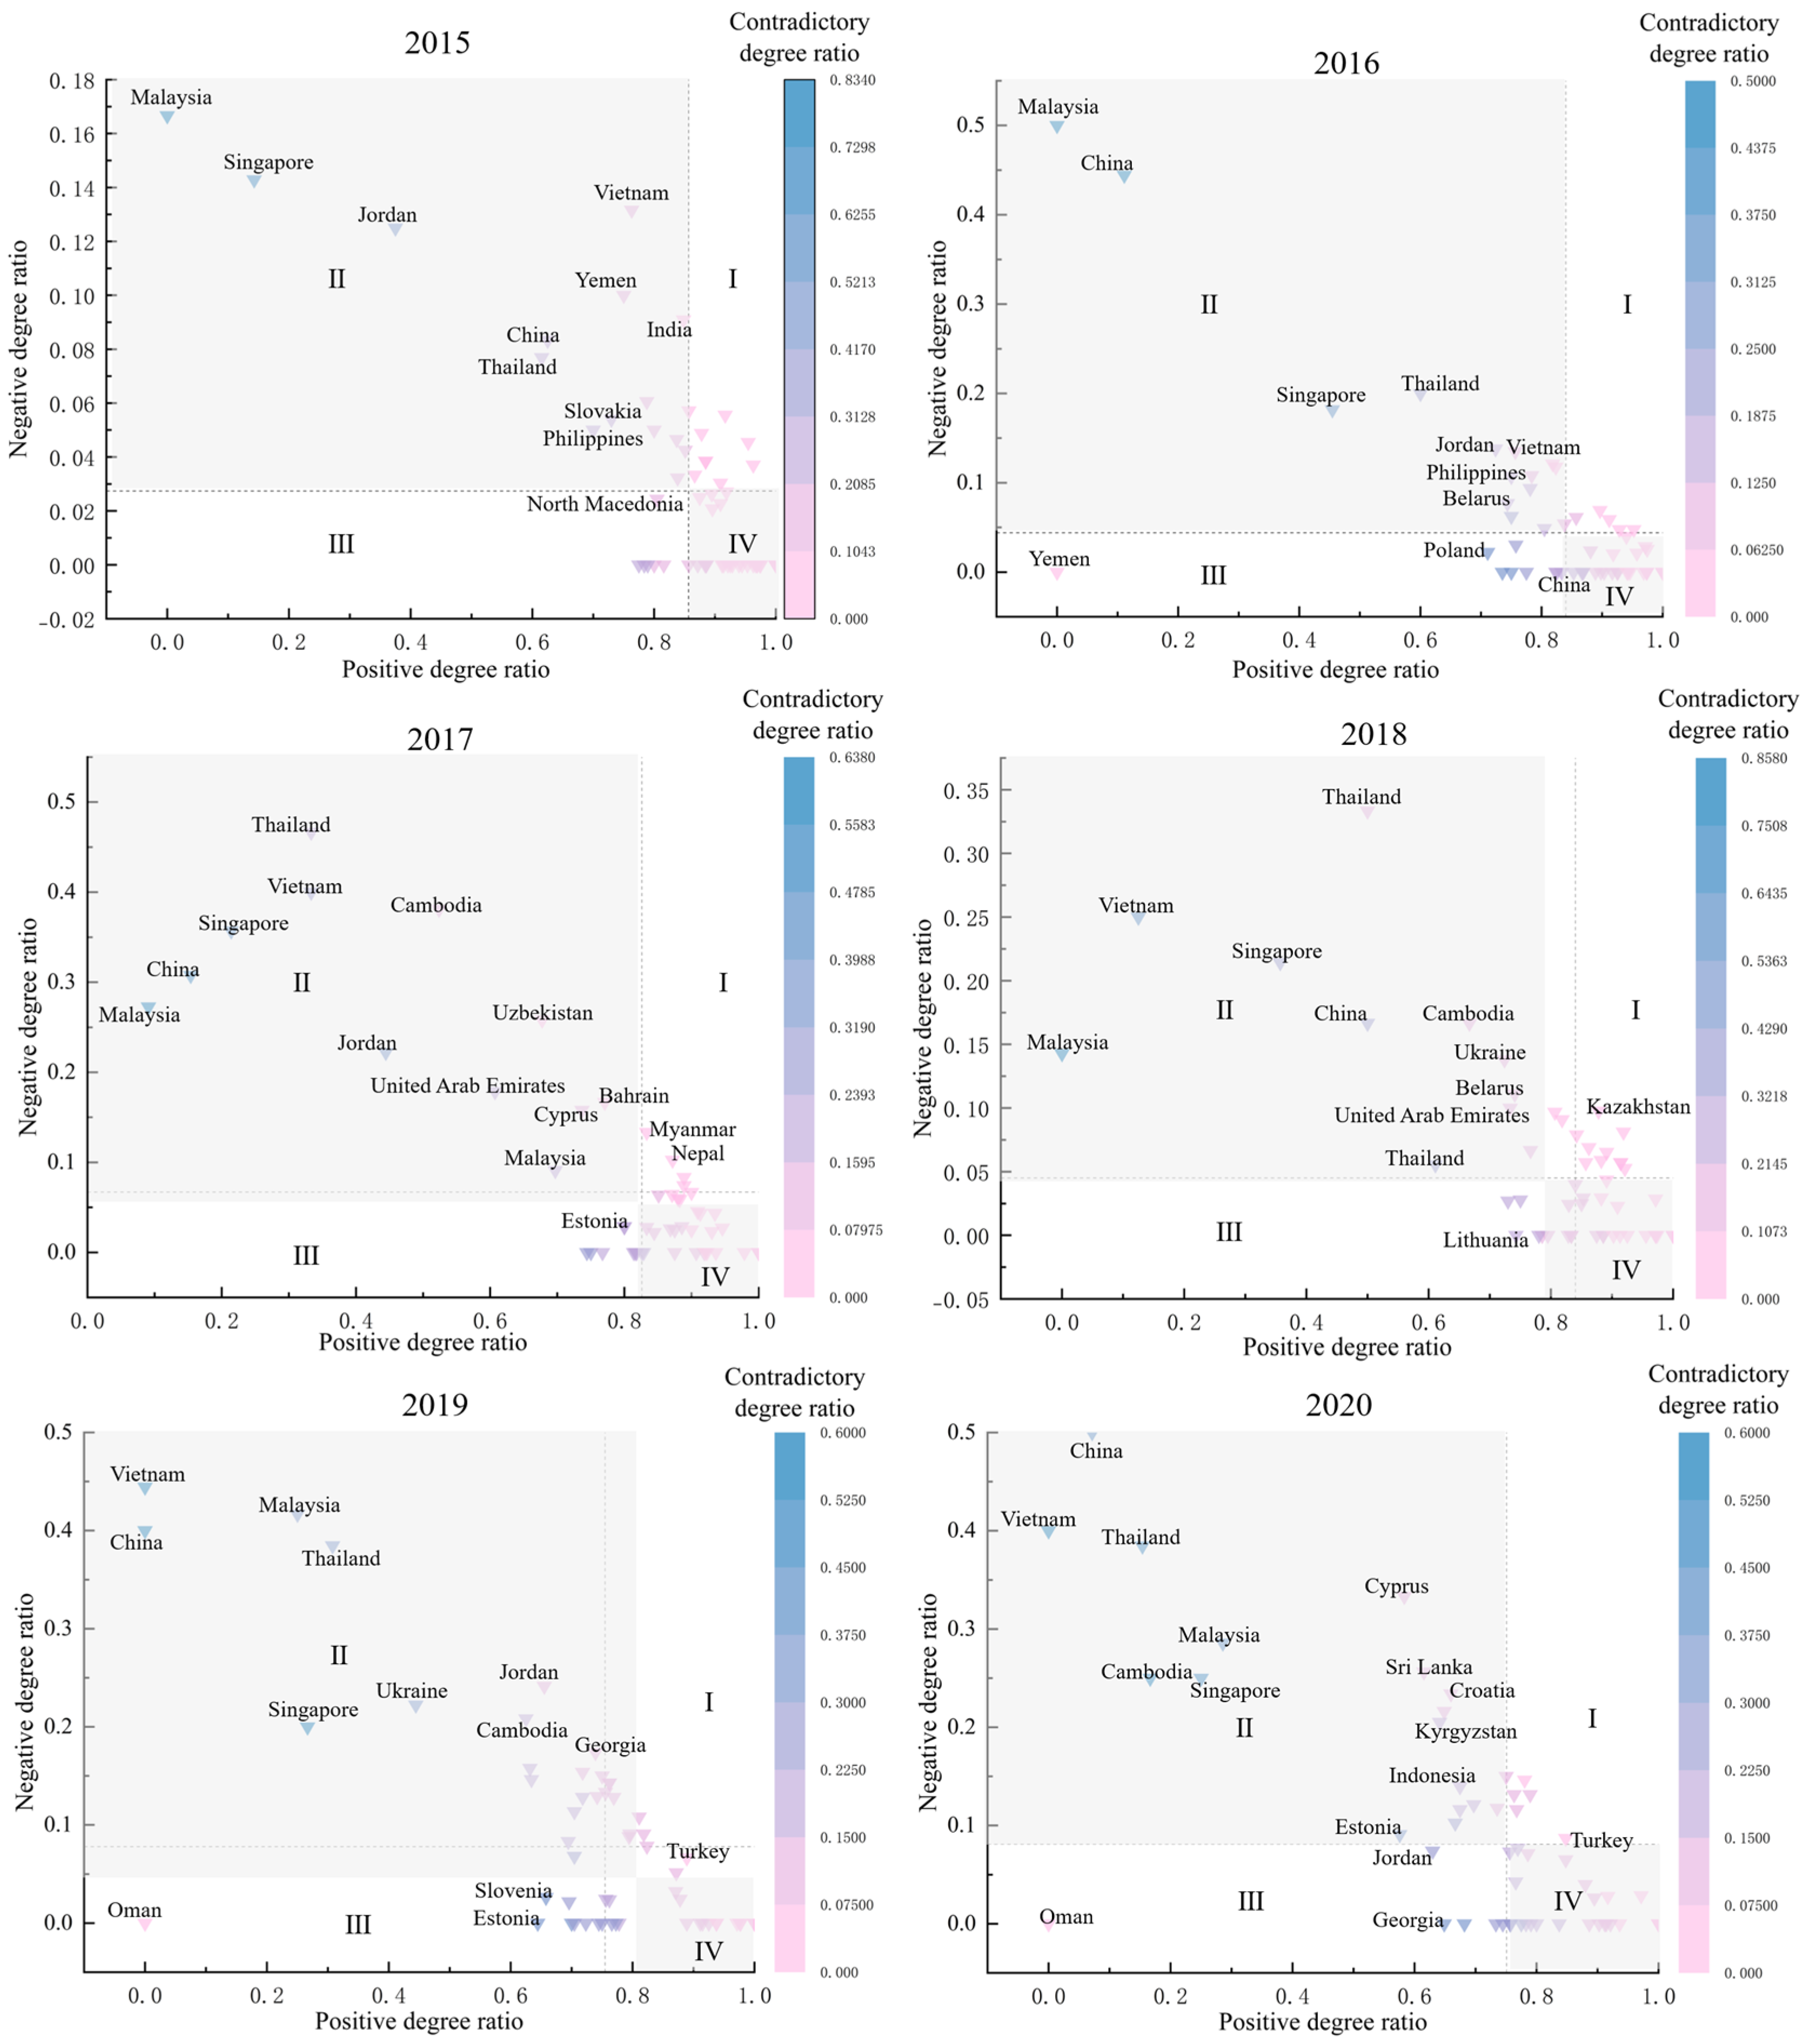
Figure 4 illustrates the distribution of
,
, and
for each country. The dashed lines represent the mean values and divide the figure into four quadrants: quadrants I–IV. From
Figure 4, it is evident that the symbols with darker colors are primarily concentrated in quadrant II and quadrant III, with quadrant II showing a particularly significant presence. This indicates that these countries exhibit less pure cooperation and more complex coopetition. Notably, China, Singapore, and Malaysia have consistently maintained a high level of coopetition relationship throughout the entire study period. This suggests a complex dynamic of competition and cooperation between these three countries and other countries along the BRI. Similarly, by 2020, Cambodia, Vietnam, and Thailand demonstrated similar multifaceted coopetition dynamics. Indeed, renewable energy competition is prevalent among the BRI countries due to shared objectives and interests. The global focus on environmental conservation and sustainable development drives the development and utilization of renewable energy, with countries seeking market dominance and technological superiority. However, the BRI also provides a valuable platform to enhance cooperation in renewable energy through technical exchanges, project collaborations, and more. Such collaboration promotes advancements in renewable energy technologies and industries. Taking China, India, and Sri Lanka as examples, each country possesses unique strengths. Sri Lanka boasts abundant natural resources, particularly in solar and wind energy, while China and India demonstrate robust technical and industrial capabilities in these fields. Through collaboration with countries like China and India, Sri Lanka can fully leverage its resource advantages to develop and utilize renewable energy. Such cooperation contributes to enhancing Sri Lanka’s energy supply stability, reducing energy costs, fostering economic development, and decreasing reliance on traditional energy sources.
From China’s perspective, renewable energy trade with BRI countries exhibits characteristics of pure cooperation or coopetition, indicating that China and other BRI countries have maintained a mutually beneficial cooperative relationship. This can be largely attributed to China’s dominant position in global clean energy technology and production. As a leading developer of solar panels, wind turbines, and other renewable energy products, China engages in extensive collaboration with over a hundred countries. This drives international exchange and cooperation in clean energy technology, providing strong support for China’s renewable energy trade with countries along the route. For instance, Chinese enterprises are actively engaged in solar and wind energy projects in India, providing technical expertise and financial support to strengthen India’s renewable energy initiatives. At the same time, collaborative efforts between China and Kazakhstan are driving the development of various solar and wind energy projects. This partnership aims to utilize Kazakhstan’s abundant resources to meet China’s growing energy demands. These ventures not only promote energy collaboration but also contribute to local economic growth by creating employment opportunities and facilitating technology transfer.
4.3. Local and Cluster Analyses
Table 1 illustrates the topological structure of the coopetition signed network. In this network, only contradictory edges are considered, excluding pure competitive and pure cooperative relations. The table reveals several noteworthy trends. Firstly, the number of edges and the network density show an upward trend, while the number of nodes remains relatively stable. Simultaneously, the consistent annual rise in network density suggests a growing level of interconnectedness between nations, driving the transformation from decentralized coopetition entities to more centralized ones. Secondly, the clustering coefficient exhibits a continuous upward trend over the years, indicating the gradual development of the coopetition network into a hierarchically structured network. Thirdly, the BRI countries have formed distinct communities characterized by stable and frequent competition and cooperation among their members. Notably, the modularity reached its peak at 0.701 in 2013, suggesting that the communalization aspect of the BRI was most prominent during that year. This can be attributed to the initial phase of the initiative when nations along the route prioritized trade with their traditional partners, resulting in a more centralized pattern of commerce.
Figure 5 depicts the coopetition networks and their communities. The size of each node represents the average degree of the country, with larger nodes indicating a higher number of coopetition relations with the node’s neighbors. The links between nodes indicate the presence of a coopetition relationship between two countries. Based on
Figure 5, it is evident that the formation of clusters is significantly influenced by regional geographical proximity, with limited coopetition connections across different groups. The figure also shows a decrease in the number of coopetition groups from six in 2013 to five in 2020, with countries within these groups demonstrating relative stability. Notably, from 2013 to 2015, several countries functioned as “explorers” and displayed group mobility. For example, Poland moved from a Lithuanian-led coopetition group to establish its own group with Slovenia in 2015. Thailand and Slovakia underwent a similar transition. In contrast, the years 2018 and 2020 witnessed a higher degree of stability in these groups, with limited movement observed. Analyzing China’s coopetition interaction, it formed a group with Malaysia, Singapore, and Cyprus in 2013, maintaining a consistent and stable competition and cooperation relationship over the years. The membership of this group expanded from four countries in 2013 to ten in 2020, exhibiting low mobility and fostering steady and frequent interactions. Only two countries, the Philippines and the United Arab Emirates, exited the group in 2018 and 2020.
4.4. Global Stability Analysis
In this study, the constructed signed networks revealed ten types of subgraphs, as presented in
Table 2. Within each subgraph, different types of relationships between countries are represented by different colored edges: black for cooperation, green for competition, and red for coopetition. Cooperation is considered a positive relationship, competition is viewed as a negative relationship, and coopetition encompasses both positive and negative aspects. Let us consider the ID3 subgraph as an example. If the red edges are interpreted as a positive relationship, then the ID3 subgraph is regarded as being in a state of structural balance. Conversely, if the red edges are seen as a negative relationship, then the ID3 subgraph is considered to be in an unbalanced state. Hence, the ID3 subgraph may be either balanced or unbalanced, ultimately being classified as an unbalanced state. Applying the theory of structural balance, the study classified ID1, ID4, ID8, and ID9 as balanced subgraphs, indicating a high level of stability in the relationships between these countries. Conversely, ID2, ID3, ID5, ID6, ID7, and ID10 were classified as unbalanced subgraphs, suggesting that the relationships in these subgraphs were more prone to change.
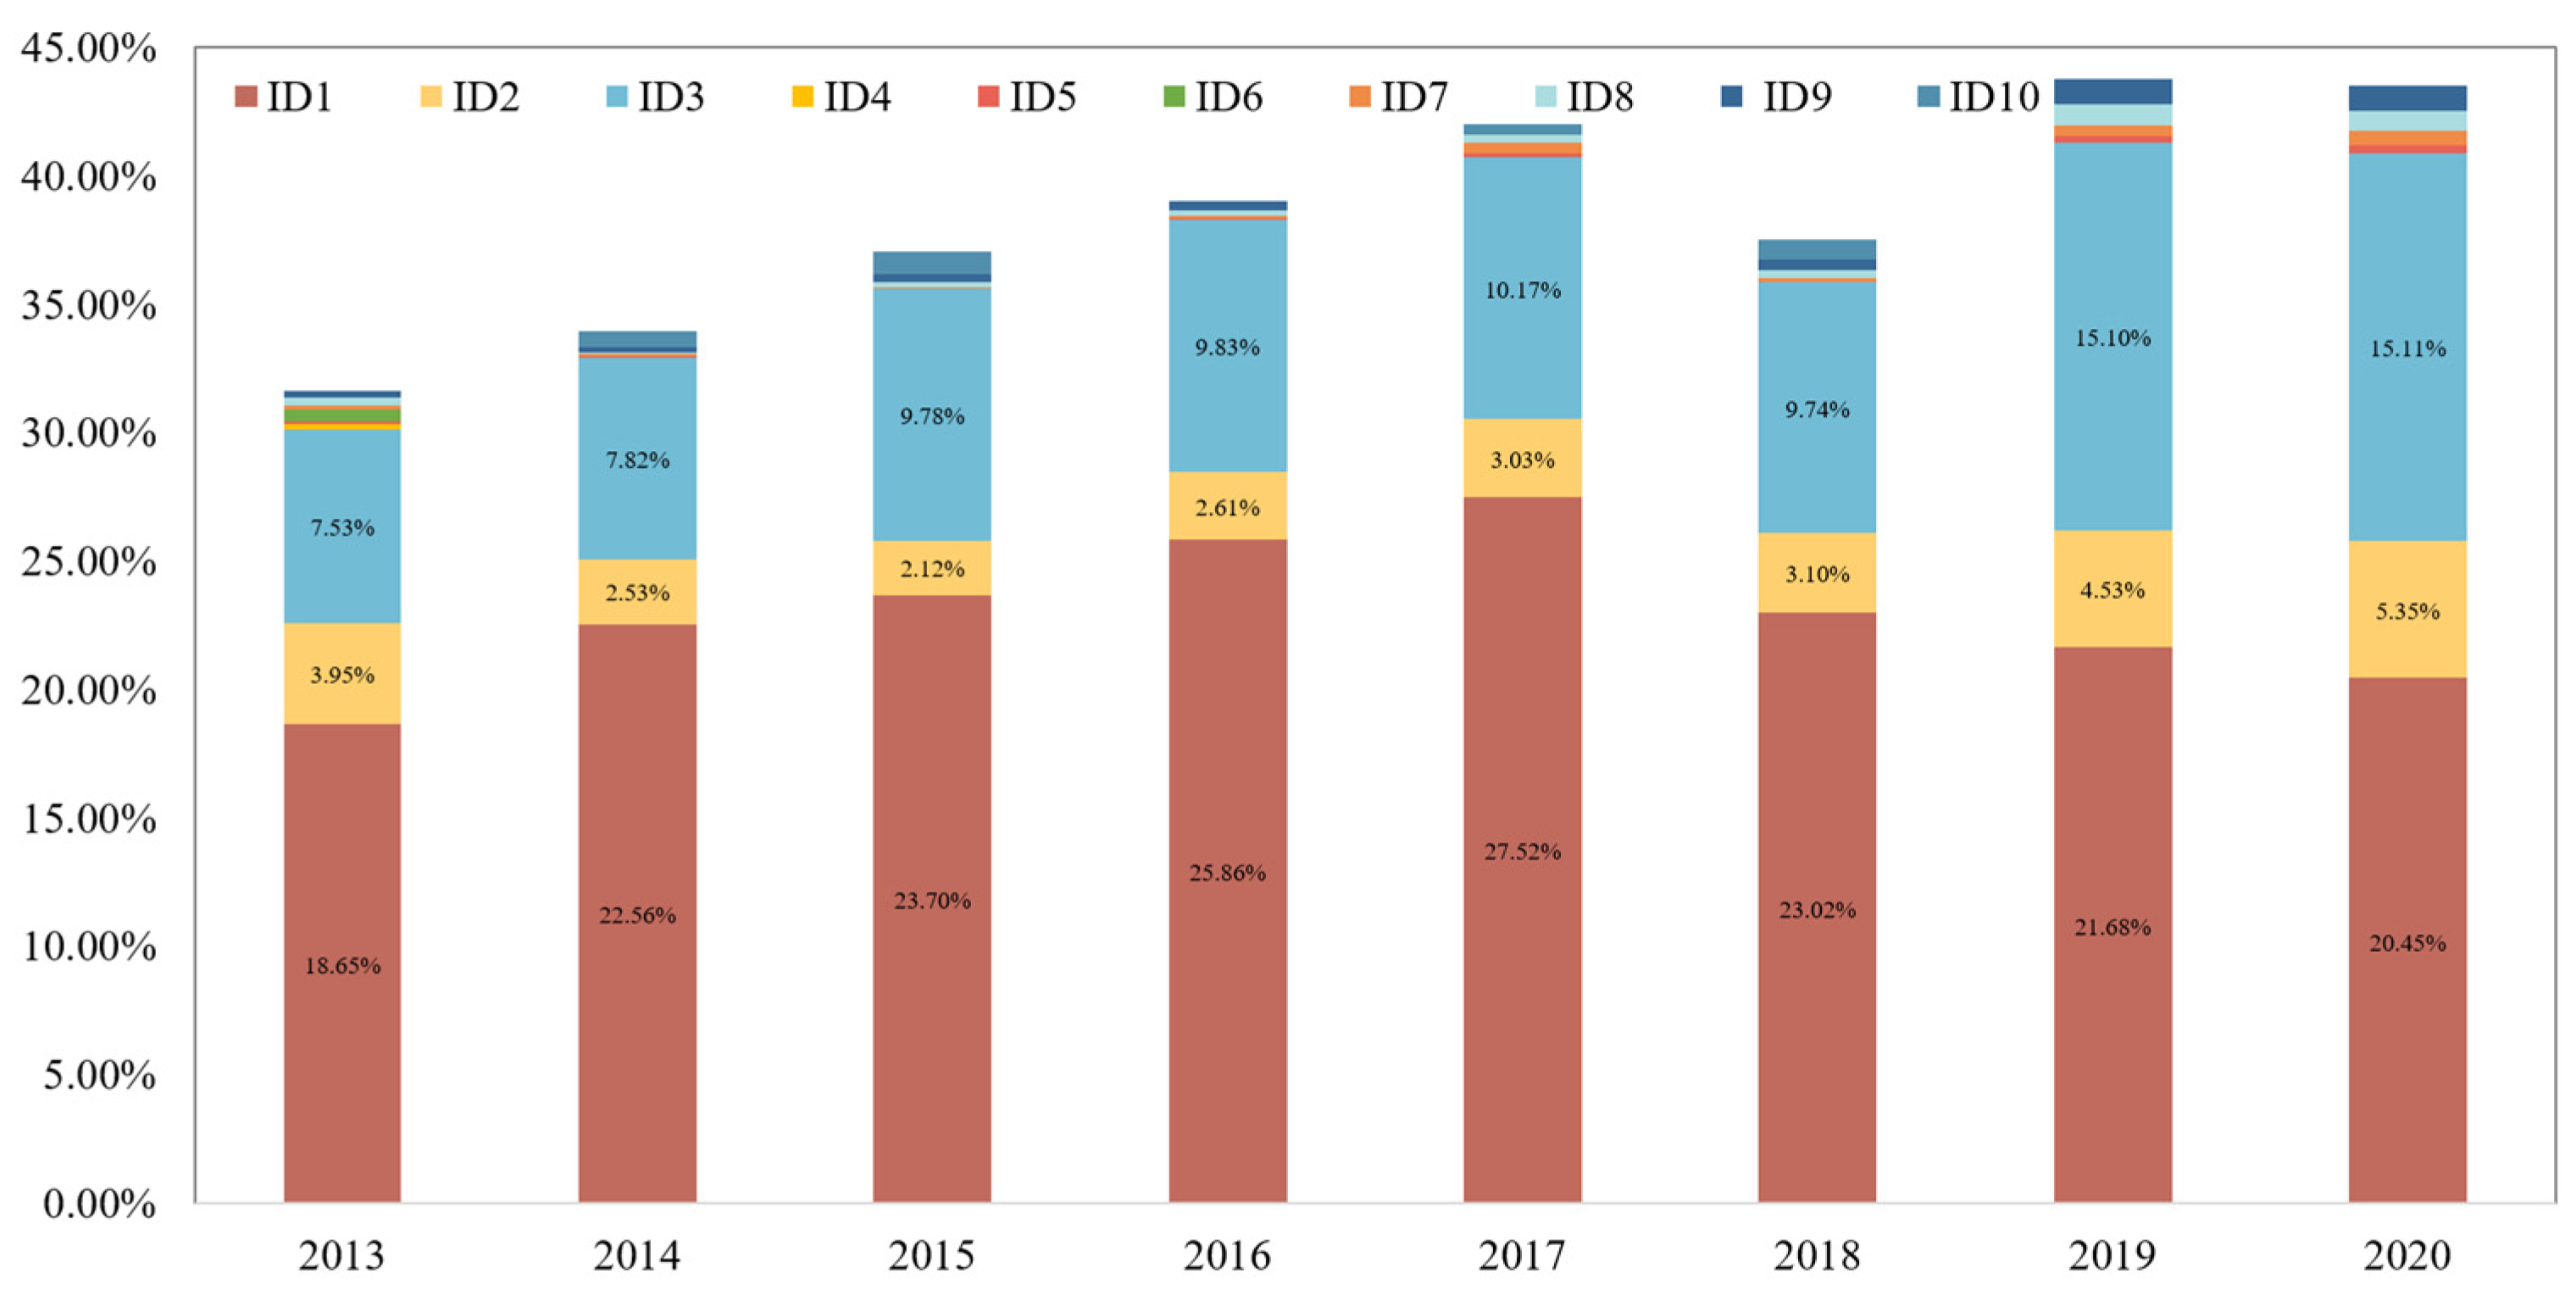
Figure 6 illustrates the changing proportions of the ten subgraphs. Overall, with the exception of 2018, the proportions of the subgraphs exhibit an increasing trend, indicating the significant impact of the BRI. Specifically, the proportions of ID1 and ID3 experienced substantial growth, from 18.65% and 7.53% in 2013 to 27.52% and 10.17% in 2017, respectively, highlighting the importance of these two subgraphs. However, in 2018, the proportions of these two subgraphs decreased, leading to an overall decline in the proportions of the subgraphs. In 2019 and 2020, the proportion of ID3 significantly increased again, reaching 15.11%, while ID2 also fluctuated upwards to 5.35%. It is worth noting that, despite the declining trend of ID1 after reaching its peak in 2017, its proportion remained high at 20.45% in 2020, making it the most common subgraph among them all. This indicates that ID1 and ID3 represent the most prevalent patterns of renewable energy trade relations among the BRI countries.
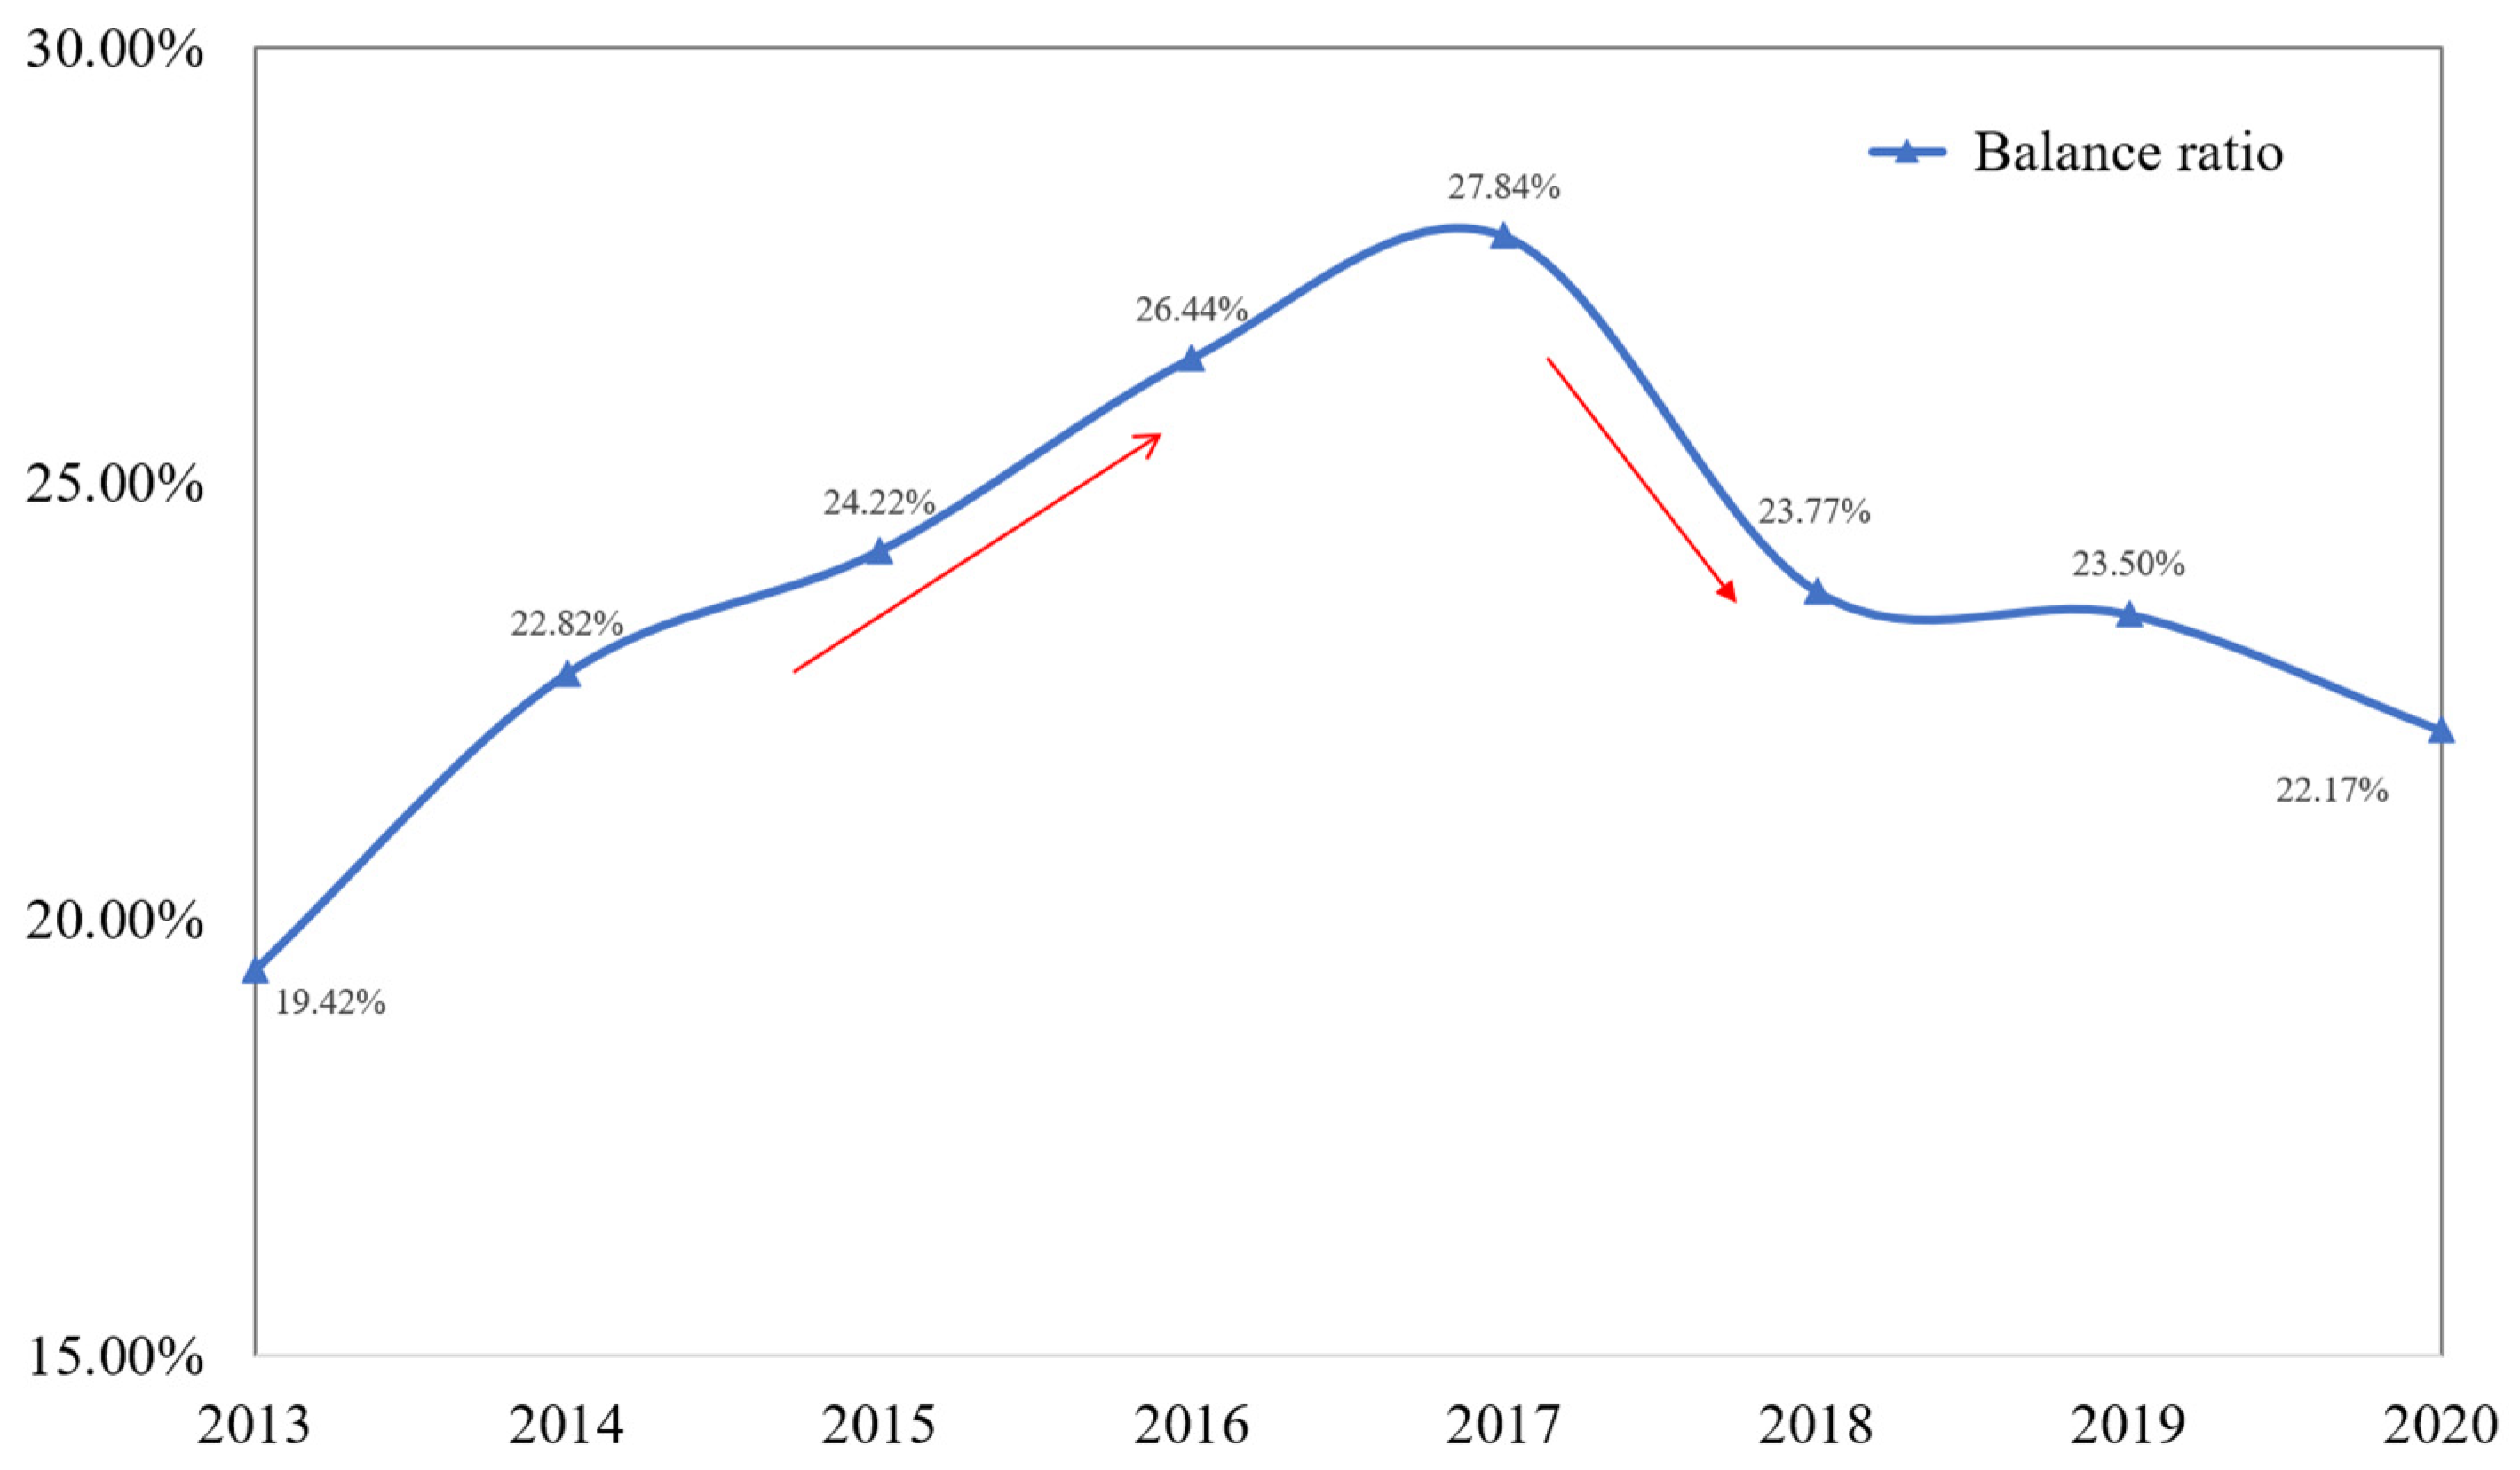
Figure 7 illustrates the upward trend in the global balanced rate since the inception of the BRI. The ratio peaked at 27.84% in 2017 and then gradually declined but remained at 22.17% in 2020, surpassing the level of the initiative’s proposal year. This suggests that the implementation of the BRI has fostered stability in trade relations among countries along the routes. However, starting from 2018, the balanced rate began to decrease, while the unbalanced rate saw an annual increase. This indicates that the stability of relations between countries has been somewhat affected. Furthermore,
Figure 6 provides additional insights into the evolution of the balanced and unbalanced subgraphs. The study reveals that the decline in the global balance rate is primarily due to the reduction in balanced subgraph ID1, coupled with an increase in unbalanced subgraphs ID2 and ID3, particularly ID3. This underscores the presence of contradictory edges between nodes, suggesting that the blend of cooperation and competition has increased uncertainty in trade relations between countries, thereby impacting their stability to some extent.
5. Discussion
To evaluate the trade dynamics in the renewable energy sector among BRI countries, a trade relationship-based symbol network was constructed. The research findings indicate that the BRI has effectively spurred cooperation among participating countries in renewable energy trade, which aligns with the conclusions drawn by scholars such as Liu et al. (2018) [
41] and Gao et al. (2023) [
7]. By taking Indonesia and Vietnam as examples, it can be observed that Indonesia, a major energy producer in Southeast Asia, and Vietnam, with vast potential in renewable energy development, have witnessed a growing closeness in their energy cooperation as the BRI progresses. This cooperation primarily revolves around technology transfer, project investments, and energy product trading. Along a similar vein, China has collaborated with countries like Pakistan, Egypt, and Bangladesh to develop projects such as the Karachi solar project, photovoltaic power initiatives, and hydroelectric plants.
However, as the BRI advances, new trade relationships are emerging that are characterized by a blend of competition and cooperation, forming patterns of “competitive cooperation” and “cooperative competition”. The concept of competitive cooperation refers to a situation where countries engage in a cooperative relationship while simultaneously competing with each other. On the other hand, cooperative competition refers to a situation where countries compete with each other while also maintaining a cooperative relationship. This perspective was also supported by Gao et al. (2023) [
7], who observed a rapid increase in the overall trade competitiveness of renewable energy products among the BRI countries over the past decade, alongside significant disparities between nations. Essentially, the inception of the BRI has witnessed a transition in renewable energy trade relations, shifting from primarily cooperative in its early stages to a combination of cooperation and competition.
It is noteworthy that the BRI has significantly bolstered the overall stability of trade among participating nations. However, the burgeoning coexistence of competition and cooperation also introduces uncertainty into intercountry trade dynamics. For instance, in Central Asia, countries like Kazakhstan and Kyrgyzstan possess abundant wind energy resources. While some collaborate on wind energy industry development, such as jointly initiating cross-border wind power projects and sharing technological and resource expertise, competition arises as nations strive to attract investments and capture market shares in the renewable energy sector. A similar dynamic is observed in the clean energy cooperation between China and Southeast Asian nations as part of the BRI. China’s expertise in renewable energy technology and investment aligns with Southeast Asia’s imperative to address increasing energy demands and tackle climate change. Amidst collaboration, both sides navigate market competition and geopolitical factors. In essence, while the BRI propels a surge in trade volume and interconnectedness among participating countries, the emergence of cooperative competition dynamics introduces new challenges to trade stability.
In summary, the BRI has successfully fostered cooperation and stability in renewable energy trade among participating countries. However, the emergence of coopetition dynamics presents new complexities and uncertainties. To ensure the continued stability and mutual benefits in trade relations along the BRI route, it is crucial to have a thorough understanding of these dynamic factors and navigate them adeptly.
6. Conclusions
Driven by the BRI, the trade of renewable energy products between countries along the route has witnessed consistent growth. However, the escalating trade disputes, referring to conflicts or disagreements between countries or regions regarding trade practices, policies, tariffs, or other trade-related issues, have had a profound impact on the competitive and collaborative dynamics in the region. This study aimed to examine the evolving pattern of trade relations between these nations by constructing a coopetition signed network model using trade data from 2013 to 2020 for four types of renewable energy products. This study draws the following conclusions:
First, BRI countries predominantly exhibit a cooperative relationship in renewable energy trade. However, there has been a noticeable trend towards coopetition, as reflected by a significant increase in contradictory edges within the coopetition network. This demonstrates a continuous intensification of coopetition among these countries. Simultaneously, the network structure has become more intricate and resilient, forming a frequent coexistence of “competitive cooperation” and “cooperative competition”.
Second, the formation of coopetition groups is closely linked to geographical location. Coopetition relationships tend to be relatively small between different groups and primarily concentrated within each group. Further analysis reveals that certain countries, such as China, Singapore, and Malaysia, exhibit complex patterns of competition and cooperation. They have formed diverse coopetition situations with other countries along the route. China initially formed a coopetition group with Malaysia, Singapore, and Cyprus during the early stages of the initiative. This group has expanded in scale and is characterized by high inflow and low outflow.
Third, the implementation of the BRI has significantly enhanced the overall stability of trade between countries along the route. However, there is a correlation between the decrease in global balance and the emergence of contradictory edges. The increase in contradictory edges between nodes introduces uncertainty to coopetition relationships between countries, thereby impacting the stability of trade relations to some extent.
Based on the aforementioned findings, trade policies aimed at promoting renewables along the BRI should take into account the coopetition relationships among countries.
(1) Countries with diverse coopetition dynamics should enhance their competitiveness and strengthen their cooperation. They should prioritize technology innovation and optimize their industrial structure to improve their competitive link in renewable energy trade. For instance, China and Malaysia have successfully collaborated on various renewable energy projects, such as the Malacca photovoltaic power station and the Senmeilan solar power plant. These initiatives not only enhance the efficiency of renewable energy utilization and reduce reliance on traditional energy but also yield economic and environmental benefits for countries along the route.
(2) As the initiator and advocate of the BRI, China should actively engage in communication and negotiation with other nations along the route to address concerns related to renewable energy trade. This entails fostering mutual trust, deepening understanding, and collaboratively managing potential trade conflicts and disputes. Additionally, China should increase investments in advanced technology research and development to enhance its technical competitiveness in the field of renewable energy.
(3) Given that coopetition dynamics can impact the stability and balance of renewable energy trade relations among BRI countries, it is crucial to closely monitor the real-time dynamics of coopetition relationships during the trade development process. It is recommended to establish a systematic monitoring and evaluation mechanism for coopetition relationships. This mechanism should involve a periodic in-depth analysis of contradictory edges between nodes and the timely identification of risk factors that may introduce uncertainty. Through flexible policy adjustments and the optimization of network structures, the stability of trade relations can be consolidated and enhanced, ensuring a healthy and sustainable development of renewable energy trade along the BRI.
Author Contributions
Methodology, Writing—original draft, and Software, Y.X.; Data curation, Visualization, and Writing—original draft, Z.J.; Writing—original draft, Investigation, and Software, C.J.; Writing—review and editing, W.X.; Conceptualization, Writing—review and editing, and Funding acquisition, C.G. All authors have read and agreed to the published version of the manuscript.
Funding
This work was partially supported by the Postgraduate Research & Practice Innovation Program of Jiangsu Province, grant number KYCX23_3749, the National Natural Science Foundation of China, grant number 72243005, and the Special Science for Carbon Peak and Carbon Neutralization of Jiangsu Province, grant number BE2022612.
Data Availability Statement
Conflicts of Interest
The authors declare no conflicts of interest. The funders had no role in the design of the study; in the collection, analyses, or interpretation of the data; in the writing of the manuscript; or in the decision to publish the results.
References
- Ucler, G.; Inglesi-Lotz, R.; Topalli, N. Exploring the potential of the belt and road initiative as a gateway for renewable energy in diverse economies. Environ. Sci. Pollut. Res. 2023, 30, 101725–101743. [Google Scholar] [CrossRef]
- Wang, Q.; Zhang, F. Free trade and renewable energy: A cross-income levels empirical investigation using two trade openness measures. Renew. Energy 2021, 168, 1027–1039. [Google Scholar] [CrossRef]
- China Energy Media Energy Security New Strategy Research Institute. The Belt and Road Energy International Cooperation Report (2023). Available online: https://www.cpnn.com.cn/news/baogao2023/202309/t20230922_1637305_wap.html (accessed on 23 September 2023). (In Chinese).
- Murshed, M. Can regional trade integration facilitate renewable energy transition to ensure energy sustainability in South Asia? Energy Rep. 2021, 7, 808–821. [Google Scholar] [CrossRef]
- Shuai, J.; Leng, Z.; Cheng, J.; Shi, Z. China’s renewable energy trade potential in the “Belt-and-Road” countries: A gravity model analysis. Renew. Energy 2020, 161, 1025–1035. [Google Scholar] [CrossRef]
- Scholten, D.; Bazilian, M.; Overland, I.; Westphal, K. The geopolitics of renewables: New board, new game. Energy Policy 2020, 138, 111059. [Google Scholar] [CrossRef]
- Gao, C.; Tao, S.; Su, B.; Mensah, I.; Sun, M. Exploring renewable energy trade coopetition relationships: Evidence from belt and road countries, 1996–2018. Renew. Energy 2023, 196–209. [Google Scholar] [CrossRef]
- Jebli, M.; Youssef, S. Output, renewable and non-renewable energy consumption and international trade: Evidence from a panel of 69 countries. Renew. Energy 2015, 83, 799–808. [Google Scholar] [CrossRef]
- Guo, Q.; Mai, Z. China’s Potential for Trade in Renewable Energy Products in RCEP Countries: A Gravity Model Analysis. Int. J. Energy Res. 2023, 2023, 1530969. [Google Scholar] [CrossRef]
- Fu, X.; Yang, Y.; Dong, W.; Wang, C.; Liu, Y. Spatial structure, inequality and trading community of renewable energy networks: A comparative study of solar and hydro energy product trades. Energy Policy 2017, 106, 22–31. [Google Scholar] [CrossRef]
- Zhao, Y.; Shuai, J.; Shi, Y.; Lu, Y.; Zhang, Z. Exploring the co-opetition mechanism of renewable energy trade between China and the “Belt and Road” countries: A dynamic game approach. Renew. Energy 2022, 191, 998–1008. [Google Scholar] [CrossRef]
- Li, S.; Chang, Y. Legal issues regarding energy market integration in Northeast Asia. Energy Strategy Rev. 2021, 38, 100700. [Google Scholar] [CrossRef]
- Wang, C.; Huang, X.; Hu, X. Trade characteristics, competition patterns and COVID-19 related shock propagation in the global solar photovoltaic cell trade. Appl. Energy 2021, 290, 116744. [Google Scholar] [CrossRef]
- Zhao, S. The construction of China’s energy international cooperation mechanism—Based on the perspective of the ‘Belt and Road’. Nat. Resour. Econ. China 2023, 36, 47–55. [Google Scholar] [CrossRef]
- Zhang, D. Discussion on the construction of energy cooperation mechanism under the Belt and Road initiative based on the changes in global energy landscape. Int. Econ. Trade Res. 2023, 39, 106–120. (In Chinese) [Google Scholar] [CrossRef]
- Zhang, H.; Ji, Q.; Fan, Y. Competition, transmission and pattern evolution: A network analysis of global oil trade. Energy Policy 2014, 73, 312–322. [Google Scholar] [CrossRef]
- Zhu, B.; Liu, J.; Lin, R.; Chevallier, J. Cross-border systemic risk spillovers in the global oil system: Does the oil trade pattern matter? Energy Econ. 2021, 101, 105395. [Google Scholar] [CrossRef]
- Chen, B.; Xu, H.; Feng, L. Structural properties and evolution of global photovoltaic industry trade network. Environ. Sci. Pollut. Res. 2023, 30, 69580–69598. [Google Scholar] [CrossRef]
- Chen, J.; Luo, Q.; Sun, X.; Zhang, Z.; Dong, X. The impact of renewable energy consumption on lithium trade patterns: An industrial chain perspective. Resour. Policy 2023, 85, 103837. [Google Scholar] [CrossRef]
- Chong, Z.; Jiang, X.; He, Z. Research on the network dependence characteristics and substitution in international trade: Fossil energy and renewable energy. Geogr. Res. 2022, 41, 3214–3228. [Google Scholar] [CrossRef]
- Qi, W.; Xiong, H.; Peng, X. How to Promote International Competitiveness of China’s Renewable Energy Products?—Based on SNA Theory. Pol. J. Environ. Stud. 2021, 30, 4163–4175. [Google Scholar] [CrossRef] [PubMed]
- Gao, C.; Zhu, M.; Sun, M.; Gao, A. Uncovering the trade-induced air pollution inequality among Belt and Road Initiative (BRI) countries. J. Clean. Prod. 2023, 411, 137283. [Google Scholar] [CrossRef]
- Li, Z.; Ma, G.; Lei, Z. Study on the stability of the ‘Belt and Road’ energy trade cooperation network. Coal Econ. Res. 2019, 39, 70–78. (In Chinese) [Google Scholar] [CrossRef]
- Cheng, S.; Shen, H.; Zhang, G.; Cheng, X. Survey of signed network research. J. Softw. 2014, 25, 1–15. (In Chinese) [Google Scholar] [CrossRef]
- Heider, F. Attitudes and cognitive organization. J. Psychol. 1946, 21, 107–112. [Google Scholar] [CrossRef]
- Cartwright, D.; Harary, F. Structural balance: A generalization of Heider’s theory. Psychol. Rev. 1956, 63, 277–293. [Google Scholar] [CrossRef] [PubMed]
- Li, A.; Xiao, J.; Xu, X. The Family of Assortativity Coefficients in Signed Social Networks. IEEE Trans. Comput. Soc. Syst. 2020, 7, 1460–1468. [Google Scholar] [CrossRef]
- Finger, J.; Kreinin, M. A Measure of ‘Export Similarity’ and its Possible Uses. Econ. J. 1979, 89, 905–912. [Google Scholar] [CrossRef]
- Hao, X.; An, H.; Sun, X.; Zhong, W. The import competition relationship and intensity in the international iron ore trade: From network perspective. Resour. Policy 2018, 57, 45–54. [Google Scholar] [CrossRef]
- Shuai, C.; Wang, X. Comparative advantages and complementarity of Sino-US agricultural trade: An empirical analysis. Agric. Econ. 2011, 57, 118–131. [Google Scholar] [CrossRef]
- Zheng, X.; Jia, L.; Bao, J.; Chen, J. A study of trade complementarity between China and the Baltic States and its development strategies. Amfiteatru Econ. 2018, 20, 788–803. [Google Scholar] [CrossRef]
- Hoang, V. Assessing the agricultural trade complementarity of the Association of Southeast Asian Nations countries. Agric. Econ. 2018, 65, 464–475. [Google Scholar] [CrossRef]
- Gao, C.; Sun, M.; Shen, B. Features and evolution of international fossil energy trade relationships: A weighted multilayer network analysis. Appl. Energy 2015, 156, 542–554. [Google Scholar] [CrossRef]
- Gao, C.; Mao, Y.; Li, J.; Sun, M.; Ji, Z. Dynamic correlations of renewable-energy companies: Evidence from a multilayer network model. J. Renew. Sustain. Energy 2023, 15, 015904. [Google Scholar] [CrossRef]
- Gao, C.; Su, B.; Sun, M.; Zhang, X.; Zhang, Z. Interprovincial transfer of embodied primary energy in China: A complex network approach. Appl. Energy 2018, 215, 792–807. [Google Scholar] [CrossRef]
- Zuo, Z.; McLellan, B.; Li, Y.; Guo, H.; Cheng, J. Evolution and insights into the network and pattern of the rare earths trade from an industry perspective. Resour. Policy 2022, 78, 102912. [Google Scholar] [CrossRef]
- Zhang, P.; Sun, M.; Zhang, X.; Gao, C. Who are leading the change? The impact of China’s leading PV enterprises: A complex network analysis. Appl. Energy 2017, 207, 477–493. [Google Scholar] [CrossRef]
- Zhu, M.; Zhao, Z.; Meng, Y.; Chen, J.; Yu, Z.; Meng, C. Unfolding the evolution of carbon inequality embodied in inter-provincial trade of China: Network perspective analysis. Environ. Impact Assess. Rev. 2022, 97, 106884. [Google Scholar] [CrossRef]
- Zhang, X.; Dong, F. Temporal and spatial evolution of embodied carbon transfer network in the context of the domestic economic cycle. Carbon Manag. 2023, 14, 2176005. [Google Scholar] [CrossRef]
- Szell, M.; Lambiotte, R.; Thurner, S. Multirelational organization of large-scale social networks in an online world. Proc. Natl. Acad. Sci. USA 2010, 107, 13636–13641. [Google Scholar] [CrossRef]
- Liu, Y.; Hao, Y. The dynamic links between CO2 emissions, energy consumption and economic development in the countries along “the Belt and Road”. Sci. Total Environ. 2018, 645, 674–783. [Google Scholar] [CrossRef]
| Disclaimer/Publisher’s Note: The statements, opinions and data contained in all publications are solely those of the individual author(s) and contributor(s) and not of MDPI and/or the editor(s). MDPI and/or the editor(s) disclaim responsibility for any injury to people or property resulting from any ideas, methods, instructions or products referred to in the content. |
© 2024 by the authors. Licensee MDPI, Basel, Switzerland. This article is an open access article distributed under the terms and conditions of the Creative Commons Attribution (CC BY) license (https://creativecommons.org/licenses/by/4.0/).


