Abstract
Many studies have sought to overcome the two main limitations of the average method of ISO 9869-1—its long test duration and low accuracy. These studies reported that the reliability of the results is dependent on the temperature differences. This consensus was based on the results of studies that measured a few cases with specific temperature differences, and the convergence criteria utilized for the representative thermal transmittance (U-value) were rarely examined. This study analyzed the influence of the average temperature difference and test duration on the convergence characteristics and accuracy of U-value estimation using the average method. Data from a north-facing exterior wall with a theoretical U-value of 0.145 W/m2·K were measured between June 2022 and May 2023. The influences of different measurement conditions were analyzed for cases divided based on four measurement periods and 11 average air temperature differences. The findings show that an accurate U-value can be obtained from 7 days’ worth of measurement data with an average temperature difference of 10 °C or higher and that the improvement in accuracy is minimal under stricter conditions. To achieve a convergence probability of over 90% for temperature differences of 10 °C or greater, the second and third criteria required measurement periods of 7 and 15 days respectively.
1. Introduction
The exterior walls of new or retrofitted buildings should be designed and constructed such that thermal transmittance values (U-values) are significantly lower than those previously reported in the past. However, these strict regulations do not guarantee energy savings during building use. As part of the construction quality assurance procedure for new buildings, it is important to verify that the in situ U-value of the exterior wall matches the planned value. For existing buildings, an accurate estimation of in situ U-values is necessary to plan optimal retrofit interventions.
The U-value can be theoretically or experimentally determined. The theoretical U-value is calculated using the approach prescribed by the ISO 6946 standard [1]; it is used for the approval of new and renovated buildings and the certification of energy-efficient buildings. However, for various reasons during the design, construction, and operation phases, discrepancies occur between the theoretical and measured U-values, and these discrepancies have not been addressed in the field of building energy performance diagnosis.
For estimating the in situ U-values of building walls, several nondestructive measurement methods exist, such as the heat flow meter (HFM), simple hot box heat flux meter (SHB-HFM), temperature control box heat flux meter (TCB-HFM), temperature-based (TB), and infrared thermography (IR) methods. These methods have been reviewed in detail by other researchers [2,3,4,5,6]. Although these methods have their own benefits and limitations, the HFM method is the most widely used because of its convenience and cost efficiency.
The standard ISO 9869-1 [7] provides the guidelines for HFM measurements and two analytical methods for processing the measured data. The average method is simple but requires a sufficiently long measurement duration to obtain the in situ U-value under steady-state conditions. By contrast, the dynamic method may shorten the measurement duration by considering the temperature and heat flux fluctuations using the heat equation; however, it is more complex than the average method. Although several researchers [8,9,10,11,12,13] reported that the dynamic method can be used to obtain in situ U-values with higher accuracy for shorter measurement durations, the average method has been widely used because of its simplicity and convenience. Some modified HFM methods, such as the double-side heat flow meter (D-HFM) method [14] and removing the heat storage-effect and heat flow meter (RHS-HFM) method [15], were investigated to reduce the long measurement duration; however, the main disadvantage of the average method is that further research is needed to validate these methods.
Despite the strengths and popularity of the HFM method, its long test duration and low accuracy have been highlighted as its main limitations. Therefore, several studies were conducted to identify and overcome the factors affecting these limitations. These studies are categorized based on two areas: measurement equipment and measurement conditions.
The influence of the accuracy and installation of heat flux plates and temperature sensors on the measurement results was studied. According to several studies [16,17,18,19,20,21,22,23], heat flow disturbance occurs because of the heat flux plate attached to the surface of the wall, and that this significantly contributes to the error in U-value estimation. Meng et al. [23] found that up to 26% of the maximum error of the U-value is determined by the location of the heat flux plate. Gaspar et al. [24] and Meng et al. [23] found that poor contact between the heat flux plate and the wall surface can increase the error in HFM measurements. Gaspar et al. [24] reported that the use of PVC film to avoid damage to the wall surface could reduce the U-value by approximately 19–27%. Moreover, the location of the heat flux sensors was investigated to avoid the influence of thermal bridges [25] and heating equipment [26]. The measurement error due to the accuracy of the temperature sensor has also been analyzed [22,27].
Various factors affect HFM results, such as the temperature difference, temperature fluctuation, wall orientation, wind speed, and moisture. Researchers [8,17,22,27,28,29,30,31,32,33,34] have found that the average temperature difference between indoor and outdoor environments has a significant impact on the accuracy of HFM results and that a large temperature difference is required to obtain results with low uncertainty. Desogus et al. [17] found that a reliable thermal resistance value could be obtained under a temperature difference of more than 10 °C and that the uncertainty decreased as the temperature difference increased. Gaspar et al. [27] reported that, for exterior walls with low U-values, the average temperature differences must be larger than those indicated in previous studies. Cesaratto et al. [16] and Walker et al. [35] highlighted that the temperature difference should not only be large but also kept constant during the measurement period. In addition, several researchers investigated the influence of measurement conditions, such as the orientation of the test wall [36], wind speed [37], and moisture [38,39], to obtain reliable in situ U-values.
In addition to the aforementioned factors, the discrepancies between theoretical and measured values are also influenced by the nature of the wall, method of analysis, quality of construction, age of the material, and inaccurate thermophysical properties of the material. Recently, several studies have shown that the application of surface resistances that differ from onsite measurements [40,41,42,43,44] and changes in the conductivity of materials due to temperature and moisture [45,46,47,48] can be the main causes of discrepancies.
Extensive studies focused on the factors affecting the accuracy of the HFM method, but the optimal test duration remains an open issue. The ISO 9869-1 standard indicates that the test should last for at least three days if the environmental condition is stable; otherwise, more than seven days may be required to obtain reliable results. However, the actual test duration was determined by applying the convergence criteria to the values obtained during measurement. Existing studies were performed for various test durations, with some ranging between 3 and 14 days and others even longer than two weeks. These studies consistently concluded that the reliability of the HFM method is highly dependent on the indoor and outdoor temperature differences, among other influencing factors. However, most of these studies analyzed only a few specific cases, and the influences of various temperature differences and test durations on obtaining reliable in situ U-values using the average method have not been comprehensively analyzed. For example, further research is required to answer several questions, including those regarding the likelihood of obtaining a reliable in situ U-value when the test duration is seven days or the appropriate length of a test when the average temperature difference is expected to be 15 °C.
Therefore, this study aimed to analyze the influences of the average temperature difference and test duration on the convergence characteristics and accuracy of in situ U-value estimation using the average method based on data acquired using the HFM method. Convergence characteristics and accuracy were analyzed as indicators to evaluate both the stability of the in situ U-value estimated by the average method throughout the measurement period and its closeness to the actual value of the wall. We constructed a full-scale experimental building for a long-term study of the thermal performance of the building’s exterior walls in May 2021, and onsite measurements continue to this day. This study used measurement data collected from 1 June 2022 to 31 May 2023. These long-term measurement data were divided into several subcases based on four measurement periods and 11 temperature differences, which allowed us to analyze the influence of different measurement conditions on the convergence characteristics and accuracy of the in situ U-value estimation. These results contribute to a broader understanding of the measurement conditions for obtaining reliable U-values using the average method and provide an additional case study to help researchers and engineers select appropriate test durations.
2. Materials and Methods
2.1. Test Wall
The experimental building is a single room with a floor area of 31.8 m2 and ceiling height of 3.20 m and is located in the city of Incheon in the central region of South Korea. South Korea has a hot summer humid continental climate influenced by monsoons and characterized by four distinct seasons. The experimental building was constructed in May 2021 for a long-term study of the thermal performance of highly insulated building walls (Figure 1). The exterior walls of the experimental building comprised three typologies based on the location of the insulation layer and thermal capacity. In this study, the test wall was a north-facing exterior wall with insulation on the inside and heavy heat capacity. Table 1 lists the stratigraphic and thermophysical properties of the test walls. The theoretical U-value calculated following ISO 6946 [1] is 0.145 W/m2·K. The conductivity of the insulation, accounting for 94.4% of the total theoretical thermal resistance of the test wall, is the value from the manufacturer’s test report. The conductivity of the insulation was measured at a test condition of 20 ± 0.5 °C based on the KS L 9016 standard [49]. For the other materials, data were not available from the manufacturer; thus, the conductivity reported in a previous study [31] was used. In previous studies [45,46,47,48], the conductivity of a material changed with temperature and moisture content, affecting the U-value of the wall; however, this was not considered in this study. Many previous studies also utilized the conventional surface resistance values given in ISO 6946 [1] to calculate the theoretical U-value of walls. However, recent studies [40,41,42,43,44] reported that the surface resistance of walls measured in the field differs from the values given in ISO 6946, and this may be the cause of the discrepancy between the theoretical and measured U-values. Nevertheless, the influence of the surface resistances was not considered in this study owing to the very low percentage of surface resistances in the total thermal resistance of the test wall, and this issue was not within the scope of this study. The interior and exterior surface resistances presented in Table 1 are based on the Energy Saving Design Standards for Buildings published by the Ministry of Land, Infrastructure and Transport of South Korea, and the Korean government mandates the use of these values for building permits.
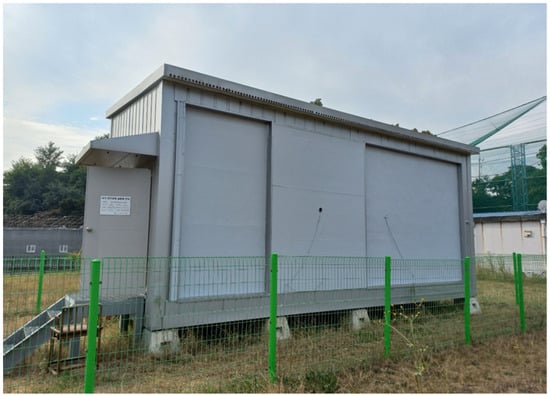
Figure 1.
External view of the experimental building.

Table 1.
Stratigraphies and thermophysical properties of the test wall.
2.2. In Situ Measurement
The measuring equipment was carefully selected to accurately obtain the in situ U-values of the test wall. The equipment consisted of a heat flux sensor, two air temperature sensors, two surface temperature sensors, and a data logger. The indoor air temperature, surface temperature, and heat flux sensors were installed 1.60 m above the floor, halfway up a wall with height of 3.20 m, with the outdoor sensors on the opposite side of indoor sensors. Table 2 summarizes the technical specifications of the measurement equipment. A measurement campaign for estimating the in situ thermal performance of the exterior walls has been ongoing since the completion of the experimental building. In this study, we utilized measurement data that were monitored for one year, from June 2022 to May 2023.
Table 2.
Main technical specifications of measuring equipment.
The experimental building was cooled by an air-source heat pump and heated by an underfloor radiant heating system. The indoor setpoint temperature for the HVAC system was 24 °C in the summer and 26 °C in the winter. Although these setpoints are contrary to the recommended cooling and heating temperatures of 26–28 °C and 20–22 °C for energy conservation, respectively, they were intentionally set in this study to better generate favorable measurement conditions with the large indoor–outdoor temperature differences.
The daily average indoor and outdoor air temperatures, the temperature difference between them, and the heat flux on the indoor surface are presented as time series plots in Figure 2. Based on the operation of the HVAC system, the daily average indoor air temperature was maintained in the range of 22.66–24.36 °C in summer and 24.60–27.36 °C in winter. The daily average outdoor air temperature showed significant changes in the range of −13.77–31.48 °C over the course of a year, and the annual average temperature was 12.99 °C. Therefore, the daily average differences between indoor and outdoor air temperatures were in the range of −7.39–37.77 °C, with an annual average air temperature difference of 11.61 °C. Negative air temperature differences indicate that the outdoor temperature was higher than the indoor temperature.
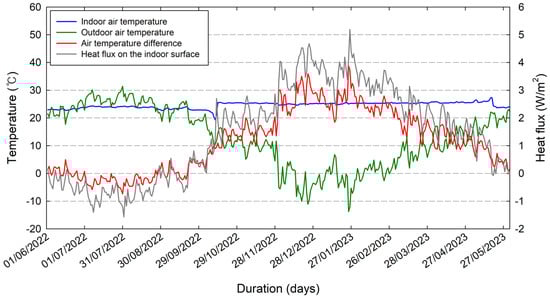
Figure 2.
Measured temperatures and heat flux from 1 June 2022 to 31 May 2023.
2.3. Data Analysis
The in situ U-value was determined according to the average method described by ISO 9869-1 [7]. This method assumes that the in situ U-value can be obtained by dividing the sum of the heat flux at the surface of the wall adjacent to the more stable temperature by the sum of the air temperature differences between both sides of the wall under steady-state conditions. However, because steady-state conditions never occur in the field, the average method requires measurements to be taken over a sufficiently long period to provide accurate estimate of the equivalent steady-state conditions. An estimate of the in situ U-value was obtained as follows:
where is the U-value obtained by the average method (m2·K/W), is the number of measurement data, is the heat flux on the indoor surface (W/m2), and and are the indoor and outdoor air temperatures (K), respectively.
According to ISO 9869-1 [6], the actual test duration was determined by evaluating whether the values obtained during the test fulfilled the following three criteria:
- (1)
- The duration of the test exceeds three days.
- (2)
- The R-value obtained at the end of the test did not deviate by more than ±5% from the value obtained a day prior.
- (3)
- The R-value obtained by analyzing the data during the first time period of INT (2 × DT/3) days did not deviate by more than ±5% from the value obtained during the data from the last time period of the same duration, where DT is the test duration in days and INT is an integer.
We analyzed the influences of temperature differences and measurement periods on the in situ U-value estimation of the test wall using the measurement data for one year, covering four seasons. Moreover, we set up additional analysis cases by referring to the methods in the literature [13,30]. This method assumes that many measurements are conducted on the test wall by shifting the measurement start date forward by one day while maintaining a specific measurement period. For example, by using this method for a single measurement campaign of 365 days, it can be assumed that 363 measurements were carried out over a measurement period of three days. Adjacent subcases created using this method have certain overlapping time periods that can be identified as problems. However, researchers and technicians perform in situ measurements during pre-planned arbitrary periods when environmental conditions are expected to be favorable; therefore, the measurement periods can be randomly selected. These randomly selected periods inherently have the potential to overlap. The measurement period was divided into four periods: 3, 7, 11, and 15 days. Therefore, from a single measurement over 365 days, 363, 359, 355, and 351 subcases were obtained for measurement periods of 3, 7, 11, and 15 days. Meanwhile, considering the daily average indoor–outdoor temperature difference range of −7.39–37.77 °C, we analyzed the influences of the temperature difference by dividing it into 11 categories of ±2 °C differences. The subcases set up in this way not only allow us to evaluate the reproducibility of the average method as an estimation method of the in situ U-value but also increase the reliability of the analysis results.
Figure 3 shows the number of subcases based on the average air temperature difference between the indoor and outdoor environments. Except for the cases with air temperature differences of −6 °C and 34 °C, the subcases of the four measurement periods are similarly distributed across the average air temperature differences. This indicates that unless the average temperature difference is extremely high or low, the change in the temperature difference due to the cumulative averaging of the average method is not significant, even if the measurement period is prolonged. Among all the analyzed subcases, the percentages of cases with an average air temperature difference of 10 °C or higher are 59.78, 60.72, 61.13, and 61.25% for the measurement periods of 3, 7, 11, and 15 days, respectively. As shown in Figure 3, the similar distribution characteristics of the subcases allowed us to analyze and compare the influences of the average air temperature differences and measurement periods on in situ U-value estimation.
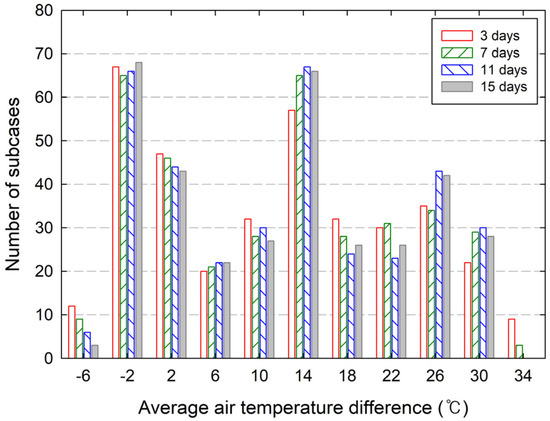
Figure 3.
Analysis cases based on average air temperature differences for each measurement period.
3. Results and Discussion
3.1. In Situ U-Value Obtained via Average Method
The in situ U-values obtained using the average method for each measurement period are presented in Figure 4. The in situ U-values exceeding approximately twice the theoretical U-value (0.145 W/m2·K) or derived as negative values are unreliable and are not shown. The plotted U-values have not yet been evaluated to determine whether the convergence criteria were fulfilled. The convergence characteristics are described in Section 3.2. Figure 4 shows that the distribution of in situ U-values with average air temperature difference becomes significantly different at approximately 10 °C. When the average air temperature differences are greater than 10 °C, the in situ U-values do not significantly change as the temperature difference increases and are approximately constant around the theoretical U-value. The larger the temperature difference and the longer the measurement period, the stronger the tendency to cluster around the theoretical U-value. For average air temperature differences less than approximately 10 °C, the in situ U-values are widely scattered and far from the theoretical U-value. Therefore, Figure 4 illustrates that the degree of agreement between the measured and theoretical U-values greatly depends on the temperature difference. This result agrees with those reported in the literature [7,8,17,22,27,28,29,30,31,32,33,34] that evaluated the use of the average method for HFM measurements performed under various environmental conditions. As pointed out by these authors, the reliability of this method is highly dependent on the temperature difference. The smaller the temperature difference, the less accurate the obtained results.
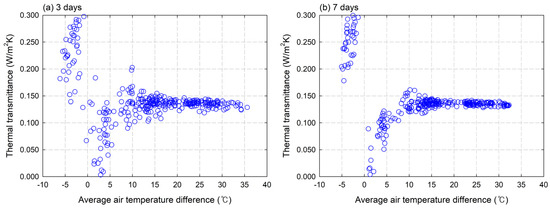
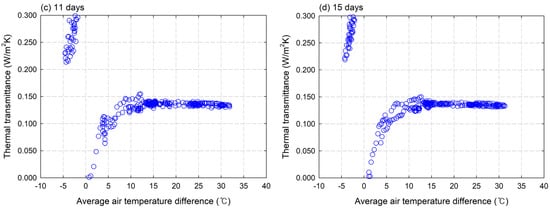
Figure 4.
Distribution of in situ U-values obtained via the average method according to the average air temperature difference between indoor and outdoor for each measurement period: (a) 3 days, (b) 7 days, (c) 11 days, and (d) 15 days. The U-values exceeding approximately twice the theoretical value (0.145 W/m2·K) or derived as negative values are not shown. In addition, the plotted U-values are not evaluated for their satisfaction of the convergence criteria.
3.2. Influence on Convergence Characteristics
As the measurement continues, owing to the accumulation of the temperature difference and heat flux at each sampling interval, the estimated value reaches an asymptotic value. If the environmental conditions remain stable, the three criteria mentioned in Section 2.3 for terminating the test are met. Therefore, the criteria determining the end of the measurement can also be used as convergence conditions. Meanwhile, as each case had a measurement period of at least three days, the convergence characteristics were analyzed, excluding the first of the three criteria.
Figure 5 employs boxplots to show the descriptive statistics for the fulfillment of the second convergence condition based on the average air temperature differences for each measurement period. A boxplot graphically demonstrates the distribution characteristics of a large amount of data and is useful for comparing distributions across categories. The boxplot in Figure 5 displays the dataset based on a five-number summary: minimum (10th percentile), lower quartile (25th percentile), median (50th percentile), upper quartile (75th percentile), and maximum (90th percentile). This boxplot includes an additional characteristic to represent the mean (blue solid line) of the data. The red horizontal solid line highlights the 5% range that meets the convergence conditions of the ISO 9869-1 standard. Moreover, the absolute values of the second convergence condition are plotted on a logarithmic scale, as they show a wide range of values.
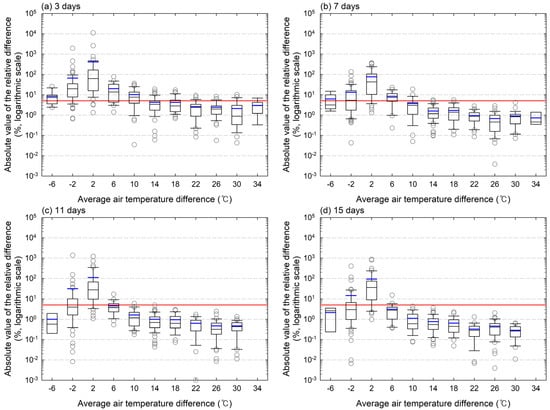
Figure 5.
Convergence characteristics of the second convergence condition of the average method according to the average air temperature difference between indoor and outdoor for each measurement period: (a) 3 days, (b) 7 days, (c) 11 days, and (d) 15 days. The vertical boxplot shows the five-number summary (i.e., the median and 10th, 25th, 75th, and 90th percentiles), outliers (gray hollow dots), and mean value (blue solid line). The red horizontal solid line highlights the 5% range that meets the convergence condition of the ISO 9869-1 standard.
As shown in Figure 5, the higher the absolute value of the average air temperature difference and the longer the measurement period, the smaller the absolute value of the second convergence condition. The convergence characteristics at a certain temperature difference can be statistically evaluated by whether the 75th and 90th percentiles of the boxplot are within the 5% range, which is the convergence condition for the average method. When the measurement period was 3 days (Figure 5a), the 90th percentile was outside of 5% for all average temperature differences, and the 75th percentile was mostly within 5% for temperature differences of 14 °C or higher. For the measurement period of 7 days (Figure 5b), the 75th and 90th percentiles were in the range of 5% from the average temperature differences of 10 °C and 14 °C or higher, respectively. For the convergence characteristics of the measurement periods of 11 and 15 days (Figure 5c and Figure 5d, respectively), even the outliers of the boxplot satisfy the second condition when the average air temperature differences are greater than 10 °C. In contrast, at low average air temperature differences of −2 °C and 2 °C (i.e., −4–4 °C), achieving the second condition is difficult, even with a longer measurement period. When the average temperature difference was 2 °C, even the 25th percentile was not within the 5% range for all measurement periods.
Based on an average air temperature difference of 10 °C, which is the main recommendation in the literature, the following convergence rate differences were found. For average air temperature differences of 10 °C or higher, the percentage of cases in which the second condition was met was 74.65% for the measurement period of 3 days, 96.79% for 7 days, 99.54% for 11 days, and 100.00% for 15 days. Conversely, the convergence rate for average air temperature differences lower than 10 °C was 16.44% for a measurement period of 3 days, 34.75% for 7 days, 47.10% for 11 days, and 49.26% for 15 days. These results indicate that the fulfillment of the second convergence condition is strongly dependent on the average temperature differences and measurement periods.
Descriptive statistics analyzing the fulfillment of the third convergence condition using boxplots are presented in Figure 6. Figure 6 shows that the average air temperature difference and the length of the measurement period have a significant influence on the fulfillment of the convergence condition, but the third convergence condition is more difficult to fulfill than the second. For the measurement period of 3 days, the 75th percentile of the second convergence condition was mostly within the 5% range for average air temperature differences of 14 °C or higher, but the 75th percentile of the third convergence condition was outside the 5% range for all average air temperature differences. The number of subcases satisfying the third condition increased as the measurement period increased; however, the relative differences were clearly larger than those for the second condition. For average air temperature differences of 10 °C or higher, the convergence rate for the third condition was 50.23% for 3 days, 50.92% for 7 days, 74.19% for 11 days, and 91.16% for 15 days. When the average air temperature differences were less than 10 °C, the convergence rate for the third condition was 7.53% for 3 days, 4.26% for 7 days, 10.14% for 11 days, and 7.35% for 15 days. For average air temperature differences of 10 °C or higher, the shortest measurement period that fulfilled the convergence condition with a probability exceeding 90% was 7 days for the second condition but 15 days for the third condition.
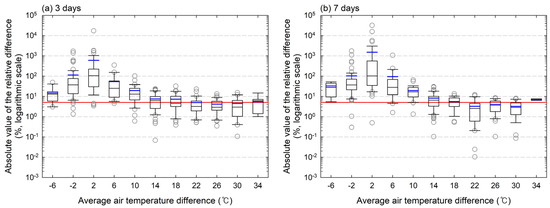
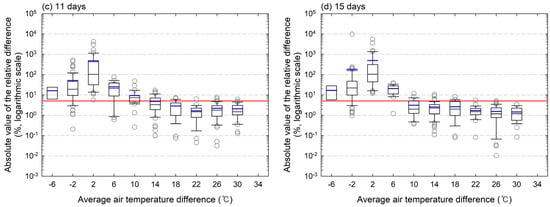
Figure 6.
Convergence characteristics of the third convergence condition of the average method according to the average air temperature difference between indoor and outdoor for each measurement period: (a) 3 days, (b) 7 days, (c) 11 days, and (d) 15 days. The vertical boxplot shows the five-number summary (i.e., the median and 10th, 25th, 75th, and 90th percentiles), outliers (gray hollow dots), and mean value (blue solid line). The red horizontal solid line highlights the 5% range that meets the convergence condition of the ISO 9869-1 standard.
These results were attributed to the different calculation procedures for the second and third convergence conditions. The second condition evaluates whether the relative difference between the estimates of two thermal resistances (R-values) that are one day apart is within ±5%. The longer the measurement period, the longer the overlap; thus, the two estimates for calculating the relative difference were similar. This trend is illustrated in Figure 5. When calculating the relative difference in the second condition, the percentages of overlapping periods for each measurement period were 66.67% for 3 days, 85.71% for 7 days, 90.91% for 11 days, and 93.33% for 15 days. Therefore, the second convergence condition can easily be satisfied if there are no large fluctuations in the environmental conditions in the later part of the short-term measurement period.
Conversely, the third convergence condition evaluates whether the relative difference between the estimates of two R-values obtained in the first and last time periods corresponding to INT (2 × DT/3) of the measurement duration (DT) is within ±5%. In calculating the relative difference in the third convergence condition, each period for obtaining the two R-value estimates was shortened, and the percentages of these reduced periods for each measurement duration were 66.67% for 3 days, 57.14% for 7 days, 63.34% for 11 days, and 66.67% for 15 days. Furthermore, the percentages of overlapping periods between these reduced periods were 50.00% for 3 days, 25.00% for 7 days, 42.86% for 11 days, and 50.00% for 15 days. Therefore, the two periods for calculating the deviation are not only shortened but also opposite to each other in the entire measurement duration. In addition, the overlapping period is short. Thus, the third convergence condition is difficult to fulfill.
3.3. Influence on Accuracy
Figure 7 shows the in situ U-values according to the average air temperature differences for each measurement period, separated by whether the convergence conditions are fulfilled. The blue and green hollow dots represent the converged and non-converged cases, respectively. The red horizontal solid line indicates the theoretical U-value (0.145 W/m2·K). Figure 7 illustrates that the distribution characteristics of the in situ U-values estimated by the average method change based on the average air temperature difference of 10 °C. Regardless of whether the convergence conditions are met, the in situ U-values obtained at temperature differences of less than 10 °C are not reliable because they deviate significantly from the theoretical U-value. The convergence rates for these cases were 4.11% for 3 days, 0.00% for 7 days, 8.70% for 11 days, and 4.41% for 15 days. By contrast, for average air temperature differences of 10 °C or greater, the measured U-values are concentrated around the theoretical U-value. The in situ U-values obtained from the average air temperature differences of 14 °C or higher and measurement periods of seven days or longer were similar. These results show that the HFM measurements taken for at least 7 days with an average air temperature difference of 14 °C or higher are required to obtain reliable in situ U-values using the average method.
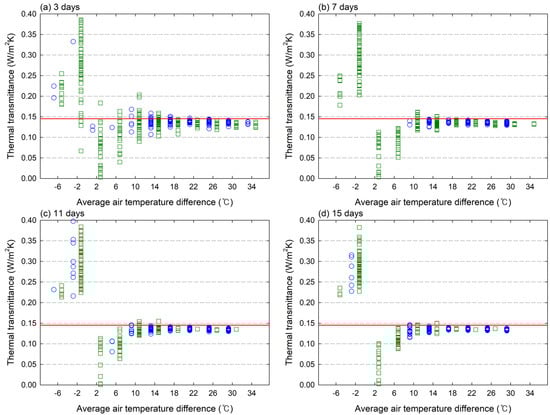
Figure 7.
Converged (blue hollow dots) and non-converged (green hollow squares) in situ U-values obtained via the average method according to the average air temperature difference between indoor and outdoor temperatures for each measurement period: (a) 3 days, (b) 7 days, (c) 11 days, and (d) 15 days. The red horizontal solid line highlights the theoretical U-value (0.145 W/m2·K). The U-values exceeding approximately twice the theoretical value or derived as negative values are not shown.
Figure 7 shows that the higher the average temperature difference and the longer the measurement period, the greater the proportion of converged cases (blue hollow dots). Specifically, the convergence rates of the cases above 10 °C for each measurement period were 49.31% for 3 days, 50.00% for 7 days, 74.19% for 11 days, and 91.16% for 15 days. Figure 7 illustrates that there is little difference in the U-values between the converged and non-converged cases for an average air temperature difference of 10 °C or greater. Most of the non-converged cases satisfied the second condition but did not fulfill the third condition. Specifically, for an average air temperature difference of 10 °C or greater, the percentages of cases satisfying only the second condition, only the third condition, and neither condition were 25.35%, 0.92%, and 24.42% for 3 days; 46.79%, 0.92%, and 2.29% for 7 days; 25.35%, 0.00%, and 0.46% for 11 days; and 8.84%, 0.00%, and 0.00% for 15 days, respectively. These results demonstrate the difficulty in satisfying the third convergence condition, which agrees with the results of previous studies [30,50].
In this study, the accuracy of estimating in situ U-values using the average method was evaluated by comparing the relative differences between the measured and theoretical U-values. The relative differences of 10% and 20% were set as the criteria for an accuracy review. A relative difference of 20% is the value for determining that there is a significant difference between the theoretical and measured values in the ISO 9869-1 standard [7]. Additionally, a relative difference of 10% is a common criterion for the accuracy of in situ U-value estimation in previous studies that used the HFM method. Figure 8 illustrates the absolute values of the relative differences between the measured and theoretical U-values based on the average air temperature difference for each measurement period. The absolute values of the relative difference showed a wide range of values; therefore, they were plotted on a logarithmic scale. The red horizontal solid line and blue dashed line represent 10 and 20% relative differences from the theoretical U-value, respectively.
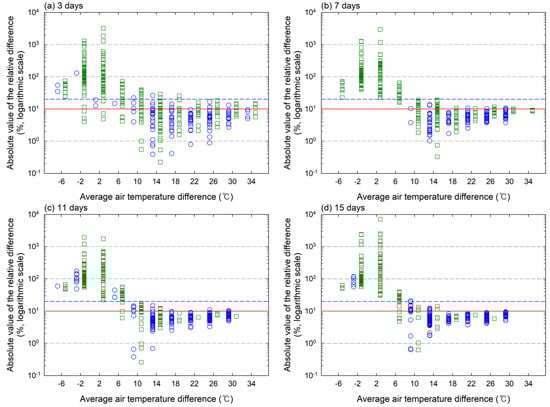
Figure 8.
Absolute values of the relative differences between the measured and theoretical U-values for each measurement period: (a) 3 days, (b) 7 days, (c) 11 days, and (d) 15 days. The relative differences were separated into converged (blue hollow dots) and non-converged (green hollow squares) cases. The horizontal red solid and blue short dashed lines highlight 10% and 20% relative differences from the theoretical U-values, respectively.
Figure 8 shows that the accuracy of the in situ U-value estimation using the average method was significantly contrasted based on the average air temperature difference of 10 °C. Below 10 °C, estimation accuracy was low for all measurement periods, regardless of convergence. Even the average value of the relative differences between the converged cases with a measurement period of 15 days was 88.60%. By contrast, the relative differences decreased significantly from the average air temperature differences of 10 °C or greater. Additionally, the absolute values of the relative differences tended to be concentrated in the range of approximately 4–10% as the temperature difference became higher. For the shortest measurement period of 3 days, 98.13% of the converged cases with a temperature difference of 10 °C or higher had a relative difference of 20% or less, whereas 87.85% had a relative difference of 10% or less. In the longest measurement duration of 15 days, out of a total of 196 cases that converged with an average air temperature difference of 10 °C or higher, only one case had a relative difference exceeding 20%, and 89.80% of the cases had relative differences of 10% or less. In addition, the non-converged cases show the same high accuracy, albeit with fewer cases than the converged cases. These results show that when HFM measurements are performed for 7 days at an average temperature difference of 10 °C or higher, the in situ U-value can be obtained with high accuracy using the average method. They also showed that performing HFM measurements over a longer time period under stricter temperature difference conditions did not significantly improve the accuracy of the in situ U-value estimation.
4. Conclusions
This study analyzed the influences of the average air temperature difference and measurement period on the convergence characteristics and accuracy of in situ U-value estimation using the average method based on the data acquired using the HFM method. The test wall is a north-facing exterior wall with a theoretical U-value of 0.145 W/m2·K, and HFM measurement data monitored between 1 June 2022 and 31 May 2023 were used. The long-term measurement data were divided into subcases based on four measurement periods and 11 average air temperature differences to analyze the influence of different measurement conditions.
Because all analysis cases were set to have a measurement period of at least three days, the convergence characteristics were analyzed based on the second and third conditions of the three convergence conditions of the ISO 9869-1 standard. The results show that the fulfillment of the two convergence conditions depends on the temperature difference and measurement period; however, there is a difference in the degree of influence. The second convergence condition was fulfilled with a probability of approximately 75% if the measurements were performed for 3 days with significant average air temperature differences (e.g., over 10 °C) and with a very high probability of more than 95% if the measurements were performed for 7 days. By contrast, the third convergence condition was fulfilled with a high probability of approximately 90% only when the measurements were performed for 15 days under the same temperature differences. Most of the non-converged cases with large temperature differences and long measurement periods did not fulfill the third condition. This difference occurred because the period for calculating the relative difference between the two R-value estimates was set to be more unfavorable for the third condition compared to the second condition.
If HFM measurements are performed for 7 days at an average temperature difference of 10 °C or higher, in situ U-values with high accuracy can be obtained using the average method, and even if measurements are performed under stricter conditions, there will be no significant improvement in accuracy. In addition, for large temperature differences, there was little difference in the accuracy of the in situ U-value estimation, depending on whether the convergence criteria were fulfilled.
In this study, the influences of the average temperature difference and measurement period on the convergence characteristics and accuracy of in situ U-value estimation were examined in several cases. Particularly, although the result had sufficient accuracy, there were many cases in which it could not be used as a representative U-value according to the ISO 9869-1 standard because it did not fulfill the third convergence condition, which was too strict. Therefore, it is necessary to discuss the readjustment of the convergence criteria such that the in situ U-values with high accuracy are not excluded due to convergence characteristics. On the contrary, these results are based on exterior walls with insulation on the inside and heavy heat capacity; thus, there are limitations in directly applying them to other wall types. To this end, further research should be conducted to quantitatively investigate the variability in temperature differences that affect convergence characteristics depending on the measurement period for various types of exterior walls and to identify appropriate convergence criteria that can lead to the estimation of in situ U-values with high accuracy within a shorter measurement period.
Author Contributions
Conceptualization, M.-J.K.; methodology, D.-S.C. and M.-J.K.; validation, D.-S.C., Y.-J.L., J.-H.M. and M.-J.K.; formal analysis, Y.-J.L., D.-S.C. and M.-J.K.; investigation, Y.-J.L. and J.-H.M.; writing—original draft preparation, Y.-J.L. and M.-J.K.; writing—review and editing, D.-S.C. and M.-J.K.; visualization, M.-J.K.; project administration, M.-J.K.; funding acquisition, M.-J.K. All authors have read and agreed to the published version of the manuscript.
Funding
This work was supported by a National Research Foundation of Korea (NRF) grant funded by the Korean Government (MSIT) (No. 2021R1F1A1063008).
Data Availability Statement
Data are contained within the article.
Conflicts of Interest
The authors declare no conflicts of interest.
References
- ISO 6946:2017; Building Components and Building Elements—Thermal Resistance and Thermal Transmittance—Calculation Method. ISO: Geneva, Switzerland, 2017. Available online: https://www.iso.org/standard/65708.html (accessed on 26 May 2023).
- Bienvenido-Huertas, D.; Moyano, J.; Marín, D.; Fresco-Contreras, R. Review of in situ methods for assessing the thermal transmittance of walls. Renew. Sustain. Energy Rev. 2019, 102, 356–371. [Google Scholar] [CrossRef]
- Teni, M.; Krstić, H.; Kosiński, P. Review and comparison of current experimental approaches for in-situ measurements of building walls thermal transmittance. Energy Build. 2019, 203, 109417. [Google Scholar] [CrossRef]
- Soares, N.; Martins, C.; Gonçalves, M.; Santos, P.; Silva, L.S.; Costa, J.J. Laboratory and in-situ non-destructive methods to evaluate the thermal transmittance and behavior of walls, windows, and construction elements with innovative materials: A review. Energy Build. 2019, 182, 88–110. [Google Scholar] [CrossRef]
- Yang, Y.; Chen, Z.; Wu, T.V.; Sempey, A. In situ methodology for thermal performance evaluation of building: A review. Int. J. Therm. Sci. 2022, 181, 107686. [Google Scholar] [CrossRef]
- Nardi, I.; Lucchi, E. In situ thermal transmittance assessment of the building envelope: Practical advice and outlooks for standard and innovative procedures. Energies 2023, 16, 3319. [Google Scholar] [CrossRef]
- ISO 9869-1:2014; Building Elements—In-Situ Measurement of Thermal Resistance and Thermal Transmittance—Part 1: Heat Flow Meter Method. ISO: Geneva, Switzerland, 2014. Available online: https://www.iso.org/standard/59697.html (accessed on 26 May 2023).
- Atsonios, I.A.; Mandilaras, I.D.; Kontogeorgos, D.A.; Founti, M.A. A comparative assessment of the standardized methods for the in–situ measurement of the thermal resistance of building walls. Energy Build. 2017, 154, 198–206. [Google Scholar] [CrossRef]
- Gaspar, K.; Casals, M.; Gangolells, M. A comparison of standardized calculation methods for in situ measurements of façades U-value. Energy Build. 2016, 130, 592–599. [Google Scholar] [CrossRef]
- Deconinck, A.H.; Roels, S. Comparison of characterisation methods determining the thermal resistance of building components from onsite measurements. Energy Build. 2016, 130, 309–320. [Google Scholar] [CrossRef]
- Gaspar, K.; Casals, M.; Gangolells, M. Review of criteria for determining HFM minimum test duration. Energy Build. 2018, 176, 360–370. [Google Scholar] [CrossRef]
- Flores Larsen, S.; Silvana, M.; Castro, N.; González, S. Comparison of four in-situ methods for the determination of walls thermal resistance in free-running buildings with alternating heat flux in different seasons. Constr. Build. Mater. 2019, 224, 455–473. [Google Scholar] [CrossRef]
- Wang, C.; Fu, X.; Tao, X.; Li, X.; An, J. A novel response factor-based method for in situ measurement of wall thermal resistance. Buildings 2023, 13, 1986. [Google Scholar] [CrossRef]
- Rasooli, A.; Itard, L. In-situ characterization of walls’ thermal resistance: An extension to the ISO 9869 standard method. Energy Build. 2018, 179, 374–383. [Google Scholar] [CrossRef]
- Shi, X.; Gong, G.; Peng, P.; Liu, Y. Investigation of a new kind of in-situ measurement method of thermal resistance of building envelope. Energy Build. 2022, 258, 111803. [Google Scholar] [CrossRef]
- Cesaratto, P.G.; De Carli, M.; Marinetti, S. Effect of different parameters on the in situ thermal conductance evaluation. Energy Build. 2011, 43, 1792–1801. [Google Scholar] [CrossRef]
- Desogus, G.; Mura, S.; Ricciu, R. Comparing different approaches to in situ measurement of building components thermal resistance. Energy Build. 2011, 43, 2613–2620. [Google Scholar] [CrossRef]
- Trethowen, H. Measurement errors with surface-mounted heat flux sensors. Build. Environ. 1986, 21, 41–56. [Google Scholar] [CrossRef]
- Peng, C.; Wu, Z. In situ measuring and evaluating the thermal resistance of building construction. Energy Build. 2008, 40, 2076–2082. [Google Scholar] [CrossRef]
- Cucumo, M.; De Rosa, A.; Ferraro, V.; Kaliakatsos, D.; Marinelli, V. A method for the experimental evaluation in situ of the wall conductance. Energy Build. 2006, 38, 238–244. [Google Scholar] [CrossRef]
- Cucumo, M.; Ferraro, V.; Kaliakatsos, D.; Mele, M. On the distortion of thermal flux and of surface temperature induced by heat flux sensors positioned on the inner surface of buildings. Energy Build. 2018, 158, 677–683. [Google Scholar] [CrossRef]
- Ficco, G.; Iannetta, F.; Ianniello, E.; d’Ambrosio Alfano, F.R.; Dell’Isola, M. U-value in situ measurement for energy diagnosis of existing buildings. Energy Build. 2015, 104, 108–121. [Google Scholar] [CrossRef]
- Meng, X.; Yan, B.; Gao, Y.; Wang, J.; Zhang, W.; Long, E. Factors affecting the in situ measurement accuracy of the wall heat transfer coefficient using the heat flow meter method. Energy Build. 2015, 86, 754–765. [Google Scholar] [CrossRef]
- Gaspar, K.; Casals, M.; Gangolells, M. Influence of HFM thermal contact on the accuracy of in situ measurements of façades’ U-value in operational stage. Appl. Sci. 2021, 11, 979. [Google Scholar] [CrossRef]
- Zalewski, L.; Lassue, S.; Rousse, D.; Boukhalfa, K. Experimental and numerical characterization of thermal bridges in prefabricated building walls. Energy Convers. Manag. 2010, 51, 2869–2877. [Google Scholar] [CrossRef]
- Guattari, C.; Evangelisti, L.; Gori, P.; Asdrubali, F. Influence of internal heat sources on thermal resistance evaluation through the heat flow meter method. Energy Build. 2017, 135, 187–200. [Google Scholar] [CrossRef]
- Gaspar, K.; Casals, M.; Gangolells, M. In situ measurement of façades with a low U-value: Avoiding deviations. Energy Build. 2018, 170, 61–73. [Google Scholar] [CrossRef]
- Cabeza, L.F.; Castell, A.; Medrano, M.; Martorell, I.; Perez, G.; Fernandez, I. Experimental study on the performance of insulation materials in Mediterranean construction. Energy Build. 2010, 42, 630–636. [Google Scholar] [CrossRef]
- Gori, V.; Elwell, C.A. Estimation of thermophysical properties from in-situ measurements in all seasons: Quantifying and reducing errors using dynamic grey-box methods. Energy Build. 2018, 167, 290–300. [Google Scholar] [CrossRef]
- Choi, D.S.; Ko, M.J. Analysis of convergence characteristics of average method regulated by ISO 9869-1 for evaluating in situ thermal resistance and thermal transmittance of opaque exterior walls. Energies 2019, 12, 1989. [Google Scholar] [CrossRef]
- Choi, D.S.; Lee, Y.J.; Moon, J.H.; Kim, Y.S.; Ko, M.J. Estimating in-situ R-value of highly insulated building walls based on the measurement of temperature and heat flux inside the wall. Energies 2023, 16, 5714. [Google Scholar] [CrossRef]
- Asdrubali, F.; D’Alessandro, F.; Baldinelli, G.; Bianchi, F. Evaluating in situ thermal transmittance of green buildings masonries—A case study. Case Stud. Constr. Mater. 2014, 1, 53–59. [Google Scholar] [CrossRef]
- Samardzioska, T.; Apostolska, R. Measurement of heat-flux of new type façade walls. Sustainability 2016, 8, 1031. [Google Scholar] [CrossRef]
- O’Hegarty, R.; Kinnane, O.; Lennon, D.; Colclough, S. In-situ U-value monitoring of highly insulated building envelopes: Review and experimental investigation. Energy Build. 2021, 252, 111447. [Google Scholar] [CrossRef]
- Walker, R.; Pavía, S. Thermal performance of a selection of insulation materials suitable for historic buildings. Build. Environ. 2015, 94, 155–165. [Google Scholar] [CrossRef]
- Ahmad, A.; Maslehuddin, M.; Al-Hadhrami, L.M. In situ measurement of thermal transmittance and thermal resistance of hollow reinforced precast concrete walls. Energy Build. 2014, 84, 132–141. [Google Scholar] [CrossRef]
- Wang, F.; Wang, D.; Wang, X.; Yao, J. A data analysis method for detecting wall thermal resistance considering wind velocity in situ. Energy Build. 2010, 42, 1647–1653. [Google Scholar] [CrossRef]
- Litti, G.; Khoshdel, S.; Audenaert, A.; Braet, J. Hygrothermal performance evaluation of traditional brick masonry in historic buildings. Energy Build. 2015, 105, 393–411. [Google Scholar] [CrossRef]
- Björk, F.; Enochsson, T. Properties of thermal insulation materials during extreme environment changes. Constr. Build. Mater. 2009, 23, 2189–2195. [Google Scholar] [CrossRef]
- Evangelisti, L.; Guattari, C.; Gori, P.; De Lieto Vollaro, R.; Asdrubali, F. Experimental investigation of the influence of convective and radiative heat transfers on thermal transmittance measurements. Int. Commun. Heat Mass Transf. 2016, 78, 214–223. [Google Scholar] [CrossRef]
- Evangelisti, L.; Guattari, C.; Gori, P.; Bianchi, F. Heat transfer study of external convective and radiative coefficients for building applications. Energy Build. 2017, 151, 429–438. [Google Scholar] [CrossRef]
- Evangelisti, L.; Guattari, C.; Asdrubali, F.; De Lieto Vollaro, R. In situ thermal characterization of existing buildings aiming at NZEB standard: A methodological approach. Dev. Built Environ. 2020, 2, 100008. [Google Scholar] [CrossRef]
- Bienvenido-Huertas, D.; Bermúdez, J.; Moyano, J.; Marín, D. Influence of ICHTC correlations on the thermal characterization of façades using the quantitative internal infrared thermography method. Build. Environ. 2019, 149, 512–525. [Google Scholar] [CrossRef]
- Nowak, H.; Nowak, Ł. Non-destructive possibilities of thermal performance evaluation of the external walls. Materials 2021, 14, 7438. [Google Scholar] [CrossRef] [PubMed]
- Szagri, D.; Nagy, B. Experimental and numerical hygrothermal analysis of a refurbished double-skin flat roof. Case Stud. Therm. Eng. 2021, 25, 100941. [Google Scholar] [CrossRef]
- Orosz, M.; Nagy, B.; Tóth, E. Hygrothermal simulations and In-situ measurements of ultra-lightweight concrete panels. Pollack Period. 2017, 12, 69–83. [Google Scholar] [CrossRef][Green Version]
- D’Orazio, M.; Maracchini, G. An experimental investigation on the indoor hygrothermal environment of a reinforced-EPS based temporary housing solution. Energy Build. 2019, 204, 109500. [Google Scholar] [CrossRef]
- Biswas, K.; Jogineedi, R.; Desjarlais, A. Experimental and numerical examination of naturally-aged foam-VIP composites. Energies 2019, 12, 2539. [Google Scholar] [CrossRef]
- KS L 9016; Test Methods for Thermal Transmission Properties of Thermal Insulations. Korean Standards Association: Seoul, Republic of Korea, 2022. Available online: https://www.kssn.net/search/stddetail.do?itemNo=K001010140629 (accessed on 14 February 2024).
- Evangelisti, L.; Guattari, C.; De Lieto Vollaro, E.; Asdrubali, F. Convergence criteria analysis for thermal conductance measurements of building walls: A case study. Case Stud. Therm. Eng. 2023, 49, 103249. [Google Scholar] [CrossRef]
Disclaimer/Publisher’s Note: The statements, opinions and data contained in all publications are solely those of the individual author(s) and contributor(s) and not of MDPI and/or the editor(s). MDPI and/or the editor(s) disclaim responsibility for any injury to people or property resulting from any ideas, methods, instructions or products referred to in the content. |
© 2024 by the authors. Licensee MDPI, Basel, Switzerland. This article is an open access article distributed under the terms and conditions of the Creative Commons Attribution (CC BY) license (https://creativecommons.org/licenses/by/4.0/).