Abstract
The main objective of the research presented in the following work was the adaptation of reflection-radar technology in a detection and navigation system using radio-tomographic imaging techniques. As key aspects of this work, the energy optimization of high-frequency transmitters can be considered for use inside buildings while maintaining user safety. The resulting building monitoring and control system using a network of intelligent sensors supported by artificial intelligence algorithms, such as logistic regression or neural networks, should be considered an outcome. This paper discusses the methodology for extracting information from signal echoes and how they were transported and aggregated. The data extracted in this way were used to support user navigation through a building, optimize energy based on presence information, and increase the facility’s overall security level. A band from 5 GHz to 6 GHz was chosen as the carrier frequency of the signals, representing a compromise between energy expenditure, range, and the properties of wave behavior in contact with different types of matter. The system includes proprietary hardware solutions that allow parameters to be adjusted over the entire range and guarantee adaptation for RTI (radio tomography imaging) technology.
1. Introduction
With the development of radar targeting techniques [1,2,3] and the increased availability of microwave technology, it has become an excellent alternative to the already well-known targeting techniques using the transmission properties of radio devices [4,5]. Amplitude, frequency, or phase analysis of the reflected wave often allows an object and its position in space to be detected more accurately and quickly. This is one reason why radar may significantly support in-building detection and navigation systems in the future. Unfortunately, these systems are still relatively sophisticated and present considerable difficulties in device synchronization, signal processing, and analysis of acquired data [6,7]. The novelty of the presented solution is the new design of the measuring device and signal processing algorithms. Still, the advantage is that it is possible to detect the position of people based on the waves reflected from them.
The solution uses frequencies between 5 GHz and 6 GHz for detection and localization of the human factor using the reflection method. In doing so, the devices operate in the classic configuration characteristic of many types of tomography, i.e., on the perimeter of the object or survey sphere [8]. In the case of radio tomography, the number of transmitters strictly depends on the size of the room to be covered and (because radar technology is used) the radiation characteristics of the antennas [9]. The number of elements capable of covering a given survey area for an average office space ranges from 8 to 16 devices, of which it is recommended that the system is topped up to the next power of 2. In addition, this juxtaposition allows for the analysis of more than two dimensions when the number of rings surrounding an area is increased [10]. Symbolically, this idea is depicted in Figure 1, where two rings of 16 devices are placed at different heights. However, it should be emphasized that the system model does not force the installation of the entire device at a given position, but only its antenna, the role of which, in this case, is played by a quad-patch antenna coping perfectly with high-frequency signals and strong directionality. In practice, this directivity translates into an energy gain of >10 dBi and an azimuth and elevation range of 30 degrees angular to 45 degrees angular. However, it should be noted that the operation of the rings is independent, and the extracted data sets are only analyzed as a whole after being transported to the computing cluster. The level of complexity of these calculations depends on the level of multidimensionality of the model created [11].
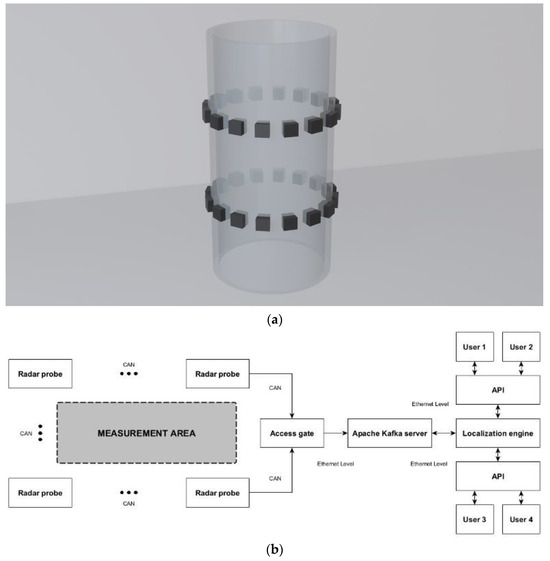
Figure 1.
(a) Symbolic visualization of the radio probe placement idea for reflection tomography, assuming a cylindrical test area and analysis in more than two dimensions. (b) Block diagram of the built radar detection and intra-building localization system.
The role of the solution presented was to create an optimal bridge between radar technologies and in-building navigation systems, the transmission variations of which are insufficient to provide precision in the 10 to 20 cm range while retaining the character of device-free localization technology. An example of the opposite of such a technology could be, for example, UWB technology, which guarantees high accuracy but is still strictly dependent on the user’s device [12]. The solution presented here combines the advantages of both previously mentioned technologies while maintaining a relatively low level of control system complexity [13,14,15]. The justification for this approach is to reduce building maintenance costs and increase rational management of energy resources, thus relieving the environment. From the point of view of building management, the user is responsible for generating the greatest losses. This is most often the result of absent-mindedness and an uneconomical approach to the operation of electricity receivers [16]. This applies especially to large receivers such as air conditioners or heating devices, but it also applies to ventilation and light control in places where switches connected to infrared radiation detectors are not installed. The implementation of the proposed system aims to eliminate the random factor and inappropriate resource management by the user by automating the processes of activation, regulation, and deactivation of as many devices as possible based on precise information about the user’s presence and position. This task can be performed using a specialized neural network that stores user preferences [17]. Another aspect worth remembering is the increase in the level of security because of the implementation of user detection regardless of identifiers or any other electronic devices. This could have a positive impact on government or military-affiliated establishments.
2. Technology and Materials
This section presents the original hardware solutions to adapt high-frequency transmitters as radio-frequency reflex tomographs. It includes a list of functional circuits (both mandatory and optional), electrical mosaics, 3D visualizations, and finished prototypes. It also presents the data pre-processing steps and how they are transported to the central unit, whose task is to organize them in such a way that they form a batch compatible with the artificial intelligence mechanisms implemented in the computing cluster. The illustrative structure of the system cell is presented in Figure 1b, which is an extension of the visualization in Figure 1a. It presents a hierarchy of functional blocks for a single room with a number of n probes connected by the CAN bus and the rest of the network devices responsible for the aggregation, processing, and sharing of location data with selected services/users.
The set of transceivers presented was switched to use the 5.8 GHz carrier frequency. This is due to the intention to move the operating frequency away from the most intensively used Wi-Fi bands, but the system allows for the use of the IEEE 802.11 b/g/n protocol (MAX2828 front-end RF module, Analog Devices, Wilmington, MA, YSA). The created platform, combined with the other components used, may (but does not have to) fulfill additional roles, such as measuring environmental parameters or system diagnostic functions. Because of the limited radio capability of the front-end systems, the device is supported by an ARM microcontroller (STM32F302K6U6 SoC) and two WSoCs (Wireless System on a Chip), which remove the load from the primary data bus so that it can only serve the data flow from reflective radio tomography. The other two protocols, IEEE 802.15.1 (nRF52832 WSoC) and IEEE 802.15.4 (EFR32MG WSoC), can serve wireless and packet data transmission at frequencies far removed (2.4 GHz ISM band) from the operating frequency of the tomograph.
The electronic board of the reflection probe consists of several mandatory and optional circuits. The essential element of the detection system is the reflective radio probe presented in Figure 2. It consists of a 5.8 GHz carrier frequency synthesis system, a detection system, and a preliminary analysis of the received signal. The signal can be transmitted by a quad-patch microwave antenna, which is capable of transmitting and receiving EM waves simultaneously. Data acquired from the RF circuits can be fed into the system via the CAN or RS-485 bus.
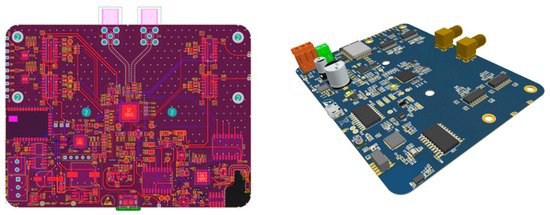
Figure 2.
View of the mosaic of PCB electrical connections of the reflection probe (left) and 3D visualization (right).
The system is complemented by 2.4 GHz wireless communication on one of the selected PAN communication protocols (IEEE 802.15.1 or IEEE 802.15.4). Additional data, such as sensor calibration parameters, can be sent via these channels. This procedure is intended to relieve the main (wired) communication bus as much as possible. For faster reconfiguration of the device, any signals fed to the primary RF circuit (base frequency, QAM signals, etc.) can be generated by the device or fed via SMA connectors from outside. DDS (Direct Digital Synthesis) generators are added for a PCB revision independent of the external laboratory apparatus. The same is true of the base frequency generator for carrier frequency synthesis.
The device has a maximum transmission power of 10 mW, corresponding to +10 dBm. In practice, the devices have sufficient energy to cover a room of several tens or even hundreds of meters (with a direct hit). However, the excess power of an application using reflected waves can reduce the real coverage of the area many times over. While this is the maximum power allowed (by law) by such systems in a given frequency band (5 GHz), it also limits the harmful effects of electric and magnetic fields on living organisms [18,19]. Using more powerful transmitters would not only cause undesired effects but would significantly worsen the energy performance of the device and guarantee no benefits in return.
The 5.8 GHz front-end module has two independently controlled transmit and receive channels and a register for ongoing configuration, but it requires a master control unit equipped with an ALU (Arithmetic Logic Unit). The STM32F302K6U6 microcontroller and the nRF52832 can fulfill this role. Both platforms represent the ARM architecture and Cortex cores. Support for the IEEE 802.15.4 communication module can also be used interchangeably between these two units [20,21].
Thus, the RF front-end circuit emits carrier frequency beams in sequences imposed by the microcontrollers, which return to the detector via the same antenna. The waveform can then be recorded and placed in communication packets (along with time stamps for synchronization and the device identification number). The packets are transmitted to a CAN or RS-485 bus controller and then sent to the central unit, a single-chip computer connected to the facility’s local area network. Samples are aggregated and combined into sets fed into the computing cluster via TCP/IP. Access to the main bus (CAN/RS-485) is also sequenced to ensure a uniform update of readings from all devices.
All power, radio, and wired communication ports are routed to the outside of the PCB. This is reflected in the device’s housing, a view of which is shown in Figure 3. The complete prototype can also be seen here.
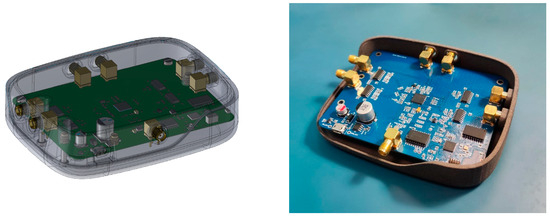
Figure 3.
View the reflective probe housing design (left) and finished prototype (right).
The whole device is designed to be a monolithic solution (despite the antenna connectors being on the outside). The connection hierarchy allows the antenna to be installed inside the unit (in layers). A signal amplifier can be placed between the antenna and the main probe board so that the sensitivity of the unit can be adapted to the room of operation. In the case of small rooms, a degree of amplification that is too high could cause a sharp increase in false alarms, leading directly to artifacts or distortions in the visualization. To keep the surface of the quad-patch directional antenna unobstructed, its surface is brought entirely outside but level with the surface of the housing. This is to prevent any additional sudden transitions of the generated EM wave between media of different permeabilities.
Maximum dispersion is made on the assumed PCB area to avoid mutual interference generated by the RF modules. The areas directly adjacent to the areas of transmission lines and antennas are utterly devoid of copper. The exception is the routing of the transmit and receive paths of the RF front-end system. Because of the nature of the solution, these lines are surrounded by a shield from start to finish. On the PCB, this screen is the ground polygon, while at the transition to the cable, it is the braid. The locations of the most radio-active zones are collected and presented in Figure 4 and Figure 5.
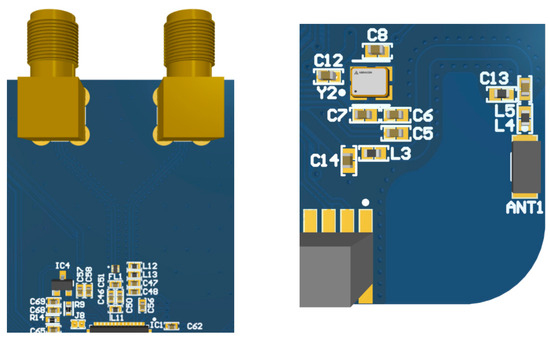
Figure 4.
Symmetrical transmission lines of the 5.8 GHz system are shielded by a potential equalization flange along the entire path (left), the 2.4 GHz transmission line is made in the same regime, and the antenna area is devoid of GND polygon (right).
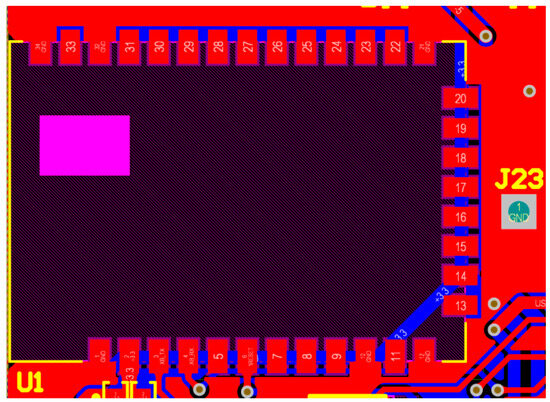
Figure 5.
IEEE 802.15.4 communication system area without a GND polygon.
The layout of the radio circuits was the primary determinant of the location of the other sections of the device. For this reason, the main power supply, stabilizer, and voltage inverter are located on the opposite side (bottom) to the SMA connectors at the very top. To reduce the influence of parasitic effects on the operation of the device, the two copper layers are connected to each other by a group of regularly spaced galvanic connections (vias).
Regarding power supply issues, the decision was made primarily for solutions using energy-efficient microcontrollers from the ARM family and advanced sleep-conditioning functions for individual PCB segments. nRF52832 belongs to this group, along with Bluetooth Low Energy and an average current consumption of 230 µA for the segment above. The same applies to ZigBee, whose average current consumption is 350 µA. In the control segment with the STM32F3 microcontroller, there is no expenditure for the radioactivity, but the much higher activity of the peripherals caused the current requirement to be set at. The largest power consumer for the probe is the MAX2828 RF front-end chip, whose average power consumption settles at 90 mA. This value results from alternately activated transmit, receive, standby, and sleep states. It should also be noted that the module has independently controlled Tx and Rx channels. This makes it necessary to consider the instantaneous energy consumption of the activity of both channels simultaneously. This is reflected in a power supply with a current capacity of 700 mA. The voltage is supplied to the device via a USB connection. Because of the desire to achieve the highest possible performance and the fact that wired CAN and RS-485 data transfer buses are used, the presence of a battery power source was removed. As a result, cables (which are already mandatory anyway) do not add unnecessary complexity to the data transport network. All cables can be routed flush or surface-mounted in a standard braid around the room.
A single-chip computer running the Linux operating system sequences access to the data bus. This device is also the first data aggregator responsible for coupling the data in terms of timestamps. In this way, only data sets that are performed at the same time instant are analyzed. If this technique were not used, the computational algorithms would incorrectly reconstruct the image when a delay occurs on one of the measurement tracks. The protocol for transferring measurement results is TCP/IP. The script run by the operating system is also enhanced to support the Apache Kafka data bus as an alternative data carrier. The data output from the device encapsulates information about the frequency and amplitude of the signal returning to the detector. The reflection probes themselves do not directly interpret the signals. The same is true of the central processing unit (single-chip computer). Interpretation of the data only takes place in the computing cluster with the help of computational intelligence. In relation to the whole, data acquired by the reflection method are transferred in a quantized form via the CAN bus and then the Apache Kafka data bus. Taking into account the time stamps of the packets, the localization engine compares the samples and, based on the recorded changes in amplitude and frequency, determines the presence, position, and movement trend in the detected object. To sum up, only the location engine is capable of providing location data in a Cartesian or spherical system. Until it passes through the data bus to the computing cluster, the data constitute a finite set of points with accuracy depending on the ADC sampling speed and resolution.
3. Data Analysis Methods
The mesh (set of finite elements) was defined for the viewing area. For each finite element, we created a learning data set. Let be the data set containing n samples. For the i-th sample, 1 ≤ i ≤ n, the vector denotes the realizations of input variables, in this case, pre-processed signals obtained from sensors. The sensors were installed on the envelope of the viewing area. The value yi = 1 means that the finite element is included (success) in the viewing area, whereas yi = 0 denotes that the finite element belongs to the background (unsuccess). Sensors were installed in the room, as shown in Figure 6. A mesh was created for the room as follows:
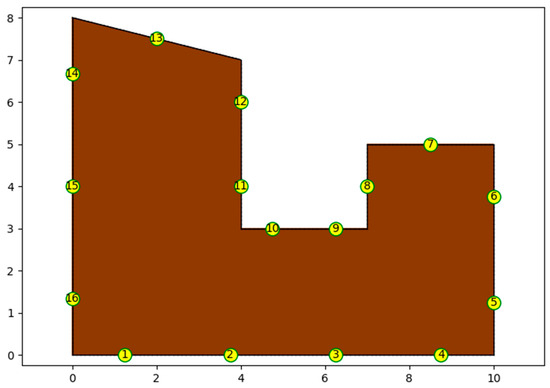
Figure 6.
Room with the location of the sensors.
- Number of nodes: 6560;
- Number of finite elements: 12,694;
- Number of sensors: 16.
A logistic regression model was determined for each finite element, which allows for estimating the probability of belonging to the inclusion area or the background. Based on the solution of the logistic regression, we design the classifier (see e.g., [22,23,24,25]).
Let be a probabilistic space and Y be a discrete random variable, . The main task of logistic regression consists of determining the conditional distribution ; in other words, estimating the probability of success based on the realization X
From the above, we define odds as the probability of the finite element belonging to the inclusion area relative to the probability of belonging to the background:
The probability of success satisfies the condition but the odds and log-odds or logit .
To determine the probability of success based on realization X, we analyze the linear equation as follows
where random variable has a normal distribution and . From (1), we have
The unknown parameters β are estimated by applying the Maximum Likelihood Method.
By solving the task
we obtain the estimators of unknown parameters β, where the likelihood function L(β, Y, X) is given as follows
Instead of solving the task (3), we solve the auxiliary task:
where the logarithm of the likelihood function (4) is equal to:
Elasticnet is a regularization method where the penalty is defined as a linear combination of LASSO (Least Absolute Shrinkage and Selection Operator) regression and ridge regression [22,23,24,26]. Because of collinearity in the input variables, the Elasticnet method [23,25] was additionally used. Thus, we modify the objective function (6) by adding the penalty function and solve the task (1.5). The parameters of model (1) are determined by solving the problem
where , , and the penalty is defined as follows
For we use ridge regression, but when we use the LASSO method.
Boosting is a learning method originally implemented to solve classification problems. The idea of the boosting method is to combine “weak” classifiers to produce a “powerful” classifier.
Thus, the Gradient Boosting Classifier (see e.g., [24,27]) relies on the definition the sequence of trees , where the classification boosted model based on trees is created as follows
The boosting tree (9) is determined by applying forward stagewise procedure. The classification tree [24,28,29] is forced to concentrate on observations that are misclassified by the boosted model . In every step j = 1, 2, …, m, the tree is defined as follows
where denotes a set of separable regions
In the above, the sequence identifies the parameters of the j-th classification tree. For the j-th step (j > 1), we estimate the parameters of the tree (13) by solving the task
where L(.) denotes the loss function [23].
Neural networks (NNs) [4,8,9,21,23,24,29] are one of the most used types of machine learning methods and are usually utilized for classification or regression analysis. A NN is created by developing multi-layer perceptions in a particular order. In multilayer networks, every neuron in a specific layer is bonded to all neurons in the following layer. A neural network structure consists of inputs, weights, aggregation functions, activation functions, and output elements. In multilayer networks, the inputs of the first layer are consist of predictor values from the learning set, and the inputs of the following layers consist of neuron values. For the j-th layer, the effect of input Zj to the cell depends on the weights wj. The aggregation function performs a linear combination of the inputs and weights, where the result is sent to the activation function gj and transfered to the next layer as follows
where denotes the bias and . In the analyzed case, the three-layer neural network was utilized. For the first and second layers, the ReLu activation function
was used, but for the last layer, the sigmoid activation function
was applied. For the classification problem, the objective function used cross-entropy [23,24,29]
For classification problem training, the main task of neural network is to minimize the cross-entropy (19)
To solve the problem (20), the backward propagation algorithm was applied.
Various metrics can be used to assess classifier quality [22,23,24,28,29,30]. The quantitative assessment of the classifier was carried out through the confusion matrix, which shows the matching of the reconstruction as classification conformity and divergence by classes (positive (finite element belongs to the inclusion area) and negative (finite element belongs to the background)). Possible classifier response cases are marked as follows:
- TP (true positive)—means the finite elements are correctly classified as positive;
- TN (true negative)—means the finite elements are correctly classified as negative;
- FP (false positive)—means the finite elements are falsely classified as positive;
- FN (false negative)—means the finite elements are incorrectly classified as negative.
The assessment of reconstruction was determined by the following metrics [5,9]:
Accuracy denotes the proportion of correct classifications,
precision denotes the proportion of correct positive classified elements related to positive predictions,
recall (sensitivity) denotes the proportion of correct positive classified elements to positive elements,
and the F1 score denotes the harmonic mean of precision and recall.
Let Img and RImg be the original and reconstructed image, respectively. Thus Imgi,j and RImgi,j denote the values of pixel (i, j) (1 ≤ i ≤ m, 1 ≤ j ≤ n) in the original and reconstructed image. To assess the reconstruction performance, we use the following measure called the Structural Similarity Index Measure (SSIM)
where , , and denote the pixel sample mean and variance of the original I and reconstructed RI images, denote the covariance of I and RI, and c1 and c2 are constants.
4. Results of Reconstruction
The position of inclusion in the viewing area was reconstructed on the test set. Figure 7, Figure 8, Figure 9, Figure 10 and Figure 11 below present the actual object (pattern) and the reconstructions obtained using logistic regression, the Gradient Boosting Classifier, and a three-layer neural network. The accuracy, precision, recall, F1, and SSIM measures were used to assess the reconstruction quality.
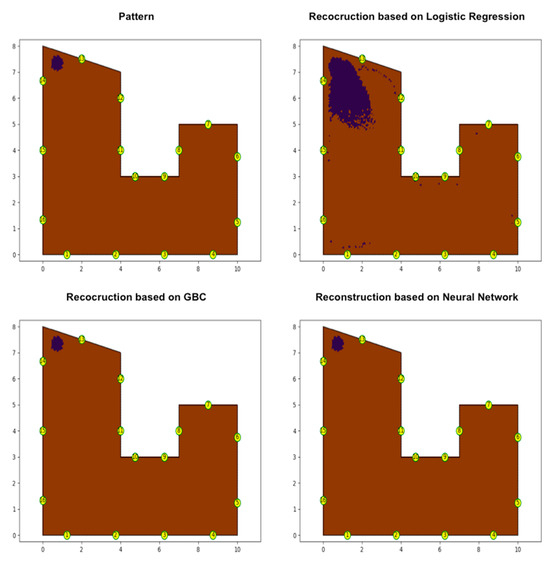
Figure 7.
Pattern and reconstructions based on LR, GBC, and the NN—Example 1.
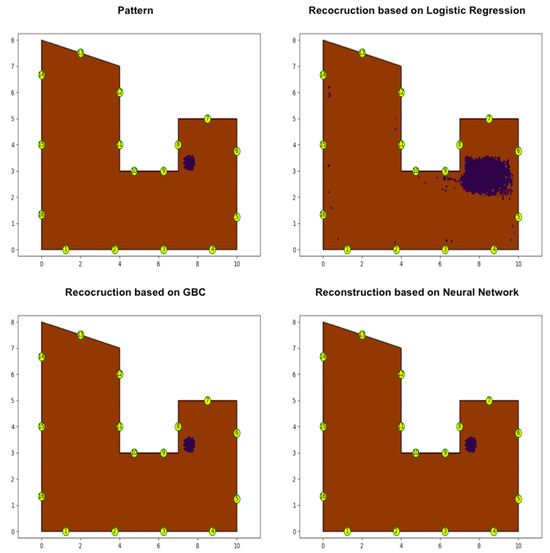
Figure 8.
Pattern and reconstructions based on LR, GBC, and the NN—Example 2.
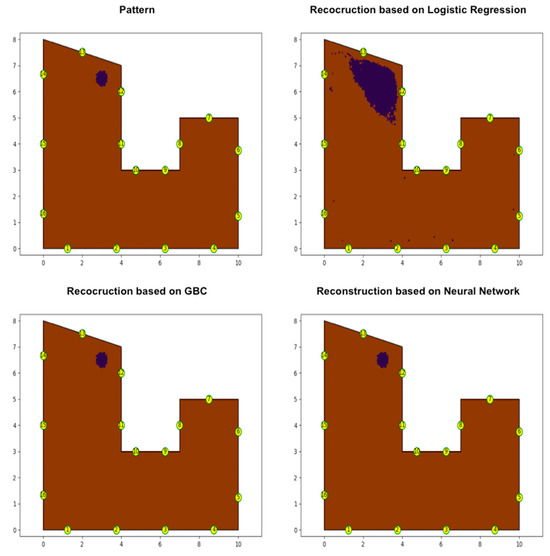
Figure 9.
Pattern and reconstructions based on LR, GBC, and the NN—Example 3.
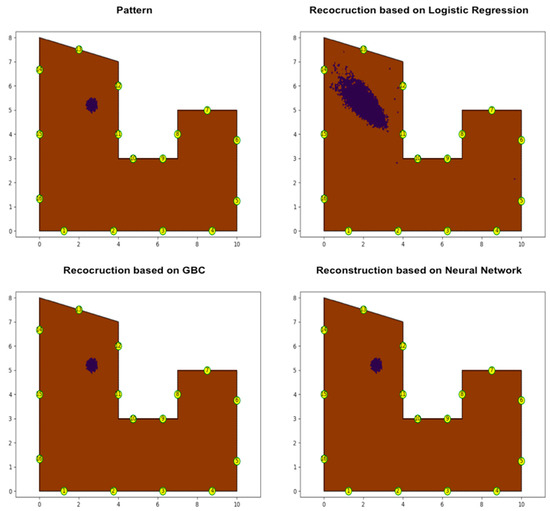
Figure 10.
Pattern and reconstructions based on LR, GBC, and the NN—Example 4.
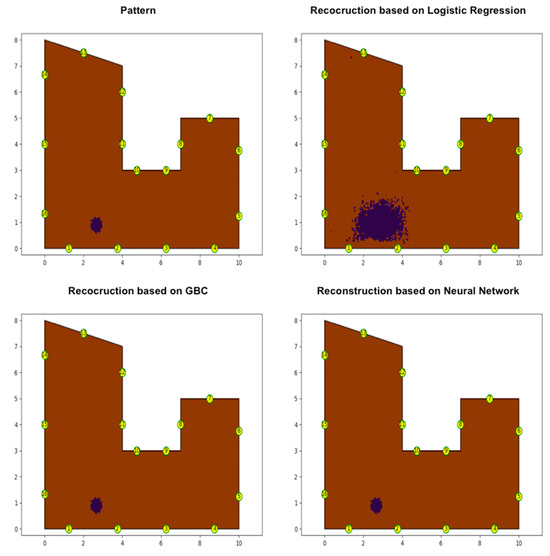
Figure 11.
Pattern and reconstructions based on LR, GBC, and the NN—Example 5.
5. Conclusions
By comparing the values of the image quality metrics presented in Table 1, Table 2 and Table 3, it can be seen that the logistic regression model does not provide sufficient correctness of image reconstruction. Precision and F1, in particular, take shallow values because of incorrectly identified finite elements (false positives). Table 1 shows that the precision of the reconstruction based on the logistic regression is not sufficient and below 0.1. In contrast, the recall values are quite high. This means that many finite elements were recognized as belonging to the inclusion area, although in reality, these elements belong to the background. The same result is obtained by analyzing the F1 values, where too many finite elements from the background were classified as belonging to the inclusion area. Figure 6, Figure 7, Figure 8, Figure 9 and Figure 10 show a characteristic blur so that the boundary of the internal object is not precisely defined. The Structural Similarity Index Measure is below 0.8. Thus, the reconstruction based on logistic regression recognizes the localization of the inclusion area, while the boundary of the inclusion area is not defined precisely. One should notice that we only have 16 predictors in our model. Each predictor is created as the result of pre-processing the signal obtained from a set of ultrasonic sensors.

Table 1.
Metrics for reconstruction based on logistic regression.

Table 2.
Metrics for reconstruction based on the Gradient Boosting Classifier.

Table 3.
Metrics for reconstruction based on the neural network.
The Gradient Boosting Classifier produces the most accurate results. For all considered distributions of inclusions, the values of the image quality metrics such as accuracy, precision, and SSIM are slightly higher than those obtained for the three-layer artificial neural network, whereas, for the Gradient Boosting Classifier, the recall and F1 indices for cases 1, 2, 3, and 5 are definitely higher than for the three-layer artificial neural network. For these cases, the reconstructions obtained from the three-layer artificial neural network were less precise because more finite elements were classified into the inclusion area, although they belonged to the background. Thus, the boundary identification of the inclusion area using GBC is more accurate. Also, for each case, a higher SSIM value was obtained for the Gradient Boosting Classifier.
Very close image reconstructions were obtained using the Gradient Boosting Classifier and the three-layer artificial neural network. The differences in values of the image quality metrics (accuracy, precision, SSIM) were not significant. The developed systems using the reconstructions based on the Gradient Boosting Classifier and the three-layer artificial neural network accurately recognized the location of the user in the room.
After conducting unit tests on the largest and most frequently used electricity consumers, such as air conditioners (in common use), frequent system interventions were found because of the lack of user activity inside the tested zone. Based on average data from the company’s energy bills for the previous 4 years, a gradual reduction in energy consumption was found ranging from 20% to 30%, taking into account the power share of these devices in the entire infrastructure. Fluctuations in this value resulted from the successive adaptation of the algorithm to the role performed. In the case of smaller receivers such as lighting or ventilation, the savings were similar, but in relation to the total energy consumed by the building, they had a much smaller percentage share and therefore had a smaller impact on reducing energy costs.
Author Contributions
Hardware and implementation, M.S. and P.A.; conceptualization of the of system and measurement methodology M.S., S.S.-A., J.L., A.M., D.K. and D.G.; image reconstruction and supervision, S.S.-A., J.L., E.K. and P.T.; software, M.S., E.K., P.T. and D.G.; development of the research methodology, A.M., D.K. and P.A.; original draft preparation, M.S., E.K., S.S.-A., J.L. and P.T.; formal analysis, S.S.-A., J.L. and P.A.; writing—review and editing, M.S., E.K., A.M. and D.K.; literature review, S.S.-A. and J.L.; visualization, E.K. and P.T. All authors have read and agreed to the published version of the manuscript.
Funding
This research received no external funding.
Data Availability Statement
The original contributions presented in the study are included in the article, further inquiries can be directed to the corresponding author.
Conflicts of Interest
Authors M.S., D.G. and P.A. were employed by the company CBRTI. The remaining authors declare that the research was conducted in the absence of any commercial or financial relationships that could be construed as a potential conflict of interest.
References
- Sacco, G.; Mercuri, M.; Hornung, R.; Visser, H.; Lorato, I.; Pisa, S.; Dolmans, G. A SISO FMCW radar based on inherently frequency scanning antennas for 2-D indoor tracking of multiple subjects. Sci. Rep. 2023, 13, 16701. [Google Scholar] [CrossRef] [PubMed]
- Liang, C.; Wang, Y.; Yang, Z.; Hu, X.; Pei, Q.; Gu, W.; Zhang, L. Cooperative Automotive Radars with Multi-Aperture Multiplexing MIMO Sparse Array Design. Electronics 2022, 11, 1198. [Google Scholar] [CrossRef]
- López, Y.A.; García-Fernández, M.; Álvarez-Narciandi, G.; Las-Heras Andrés, F. Unmanned Aerial Vehicle-Based Ground-Penetrating Radar Systems: A review. IEEE Geosci. Remote Sens. Mag. 2022, 10, 66–86. [Google Scholar] [CrossRef]
- Kłosowski, G.; Hoła, A.; Rymarczyk, T.; Mazurek, M.; Niderla, K.; Rzemieniak, M. Use of the Double-Stage LSTM Network in Electrical Tomography for 3D Wall Moisture Imaging. Measurement 2023, 213, 112741. [Google Scholar] [CrossRef]
- Wnuk, M.; Chudy, Z. Pomiar mocy impulsu elektromagnetycznego mikrofal. Przegląd Elektrotechniczny 2014, 90, 239–242. [Google Scholar]
- Xu, Z.; Petropulu, A. Bandwidth Efficient Dual-Function Radar Communication System Based on a MIMO Radar Using OFDM Waveforms. IEEE Trans. Signal Process. 2023, 71, 401–416. [Google Scholar] [CrossRef]
- Ashraf, M.; Tan, B.; Moltchanov, D.; Thompson, J.S.; Valkama, M. Joint Optimization of Radar and Communications Performance in 6G Cellular Systems. IEEE Trans. Green Commun. Netw. 2023, 7, 522–536. [Google Scholar] [CrossRef]
- Wójcik, D.; Rymarczyk, T.; Przysucha, B.; Gołąbek, M.; Majerek, D.; Warowny, T.; Soleimani, M. Energy Reduction with Super-Resolution Convolutional Neural Network for Ultrasound Tomography. Energies 2023, 16, 1387. [Google Scholar] [CrossRef]
- Kłosowski, G.; Rymarczyk, T.; Niderla, K.; Kulisz, M.; Skowron, Ł.; Soleimani, M. Using an LSTM Network to Monitor Industrial Reactors Using Electrical Capacitance and Impedance Tomography—A Hybrid Approach. Eksploat. Niezawodn. Maint. Reliab. 2023, 25. [Google Scholar] [CrossRef]
- Peri, N.; Li, M.; Wilson, B.; Wang, Y.; Hays, J.; Ramanan, D. An Empirical Analysis of Range for 3D Object Detection. In Proceedings of the IEEE/CVF International Conference on Computer Vision (ICCV) Workshops, Paris, France, 2–6 October 2023; pp. 4074–4083. [Google Scholar]
- Perepelytsia, O.; Nosova, T. Determining the working length of a root canal using intraoral radiographysegmentation. Inform. Autom. Pomiary W Gospod. I Ochr. Sr. 2022, 12, 44–46. [Google Scholar] [CrossRef]
- Lee, Y.; Kim, J.; Lee, H.; Moon, K. IoT-based data transmitting system using a UWB and RFID system in smart warehouse. In Proceedings of the 2017 Ninth International Conference on Ubiquitous and Future Networks (ICUFN), Milan, Italy, 4–7 July 2017; pp. 545–547. [Google Scholar]
- Li, P.; Wang, T. Power Consumption Model Construction and Analysis for Soft Synchronization FMCW Radar. IEEE Access 2023, 11, 95903–95911. [Google Scholar] [CrossRef]
- Ashhar, M.Z.M.; Haw, L.C. Recent research and development on the use of reflective technology in buildings—A review. J. Build. Eng. 2022, 45, 103552. [Google Scholar] [CrossRef]
- Hasan, M.; Islam, M.T.; Samsuzzaman; Baharuddin, M.H.; Soliman, M.S.; Alzamil, A.; Abu Sulayman, I.I.M.; Islam, S. Gain and isolation enhancement of a wideband MIMO antenna using metasurface for 5G sub-6 GHz communication systems. Sci. Rep. 2022, 12, 9433. [Google Scholar] [CrossRef] [PubMed]
- Bäcklund, K.; Molinari, M.; Lundqvist, P.; Palm, B. Building Occupants, Their Behavior and the Resulting Impact on Energy Use in Campus Buildings: A Literature Review with Focus on Smart Building Systems. Energies 2023, 16, 6104. [Google Scholar] [CrossRef]
- Selvaraj, R.; Kuthadi, V.M.; Baskar, S. Smart building energy management and monitoring system based on artificial intelligence in smart city. Sustain. Energy Technol. Assess. 2023, 56, 103090. [Google Scholar] [CrossRef]
- Gałązka-Czarnecka, I.; Korzeniewska, E.; Czarnecki, A.; Stańdo, J. Modification of color in turmeric rhizomes (Curcuma longa L.) with pulsed electric field. Prz. Elektrotechniczny 2023, 1, 125–127. [Google Scholar] [CrossRef]
- Krawczyk, A.; Korzeniewska, E. Some aspects of electromagnetic field shielding. Prz. Elektrotechniczny 2023, 1, 130–133. [Google Scholar] [CrossRef]
- Szymczyk, M.; Augustyniak, P. Selected Energy Consumption Aspects of Sensor Data Transmission in Distributed Multi-Microcontroller Embedded Systems. Electronics 2022, 11, 848. [Google Scholar] [CrossRef]
- Shu, X.; Zhang, S.; Li, Y.; Chen, M. An Anomaly Detection Method Based on Random Convolutional Kernel and isolation Forest for Equipment State Monitoring. Eksploat. Niezawodn. Maint. Reliab. 2022, 24, 758–770. [Google Scholar] [CrossRef]
- Przysucha, B.; Wójcik, D.; Rymarczyk, T.; Król, K.; Kozłowski, E.; Gąsior, M. Analysis of Reconstruction Energy Efficiency in EIT and ECT 3D Tomography Based on Elastic Net. Energies 2023, 16, 1490. [Google Scholar] [CrossRef]
- Pawlik, P.; Kania, K.; Przysucha, B. Fault diagnosis of machines operating in variable conditions using artificial neural network not requiring training data from a faulty machine. Eksploat. Niezawodn. Maint. Reliab. 2023, 25. [Google Scholar] [CrossRef]
- Hastie, T.; Tibshirani, R.; Friedman, J. The Elements of Statistical Learning; Springer: New York, NY, USA, 2009. [Google Scholar]
- Friedman, J.H.; Hastie, T.; Tibshirani, R. Regularization paths for generalized linear models via coordinate descent. J. Stat. Softw. 2010, 33, 1–22. [Google Scholar] [CrossRef] [PubMed]
- Zou, H.; Hastie, T. Regularization and variable selection via the elastic net. J. R. Stat. Soc. Ser. B Stat. Methodol. 2005, 67, 301–320. [Google Scholar] [CrossRef]
- Ridgeway, G. Looking for lumps: Boosting and bagging for density estimation. Comput. Stat. Data Anal. 2002, 38, 379–392. [Google Scholar] [CrossRef]
- Kozłowski, E.; Borucka, A.; Oleszczuk, P.; Jałowiec, T. Evaluation of the maintenance system readiness using the semi-Markov model taking into account hidden factors. Eksploat. Niezawodn. Maint. Reliab. 2023, 25, 172857. [Google Scholar] [CrossRef]
- Shao, Y.; Liu, B.; Wang, S.; Xiao, P. A novel test case prioritization method based on problems of numerical software code statement defect prediction. Eksploat. Niezawodn. Maint. Reliab. 2020, 22, 419–431. [Google Scholar] [CrossRef]
- Fawcett, T. An Introduction to ROC analysis. Pattern Recogn. Lett. 2006, 27, 861–874. [Google Scholar] [CrossRef]
Disclaimer/Publisher’s Note: The statements, opinions and data contained in all publications are solely those of the individual author(s) and contributor(s) and not of MDPI and/or the editor(s). MDPI and/or the editor(s) disclaim responsibility for any injury to people or property resulting from any ideas, methods, instructions or products referred to in the content. |
© 2024 by the authors. Licensee MDPI, Basel, Switzerland. This article is an open access article distributed under the terms and conditions of the Creative Commons Attribution (CC BY) license (https://creativecommons.org/licenses/by/4.0/).