3.1. Costs of Maintenance and Operation of Electric Vehicles
A comparison of the production costs of electric cars and standard internal combustion engine cars leads to the conclusion that the former are higher due to the need for a battery instead of a fuel tank. Although the cost of batteries has fallen significantly over the past decade, electric vehicles are still more expensive to manufacture than comparable conventional vehicles. The prices of lithium-ion batteries fell by 85% between 2010 and 2018. Researchers around the world do not agree on a specific date when electric vehicles can achieve cost neutrality in relation to internal combustion engine cars, but they predict reaching price parity within the next 10 years [
25]. Achieving price parity would therefore be the same as technological parity, which means equal prices for electric cars and internal combustion engine cars only in about 15 years [
26,
27,
28,
29].
In exchange for higher initial costs (purchase costs), electric vehicles offer a different set of features than internal combustion vehicles, due to the differentiation of electric drivetrains. Some of these differences may be preferred by consumers, as reflected in their willingness to pay a higher price for an electric vehicle. Examples of the advantages resulting from driving electric vehicles include achieving acceleration in less time and quieter engine operation compared to an internal combustion engine vehicle.
Electric vehicles have fewer moving parts in their structure than vehicles powered by an internal combustion engine. As a result, it is widely believed that EV owners will incur lower regular maintenance costs. A rational, forward-looking buyer will factor this benefit into his or her purchase decision. However, the short history of EVs limits our observable experience with maintenance costs, especially when it comes to larger single maintenance expenses that are likely to arise as the vehicle ages.
There are three main categories of ongoing car maintenance costs: costs not related to the engine technology, ongoing engine and/or drivetrain maintenance, and replacement of major components. The first category includes the cost of ongoing maintenance, such as insurance, tyre replacement, repair of electronic systems, and body work required due to environmental conditions (such as salt in winter). However, the other two categories of maintenance costs will differ. For internal combustion engines, ongoing engine maintenance is related to internal combustion. Oil and filters need to be changed, as well as spark plugs and other ignition system components. The simplicity of the electric drivetrain eliminates these costs.
The last category of costs—replacement of major components—applies to cars with both types of engines. Electric cars have batteries that are expensive and need to be replaced. Although the costs have come down significantly in recent years, it is still costly to replace a battery.
Whether the car owner pays for this directly or as part of the manufacturer’s warranty, it is a significant cost that is characteristic only of electric vehicles. On the other hand, internal combustion engine cars do not have expensive batteries, but they do have transmissions and gearboxes that eventually wear out and need to be replaced.
In a study by Rapson et al. (2021), the price of 1 kWh of energy is equal to USD 150. At that price, a 30 kWh battery (roughly comparable to the one in the Nissan Leaf) would cost
$4500, and a 75 kWh battery for a Tesla Model 3 would cost
$11,250. A battery replacement is comparable to the replacement of a gearbox in a vehicle. Installation of a refurbished gearbox costs between
$1100 and
$3400. The cost is undoubtedly higher for luxury brands. The replacement of a gearbox in a vehicle with an internal combustion engine costs about the same amount as replacing the battery in an electric car [
30].
The disposal of used car batteries is another huge problem. In fact, to date, there are no convenient methods for recycling the main component of batteries (lithium), and the cost of recycling is higher than the cost of extraction. As a result, lithium is usually disposed of in landfills. Second, battery components such as lithium, cobalt, and manganese are mined in developing countries, where working conditions often do not comply with socially acceptable ethical principles. This, too, is a key factor that can influence the vehicle purchase decisions made by consumers [
30].
According to [
31], the falling prices of lithium-ion batteries, the falling prices of key components of EVs, and the increasing numbers of EVs manufactured will contribute to the achievement of equal prices for internal combustion engine cars and electric cars as early as 2024–2025. Prices of lithium-ion batteries are falling steadily worldwide, and this conclusion is supported by data from 2010, when the cost of such a battery was 1183 USD/kWh. By comparison, the price of a battery in 2019 was 156 USD/kWh. Similar downward trends are observed in the share of the price of lithium-ion batteries in the price of electric vehicles. By comparison, in 2015, the price of a battery accounted for 57.1% of a car’s value, and in 2021, it only accounted for 27.6%. The price of a battery is projected to make up 20.2% of the price of a vehicle in 2025.
In a comparative analysis of the cost of using electric cars and internal combustion engine cars, the cost of driving a distance of 100 kilometres in those two types of cars was compared. The analysis assumed charging the vehicle 80% from power outlets and 20% from public chargers. In addition, the energy consumption was assumed to be 15.3 kWh/100 km. With regard to the cost of use of an internal combustion engine car, the average price of gasoline was assumed to be equal to that prevailing in 2020, 0.94 USD/l, and the average mileage of an internal combustion engine car was assumed to be 6.7 l/100 km. Based on all these data, it was calculated that the cost of driving the distance of 100 km in an internal combustion engine car was USD 2.69, while for an electric car, it was equal to USD 2.00. Data were also projected on the total costs of 3 years of use of an electric car in relation to the distance travelled. Car models that are comparable in terms of operating parameters were used to project the costs: Volkswagen Golf 1.5 TSI DSG, Volkswagen Golf 2.0 TDI DSG (
https://pspa.com.pl/wp-content/uploads/2020/08/kompendium_elektromobilnosci_raport_2020_S.pdf (accessed on 26 November 2023)), and Volkswagen e-Golf. The costs associated with the consumption of electricity, gasoline, and diesel over the various distances were as follows:
30,000 km, electricity: USD 0.61, gasoline (PB95): USD 1.28, diesel: USD 1.78
60,000 km, electricity: USD 1.21, gasoline (PB95): USD 3.76, diesel: USD 1.35;
90,000 km, electricity: USD 1.82, gasoline (PB95): USD 5.64, diesel: USD 5.34.
The savings achieved after 3 years of using an electric car were equal to USD 3.82 compared to gasoline and USD 3.52 compared to diesel fuel.
Another study (Harto, 2020) shows that the cost per mile for an internal combustion engine vehicle over the first two hundred thousand miles travelled is double that of an electric vehicle (0.03 USD/mile for an electric vehicle and 0.06 USD/mile for an internal combustion engine vehicle) [
32].
The total repair and maintenance costs for electric vehicles and internal combustion engine vehicles were calculated. The average annual distance travelled was identified as 13,500 miles. The energy consumption was estimated at 4233 kWh each year. The cost of electricity was estimated based on California rates in 2021 at 0.199 USD/kWh. The average price of gasoline in 2021 on the west coast of the United States was 2.875 USD/gal, and the average mileage of a vehicle was 24.9 mpg. Taking all this data into account, it was estimated that the average total cost after 150,000 miles, including repairs and maintenance, was
$4150 for an electric vehicle and
$8350 for an internal combustion engine vehicle. These costs, divided into annual maintenance and so-called running costs, are equal to USD 1830 and USD 2716 for electric cars and internal combustion engine cars, respectively. This study was conducted for two vehicle models: the BMW iX3 (BEV) and the BMW X3 35i (ICEV) [
33].
However, the cost of owning an electric vehicle includes not only the initial purchase cost but also variable costs incurred over the period of ownership, such as repair and maintenance costs and electricity costs [
31,
33]. When comparing a Chevrolet Bolt (BEV) and a Volkswagen Golf (ICEV), it can be concluded that electric vehicles contain only about 21% of the moving parts that an internal combustion vehicle contains. Because they contain fewer components (which are at risk of damage and need to be repaired), electric vehicles gain an advantage in this regard. With no components subject to wear and tear, EV owners avoid the regular costs of services and repairs typically associated with owning a vehicle, such as changes of oil, fan belts, air filters, timing belts, head gaskets, cylinder heads, and spark plugs. In addition, brake pads in electric vehicles have a longer life due to the electric engine’s ability to brake on its own, which reduces wear on the brake pedal and reduces the pressure on the brake pads on the wheels [
31,
33].
To compare the total maintenance costs for the SME sector for both an internal combustion engine vehicle and an electric vehicle, the following services included in a lease contract must be considered:
- -
Financing
- -
Taxes
- -
Maintenance
- -
Tyres (summer and winter, if applicable)
- -
Insurance (comprehensive)
- -
Energy budget: fuel or electricity
As with fuel, the price of electricity varies depending on location, but these regional variations can be greater for electricity than for fuel. Fast charging along a highway can be much more expensive than charging at home, for example. Therefore, users who use 60% home charging, 30% workplace charging, and 10% public charging were assumed for the analysis. The duration of the contract is 48 months, and the annual distance travelled is 30,000 km. The vehicles compared are the Volkswagen Golf (ICEV) and Volkswagen ID.3 (EV).
Vehicle lease costs vary from country to country and is influenced by factors such as the local tax system, labour costs, fuel costs, and government EV incentives. Depreciation, insurance, and tyres are more expensive for electric vehicles, but taxes, maintenance, and energy are cheaper. In 2021, the price of electricity (EUR/kWh) and gasoline (EUR/litre) increased. Obviously, an increase in this cost component will lead to an increase in the overall TCO. However, the impact of energy price increases on an electric vehicle compared to the impact of the same energy price increase on an ICEV is different because electricity costs are a smaller part of the total cost of ownership than fuel costs. In the case of the Volkswagen ID.3, energy accounts for 11% of the total ownership costs, while in the case of the Volkswagen Golf, energy accounts for 22% of those costs. An increase in the price of electricity, therefore, has a different impact than an increase in the price of gasoline/diesel. For example, when the price of both electricity and fuel increases by 50%, this results in a 6% increase in the total cost for the Volkswagen ID.3, but an 11% increase in the total cost for the Volkswagen Golf. This shows that the ID.3 is more immune to energy price fluctuations than the Golf. In addition, the EV can be charged from renewable energy sources, and fluctuations in energy costs will not be felt at a similar level as fuel prices increase [
34]. Similar calculations can be found in the PKO BP S.A.’s Report, where two cars were compared in a long-term rental: the Nissan Qashqai 1.3 DIG-MHEV (ICEV) and the Nissan Leaf 40 kWh N-Connecta (EV). The total monthly costs of vehicle ownership are USD 515,81 and USD 477,86 for the ICEV and the BEV, respectively [
35].
Based on the above information on maintenance and repair costs of electric vehicles and internal combustion engine vehicles, it can be deduced that:
Battery prices for electric vehicles are steadily declining, which will result in price parity between internal combustion engine vehicles and electric vehicles within the next few years;
Due to their design, electric vehicles have far fewer moving parts that are subject to damage or failure, and, therefore, the number of repairs and maintenance operations they require is lower compared to internal combustion engine vehicles;
The total cost of ownership (TCO) of electric cars is also affected by electricity costs, but fluctuations in these costs have an insignificant effect on the change in the total cost of ownership of EVs.
3.2. Failure Rate
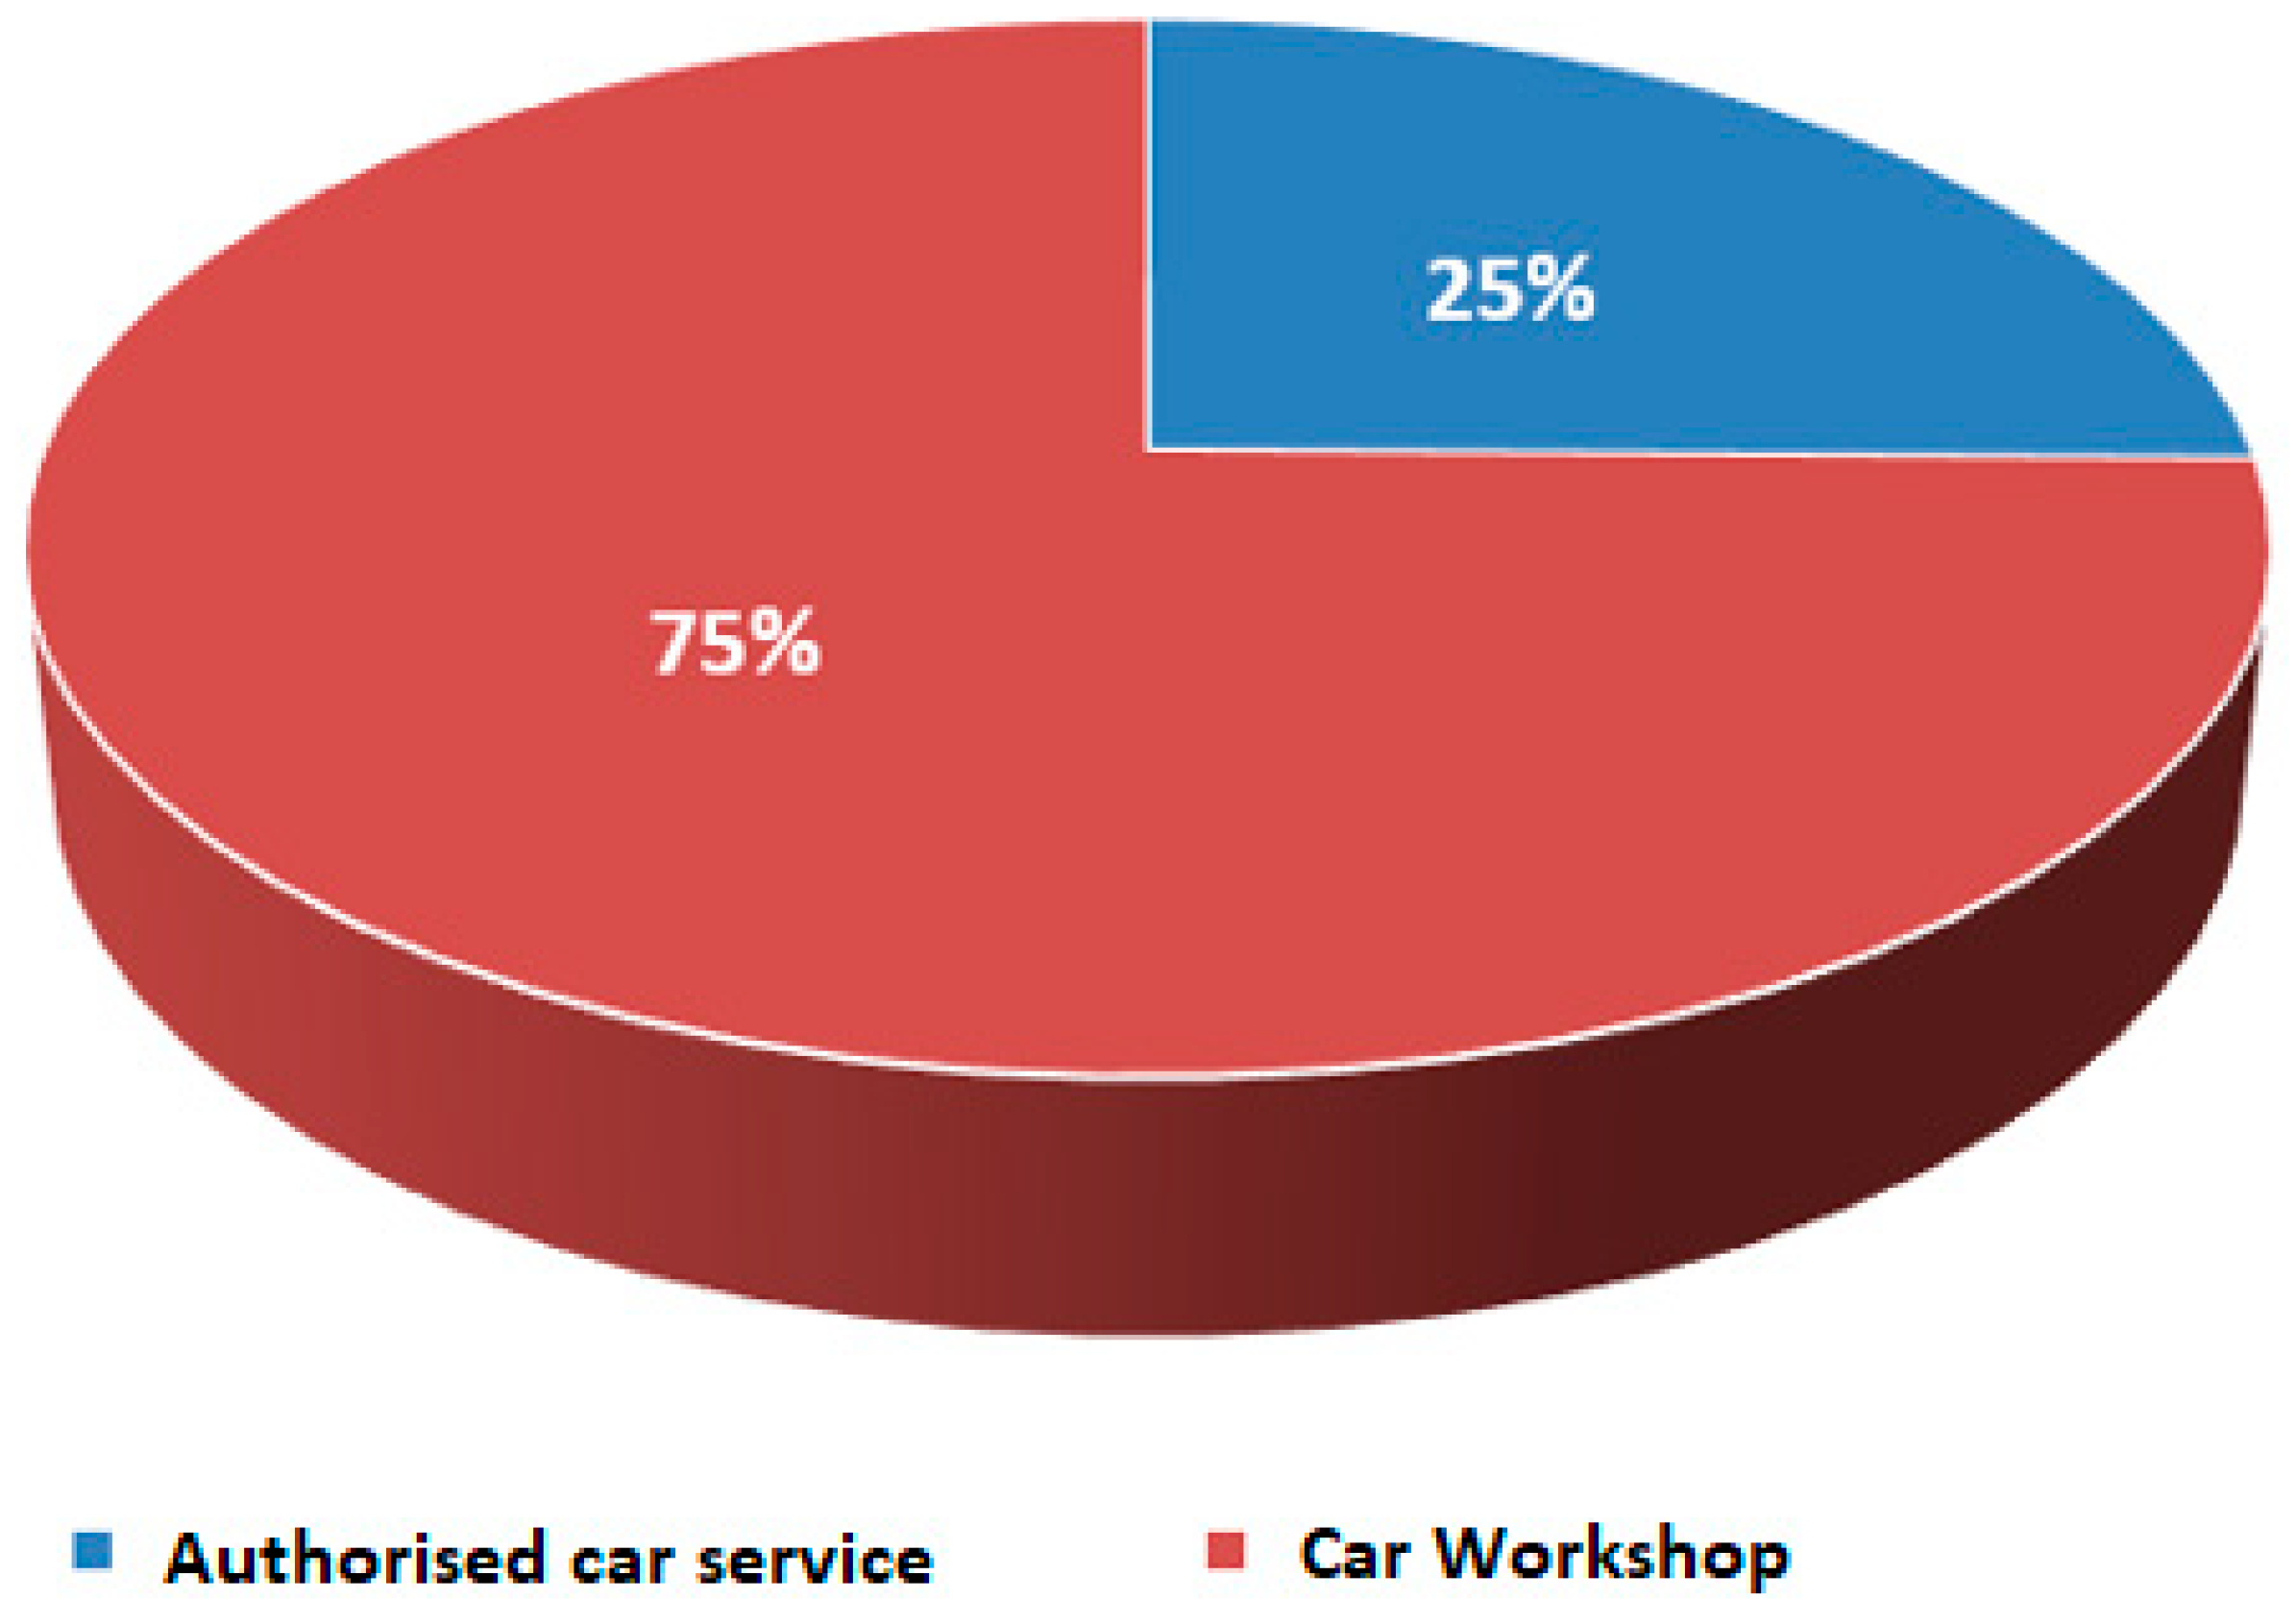
In question 1 on the type of company taking part in the survey, 75% of respondents were identified as a garage and 25% as an authorised repairer (
Figure 1).
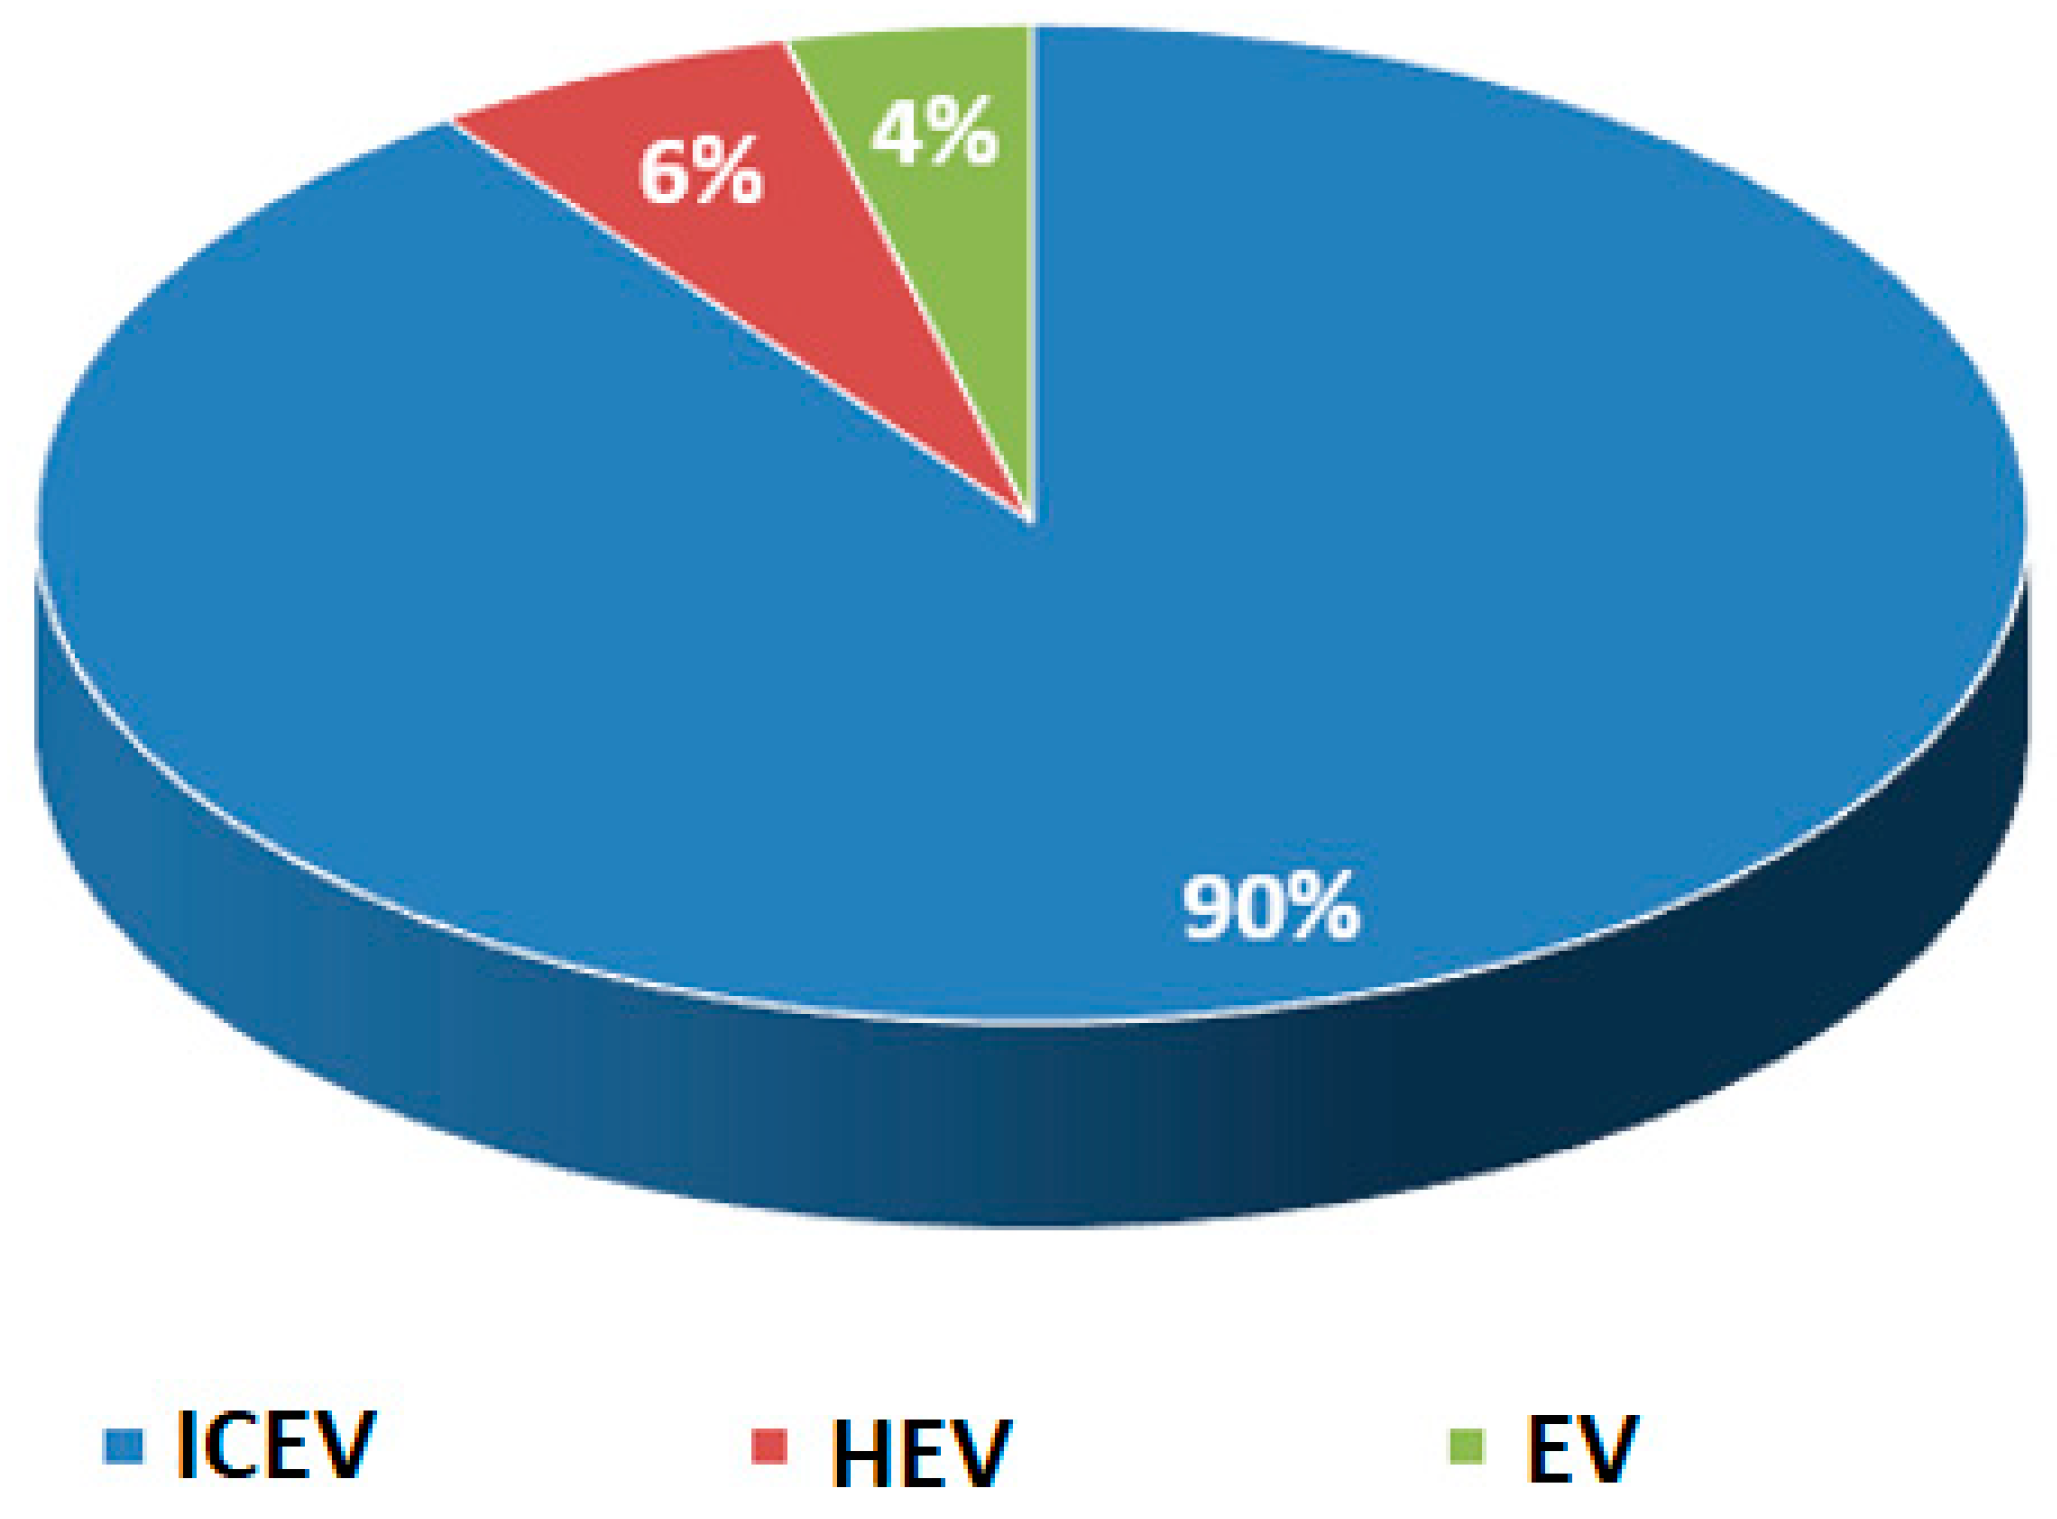
Respondents also answered the question, “Which types of vehicles are repaired/serviced in your company? What percentage of these repairs are individual vehicles?”. In 95% of the companies surveyed, internal combustion vehicles are the most commonly repaired, and these repairs account for over 90%. The remaining 10% of repairs in these companies are for hybrid and electric vehicles (
Figure 2). The research was expanded in a telephone interview to include the average number of repaired vehicles per month among all surveyed car workshops and authorised service centres (respondents), which was 500 vehicles. Among all vehicles repaired per month, there were an average of 20 pieces of electric vehicles and an average of 30 pieces of hybrid vehicles. The remaining number of vehicles (average 450 pieces) included internal combustion vehicles.
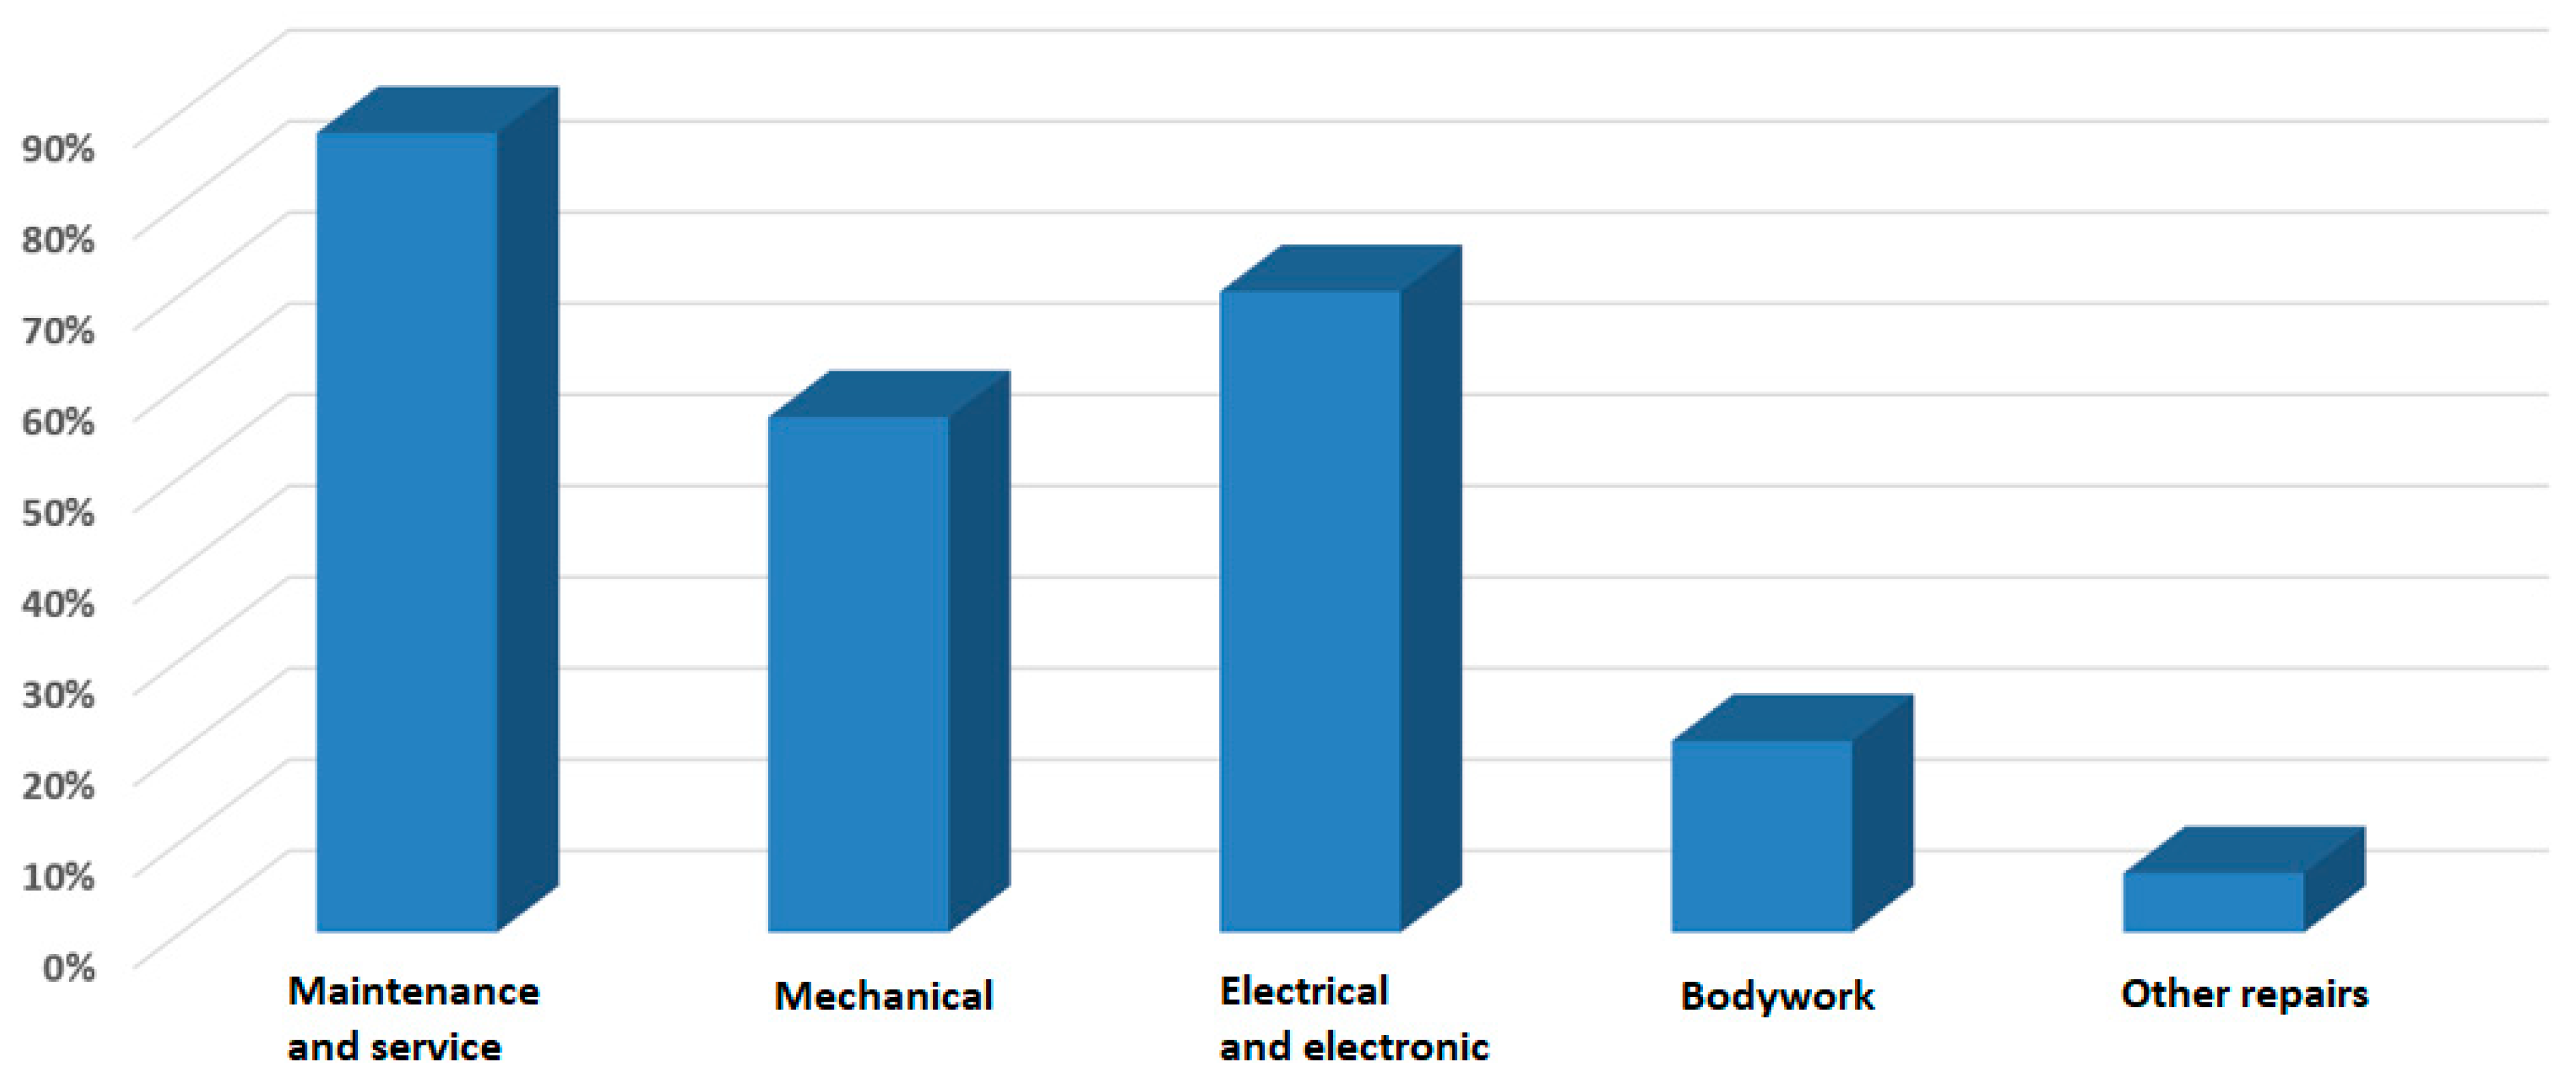
In the surveyed companies, the largest percentage of repairs are maintenance and service, mechanical, electrical and electronic, bodywork, and other repairs (
Figure 3).
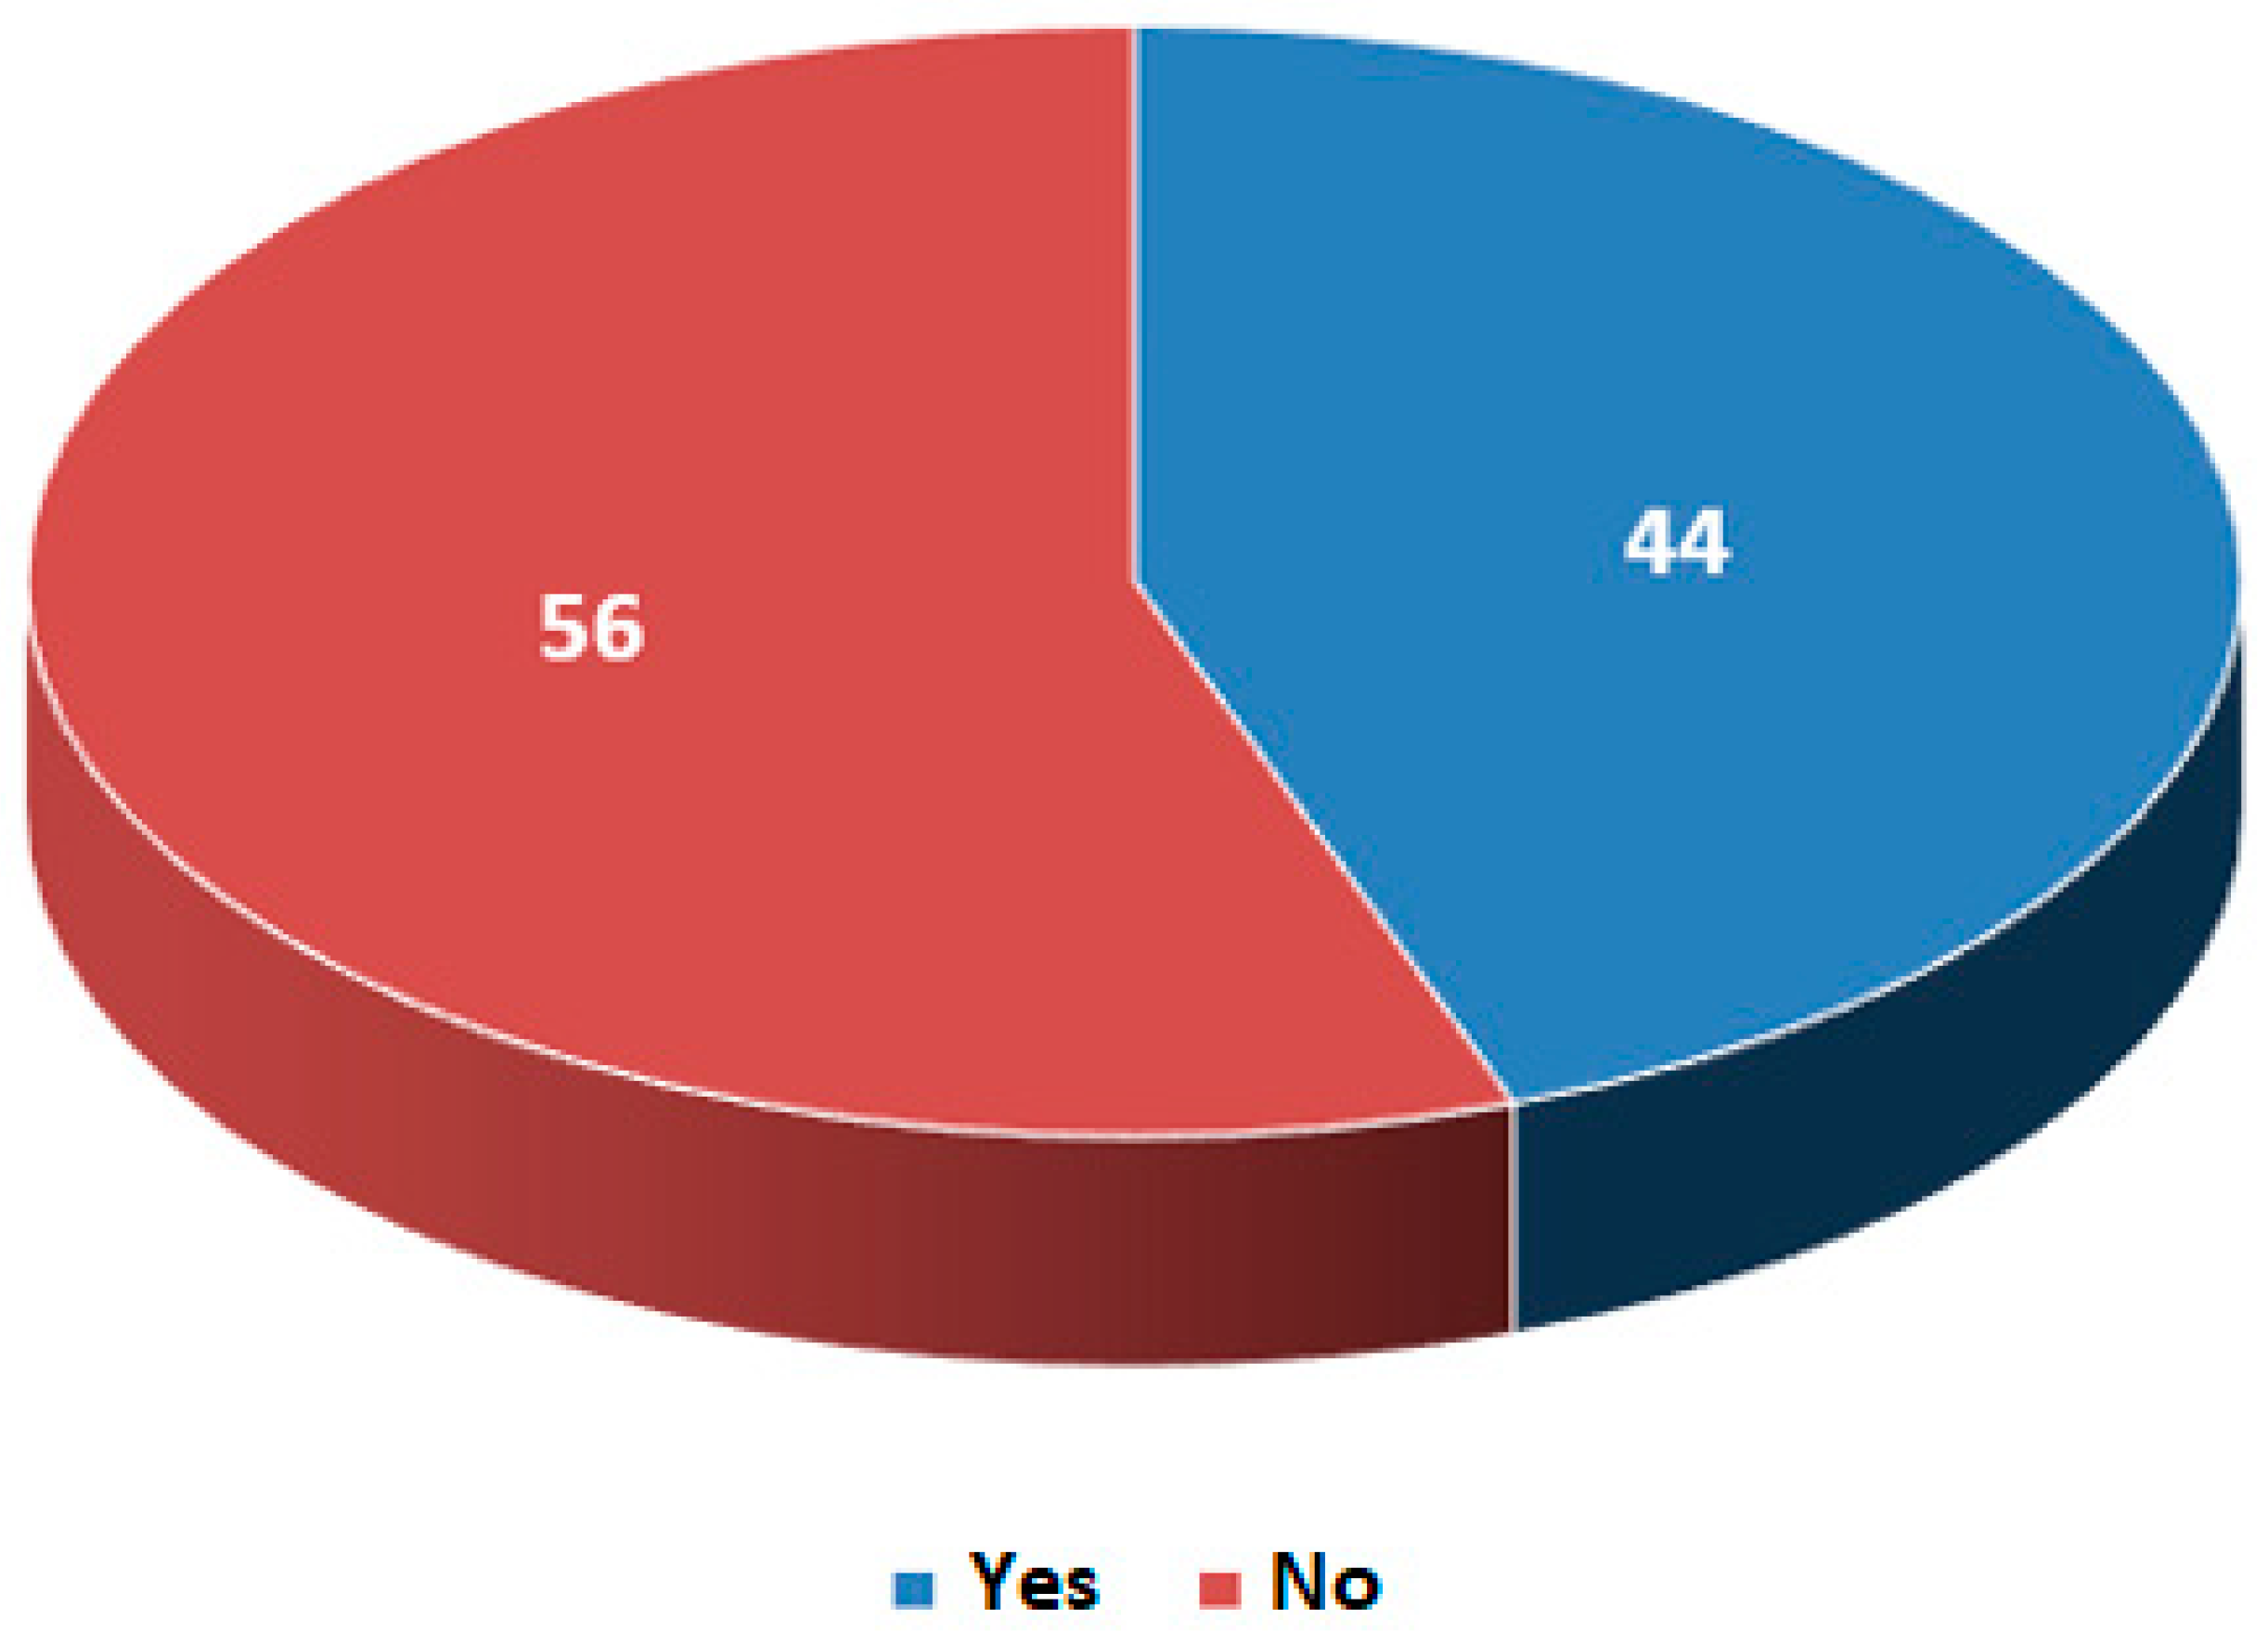
Referring to the literature sources for the most common faults in electric and hybrid vehicles, it was battery failures that were reported most by users.
Figure 4 shows the responses to the question, “Are electric and hybrid vehicle battery failures reported?”. As many as 56% of negative responses were given to this question, and 44% of responses were positive.
Among the respondents giving a positive answer, a request was made to elaborate on the topic of battery failure.
Table 7 shows the responses received:
Respondents were also asked what the most common failures of electric and hybrid vehicles are by make, model, vintage, and mileage of the vehicle.
Table 8 and
Table 9 summarise the answers given.
Based on the respondents’ answers, it can be seen that in hybrid and electric vehicles, there is no dependence on the make, model, mileage, and vintage of the vehicle on the type of failure. The failures vary widely, but the most common failure in electric vehicles is battery failure. In contrast, for hybrid cars, the most commonly cited failure is brake system failure. However, these do not depend on the combined vehicle characteristics.
The greatest variation among respondents’ answers occurred in the next question, which concerned the average repair time for an electric/hybrid vehicle. The responses yielded times ranging from 3 h to 7 days. Extremely, the time could extend to 14 days. The explanation for this discrepancy is the type of vehicle, the make and model, the condition of the vehicle, the availability of parts, the availability of a specialist with the appropriate competence to repair this type of vehicle, and the type of breakdown/fault. The average repair time (out of service) for an electric/hybrid vehicle, after discarding the extreme values, is 3 days.
The respondents then answered the question, “What are the inspection requirements for electric/hybrid vehicles?”. Several subcategories of questions were created in order to gain a closer insight into the specific operation of hybrid and electric vehicles.
Table 10 summarises the responses to the question asked. Annual maintenance is performed for both electric and hybrid vehicles, but this depends on the manufacturer’s guidelines and the mileage the vehicle has covered during its lifetime. However, mileage values are also different for each type (make and model) of car. The return to operation of the vehicle after servicing also varies. It depends on the availability of parts for the vehicle and the availability of a specialist with the skills and competence to repair electric and hybrid vehicles. The average lead time for an inspection of an electric or hybrid vehicle is a maximum of 1 day.


