Article

A Three-Dimensional Time-Dependent Model of the Degradation Caused by Chromium Poisoning in a Solid Oxide Fuel Cell Stack

1
Institute of Energy and Climate Research, Fundamental Electrochemistry (IEK-9), Forschungszentrum Jülich GmbH, D-52425 Jülich, Germany
2
Institute of Physical Chemistry, RWTH Aachen University, D-52074 Aachen, Germany
*
Author to whom correspondence should be addressed.
Energies 2023, 16(23), 7841; https://doi.org/10.3390/en16237841
Submission received: 24 October 2023 / Revised: 24 November 2023 / Accepted: 27 November 2023 / Published: 29 November 2023
(This article belongs to the Special Issue Hydrogen and Fuel Cell Technology, Modelling and Simulation II)

Abstract

:
Chromium poisoning strongly influences the performance of solid oxide fuel cell (SOFC) stacks. A novel numerical model is introduced by incorporating the chemical and electrochemical aspects of chromium poisoning. It offers a detailed analysis of the spatial distribution of critical chromium-based species, including SrCrO4 and Cr2O3. This model is integrated with a pre-existing three-dimensional, time-dependent computational fluid dynamics (CFD) toolbox, openFuelCell2. The numerical simulations indicate a quantitative agreement with experimental data over an extended 100 kh operation. Numerical simulations are conducted within a representative channel geometry originating from an F10 SOFC stack at Forschungszentrum Jülich GmbH, and consider a wide range of stack designs, temperatures, and air absolute humidities. The simulation results demonstrate the potential of a protective coating produced through atmospheric plasma spraying (APS) technology in nearly eliminating chromium poisoning. It is also found that the APS protective coating could enable the operation of an SOFC stack with low requirements of air dehumidification at a temperature of 650 C.

1. Introduction

Fuel cells are environmentally friendly energy conversion devices. They play an important role in the fields of transportation [1,2] and decentralized power systems [3]. Of the various fuel cell technologies, solid oxide fuel cells (SOFCs) are a promising future power supply technology due to their high efficiency, fuel flexibility, and ability to be coupled with the heating sector [4,5]. Currently, the mainstream material of SOFC interconnects is steel. The metal interconnect (MIC) provides strong support and acceptable conductivity at the intermediate temperature, but volatile chromium species (e.g., CrO2(OH)2 and CrO3) can be released by the oxide scale (e.g., Cr2O3) formed on the surface of the MIC, via the following reactions:
2 C r 2 O 3 ( s ) + 3 O 2 ( g ) + 4 H 2 O ( g ) 4 C r O 2 ( O H ) 2 ( g )
2 C r 2 O 3 ( s ) + 3 O 2 ( g ) 4 C r O 3 ( g )
The gaseous chromium species lead to drastic degradation in the air electrode through chromium poisoning [6,7,8], which has to be mitigated [9]. Numerical modeling can be helpful in studying chromium poisoning, as it can quantitatively predict the voltage degradation under different operation conditions and stack designs. However, only limited models of chromium poisoning can be found in the current literature. An example is the work in [10], in which a one-dimensional time-dependent simulation was performed to study the triple-phase boundary (TPB) and voltage evolution due to chromium poisoning in the composite air electrode consisting of (La,Sr)MnO3 and ZrO2−Y2O3 (LSM-YSZ). A Butler–Volmer expression was used to predict the decrease in the TPB as a result of chromium deposition. In other words, the model only considers chromium poisoning based on electrochemical reactions. The model was later extended to three dimensions [11]. Degradation of the TPB was found to be more likely at the interface between the air electrode and the electrolyte (AEL/EELC). A similar model was applied to study the local degradation in an 18-cell SOFC stack [12] and showed that chromium poisoning was the dominant degradation in the last period of operation.
Although the above models could be used to study chromium poisoning, and hence simulate the voltage degradation, they are designed for LSM-YSZ air electrodes and only consider electrochemical chromium poisoning. The state-of-the-art air electrode consists of a mixed ionic and electronic conductor, La0.58Sr0.4Co0.2Fe0.8O3- (LSCF), which exhibits a different scenario of degradation owing to chromium poisoning. For example, the formation of strontium chromate on the surface of air electrodes made by LSCF has been widely observed after fuel cell operation [7,13,14]. More importantly, several findings indicate that strontium chromate is probably generated via chemical reactions: (1) SrO segregation on the surface of LSCF was observed at high temperatures [15,16]; (2) thermodynamic calculations showed that SrO could react with gaseous chromium species to produce strontium chromate [17]; and (3) strontium chromate was found on the surface of LSCF under the open-circuit voltage condition [14]. The formation of strontium chromate should not be ignored in the model as it not only lowers the conductivity, but also decreases the reactive area of the air electrode.
Another drawback of the above models is that they do not account for the effect of the protective coating on the rib and the inner surface of air channels. However, the protective coating exists in a real SOFC stack and an inferior protective coating leads to more severe chromium poisoning. For example, it was shown that [18,19] an SOFC stack with a protective coating prepared by wet powder spraying (WPS) was more strongly degraded by chromium poisoning than one with a protective coating prepared by atmospheric plasma spraying (APS), as the former had a higher porosity whereas the latter was found to be fairly dense [20].
To improve the understanding of chromium poisoning in a real SOFC stack, a physical model coupling both electrochemical reactions and chemical reactions is useful. In this study, a three-dimensional computational fluid dynamics (CFD) model of a single channel of an F10 SOFC stack in Forschungszentrum Jülich GmbH (FZJ) is developed to consider chromium poisoning on the air electrode side and to investigate the resulting performance degradation of the F10 SOFC stack [21]. The voltage degradation due to decreasing reactive area during 100 kh of operation is simulated. The effects of temperature, the partial pressure of the steam in the air inlet, and different protective coatings on chromium poisoning are discussed.

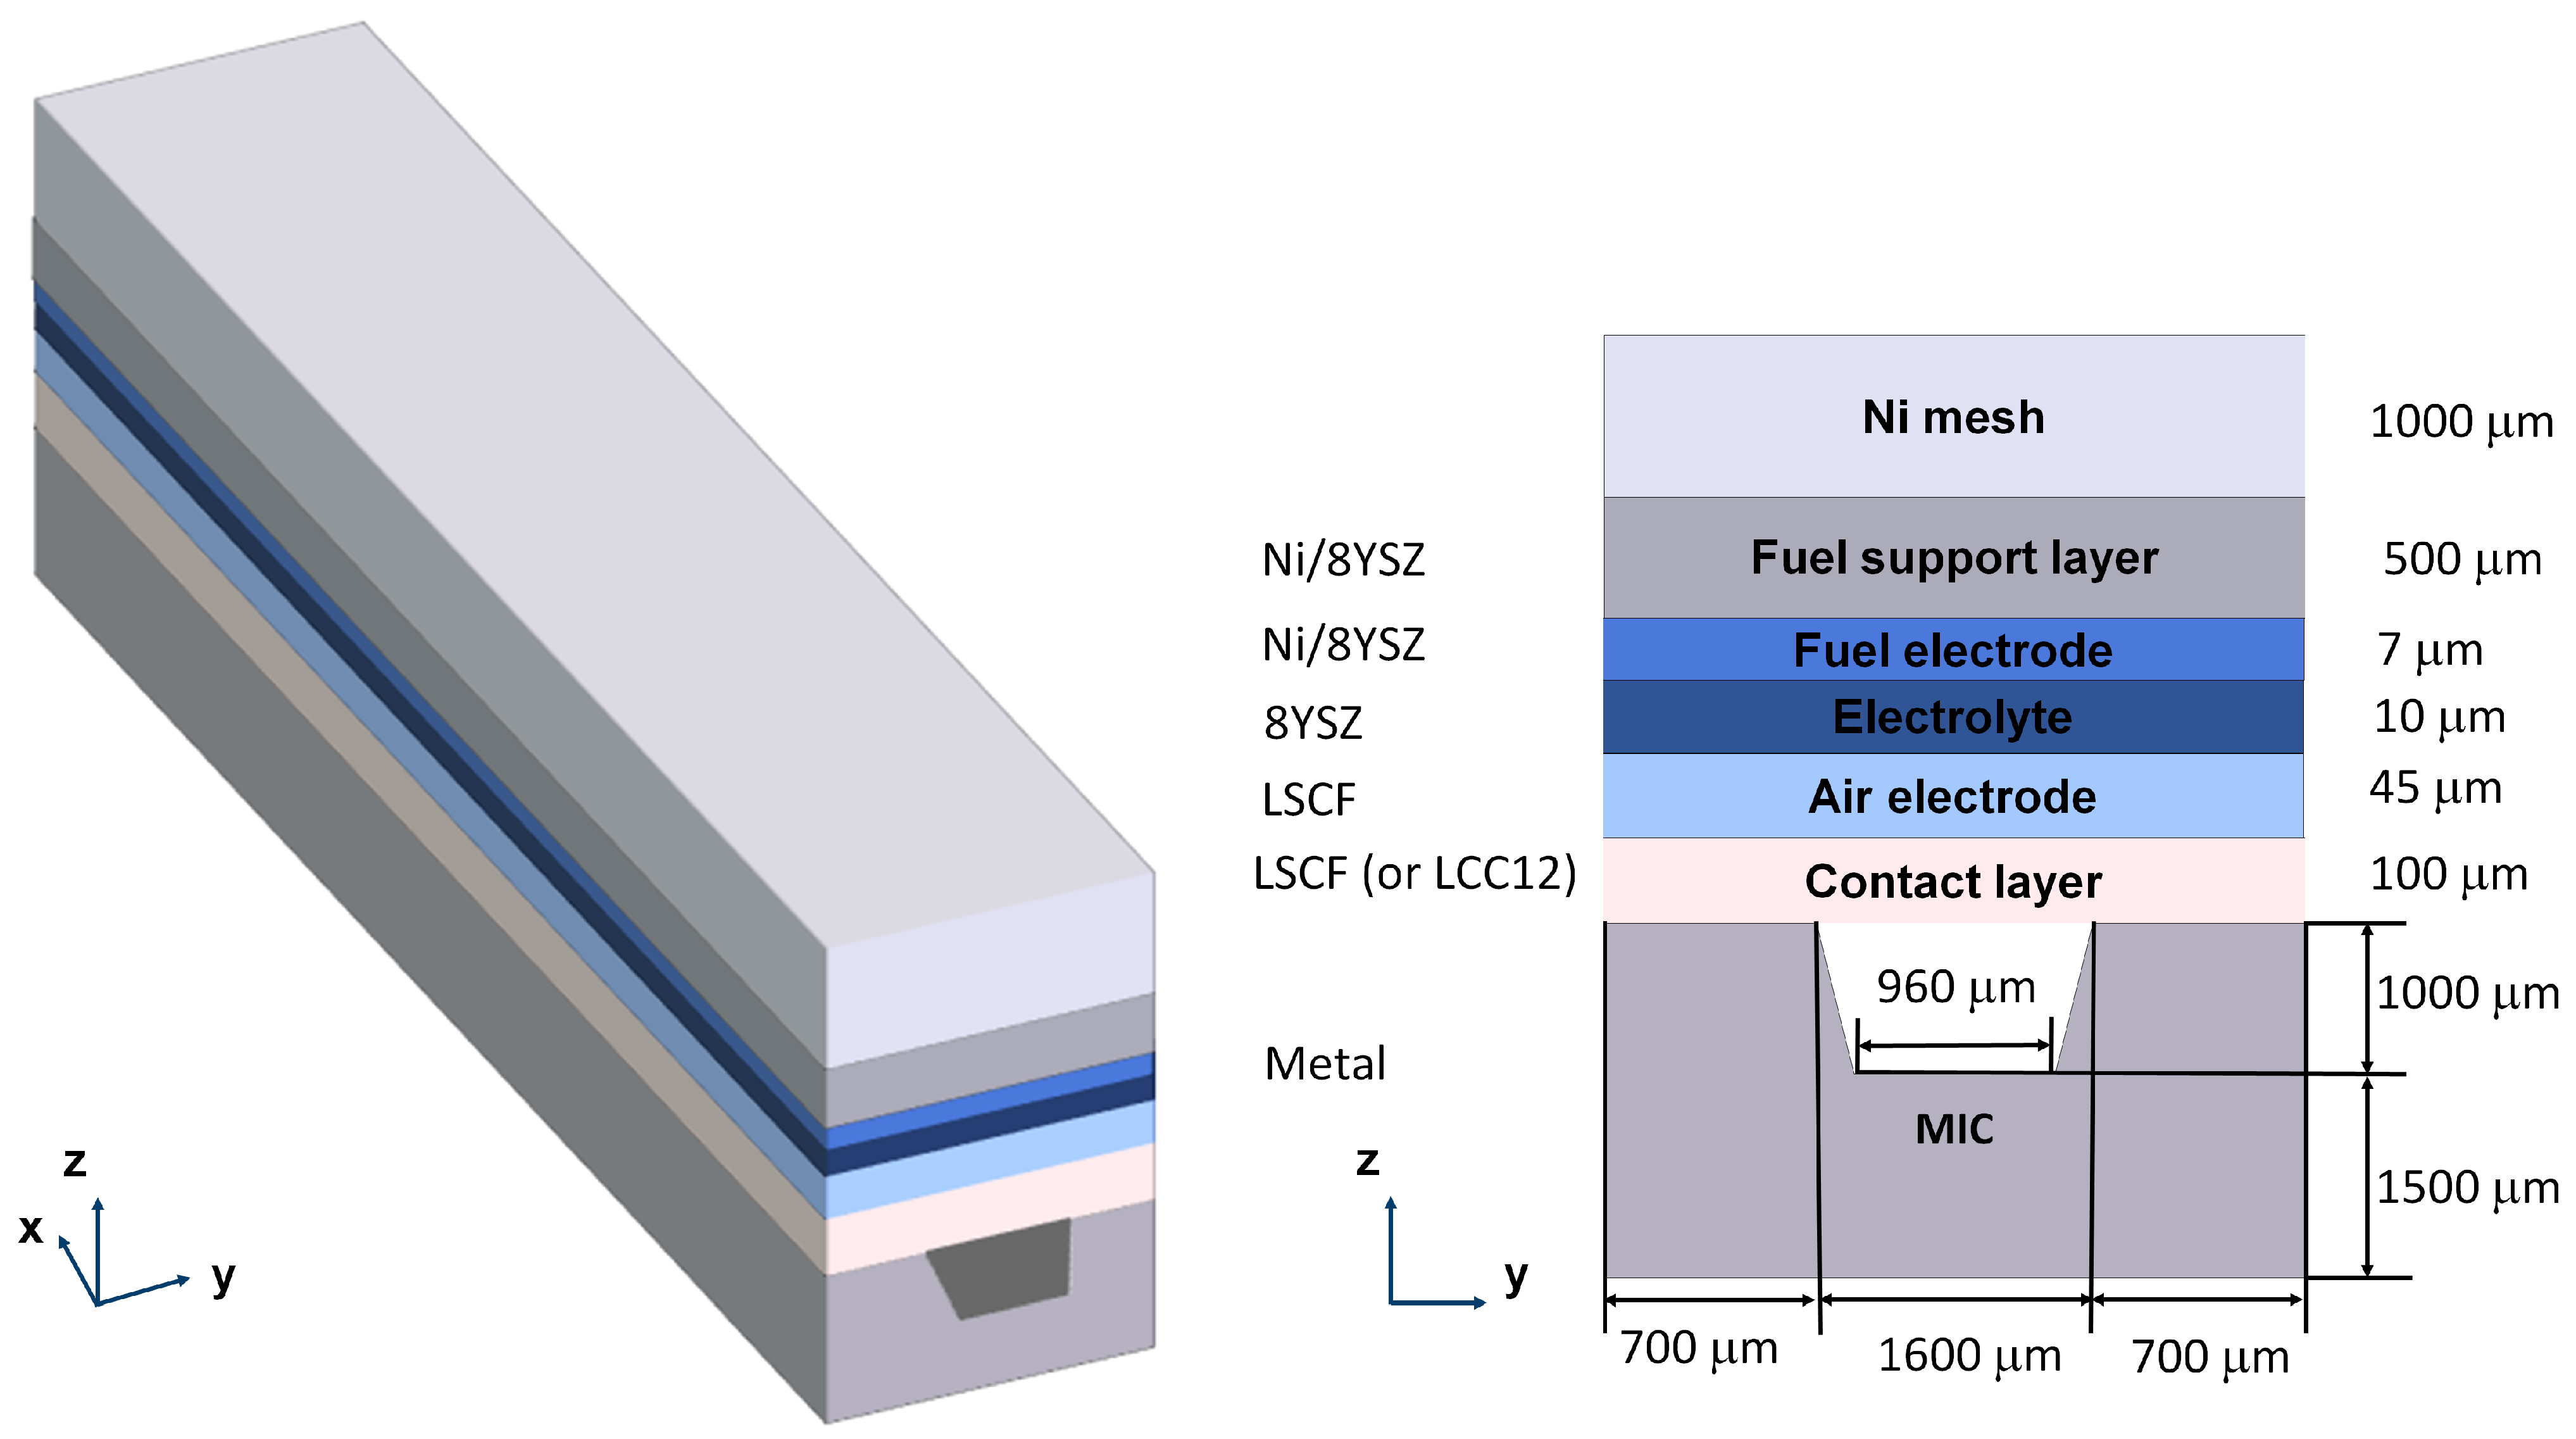
2. Geometry of the Model

The model considers one channel of the F10 SOFC stack in FZJ [21]. The geometry is shown in Figure 1, the details of which can be found in [22]. On the fuel side, a Ni mesh is chosen as the gas distributor. A thick fuel electrode support layer provides the necessary mechanical strength for the cell. A thin fuel electrode is applied where the electrochemical reaction takes place. Both the fuel electrode and the support layer are made of Ni/8 mol % ZrO2−Y2O3 (8YSZ). On the air side, LSCF is chosen as the material for the air electrode. There is a contact layer (CL) between the MIC and the air electrode (AEL). It is typically made of LSCF or La0.97Mn0.4Co0.3Cu0.3O3- (LCC12). Unlike LSCF, LCC12 serves additionally as the chromium getter since it can absorb chromium gaseous species by forming a stable Mn-Cr spinel phase [19]. In addition, there is no strontium segregation inside LCC12.
Additionally, there should be a protective coating on the rib and the inner surface of the air channel in a real SOFC stack to prevent chromium poisoning. It is simplified as a thin surface (no volume) in the model due to the computational cost, and its influence on chromium poisoning is considered in the boundary condition for the mass transport of chromium gaseous species. Further details can be found in Section 3.2.

3. Numerical Model

The numerical model in this work is an extension of our previous work, where a steady-state model was developed [22,23]. By adding a degradation model of chromium poisoning, the model becomes time-dependent. Only the governing equations and parameters related to chromium poisoning are presented in this work. Information about the steady-state model and parameters of the material properties, such as the conductivity and porosity of the electrodes, can be found in [22].

3.1. Assumptions

In order to develop the chromium poisoning model, three assumptions are made:
  • The model considers chromium poisoning exclusively on the air side. On the fuel side, due to the absence of oxygen, Reaction (1) and Reaction (2) should not happen [24].
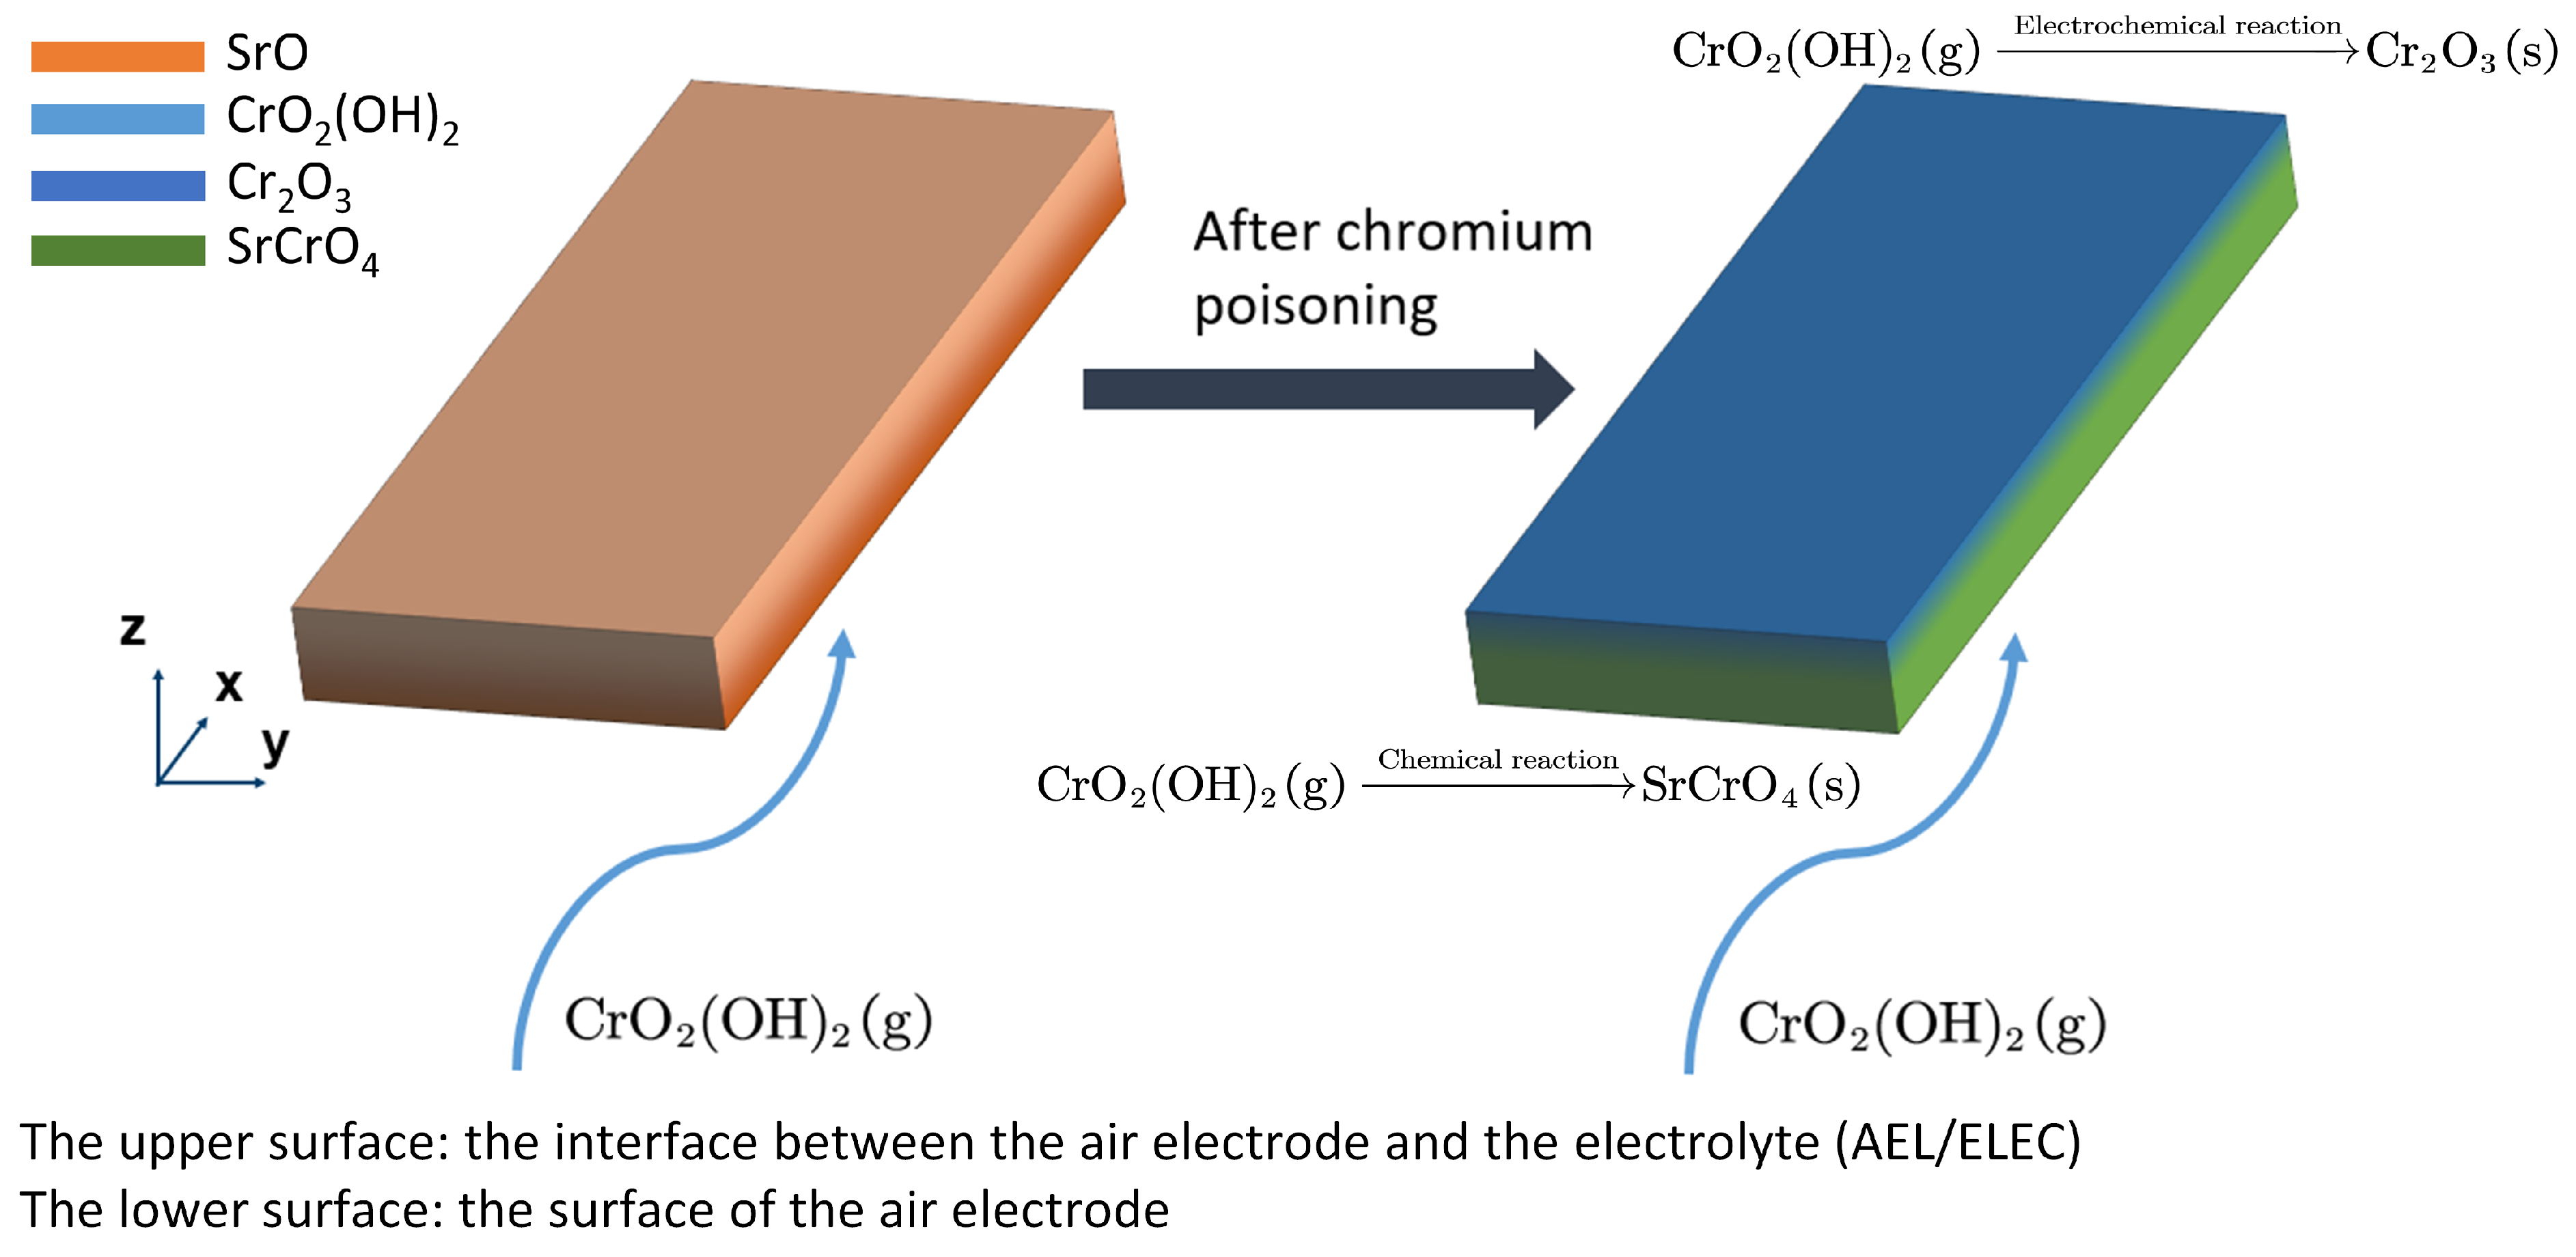
  • Only CrO2(OH)2 is considered for chromium poisoning. Thermodynamic calculations [25] showed that even in the case of a low water partial pressure (e.g., ∼0.1% atm), the molar concentration of CrO2(OH)2 is two orders of magnitude higher than that of CrO3 at the operation temperature of the SOFC stacks considered here (∼700 C).
  • The degradation only arises from the decreasing reactive area of LSCF due to chromium deposition processes. Other factors that can also lead to degradation, such as material fractures and lowered conductivity due to the formation of secondary phases, are currently not considered in the model.

3.2. Mass Transport of CrO2(OH)2

The mass transport of CrO2(OH)2 is governed by
( c Y CrOH ) t + · ( c U Y CrOH ) + · N CrOH = S o u r c e mole , CrOH
where c is the molar density of the air, Y CrOH is the molar fraction of CrO2(OH)2 in the air, U is the velocity of the air that is solved from the momentum transport equation [22], N CrOH is the molar diffusion flux of CrO2(OH)2, and S o u r c e mole , CrOH is the source term of moles of CrO2(OH)2, which is related to the adsorption of CrO2(OH)2 on the LSCF surface, and its definition can be found in Appendix A. Fick’s law [26,27] is used to solve the molar flux, given by the following equation:
N CrOH = D CrOH , air ( c Y CrOH )
where D CrOH , air is the diffusion coefficient of CrO2(OH)2 in the air.
In order to solve Equation (3), the boundary condition of Y CrOH needs to be determined. It is assumed that CrO2(OH)2 only originates from the rib and the inner surface of the air channel according to Reaction (1). Following Refs. [28,29], Reaction (1) reaches the thermal equilibrium on the rib and the inner surface of the air channel and therefore the molar fraction of CrO2(OH)2 at the surface of an air channel without any coatings, Y CrOH , uncoated , can be calculated as
Y CrOH , uncoated = ( K CrOH · Y H 2 O 4 · Y O 2 3 ) 0.25
where K CrOH is the thermal equilibrium constant of Reaction (1), Y H 2 O is the molar fraction of H2O in the air and Y O 2 is the molar fraction of the O2 in the air. According to the database summarized by Ebbinghaus [25], K CrOH is
K CrOH = 10 12262 / T [ K ] 5.2
where T is the temperature. It should be noted that Equation (5) is valid for surfaces without any coatings. However, in a real FZJ SOFC stack, there is usually a protective coating on the rib and the inner surface of the air channel preventing chromium poisoning. To consider the protecting effect, the surface-averaged molar fraction, Y CrOH , is used. For each mesh grid, the surface-average molar fraction at the surface of the air channel and the rib is calculated by including the porosity of the protective coating, ε coating , i , to Equation (5) as follows:
Y CrOH = A uncoated Y CrOH , uncoated A = ε coating , i · ( K CrOH · Y H 2 O 4 · Y O 2 3 ) 0.25
where A is the surface area of the whole mesh surface, A uncoated is the uncoated surface area, and i refers to the technique for fabricating the coating.

3.3. The Kinetic Model of Chromium Poisoning

When chromium gaseous species are adsorbed onto the LSCF surface, the reactive surface decreases and it is consequently more difficult for oxygen to be adsorbed and have electrochemical reactions on the LSCF surface. To model this process, a kinetic model that can predict the free adsorption area on the LSCF surface is needed. This section will introduce the Langmuir model to describe the adsorption and desorption first. Then, electrochemical and chemical reactions are considered for the adsorbate to calculate the surface coverage of free adsorption sites.
Based on the Langmuir model [30,31], when gas molecules are adsorbed onto the surface of LSCF, the change in the surface coverage can be described by
d Θ i d t = k a , i Θ free k d , i Θ i
where Θ i is the surface coverage of the adsorbate i, k a , i is the adsorption rate of the species i, Θ free is the free-surface coverage that can be adsorbed and k d , i is the desorption rate of the species i. k a , i can be obtained through the Langmuir–Hertz equation [32] as follows:
k a , i = S i P i Γ LSCF 2 π M i R T
where S i is the sticking coefficient of the species i, P i is the partial pressure of the species i, Γ LSCF is the density of the adsorption sites on LSCF surface, M i is the molar mass of the species i, and R is the universal gas constant. k d , i generally can be calculated using [32]
k d , i = k a , i exp Δ G ads , i R T
where Δ G ads , i is the Gibbs free energy change when species i is adsorbed onto the LSCF surface.
In addition to adsorption and desorption between the gas and the surface of LSCF, there are two reactions related to chromium poisoning. Figure 2 illustrates how chromium poisoning takes place inside the AEL made of LSCF. At the surface of the AEL, due to strontium segregation (see the left figure in Figure 2), the chemical reaction generating SrCrO4 is dominating, which happens on the LSCF surface via [33]
C r O 2 ( O H ) 2 ( L S C F ) + S r O ( L S C F ) k eleChemCr S r C r O 4 ( L S C F ) + H 2 O ( L S C F ) Δ G SrCrO 4
where k chemCr and Δ G SrCrO 4 are the rate of the surface coverage change due to the reaction and the Gibbs free energy change of the reaction (11), respectively. The method of determining Δ G SrCrO 4 is given in Appendix B.
As CrO2(OH)2 diffuses deeper towards the AEL/ELEC, the overpotential gradually decreases (to be more negative), which is likely to result in the electrochemical reaction being non-negligible [6] (as shown in Figure 2, right). The electrochemical reaction is
C r O 2 ( O H ) 2 ( L S C F ) + 3 e k eleChemCr 0.5 C r 2 O 3 ( L S C F ) + 1.5 O 2 ( L S C F ) + H 2 O ( L S C F )
where k eleChemCr is the rate of the surface coverage change due to Reaction (12). Similar to Refs. [10,11], in this work a Butler–Volmer-type expression is employed to describe k eleChemCr :
k eleChemCr = k eleChemCr , 0 P CrO 2 OH 2 0.5 / P H 2 O 0.5 2 sinh 3 F 2 R T η air
where η air is the overpotential in the AEL. k eleChemCr , 0 is chosen as −5 × 10⁻⁸ s−1 in the model.
Considering all these processes and assuming the chemical reaction (11) obeys the thermal equilibrium [34], the kinetic model for chromium poisoning is summarized as follows:
d Θ H 2 O d t = k a , H 2 O Θ free k d , H 2 O Θ H 2 O + k chemCr Θ CrOH Θ SrO + k eleChemCr Θ C r O H
d Θ S r O d t = k chemCr Θ CrOH Θ SrO
d Θ S r C r O 4 d t = k chemCr Θ CrOH Θ SrO
d Θ C r O H d t = k a , C r O H Θ free k d , C r O H Θ C r O H k chemCr Θ CrOH Θ SrO k eleChemCr Θ C r O H
d Θ C r 2 O 3 d t = 0.5 k eleChemCr Θ CrOH
Θ H 2 O + Θ S r O + Θ S r C r O 4 + Θ C r O H + Θ C r 2 O 3 + Θ free = 1
K S r C r O 4 = Θ S r C r O 4 Θ H 2 O Θ SrO Θ CrOH
where the subscript “H2O”, “SrO”, “SrCrO4”, “CrOH”, and “Cr2O3” denote the chemical species of H2O, SrO, SrCrO4, CrO2(OH)2, and Cr2O3, respectively. K SrCrO 4 is the thermal equilibrium constant of Reaction (11), defined as K SrCrO 4 = exp Δ G SrCrO 4 R T . k chemCr can be obtained from Equation (20) by obtaining the time derivatives for both sides of the equation as follows:
d Θ SrCrO 4 Θ H 2 O d t = K SrCrO 4 d Θ C r O H Θ SrO d t k chemCr = K SrCrO 4 k a , CrOH Θ free Θ SrO k d , CrOH + k eleChemCr Θ SrO Θ C r O H d e n Θ SrCrO 4 k eleChemCr Θ C r O H k d , H 2 O Θ H 2 O + k a , H 2 O Θ free d e n
where d e n is
d e n = Θ C r O H Θ SrO Θ H 2 O + Θ SrCrO 4 Θ C r O H Θ SrO + K SrCrO 4 Θ SrO 2 Θ C r O H + K SrCrO 4 Θ SrO Θ C r O H 2
Oxygen can only be adsorbed and have electrochemical reactions on Θ free . It is supposed that the reaction current density in the AEL, i v , air , is proportional to Θ free [10,32], and i v , air can be rewritten as follows:
i v , air = Θ free η air R air exp ( E a , air R T ) a O 2 0.25
Equation (23) is based on the definition of i v , air in [22], where more details can be found.
Parameters used in the model can be found in Table A2.

4. Numerical Setting

The simulation was carried out with the help of openFuelCell2 [23], which was been coupled with an open-source library, OpenFOAM. The time derivative was discretized using the backward Euler method. The IDA package in SUNDIALS [35,36] was used to solve Equations (14)–(19). All the simulations were carried out on a single core of a computer (the operating system was Linux, CentOS 9) with CPU i7-9700K and 32 GB RAM. Figure 3 illustrates the procedures of numerical calculation used in this work, while Table 1 presents the governing equations of the chromium poisoning model and their computational domains.

5. Results

When analyzing the simulated U–t curves, it should be noted that the model in this work considers the decreasing reactive area of LSCF owing to chromium poisoning as the only degradation mechanism. Table 2 presents three stacks for simulation, where stack designs (e.g., materials of CLs and fabrication techniques for protective coatings) and operation conditions are given.

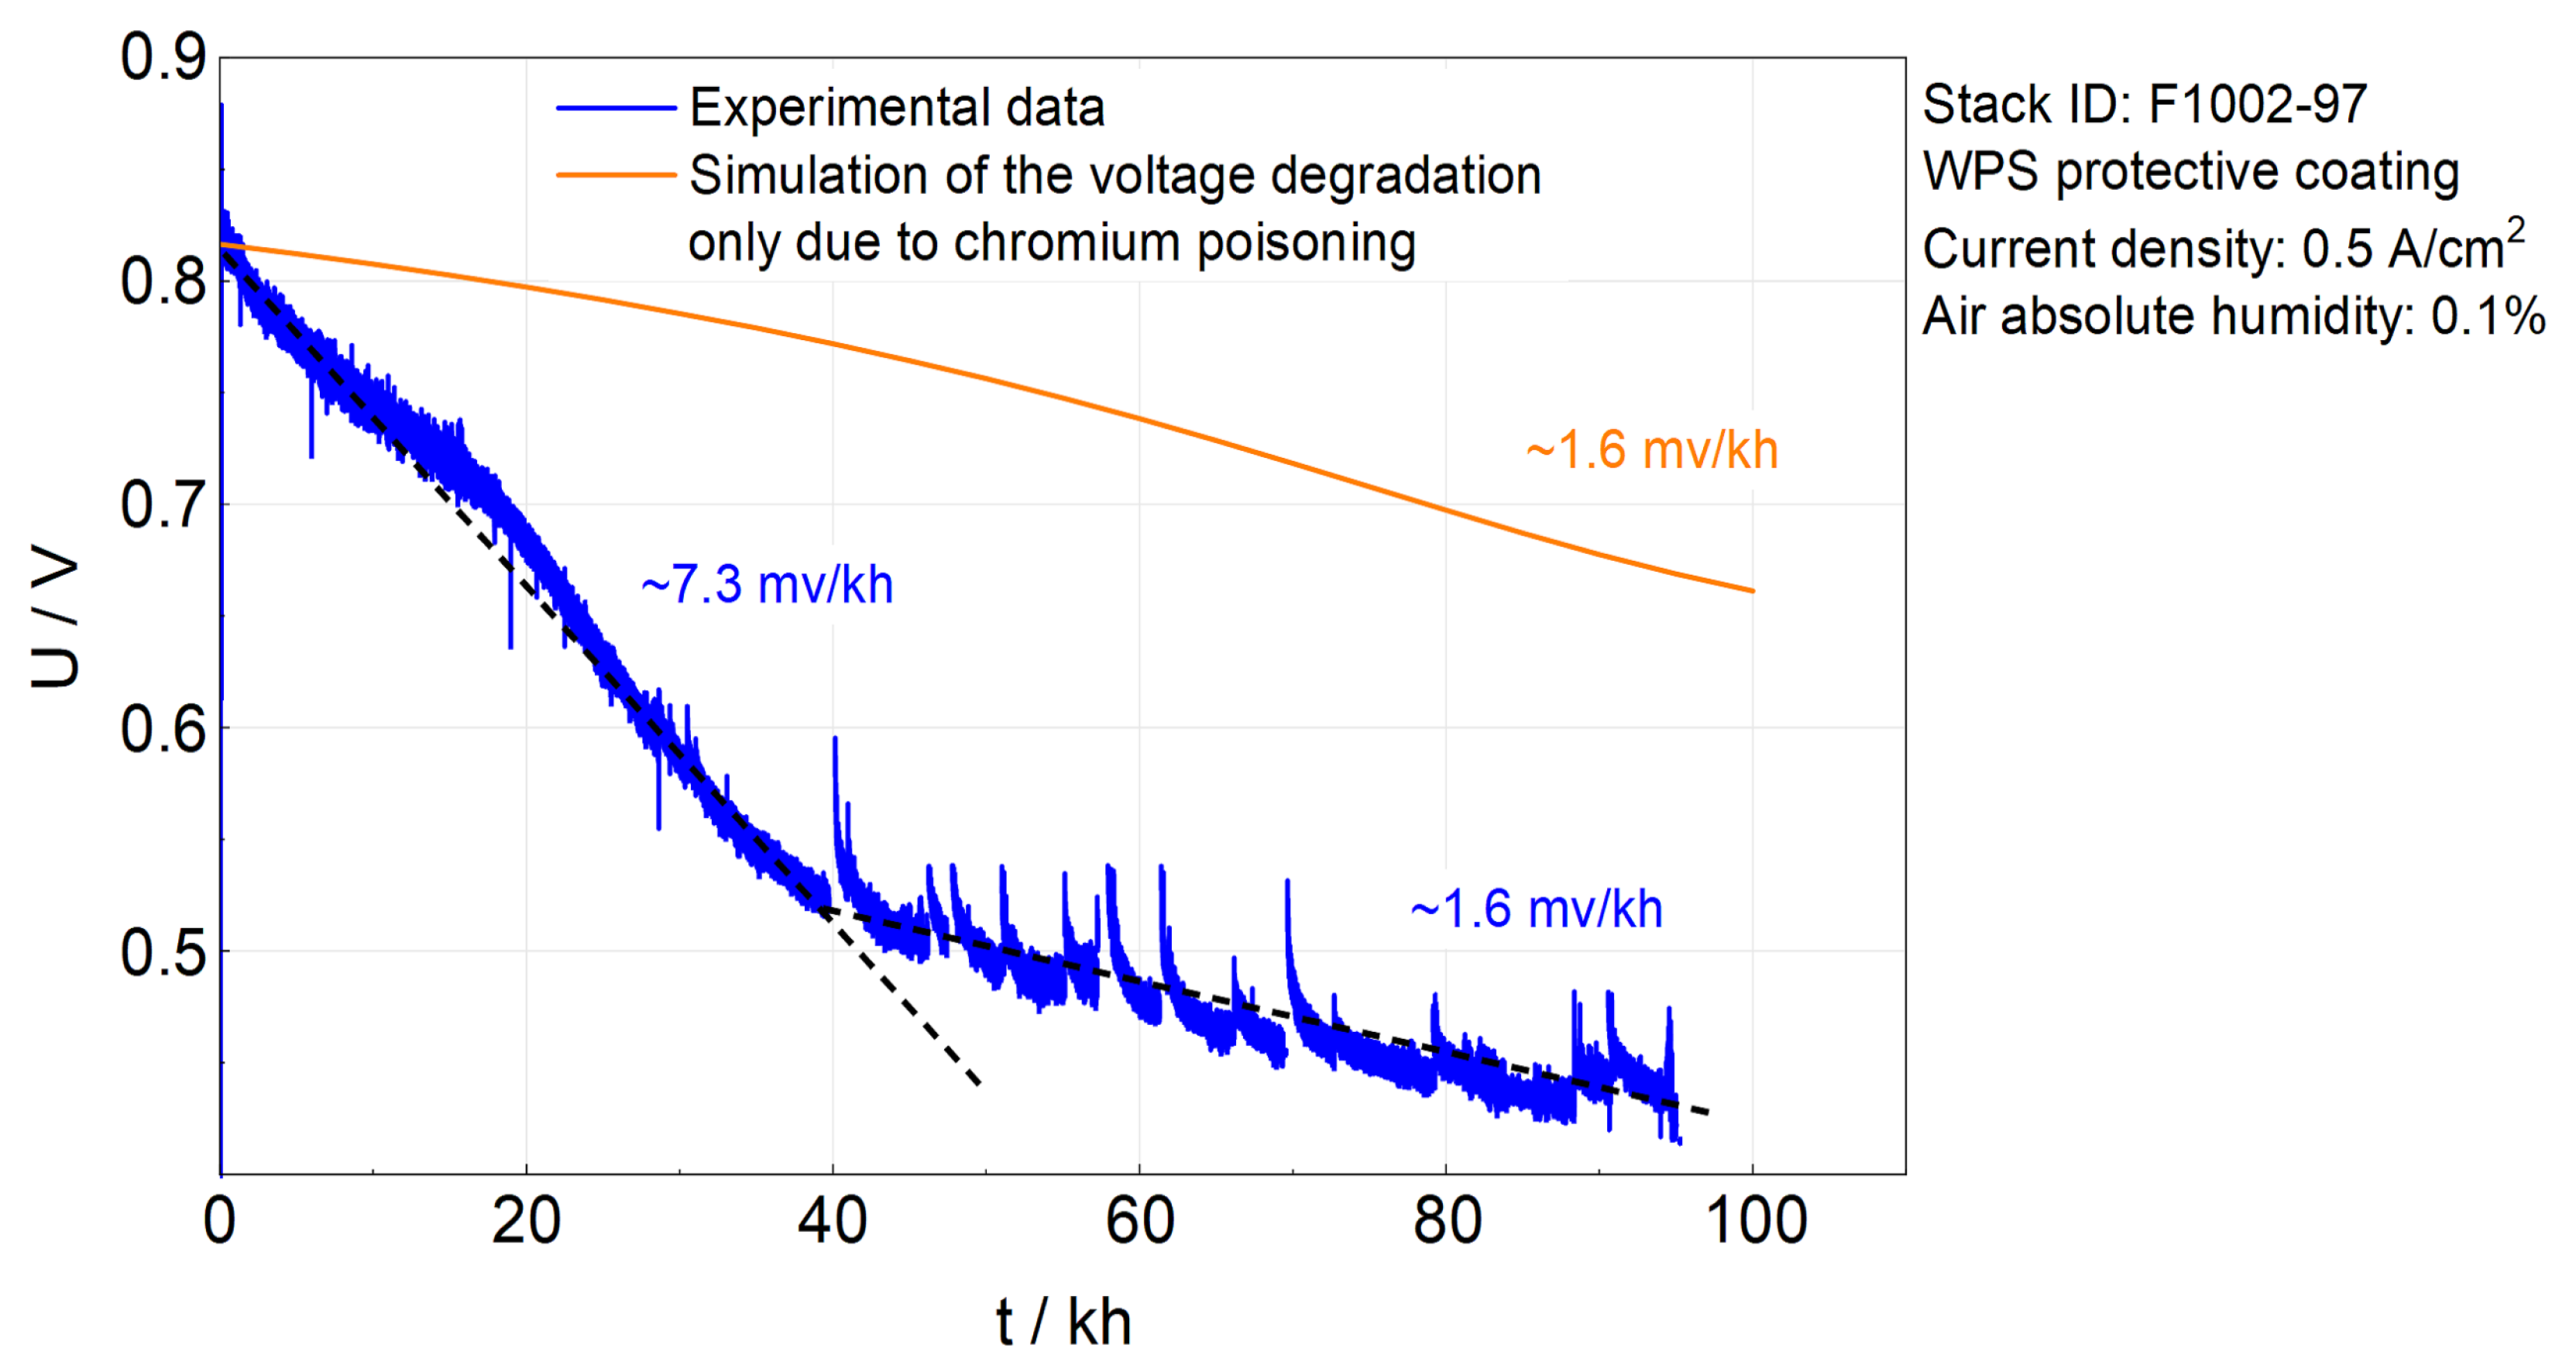
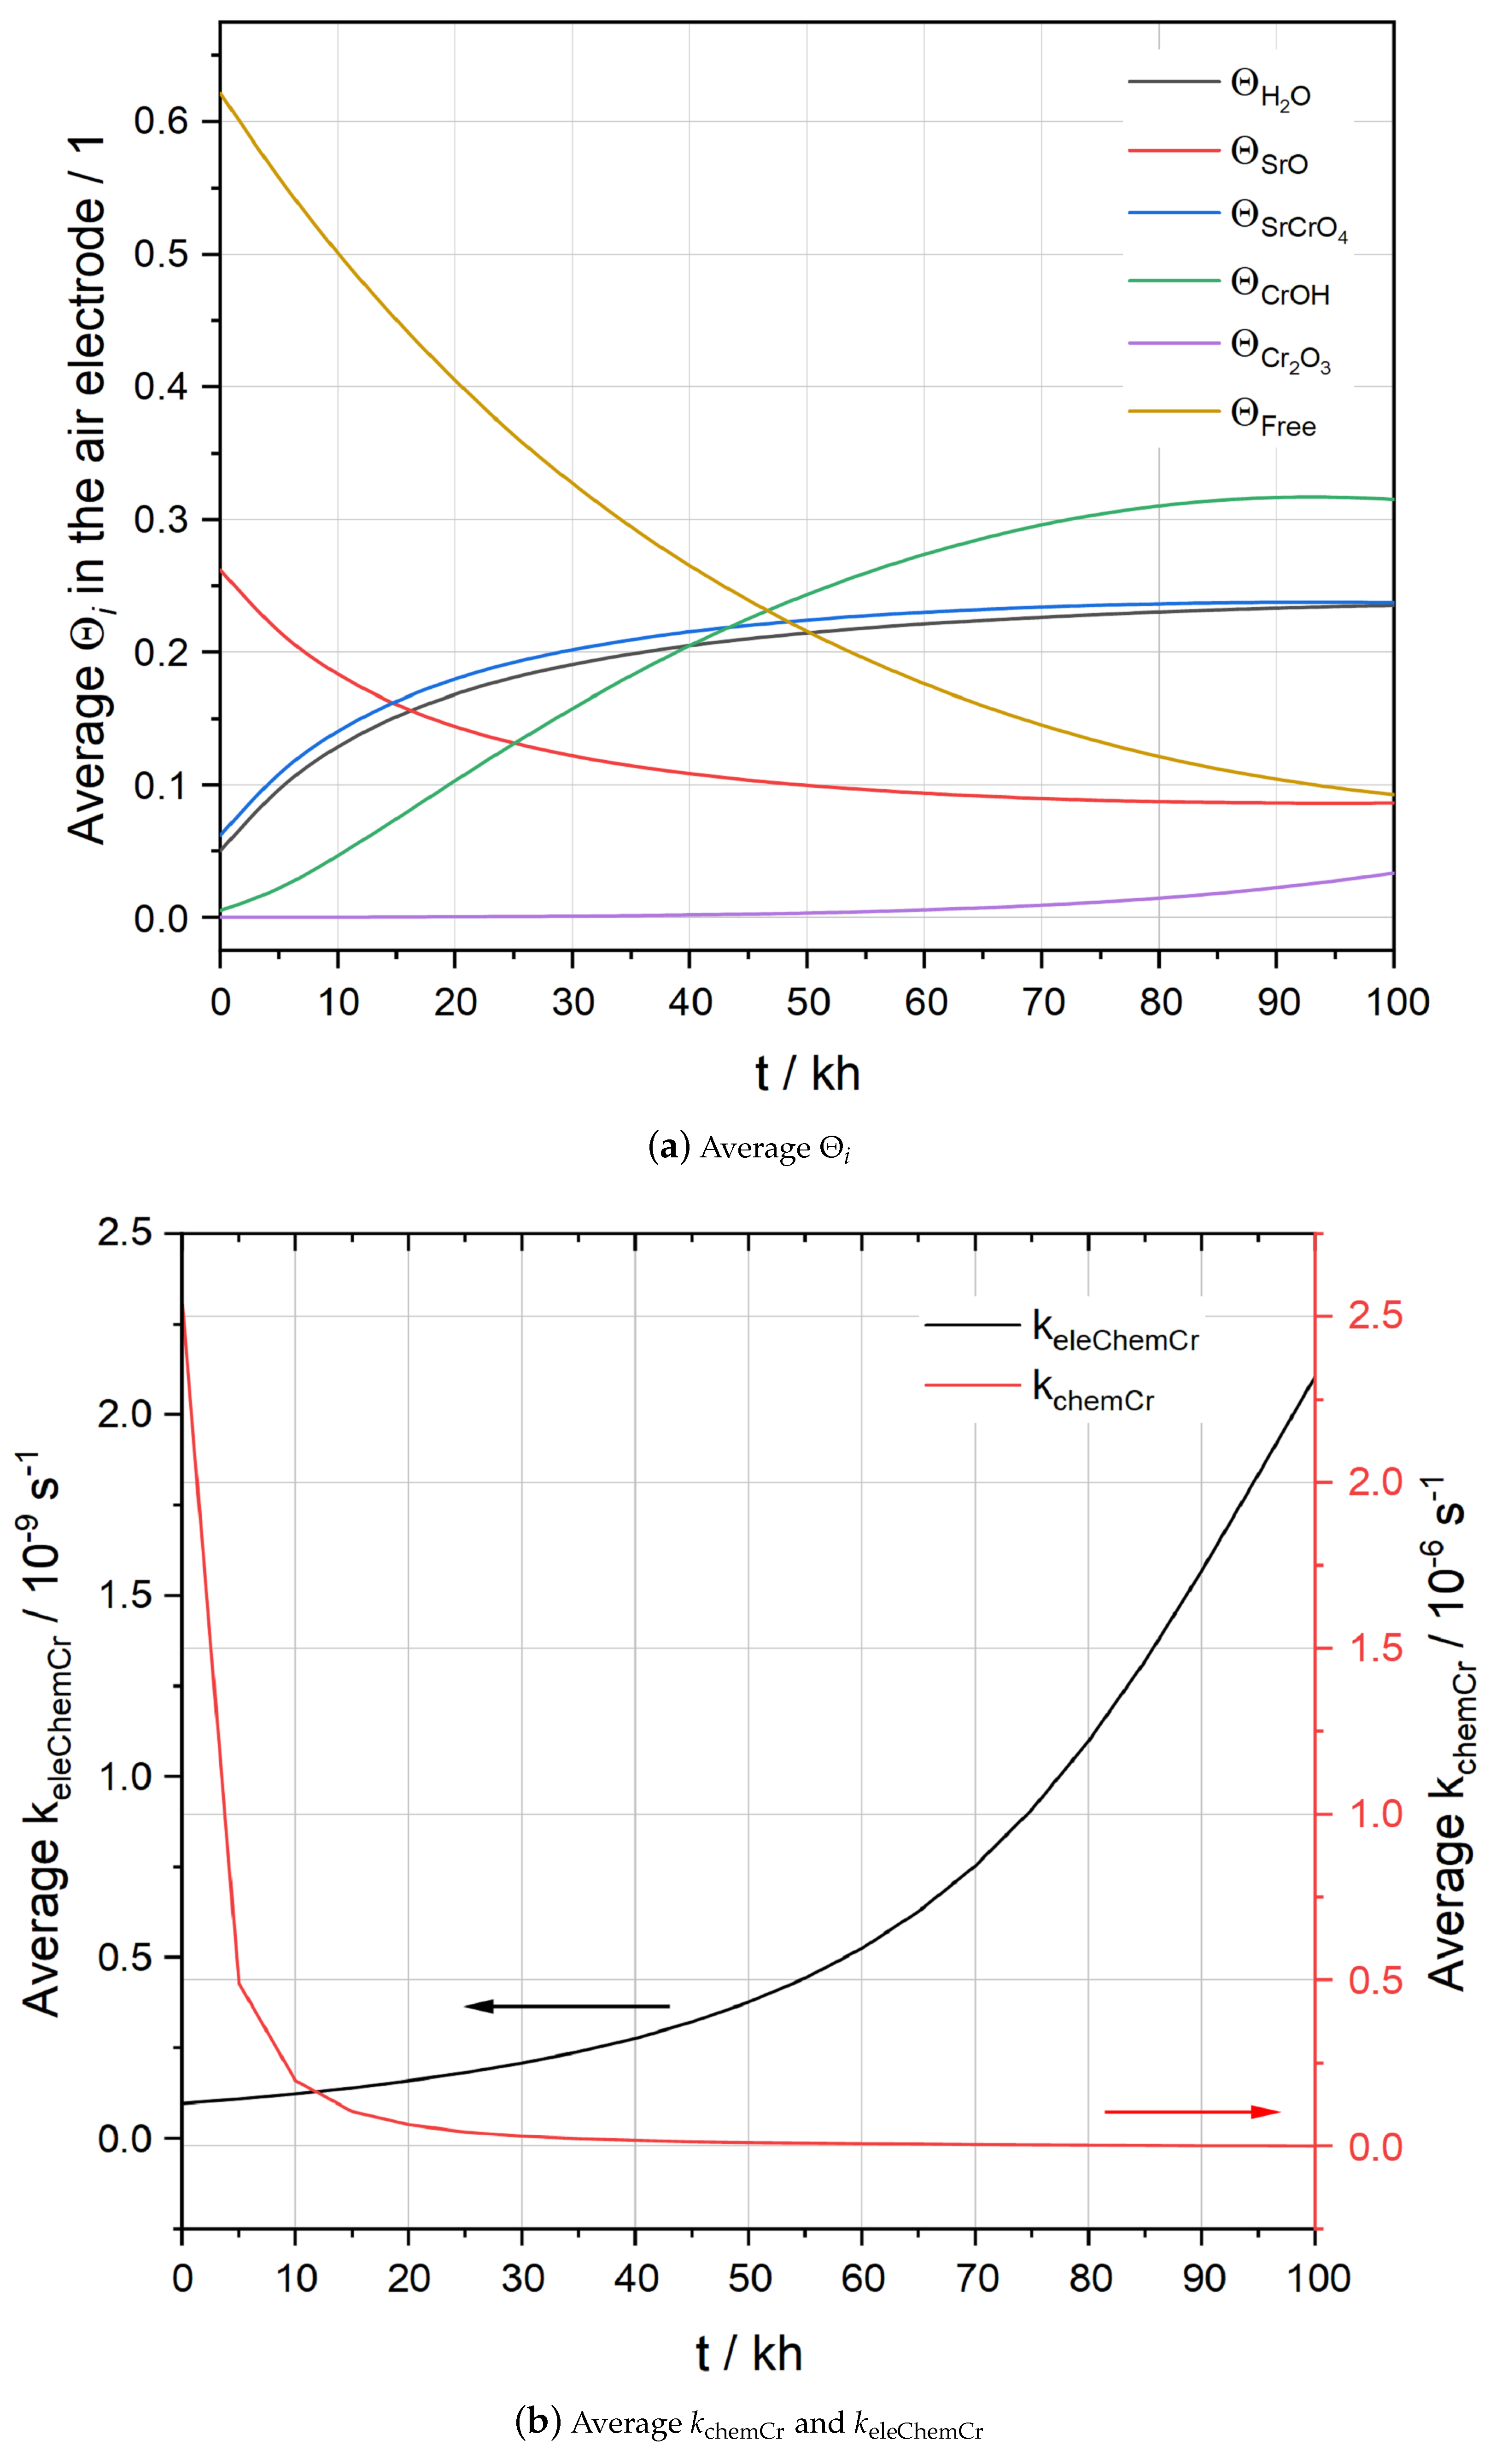
5.1. Simulation Results of F1002-97

F1002-97, with LCC12 as the CL and the WPS protective coating, was operated over ∼100 kh. Since the WPS technique cannot generate a dense coating, LCC12 that can adsorb CrO2(OH)2 was used as the CL to reduce chromium poisoning in the AEL. However, the degradation rate of F1002-97 was still notably higher than for the other two stacks, which used the APS protective coating. As shown in Figure 4, the simulation points out that the degradation solely owing to chromium poisoning causes a degradation rate of ∼1.6 mV/kh. The increasing area-specific-resistance (ASR) after 100 kh operation can, thus, be calculated as ∼320 m Ω cm 2 . Fang et al. [8] analyzed I–V curves and electrochemical impedance spectroscopy (EIS) and determined the increasing ASR due to polarization in the AEL was ∼310 m Ω cm 2 . This is close to the present simulation results. It is reasonable to compare the above two values. Chromium poisoning is believed to be the dominating degradation mechanism that increases the polarization in the AEL, because chromate contributed to the majority of the impurity in the AEL of F1002-97 [13].
The local distribution of physical variables in stack F1002-97 is presented here to illustrate the model of chromium poisoning. Figure 5 gives the spatial distribution of physical variables inside the AEL. Figure 6 presents the evolution of the average k chemCr , k eleChemCr , and Θ i inside the AEL during 100 kh.
According to Figure 5a, ΘCr2O3 barely exists inside the AEL before 25 kh. The same result can be more clearly found in Figure 6a, where the average ΘCr2O3 is close to zero. This is because at the start of the operation, η air is not high as there is still sufficient free surface, Θ free , for the oxygen reduction reaction. As time goes by, η air becomes more negative due to chromium deposition, hence k eleChemCr increases exponentially, as shown in Figure 6b. This can be explained by using a Butler–Volmer-type expression for k eleChemCr . At the end of the simulation, the highest ΘCr2O3 is found at the AEL/EELC where the lowest η air is located, as shown in Figure 5d. From Figure 6a, the average ΘCr2O3 after 100 kh in the AEL is around 0.03, which is small. However, the segregation of Cr2O3 on the AEL/ELEC, which leads to ∼0.17 ΘCr2O3 locally, may still cause a non-negligible ohmic resistance.
The distribution of ΘSrCrO4 is shown in Figure 5b. Unlike ΘCr2O3, ΘSrCrO4 tends to segregate on the surface of the AEL, which is consistent with the experimental observation from [7,13,14]. Plus, in contrast to the evolution trend of ΘCr2O3, ΘSrCrO4 increases quickly within the first 25 kh while it hardly changes after 60 kh. The trend is more distinctly illustrated by the evolution of the average ΘSrCrO4, shown in Figure 6a. This can be explained by the assumption that Reaction (11) obeys the thermal equilibrium. When the operation starts, a high k chemCr should be observed as a tiny amount of ΘSrCrO4, and ΘH2O exists on the LSCF surface. With increasing ΘSrCrO4 and ΘH2O, due to k chemCr being constrained by the thermal equilibrium, a fast attenuation of k chemCr happens, as shown in Figure 6b.
The spatial evolution of Θfree is given in Figure 5c. Similar to ΘSrCrO4, Θfree decreases quickly at the beginning of the 25 kh, probably due to the fast adsorption of CrO2(OH)2 at the initial stage, as shown in Figure 6a. Consequently, η air decreases as governed by Equation (23). In addition, the simulation shows that the highest Θfree is found above the rib and close to the AEL/ELEC. Advanced surface characterization is needed to further validate this distribution. At 100 kh, as a result of a rather low Θfree, η air roughly decreases by a factor of four in comparison with the initial state, as shown in Figure 5d. At the air inlet and air outlet, η air is not much influenced by the chromium poisoning. The probable explanation is that electrochemical reactions mainly take place at the center of the air electrode in the situation where the counter-flow field for the fuel and air is applied.

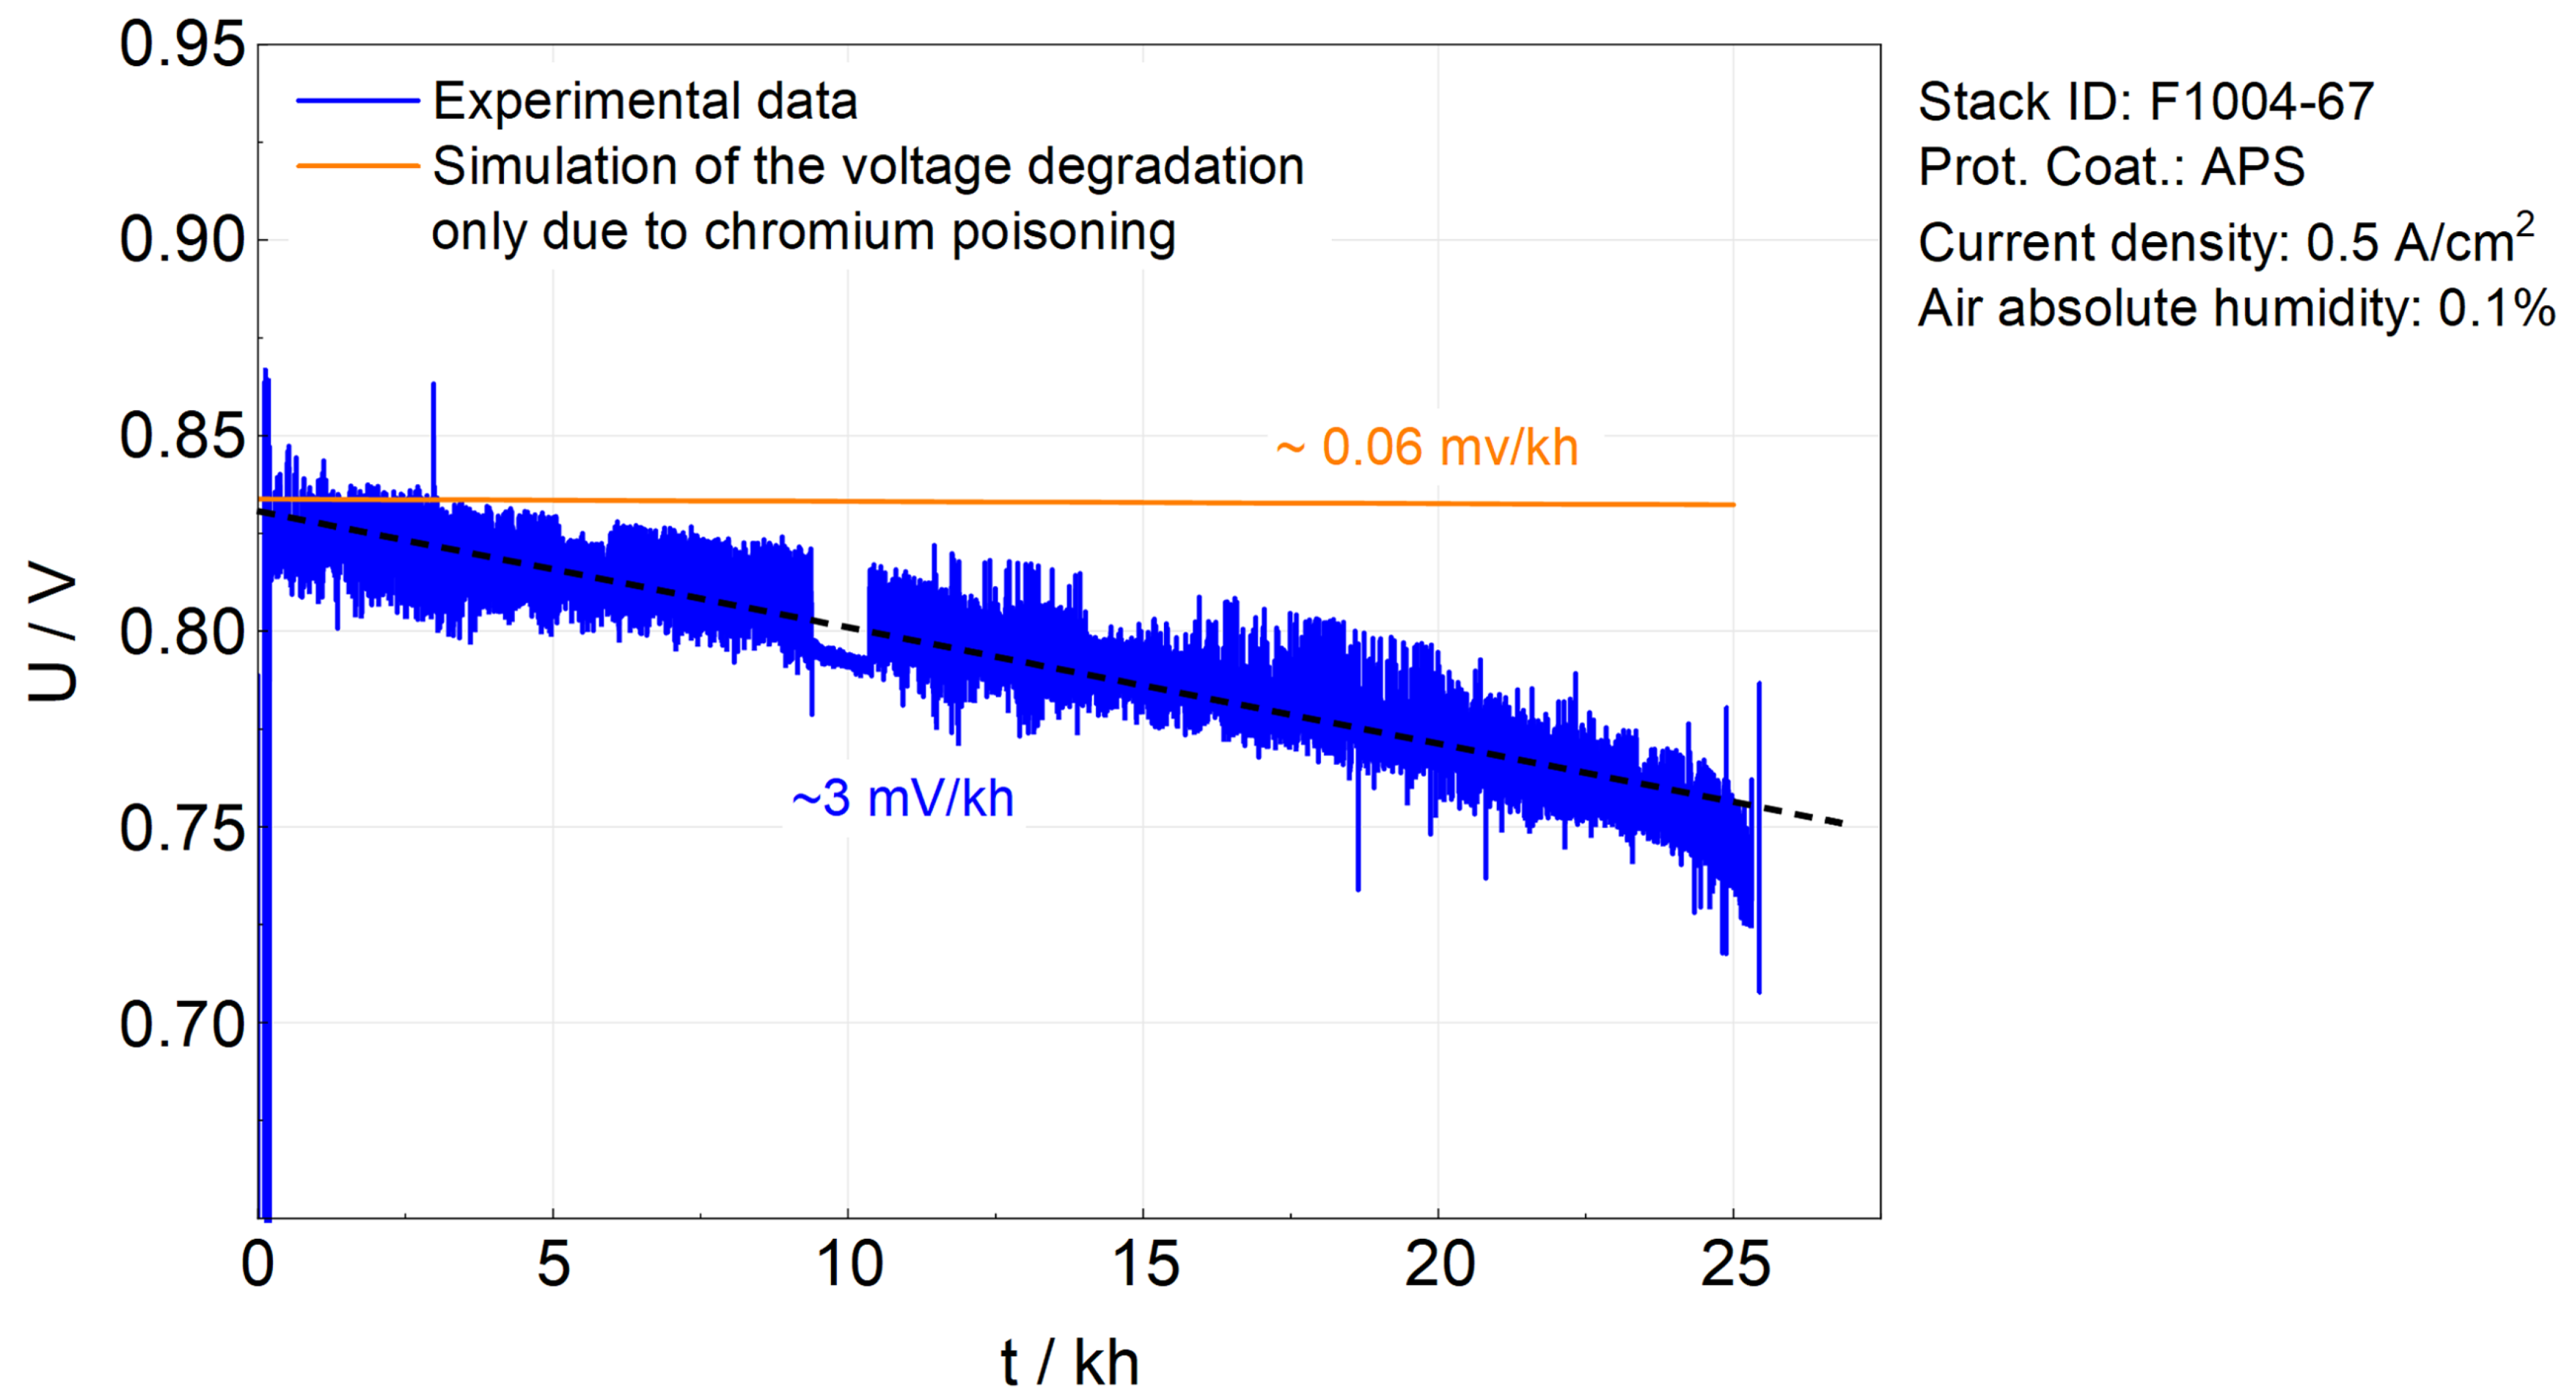
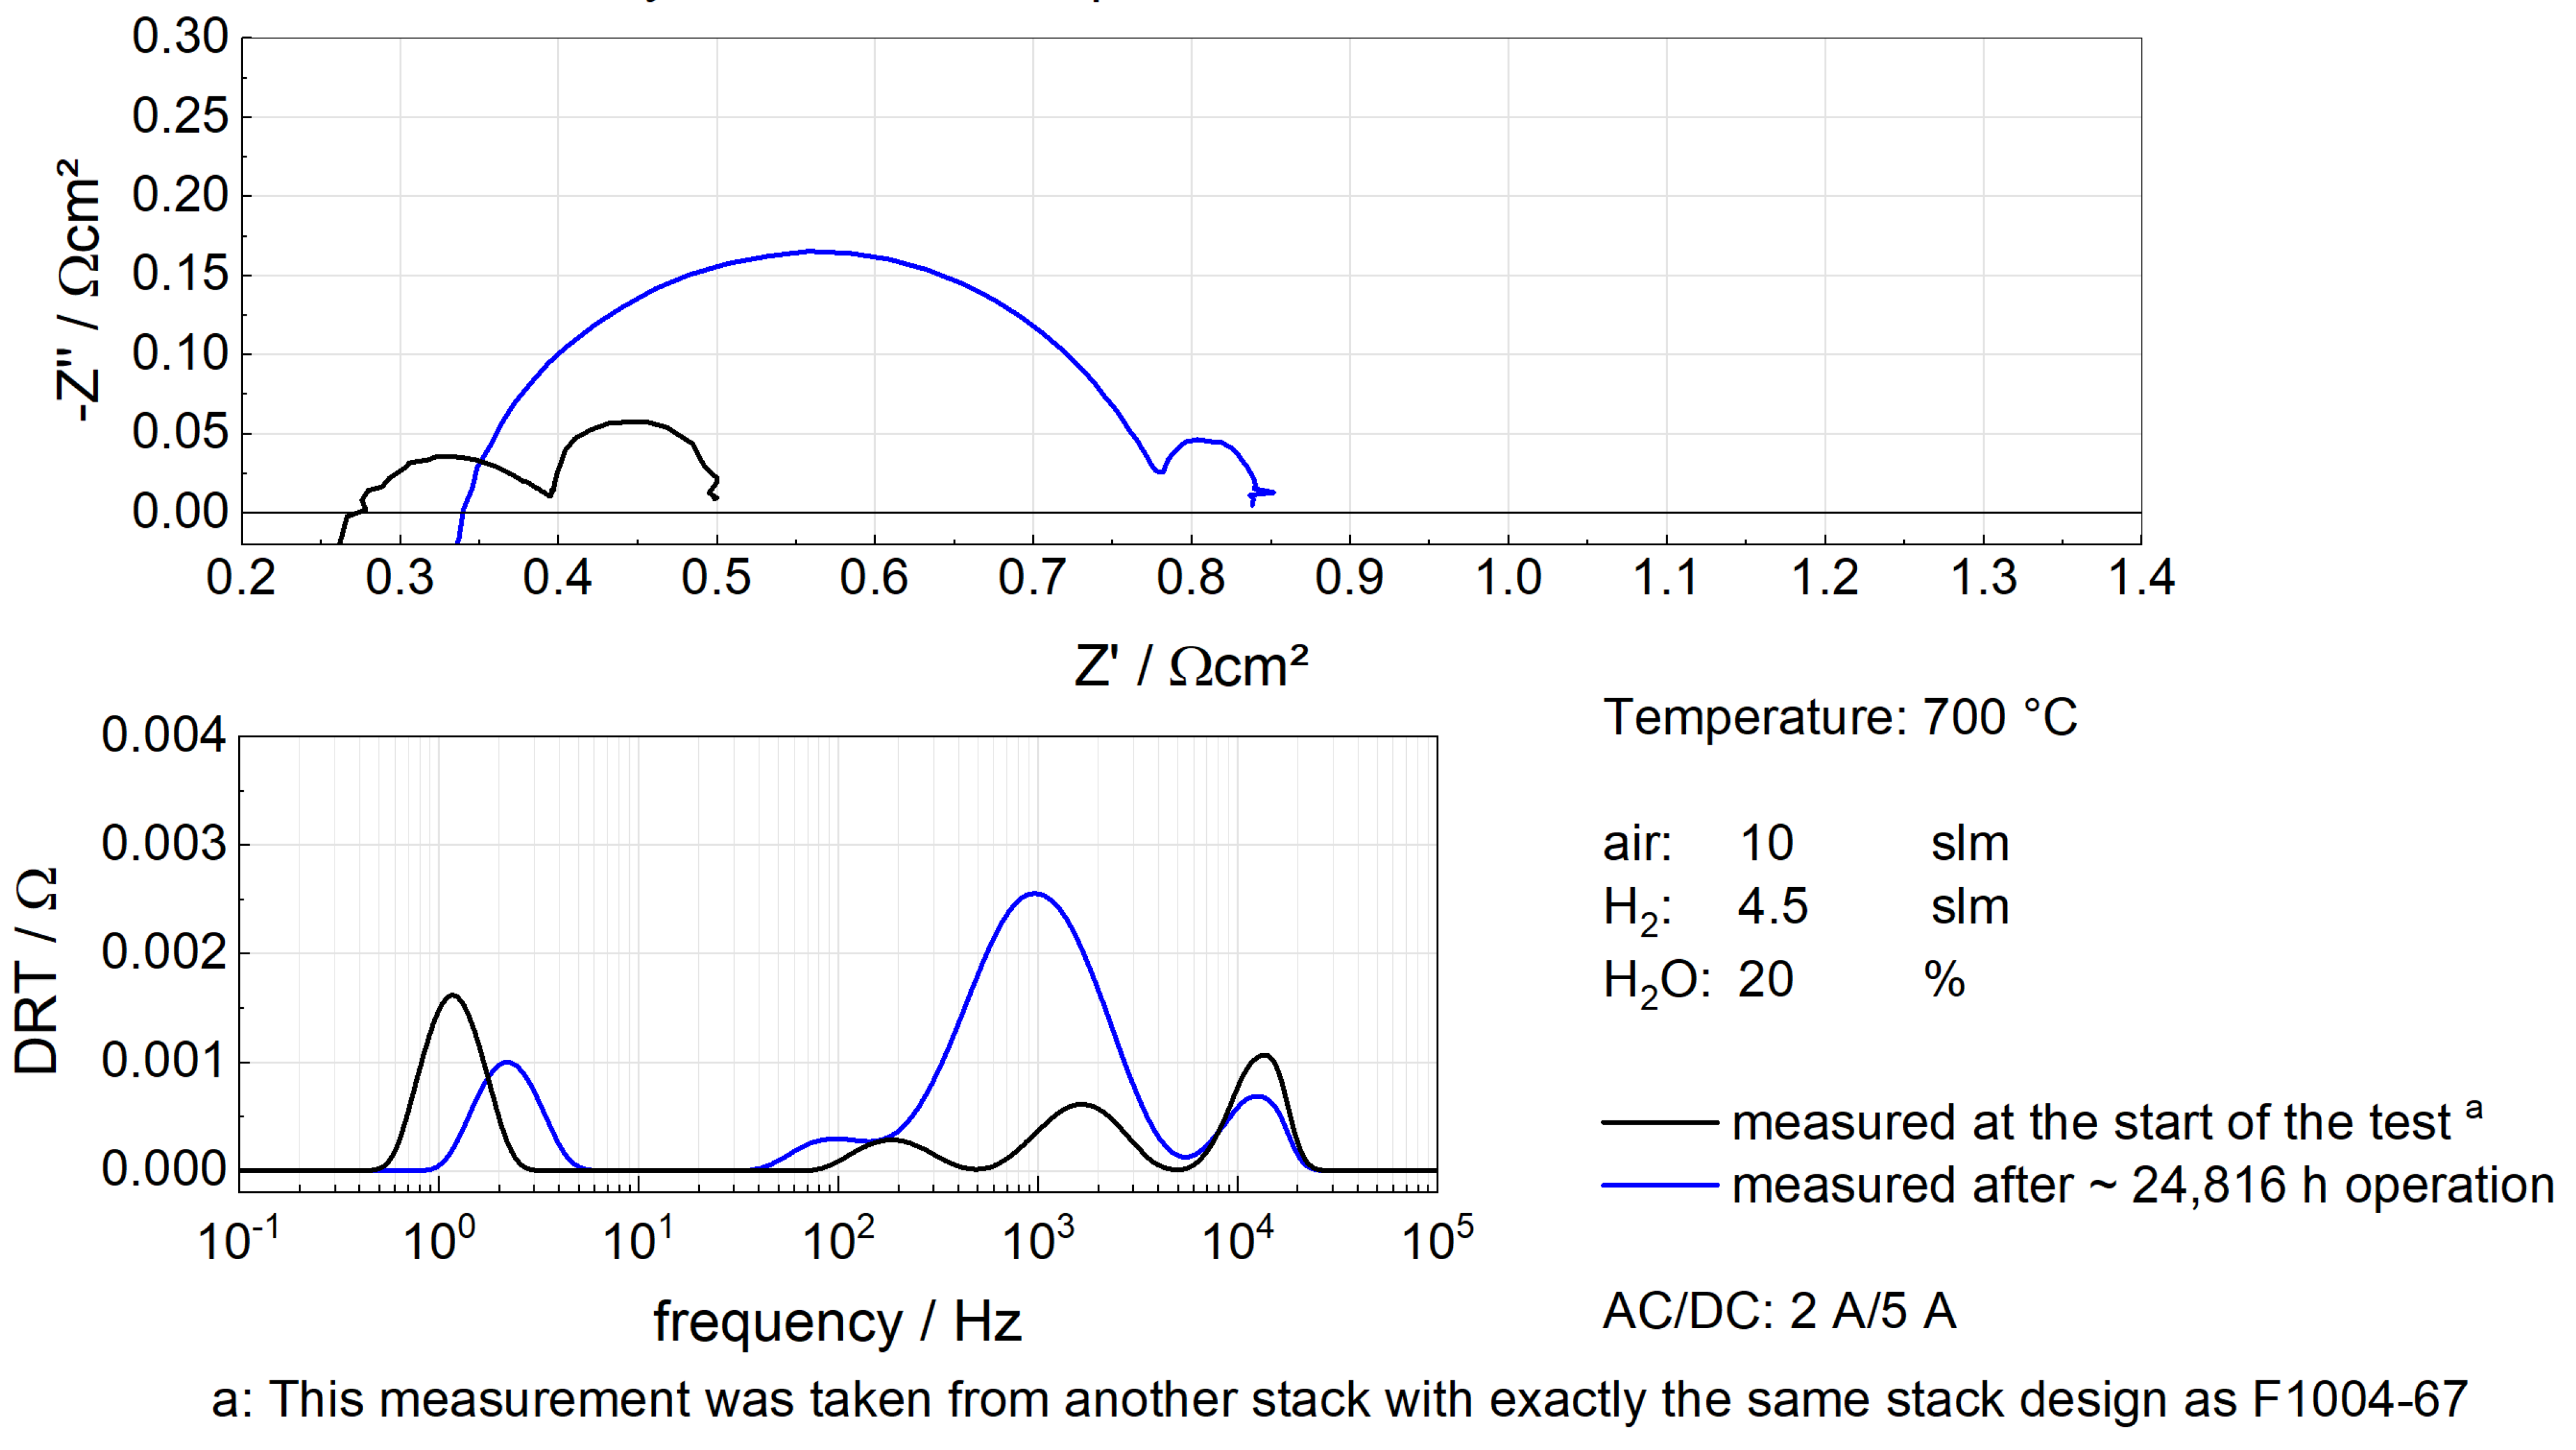
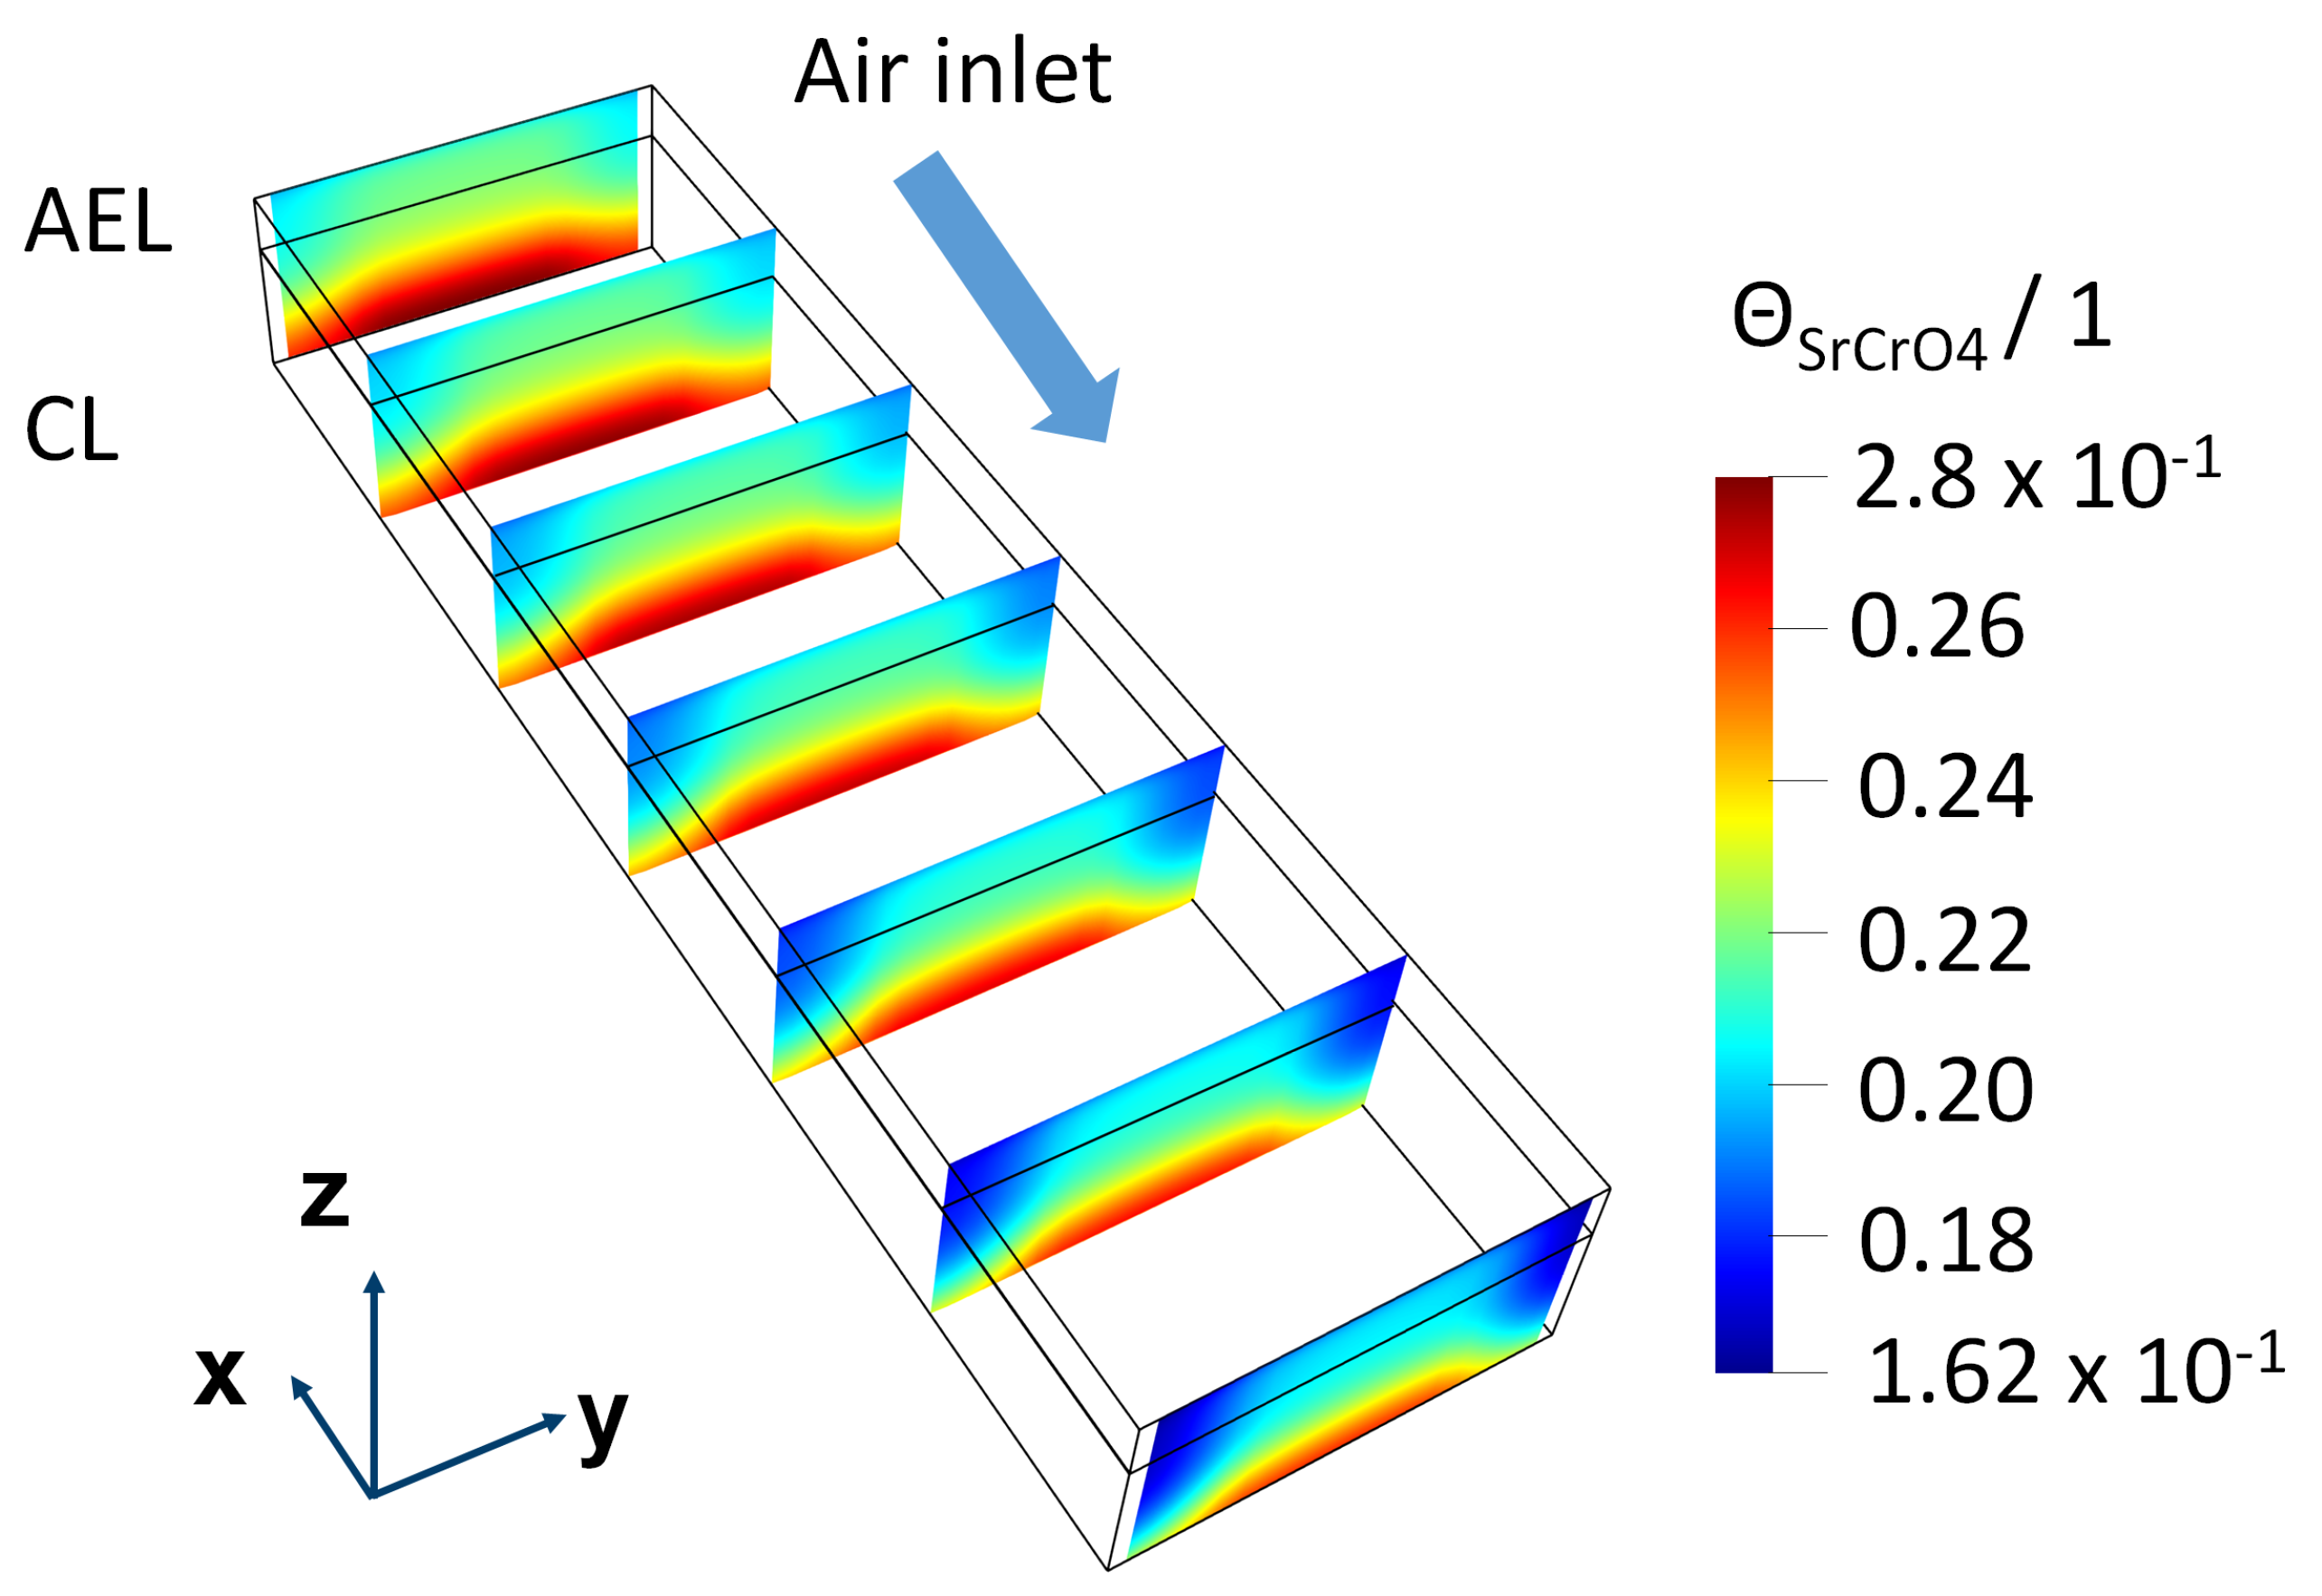
5.2. Simulation Results of F1004-67

F1004-67, with LSCF as the CL and the APS protective coating, was operated for roughly 25 kh. The APS technique produces a sufficiently dense coating so that LCC12 is not needed as the CL. Thanks to the APS protective coating, the degradation rate decreased drastically. According to the simulation given in Figure 7, chromium poisoning is obviously suppressed, as the simulated degradation rate is just ∼0.06 mV/kh. Experimental findings also support this conclusion. From a post-characterization, Menzler et al. [19] found a tiny amount of chromate in a similar SOFC stack with protective coating prepared by APS and operated for 36 kh. It was concluded that the application of the APS protective coating could almost solve the issue of chromium poisoning [18,19]. In addition, EIS was carried out on the stack F1004-67 with 20% humidified hydrogen at 700 C. Figure 8 shows Nyquist plots and the distribution of relaxation times (DRTs) for F1004-67.
From the Nyquist plot, it can be seen that degradation mainly arose from the increasing polarization. In addition, the DRT suggests that the polarization was dominated by the degradation in the fuel electrode, which according to previous research is characterized by the third peak (around 1 kHz) in the DRT plot [8,39,40]. In contrast, it is clearly found that the polarization in the AEL, represented by the second peak (around 100 Hz) in the DRT plot [8,39,40], contributed slightly to the total polarization, as the peak barely changed. Therefore, the conclusion can be reached that chromium poisoning was inconspicuous in the stack F1004-67.

5.3. Simulation Results of F1004-106

F1004-106 had the same stack design as F1004-67, but it was operated under ambient air for ∼2190 h. The simulation here only considers 1500 h of operation with ambient air because of progressive degradation with unknown causes after the replacement of gas valves (in the last operation period of 690 h) [37]. The absolute humidity of the ambient air was calculated by using the database from reference [41] and the calculator from reference [42]. The simulation from Figure 9 shows a small change in the absolute values (∼0.44 mV/kh) of degradation rates before and after ambient air is used. A similar observation is found from the experimentally measured Ut-curves (blue curve) in Figure 9. Moreover, Fang et al. [37] proposed the same conclusion after analyzing EIS data of F1004-106 (F1 stack in reference [37]).

5.4. Effects of Temperature and Humidity on Chromium Poisoning

Figure 7 and Figure 9 demonstrate that with the help of APS protective coatings, SOFC stacks suffer little from chromium poisoning. It is thus significant to ascertain whether the above stack designs can also efficiently prevent chromium poisoning at lower temperatures and in ambient air.
Figure 10a shows the influence of temperature on chromium poisoning. A lower temperature leads to a smaller degradation rate owing to slower adsorption kinetics. However, it also leads to a lower voltage because conductivity decreases. To maintain the required power output, the active area needs to be larger and the number of layers in the stacks should be increased. Unfortunately, both strategies are challenging in terms of the mechanical strength of the stack. An economic analysis, system-level simulation, and solid mechanics modeling are needed to further demonstrate the feasibility of lowering the operation temperature.
Figure 10b compares the U–t curves under different absolute humidities in the inlet air at 650 C. The aim is to determine whether it is possible to save energy on the dehumidification of the air, while at the same time maintaining an acceptable degradation rate. First of all, 2% humidity is undoubtedly not feasible because the degradation rate due to chromium poisoning is already ∼0.14%/kh. The total degradation rate in an actual SOFC stack is likely to be above the target, 0.3%/kh [43], if other degradation processes are involved. Secondly, 1.5% humidity is also not recommended as there is a tendency for progressive degradation after 80 kh. A humidity of around 1% could be more promising, as less energy is required for dehumidification of the air, no progressive degradation is observed and the degradation rate is low even though it is ten times higher compared to the case of 0.1% humidity.

6. Discussion

6.1. One-Channel Model Representing the Chromium Poisoning in the Whole SOFC Stack

Due to computational cost, this work only considers a single repeating channel of an SOFC stack to study chromium poisoning. Previously, it was proven that this simplification is able to provide accurate predictions of I–V curves [22]. For the simulation of chromium poisoning, it is worth assessing further whether the simplification is acceptable to provide reliable results. Two important variables are discussed here, temperature and the origin of CrO2(OH)2, since they directly influence the governing equations of chromium poisoning.
  • The SOFC stacks considered in this work were tested inside ovens. Thanks to the heat radiation, based on the temperature measured from thermocouples in the stack [22], it was found that the spatial variation in temperature across the whole stack during the steady operation was slight (10∼15 C). Additionally, a simulation considering the single-cell stack shows a uniform temperature distribution on the reactive part, where the total temperature variation is ∼14.1 C (please see Figure S1 in the Supplementary Materials). Hence, the temperature profile in the single channel is expected to be similar to that of the whole stack.
  • Regarding the origin of CrO2(OH)2, the current model assumes the formation of CrO2(OH)2 only originates from the internal surface of the air channel and the rib. In principle CrO2(OH)2 could be released from the metal frames’ surfaces. However, internal experiments indicate the impact of the metal frames is negligible.

6.2. The Stack Design

In this work, with the help of simulations, two stack designs were compared in terms of performance degradation due to chromium poisoning. The first stack employed the APS protective coating and LSCF as the CL (F1004-67). As a result of a quite dense protective coating, chromium poisoning was almost negligible. According to the post-test characterization [44], degradation in this stack mainly arose from other processes, such as gas leakage, nickel agglomeration, manganese diffusion, increasing ohmic resistance, and contact loss due to the formation of secondary phases. Future modeling work will take the above degradation processes into consideration. The second stack utilized a protective coating prepared by WPS and LCC12 as the CL (F1002-97). Since the WPS protective coating has a relatively high porosity, LCC12 that can adsorb CrO2(OH)2 was chosen as the CL. Although the adsorption rate of CrO2(OH)2 by LCC12 [45] is estimated to be two orders of magnitude higher than that of LSCF (see definitions of S o u r c e mole , CrOH LCC 12 and S o u r c e mole , CrOH LSCF in Appendix A), this stack design is unable to prevent chromium poisoning efficiently, as shown in Figure 4. However, WPS technology is cheaper than APS technology [46]. If WPS protective coatings need to be applied after considering the costs, fabrication should be optimized to lower its porosity.

6.3. Operation under Higher Air Absolute Humidity and Lower Temperature

As shown in Figure 10, based on the current model and only from the perspective of the degradation rate, there is a potential to lower the operation temperature to 650 C and increase the absolute air humidity to 1%, if the APS protective coating is applied. Such an operation is beneficial for lowering the degradation of materials and saving energy for dehumidification of the inlet air. However, the present model may underestimate the degradation due to chromium poisoning as it ignores the influence of the insulation phase SrCrO4. Figure 11 shows the distribution of ΘSrCrO4 inside the AEL and the CL under the above-mentioned operation conditions and stack designs. After 100 kh operation, a clear gathering of ΘSrCrO4 on the surface of the CL can be found. A surface coverage of ∼0.28 of the insulation phase has a chance of causing notable ohmic resistance. A more sophisticated model is therefore needed in the future to understand how the surface coverage of insulation phases influences the degradation.

7. Conclusions

This work proposed a chromium poisoning model to consider one of the most important degradation processes in SOFCs. The model consists of a set of ordinary differential equations and the mass transport equation, accounting for the surface coverage on the cathode electrode by crucial chromium-based species. It incorporates a pre-existing three-dimensional CFD toolbox and numerical simulations of a single channel in a Jülich F10 SOFC stack are conducted. The numerical simulation is capable of predicting voltage degradation during 100 kh of operating time. The results also indicate a reduction in free adsorption sites on LSCF during chromium poisoning, as well as its contribution to polarization degradation. The simulation results are supported by experimental data, such as the measured voltage degradation and EIS. The model can be used to study chromium poisoning under different temperatures, absolute humidities, and stack designs. Based on the simulation results, three important conclusions are drawn:
  • With an APS protective coating, the chromium poisoning issue in the SOFC stack is almost resolved.
  • Lower temperatures and less moisture in the inlet air mitigate chromium poisoning.
  • It should be possible to operate an SOFC stack with 1% humidified air at 650 C if APS protective coating is applied.
As a result of the segregation of ΘSrCrO4 and ΘCr2O3, an increasing ohmic resistance due to chromium poisoning is expected. However, the influence of the decrease in conductivity is not considered in this model. Incorporating the decreasing conductivity into the model will produce a more reliable prediction of the performance of SOFC stacks and will be considered in the future. In addition, some kinetic parameters are assumed in the present model, such as sticking coefficients and the prefactor of k eleChemCr . These parameters need to be experimentally measured or theoretically calculated for the numerical model to provide a more precise prediction of the degradation caused by chromium poisoning.

Supplementary Materials

The following supporting information can be downloaded at: https://www.mdpi.com/article/10.3390/en16237841/s1, Figure S1:Temperature distribution in the single cell stack during fuel cell operation.

Author Contributions

Conceptualization, S.Y.; data curation, S.Y.; investigation, S.Y.; methodology, S.Y. and S.Z.; project administration, D.S. and F.K.; supervision, D.S. and R.-A.E.; visualization, S.Y.; writing the original draft, S.Y.; writing—review and editing, S.Z., D.S., R.P., R.-A.E., F.K. and S.Y. All authors have read and agreed to the published version of the manuscript.

Funding

This research was funded by the German Federal Ministry of Education and Research (BMBF), grant number FKZ 03SF0621A.

Data Availability Statement

Data are contained within the article and Supplementary Materials.

Acknowledgments

The authors would like to thank all their colleagues engaged in SOC development at Jülich.

Conflicts of Interest

The authors from Forschungszentrum Jülich GmbH have no conflict of interest to declare. The funders had no role in the design of the study; in the collection, analyses, or interpretation of data; in the writing of the manuscript, or in the decision to publish the results.

Abbreviations

The following abbreviations are used in this manuscript:
Θ i Surface coverage of species i
Γ LSCF Density of adsorption sites on LSCF surface
η air Overpotential in the air electrode
ε coating , i Porosity of the coating made using the i technique
U Velocity
P i Partial pressure of gaseous species i in air
cMolar density of the air
Y i Molar fraction of gaseous species i in air
N CrOH Molar diffusion flux of CrO2(OH)2
TTemperature
M i Molar mass of species i
D CrOH , air Diffusion coefficient of CrO2(OH)2 in air
S o u r c e mole Source term of CrO2(OH)2 in the mass transport equation
k eleChemCr Rate of the surface coverage change due to the electrochemical reaction
k chemCr Rate of the surface coverage change due to the chemical reaction
KThermal equilibrium constant
S i Sticking coefficient of gaseous species i
AEL/ELECThe interface between the air electrode and the electrolyte
AELAir electrode
CLContact layer
SOFCSolid oxide fuel cell
8YSZ8 mol% yttria-stabilized zirconia
LSCFLa0.58Sr0.4Co0.2Fe0.8O3-
LSM(La,Sr)MnO3
MICMetal interconnect
APSAtmospheric plasma spraying
WPSWet powder spraying
ITMIntermediate temperature metal
MICMetal interconnect
FZJForschungszentrum Jülich GmbH
CFDComputational fluid dynamics
TPBTriple-phase boundary
LCC12La0.97Mn0.4Co0.3Cu0.3O3-
ASRArea-specific-resistance
EISElectrochemical impedance spectroscopy
DRTDistribution of relaxation times

Appendix A. Definition of S mole , CrOH

The source term, S o u r c e mole , CrOH , used in Equation (3) is given as follows:
S o u r c e mole , CrOH = S o u r c e mole , CrOH LCC 12 + S o u r c e mole , CrOH LSCF
where S o u r c e mole , CrOH LCC 12 and S o u r c e mole , CrOH LSCF are the source terms that are non-zero only when the calculation domain is made of LCC12 and LSCF, respectively. In other words, S o u r c e mole , CrOH LCC 12 is defined as follows (when WPS protective coating is used) [45]:
S o u r c e mole , CrOH LCC 12 = 5.7 × 10 6 [ mol m 3 s 1 ] if the calculation domain is made of LCC 12 . 0 Other situations
Similarly, when CrO2(OH)2 diffuses into the component made of LSCF, it can be adsorbed onto the LSCF surface as shown in Equation (8). Inside the domain made of LSCF, S o u r c e mole , CrOH LSCF can be obtained by
S o u r c e mole , CrOH LSCF = ( k a , CrOH Θ free k d , CrOH Θ CrOH ) · Γ LSCF · N LSCF A LSCF / V mesh
where N LSCF is the number of LSCF particles in the local mesh, A LSCF is the surface area of one LSCF particle, and V mesh is the volume of the local mesh. N LSCF can be expanded as
N LSCF = V LSCF , tot / V LSCF
where V LSCF , tot and V LSCF are the total volume of LSCF particles in the local mesh and the volume of one LSCF particle. The relation between V LSCF , tot and V mesh is
V LSCF , tot = ( 1 ε ael ) V mesh
where ε ael is the porosity of the AEL. After combining Equations (A3)–(A5), S o u r c e mole , CrOH LSCF can be obtained by
S o u r c e mole , CrOH LSCF = ( 1 ε ael ) ( k a , CrOH Θ free if the calculation domain k d , CrOH Θ C r O H ) Γ LSCF a LSCF is made of LSCF . 0 Other situations
where a LSCF ( A LSCF / V LSCF ) is the specific area of LSCF particles, the value of which can be found in Appendix C.

Appendix B. Calculation of Δ G SrCrO 4

The following reaction
C r O 2 ( O H ) 2 ( g ) + S r O ( s ) SrCrO 4 ( s ) + H 2 O ( g ) Δ G SrCrO 4 0
has a Gibbs free energy change Δ G SrCrO 4 0 which is [47]:
Δ G SrCrO 4 0 = 0.04713 [ 1 / K ] · T 338.81232 [ kJ mol 1 ]
where T is the temperature. However, it is the Δ G SrCrO 4 of reaction (11) happening on the LSCF surface that needs to be determined. This work uses a similar method to that provided in [32] to calculate Δ G SrCrO 4 . Reaction (A7) consists of the following processes:
  • Adsorption of CrO2(OH)2 on the LSCF surface ( Δ G ads , CrOH );
  • SrO segregation on the LSCF surface ( Δ G SrO segregation );
  • Formation of SrCrO4 ( Δ G SrCrO 4 0 );
  • Desorption of H2O from the LSCF surface ( Δ G des , H 2 O ).
As a result, Δ G SrCrO 4 can be written as
Δ G SrCrO 4 = Δ G SrCrO 4 0 Δ G ads , CrOH Δ G SrO segregation Δ G des , H 2 O
The data of the Gibbs free energy can be found in Table A1.
Table A1. Parameters used for calculating Δ G SrCrO 4 .
ValueReferenceComment
/kJ mol−1
Δ G ads , CrOH −370[48]The value is adjusted as the value in reference is actually for CrO3 adsorbed on LSCF.
Δ G SrO segregation −41.5[49]The data is for the case of LSM where the surface coverage of Sr is increased from 0.25 to 0.5.
Δ G des , H 2 O 127.4[50]

Appendix C. Parameters Used in the Model

Table A2. Parameters used in the model.
PropertyValue
Porosity of the AEL (εael)0.45 [51]
Specific area of the LSCF particles (a LSCF )2.84 × 10 6 m 1 [51]
Porosity of WPS protective coating ( ε coating , WPS )0.45 [52]
Porosity of APS protective coating ( ε coating , APS )0.03 [20]
Diffusion coefficient of CrO2(OH)2 ( D CrOH , air )1 × 10 4 m 2 s 1 [53]
Density of adsorption sites ( Γ LSCF )1.1 × 10 5 mol m 2 [54]
Sticking coefficient of CrO2(OH)2 ( S CrOH ) 1 × 10 4 exp 75 [ kJ mol 1 ] R T 1
Sticking coefficient of H2O ( S H 2 O )0 2 [55]
1 Sticking coefficient can be written as an Arrhenius expression [31]. 2 It was demonstrated that there was little interaction between LSCF and H2O when temperature is above 500 C [55].
The parameters used in the model are given in Table A2. S CrOH is a parameter for which no reference can be found in the literature. The value is fitted according to the experimental results.

Appendix D. Initial Values of Θ SrO in the Model

The initial values of Θ SrO for the two stack designs, LSCF as the CL or LCC12 as the CL, are shown in Table A3. It is assumed that if the CL is made of LCC12, SrO segregation only happens in the AEL. In contrast, if the CL is made of LSCF, SrO segregation happens across both the CL and AEL and the maximum segregation is at the surface of the CL.
The distribution function Θ SrO = f ( z ) cannot be found in the literature. It is, therefore, assumed that f ( z ) is a quartic function, as given in Table A3. The constants a and b can be determined by boundary values.
Table A3. Initial values of Θ SrO in the model.
Stack DesignBoundary ValueDistribution
Function 1
LSCF as the CL Θ SrO = 0.21 at AEL / EELC 0.47 at surface of CL a ( z b ) 4 + 0.21
LCC12 as the CL Θ SrO = 0.21 at AEL / EELC 0.47 at surface of AEL a ( z b ) 4 + 0.21
1 z is the z-coordinate in the model. a and b are constants that need to be calculated according to the boundary values.

Appendix E. Initial Values of Θ CrOH , Θ H 2 O , Θ Cr 2 O 3 and Θ SrCrO 4 in the Model

The initial values of Θ CrOH , Θ H 2 O , Θ Cr 2 O 3 , and Θ SrCrO 4 are shown in Table A4. The model in this work focuses on the period of the steady operation of SOFC stacks. Before the start of steady operation, stacks are heated up, undergo sealant-joining process, initial characterization of I–V curves and EIS, etc., where operational conditions keep varying. Consequently, assumed values are used because the exact initial values are unknown. The initial value of Θ Cr 2 O 3 is a purely assumed value. The initial values of Θ CrOH and Θ H 2 O are determined based on the simulation results of two processes in the same model: (1) the heating up process at the speed of 1 K/min from 20 C to 350 C and 2 K/min from 350 C to 850 C (all with 1% humidified air); and (2) the sealant-joining process, 15 h under 850 C with 1% humidified air and 85 h under 850 C with 0.1% humidified air.
Table A4. Initial values of Θ CrOH , Θ H 2 O , Θ Cr 2 O 3 , and Θ SrCrO 4 in the model.
Initial Value/1Comment
Θ CrOH 5 ×   10 3 Assumed value
Θ H 2 O 5 ×   10 2 Assumed value
Θ Cr 2 O 3 1 ×   10 5 Assumed value
Θ SrCrO 4 K SrCrO 4 Θ CrOH Θ SrO Θ H 2 O 1Obtained according to the thermal equilibrium
1  Θ SrO is calculated according to Appendix D.

References

  1. Zhou, J.; Feng, C.; Su, Q.; Jiang, S.; Fan, Z.; Ruan, J.; Sun, S.; Hu, L. The Multi-Objective Optimization of Powertrain Design and Energy Management Strategy for Fuel Cell–Battery Electric Vehicle. Sustainability 2022, 14, 6320. [Google Scholar] [CrossRef]
  2. Jia, C.; Zhou, J.; He, H.; Li, J.; Wei, Z.; Li, K.; Shi, M. A novel energy management strategy for hybrid electric bus with fuel cell health and battery thermal- and health-constrained awareness. Energy 2023, 271, 127105. [Google Scholar] [CrossRef]
  3. Huang, X.; Zhang, Z.; Jiang, J. Fuel Cell Technology for Distributed Generation: An Overview. In Proceedings of the 2006 IEEE International Symposium on Industrial Electronics, Montreal, QC, Canada, 9–13 July 2006; Volume 2, pp. 1613–1618. [Google Scholar] [CrossRef]
  4. Zarabi Golkhatmi, S.; Asghar, M.I.; Lund, P.D. A review on solid oxide fuel cell durability: Latest progress, mechanisms, and study tools. Renew. Sustain. Energy Rev. 2022, 161, 112339. [Google Scholar] [CrossRef]
  5. Li, W.; Wang, Y.; Liu, W. A review of solid oxide fuel cell application. IOP Conf. Ser. Earth Environ. Sci. 2020, 619, 012012. [Google Scholar] [CrossRef]
  6. Zhou, L.; Mason, J.H.; Li, W.; Liu, X. Comprehensive review of chromium deposition and poisoning of solid oxide fuel cells (SOFCs) cathode materials. Renew. Sustain. Energy Rev. 2020, 134, 110320. [Google Scholar] [CrossRef]
  7. Horita, T. Chromium poisoning for prolonged lifetime of electrodes in solid oxide fuel cells—Review. Ceram. Int. 2021, 47, 7293–7306. [Google Scholar] [CrossRef]
  8. Fang, Q.; Blum, L.; Stolten, D. Electrochemical Performance and Degradation Analysis of an SOFC Short Stack Following Operation of More than 100,000 Hours. J. Electrochem. Soc. 2019, 166, F1320–F1325. [Google Scholar] [CrossRef]
  9. Vora, S.D.; Lundberg, W.L.; Pierre, J.F. Overview of U.S. Department of Energy Office of Fossil Energy’s Solid Oxide Fuel Cell Program. ECS Trans. 2017, 78, 3. [Google Scholar] [CrossRef]
  10. Nakajo, A.; Tanasini, P.; Diethelm, S.; Herle, J.V.; Favrat, D. Electrochemical Model of Solid Oxide Fuel Cell for Simulation at the Stack Scale II: Implementation of Degradation Processes. J. Electrochem. Soc. 2011, 158, B1102. [Google Scholar] [CrossRef]
  11. Miyoshi, K.; Iwai, H.; Kishimoto, M.; Saito, M.; Yoshida, H. Chromium poisoning in (La,Sr)MnO3 cathode: Three-dimensional simulation of a solid oxide fuel cell. J. Power Sources 2016, 326, 331–340. [Google Scholar] [CrossRef]
  12. Babaie Rizvandi, O.; Miao, X.Y.; Frandsen, H.L. Multiscale modeling of degradation of full solid oxide fuel cell stacks. Int. J. Hydrogen Energy 2021, 46, 27709–27730. [Google Scholar] [CrossRef]
  13. Menzler, N.H.; Sebold, D.; Sohn, Y.J.; Zischke, S. Post-test characterization of a solid oxide fuel cell after more than 10 years of stack testing. J. Power Sources 2020, 478, 228770. [Google Scholar] [CrossRef]
  14. Jiang, S.P.; Chen, X. Chromium deposition and poisoning of cathodes of solid oxide fuel cells—A review. Int. J. Hydrogen Energy 2014, 39, 505–531. [Google Scholar] [CrossRef]
  15. Koo, B.; Kim, K.; Kim, J.K.; Kwon, H.; Han, J.W.; Jung, W. Sr Segregation in Perovskite Oxides: Why It Happens and How It Exists. Joule 2018, 2, 1476–1499. [Google Scholar] [CrossRef]
  16. Türk, H.; Götsch, T.; Schmidt, F.P.; Hammud, A.; Ivanov, D.; de Haart, L.G.J.B.; Vinke, I.C.; Eichel, R.A.; Schlögl, R.; Reuter, K.; et al. Sr Surface Enrichment in Solid Oxide Cells—Approaching the Limits of EDX Analysis by Multivariate Statistical Analysis and Simulations. ChemCatChem 2022, 14, e202200300. [Google Scholar] [CrossRef]
  17. Yin, X.; Bencze, L.; Motalov, V.; Spatschek, R.; Singheiser, L. Thermodynamic perspective of Sr-related degradation issues in SOFCs. Int. J. Appl. Ceram. Technol. 2018, 15, 380–390. [Google Scholar] [CrossRef]
  18. Blum, L.; Fang, Q.; Groß-Barsnick, S.M.; de Haart, L.B.; Malzbender, J.; Menzler, N.H.; Quadakkers, W.J. Long-term operation of solid oxide fuel cells and preliminary findings on accelerated testing. Int. J. Hydrogen Energy 2020, 45, 8955–8964. [Google Scholar] [CrossRef]
  19. Menzler, N.H.; Sebold, D.; Guillon, O. Post-test characterization of a solid oxide fuel cell stack operated for more than 30,000 hours: The cell. J. Power Sources 2018, 374, 69–76. [Google Scholar] [CrossRef]
  20. Grünwald, N.; Lhuissier, P.; Salvo, L.; Villanova, J.; Menzler, N.H.; Guillon, O.; Martin, C.L.; Vaßen, R. In situ investigation of atmospheric plasma-sprayed Mn–Co–Fe–O by synchrotron X-ray nano-tomography. J. Mater. Sci. 2020, 55, 12725–12736. [Google Scholar] [CrossRef]
  21. Steinberger-Wilckens, R.; De Haart, L.; Vinke, I.; Blum, L.; Cramer, A.; Remmel, J.; Blass, G.; Tietz, F.; Quadakkers, W. Recent results of stack development at forschungszentrum jülich. In Proceedings of the Fuel Cell Technologies: State and Perspectives; Sammes, N., Smirnova, A., Vasylyev, O., Eds.; Springer: Dordrecht, The Netherlands, 2005; pp. 123–134. [Google Scholar]
  22. Yu, S.; Zhang, S.; Schäfer, D.; Peters, R.; Kunz, F.; Eichel, R.A. Numerical Modeling and Simulation of the Solid Oxide Cell Stacks and Metal Interconnect Oxidation with OpenFOAM. Energies 2023, 16, 3827. [Google Scholar] [CrossRef]
  23. Zhang, S.; Hess, S.; Marschall, H.; Reimer, U.; Beale, S.B.; Lehnert, W. openFuelCell2: A New Computational Tool for Fuel Cells, Electrolyzers, and other Electrochemical Devices and Processes. Comput. Phys. Commun. 2023; in press. [Google Scholar]
  24. Hilpert, K.; Das, D.; Miller, M.; Peck, D.H.; Weiß, R. Chromium Vapor Species over Solid Oxide Fuel Cell Interconnect Materials and Their Potential for Degradation Processes. J. Electrochem. Soc. 1996, 143, 3642. [Google Scholar] [CrossRef]
  25. Ebbinghaus, B.B. Thermodynamics of gas phase chromium species: The chromium oxides, the chromium oxyhydroxides, and volatility calculations in waste incineration processes. Combust. Flame 1993, 93, 119–137. [Google Scholar] [CrossRef]
  26. Ni, M.; Leung, M.K.H.; Leung, D.Y.C. A modeling study on concentration overpotentials of a reversible solid oxide fuel cell. J. Power Sources 2006, 163, 460–466. [Google Scholar] [CrossRef]
  27. Ni, M. Computational fluid dynamics modeling of a solid oxide electrolyzer cell for hydrogen production. Int. J. Hydrogen Energy 2009, 34, 7795–7806. [Google Scholar] [CrossRef]
  28. Opila, E.J. Volatility of common protective oxides in high-temperature water vapor: Current understanding and unanswered questions. In Proceedings of the High Temperature Corrosion and Protection of Materials 6; Materials Science Forum; Trans Tech Publications Ltd.: Wollerau, Switzerland, 2004; Volume 461, pp. 765–774. [Google Scholar] [CrossRef]
  29. Wuillemin, Z. Experimental and Modeling Investigations on Local Performance and Local Degradation in Solid Oxide Fuel Cells. Ph.D. Thesis, École Polytechnique Fédérale de Lausanne, Lausanne, Switzerland, 2009. [Google Scholar]
  30. Foo, K.; Hameed, B. Insights into the modeling of adsorption isotherm systems. Chem. Eng. J. 2010, 156, 2–10. [Google Scholar] [CrossRef]
  31. Chorkendorff, I.; Niemantsverdriet, J. Concepts of Modern Catalysis and Kinetics, 3rd ed.; Wiley-VCH: Hoboken, NJ, USA, 2017. [Google Scholar]
  32. Kröll, L.; de Haart, L.G.J.; Vinke, I.; Eichel, R.A. Degradation Mechanisms in Solid-Oxide Fuel and Electrolyzer Cells: Analytical Description of Nickel Agglomeration in a Ni/YSZ Electrode. Phys. Rev. Appl. 2017, 7, 044007. [Google Scholar] [CrossRef]
  33. Beez, A.; Schiemann, K.; Menzler, N.H.; Bram, M. Accelerated Testing of Chromium Poisoning of Sr-Containing Mixed Conducting Solid Oxide Cell Air Electrodes. Front. Energy Res. 2018, 6, 70. [Google Scholar] [CrossRef]
  34. Motagamwala, A.H.; Dumesic, J.A. Microkinetic Modeling: A Tool for Rational Catalyst Design. Chem. Rev. 2021, 121, 1049–1076. [Google Scholar] [CrossRef]
  35. Hindmarsh, A.C.; Brown, P.N.; Grant, K.E.; Lee, S.L.; Serban, R.; Shumaker, D.E.; Woodward, C.S. SUNDIALS: Suite of nonlinear and differential/algebraic equation solvers. ACM Trans. Math. Softw. (TOMS) 2005, 31, 363–396. [Google Scholar] [CrossRef]
  36. Gardner, D.J.; Reynolds, D.R.; Woodward, C.S.; Balos, C.J. Enabling new flexibility in the SUNDIALS suite of nonlinear and differential/algebraic equation solvers. ACM Trans. Math. Softw. (TOMS) 2022, 48, 1–24. [Google Scholar] [CrossRef]
  37. Fang, Q.; Menzler, N.H.; Blum, L. Degradation Analysis of Long-Term Solid Oxide Fuel Cell Stacks with Respect to Chromium Poisoning in La0.58Sr0.4Co0.2Fe0.8O3−δ and La0.6Sr0.4CoO3−δ in Cathodes. J. Electrochem. Soc. 2021, 168, 104505. [Google Scholar] [CrossRef]
  38. Wan, T.H.; Saccoccio, M.; Chen, C.; Ciucci, F. Influence of the Discretization Methods on the Distribution of Relaxation Times Deconvolution: Implementing Radial Basis Functions with DRTtools. Electrochim. Acta 2015, 184, 483–499. [Google Scholar] [CrossRef]
  39. Yan, Y.; Fang, Q.; Blum, L.; Lehnert, W. Performance and degradation of an SOEC stack with different cell components. Electrochim. Acta 2017, 258, 1254–1261. [Google Scholar] [CrossRef]
  40. Caliandro, P.; Nakajo, A.; Diethelm, S.; Van herle, J. Model-assisted identification of solid oxide cell elementary processes by electrochemical impedance spectroscopy measurements. J. Power Sources 2019, 436, 226838. [Google Scholar] [CrossRef]
  41. Weather Data in Jülich from December 2019 to February 2020. Available online: https://www.timeanddate.com/weather/germany/juelich/historic?month=3&year=2020 (accessed on 1 February 2023).
  42. Calculator of the Absolute Humidity. Available online: https://www.omnicalculator.com/physics/absolute-humidity (accessed on 1 February 2023).
  43. Whiston, M.M.; Azevedo, I.M.; Litster, S.; Samaras, C.; Whitefoot, K.S.; Whitacre, J.F. Meeting U.S. Solid Oxide Fuel Cell Targets. Joule 2019, 3, 2060–2065. [Google Scholar] [CrossRef]
  44. Menzler, N.H.; Sebold, D.; Zischke, S. SOC Degradation: Long-Term and Small-Scale Effects. ECS Trans. 2019, 91, 719. [Google Scholar] [CrossRef]
  45. Haart, L.G.J.B.D.; Beale, S.B.; Deja, R.; Dittrich, L.; Duyster, T.; Fang, Q.; Foit, S.; Gross-Barsnick, S.; Margaritis, N.; de Haart, U.; et al. Forschungszentrum Jülich—Current Activities in SOC Development. ECS Trans. 2021, 103, 299. [Google Scholar] [CrossRef]
  46. Hui, R.; Wang, Z.; Kesler, O.; Rose, L.; Jankovic, J.; Yick, S.; Maric, R.; Ghosh, D. Thermal plasma spraying for SOFCs: Applications, potential advantages, and challenges. J. Power Sources 2007, 170, 308–323. [Google Scholar] [CrossRef]
  47. Qiu, P.; Lin, J.; Lei, L.; Yuan, Z.; Jia, L.; Li, J.; Chen, F. Evaluation of Cr-Tolerance of the Sr2Fe1.5Mo0.5O63−δ Cathode for Solid Oxide Fuel Cells. ACS Appl. Energy Mater. 2019, 2, 7619–7627. [Google Scholar] [CrossRef]
  48. Niu, Y.; Zhou, Y.; Lv, W.; Chen, Y.; Zhang, Y.; Zhang, W.; Luo, Z.; Kane, N.; Ding, Y.; Soule, L.; et al. Enhancing Oxygen Reduction Activity and Cr Tolerance of Solid Oxide Fuel Cell Cathodes by a Multiphase Catalyst Coating. Adv. Funct. Mater. 2021, 31, 2100034. [Google Scholar] [CrossRef]
  49. Yang, J.; Polfus, J.M.; Li, Z.; Tuller, H.L.; Yildiz, B. Role of Adsorbate Coverage on the Oxygen Dissociation Rate on Sr-Doped LaMnO3 Surfaces in the Presence of H2O and CO2. Chem. Mater. 2020, 32, 5483–5492. [Google Scholar] [CrossRef]
  50. Zhou, Y.; Zhang, W.; Kane, N.; Luo, Z.; Pei, K.; Sasaki, K.; Choi, Y.; Chen, Y.; Ding, D.; Liu, M. An Efficient Bifunctional Air Electrode for Reversible Protonic Ceramic Electrochemical Cells. Adv. Funct. Mater. 2021, 31, 2105386. [Google Scholar] [CrossRef]
  51. Joos, J. Microstructural Characterisation, Modelling and Simulation of Solid Oxide Fuel Cell Cathodes. Ph.D. Thesis, Karlsruher Institut für Technologie (KIT), Karlsruher, Germany, 2017. [Google Scholar] [CrossRef]
  52. Ruder, A.; Buchkremer, H.P.; Jansen, H.; Malléner, W.; Stöver, D. Wet powder spraying—A process for the production of coatings. Surf. Coatings Technol. 1992, 53, 71–74. [Google Scholar] [CrossRef]
  53. Stenzel, A.; Fähsing, D.; Schütze, M.; Galetz, M.C. Volatilization kinetics of chromium oxide, manganese oxide, and manganese chromium spinel at high temperatures in environments containing water vapor. Mater. Corros. 2019, 70, 1426–1438. [Google Scholar] [CrossRef]
  54. Effori, E.; Laurencin, J.; Silva, E.D.R.; Hubert, M.; David, T.; Petitjean, M.; Geneste, G.; Dessemond, L.; Siebert, E. An Elementary Kinetic Model for the LSCF and LSCF-CGO Electrodes of Solid Oxide Cells: Impact of Operating Conditions and Degradation on the Electrode Response. J. Electrochem. Soc. 2021, 168, 044520. [Google Scholar] [CrossRef]
  55. Huang, Y.L.; Pellegrinelli, C.; Wachsman, E.D. Fundamental Impact of Humidity on SOFC Cathode ORR. J. Electrochem. Soc. 2015, 163, F171. [Google Scholar] [CrossRef]
Figure 1. A schematic of the geometry of the model. The left figure is the geometry in three dimensions and the right figure is the geometry in the cross-section of the y–z plane.
Energies 16 07841 g001
Figure 2. Schematic of chromium poisoning inside the AEL. The left figure shows the distribution of SrO and the right figure shows the distribution of Cr2O3 and SrCrO4 in the AEL. A darker color indicates a higher amount of chemical species.
Energies 16 07841 g002
Figure 3. Solution procedures in the numerical calculation. Note: steady-state simulations are conducted based on a previous work by the present authors [22]. The initialization of surface coverage, Θ i , can be found in Appendices Appendix D and Appendix E.
Energies 16 07841 g003
Figure 4. Simulated and experimentally measured U–t curves of stack F1002-97. Inserted orange and blue numbers are absolute degradation rates (mV/kh) calculated from simulations and experimental data, respectively.
Energies 16 07841 g004
Figure 5. Spatial distribution of physical variables in the AEL of F1002-97 (a) ΘCr2O3, (b) ΘSrCrO4, (c) Θ free , and (d) η air . Slices are in the yz plane and uniformly distributed across the whole AEL. The first and the last slices are at the boundary faces of the geometry. The geometry is scaled according to (x,y,z) = (0.1, 1, 10).
Energies 16 07841 g005
Figure 6. Evolution of average (a) Θ i and (b) k chemCr and k eleChemCr in the AEL of the stack F1002-97.
Energies 16 07841 g006
Figure 7. Simulated and experimentally measured U–t curves of stack F1004-67. Inserted orange and blue numbers are absolute degradation rates (mV/kh) calculated from simulations and experimental data, respectively.
Energies 16 07841 g007
Figure 8. EIS analysis of F1004-67. EIS was measured by a Zahner IM6 workstation. The upper figure is the Nyquist plot and the lower figure is the DRT plot produced by the Matlab toolbox DRTTOOLS [38].
Energies 16 07841 g008
Figure 9. Simulated and experimentally measured U–t curves of stack F1004-106. Inserted orange and blue numbers are absolute degradation rates (mV/kh) calculated from simulations and experimental data, respectively.
Energies 16 07841 g009
Figure 10. Parametric study of (a) the temperature effect and (b) the humidity effect on chromium poisoning. The inserted numbers are overall absolute degradation rates (mV/kh) and relative degradation rates (%/kh). The absolute air humidity is calculated in the molar fraction.
Energies 16 07841 g010
Figure 11. Simulation of the spatial distribution of ΘSrCrO4 in the AEL and the CL after 100 kh operation. The stack design is the same as F1004-67. The temperature is 650 C and absolute air humidity is 1%. Slices are in the yz plane and uniformly distributed across the whole AEL. The first and the last slices are at the boundary faces of the geometry. The geometry is scaled according to (x,y,z) = (0.1, 1, 10).
Energies 16 07841 g011
Table 1. Governing equations and computational domains of the chromium poisoning model.
Physical ProcessGoverning EquationComputational Domain
Mass transport, CrO2(OH)2Equation (3)Air channel, CL and AEL
Chromium depositionEquations (14)–(19) and (23)Domain made of LSCF
Table 2. Stack designs and operation conditions of SOFC stacks.
Stack ID 1 F1002-97F1004-67F1004-106
Stack designCLLCC12LSCFLSCF
Protective coatingWPSAPSAPS
Operation conditionsTemperature 2720 C730 C720 C
Current density0.5 Acm 2 0.5 Acm 2 0.5 Acm 2
Time100 kh25 kh5509 h
Fuel mass flow1.18 ×   10 7 kg/s1.15 × 10−7 kg/s1.15 × 10−7 kg/s
Molar ratio in fuel H2/H2O79/2180/2080/20
Air mass flow1.9 × 10−6 kg/s1.18 ×   10 6 kg/s1.18 × 10−6 kg/s
Molar ratio in air O2/N221/7921/7921/79
Absolute humidity0.1%0.1%∼4009 h 0.1%
in inlet air ∼1500 h 0.8%
References [8][18][37]
1 “F10” is the code name of the specific stack design used in FZJ, the details of which can be found in Ref. [21]. The “10” means the area of the cell inside the stack is 10 cm × 10 cm. The area of the reactive part, however, is 9 cm × 9 cm. The whole stack ID is written as “F100A-B”, where “A” means the number of single cells in the stack and “B” means the serial number of that stack design. For example, F1002-97 indicates an F10 stack consisting of two single cells and this stack is the 97th stack using the stack design of F1002. 2 The temperature is measured by the thermocouple, which was inserted ∼10 mm deep into the intermediate interconnect [8].
Disclaimer/Publisher’s Note: The statements, opinions and data contained in all publications are solely those of the individual author(s) and contributor(s) and not of MDPI and/or the editor(s). MDPI and/or the editor(s) disclaim responsibility for any injury to people or property resulting from any ideas, methods, instructions or products referred to in the content.

