
Methane Production from a Rendering Waste Covered Anaerobic Digester: Greenhouse Gas Reduction and Energy Production


Abstract
:1. Introduction
2. Materials and Methods
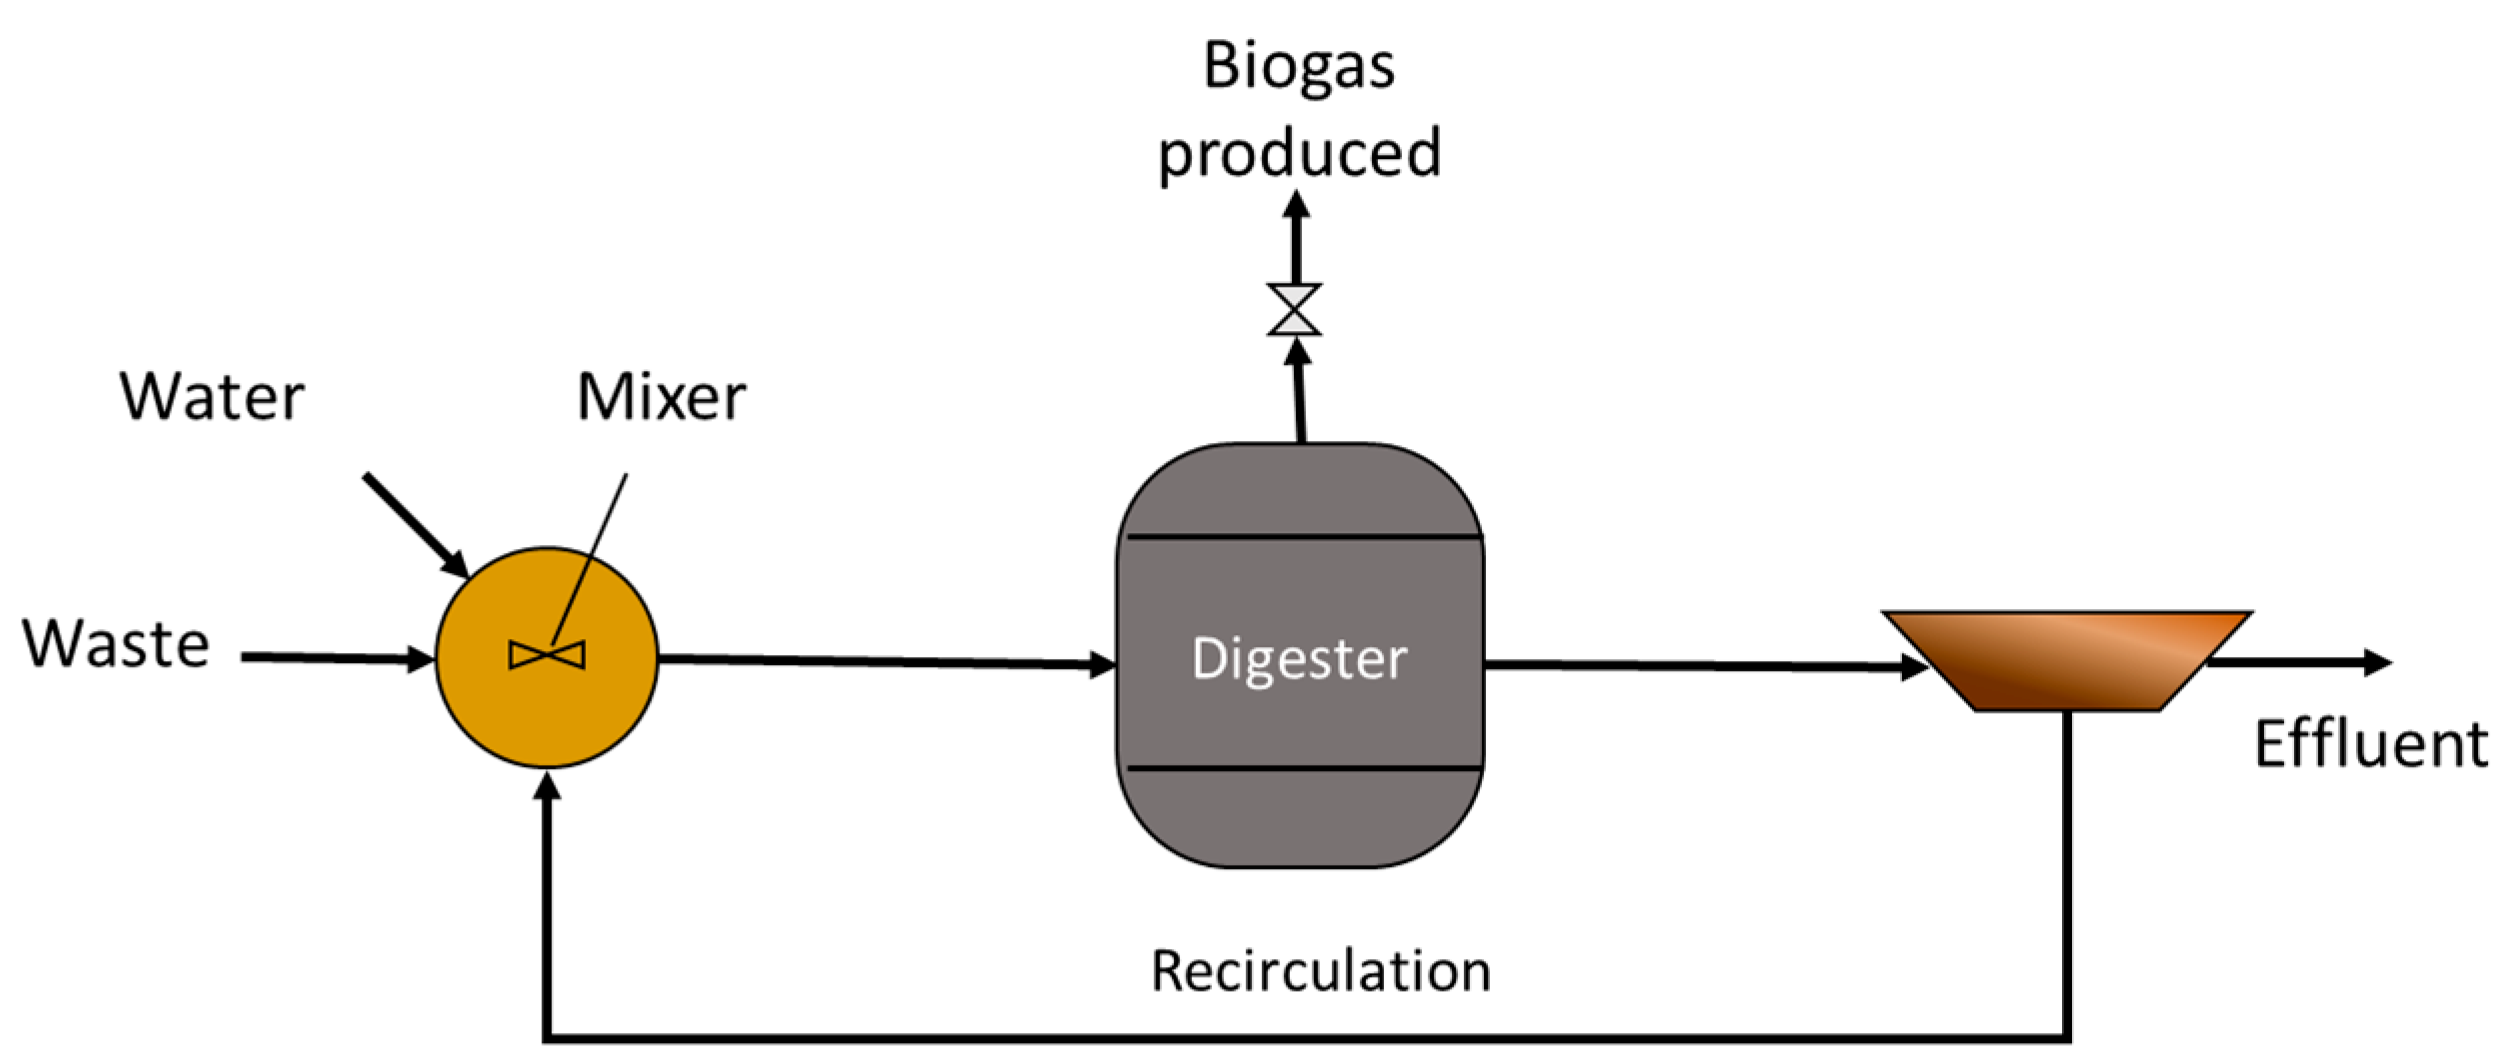
2.1. Large Covered Lagoon
2.2. Pilot-Scale Plug-Flow Digester
2.3. Theoretical Calculation
2.4. Analytical Methods
3. Results and Discussions
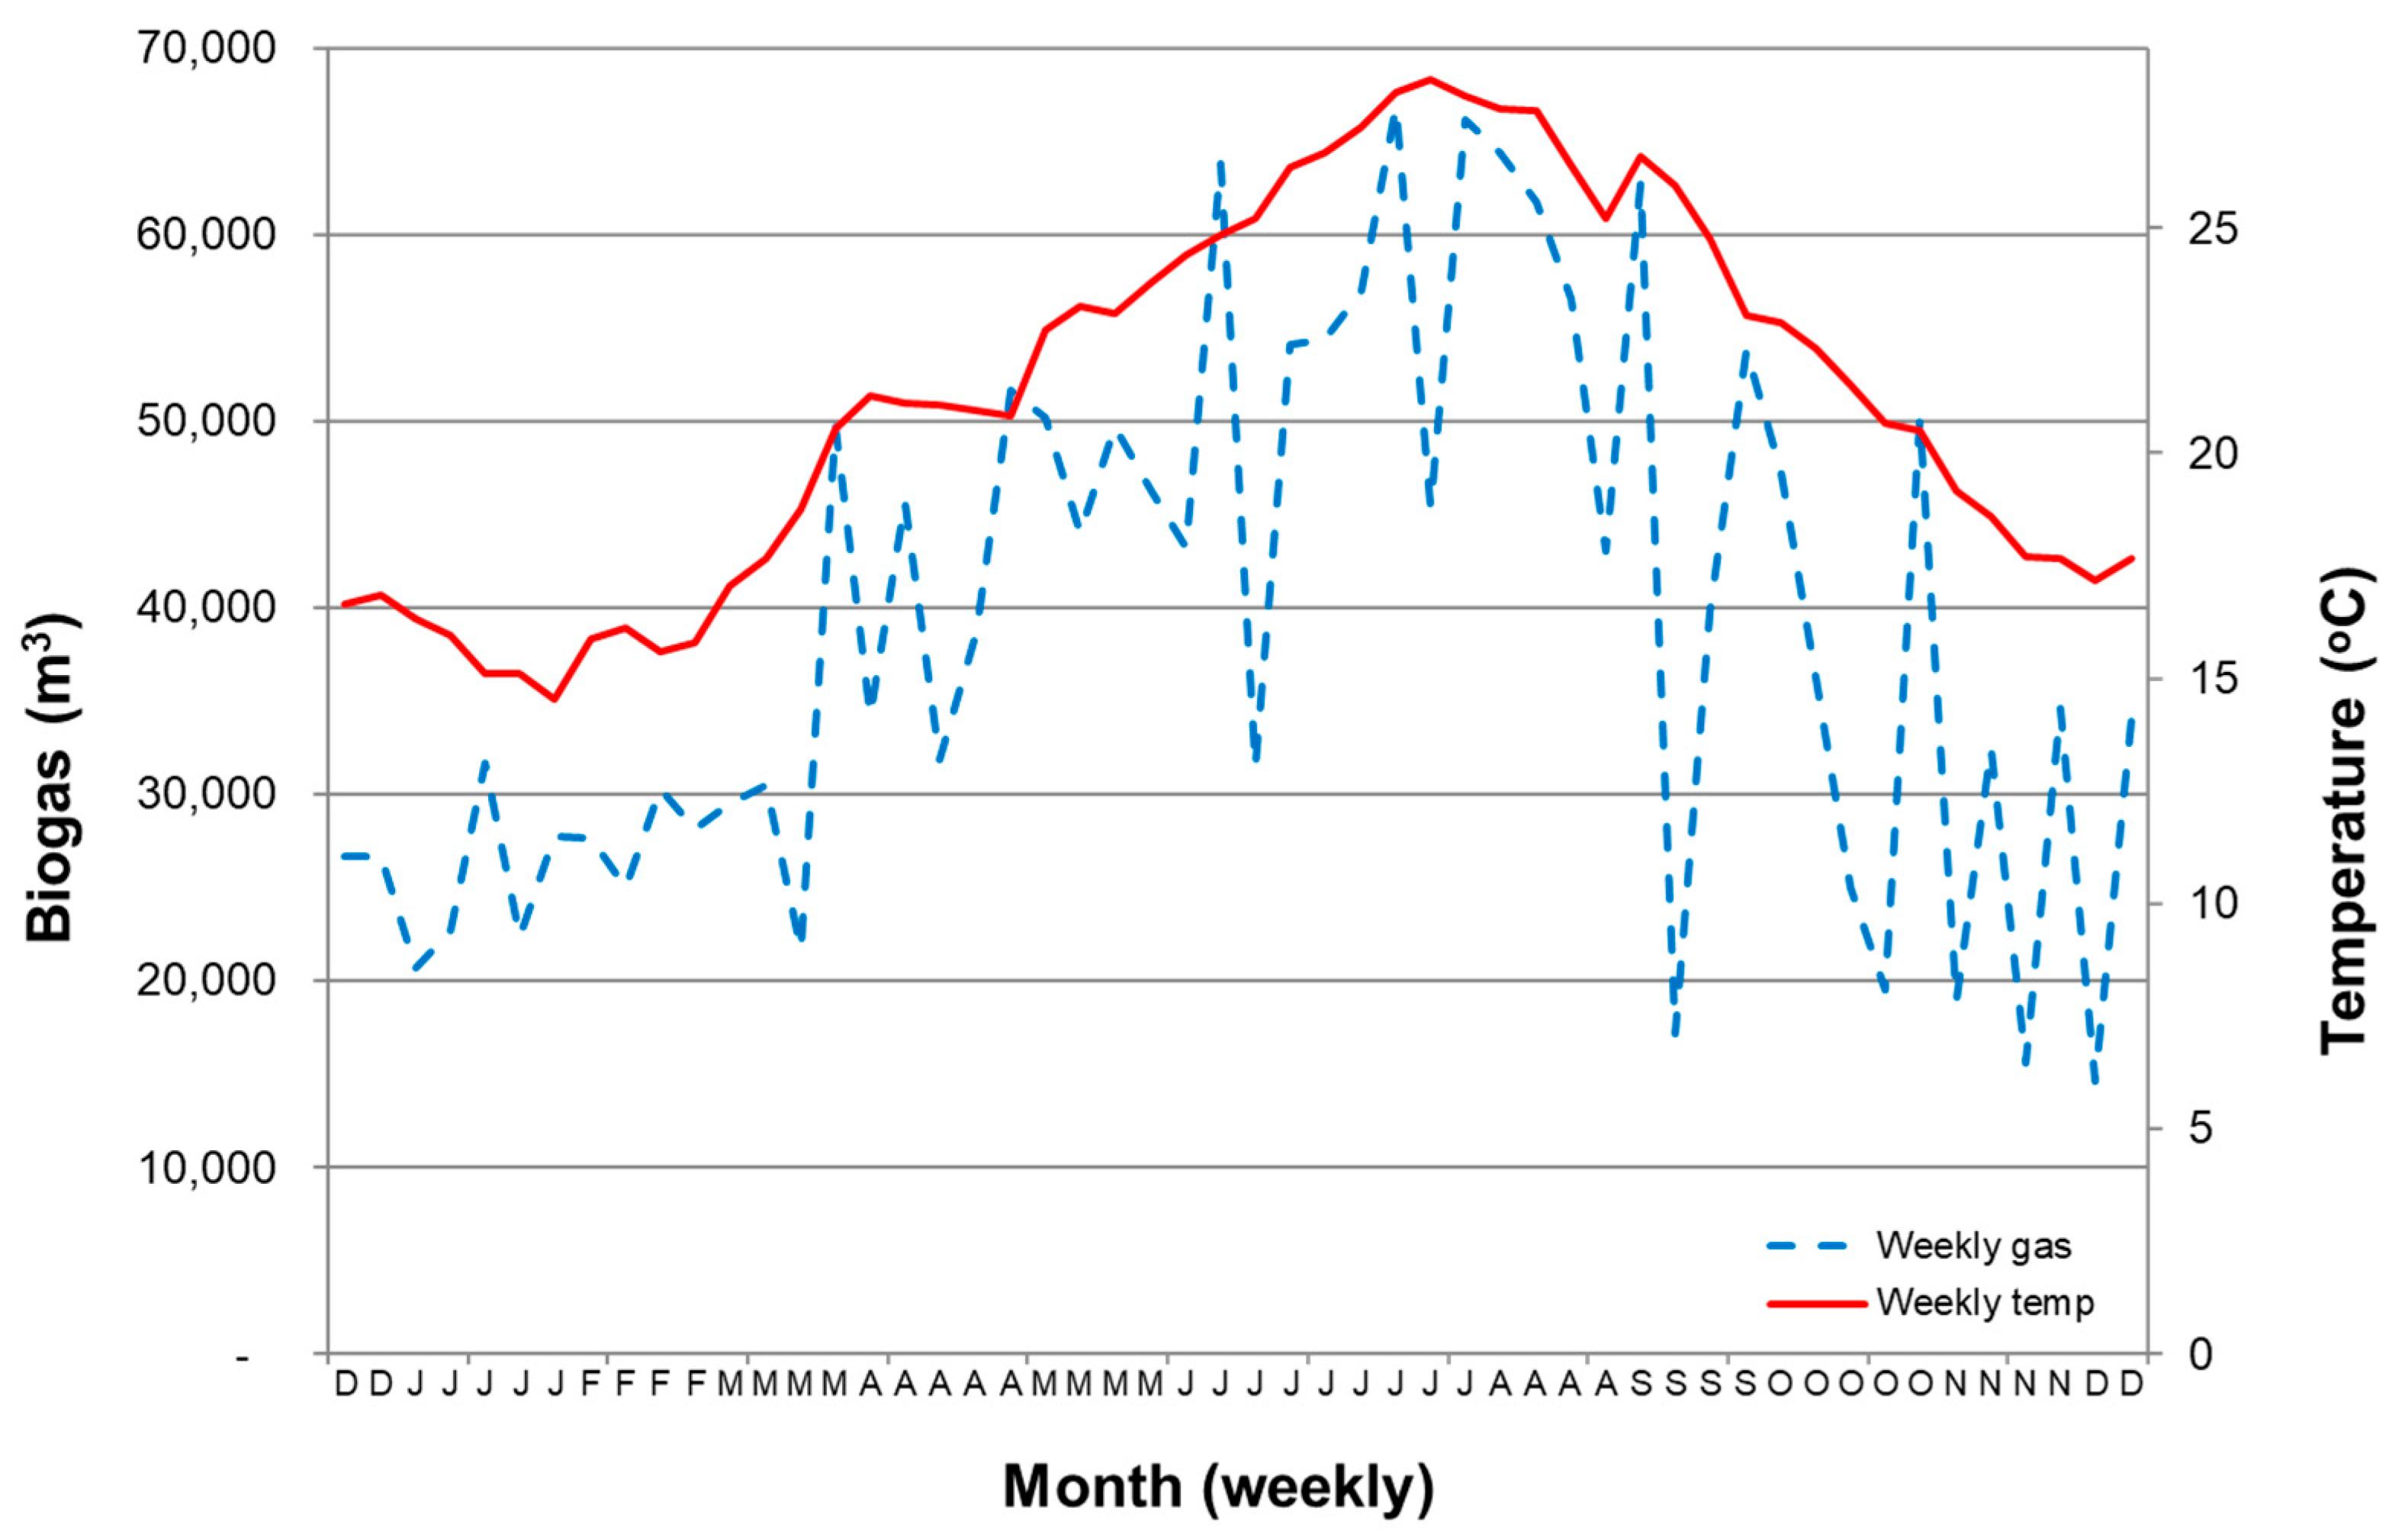
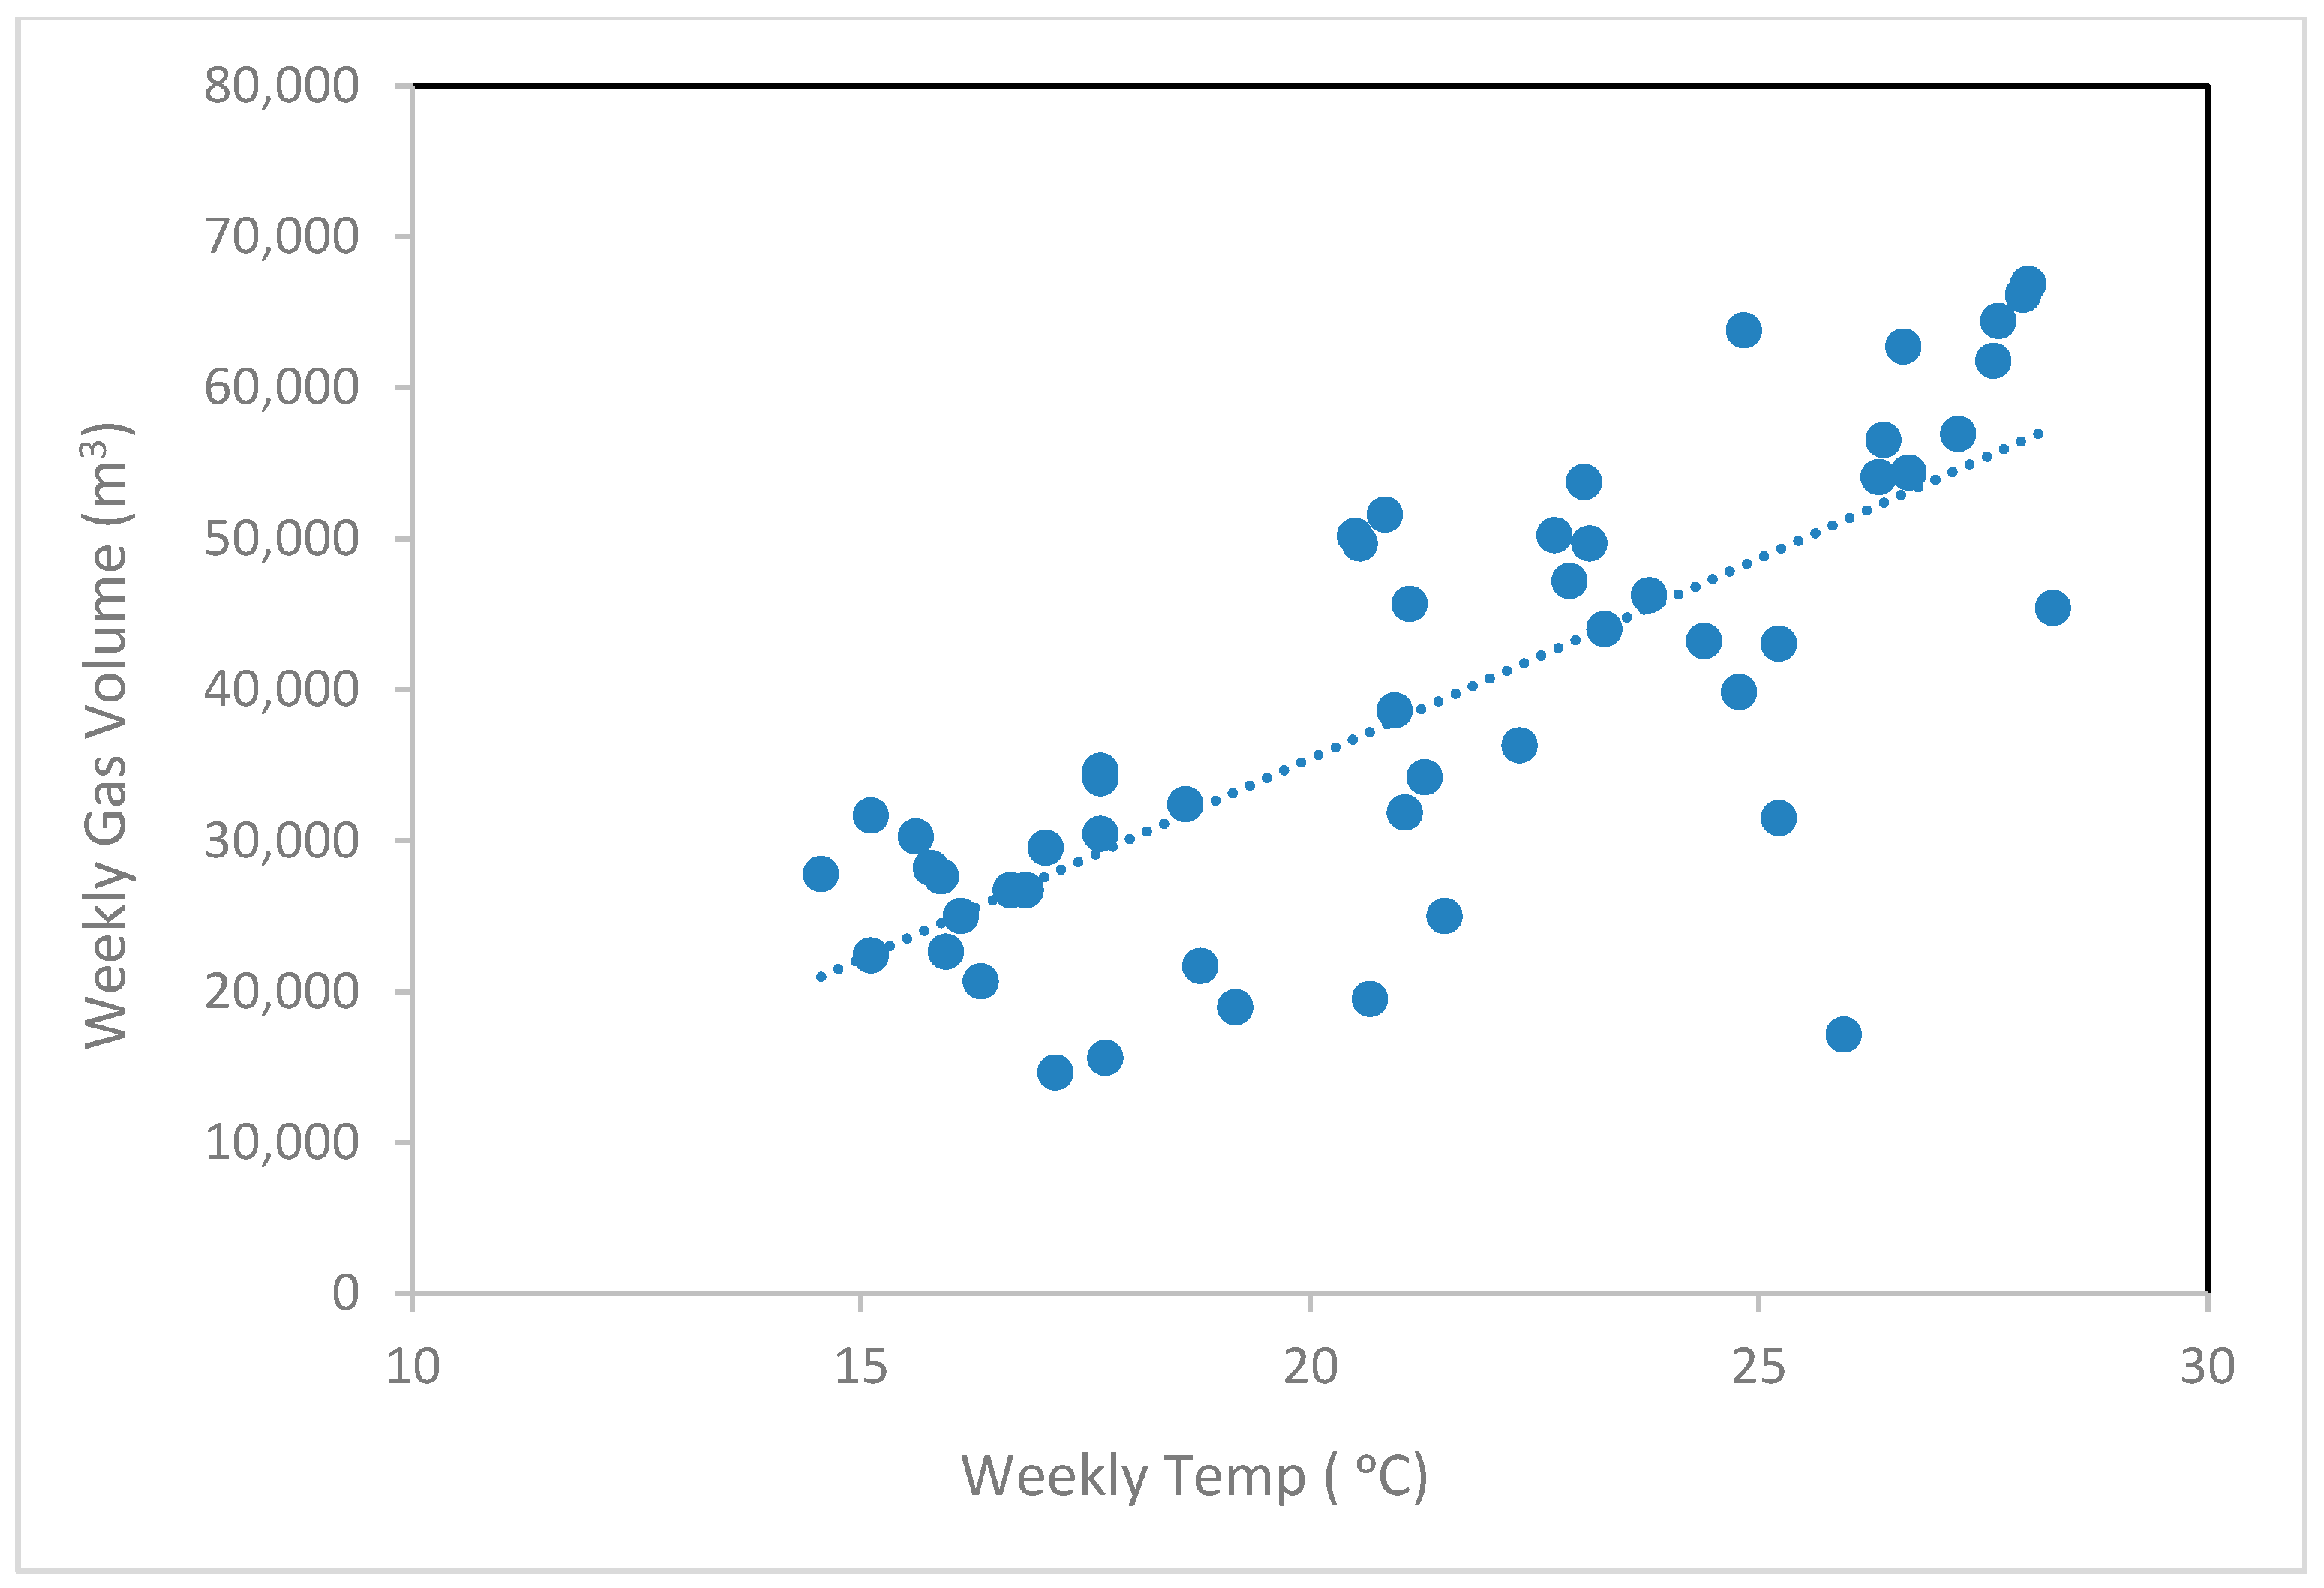
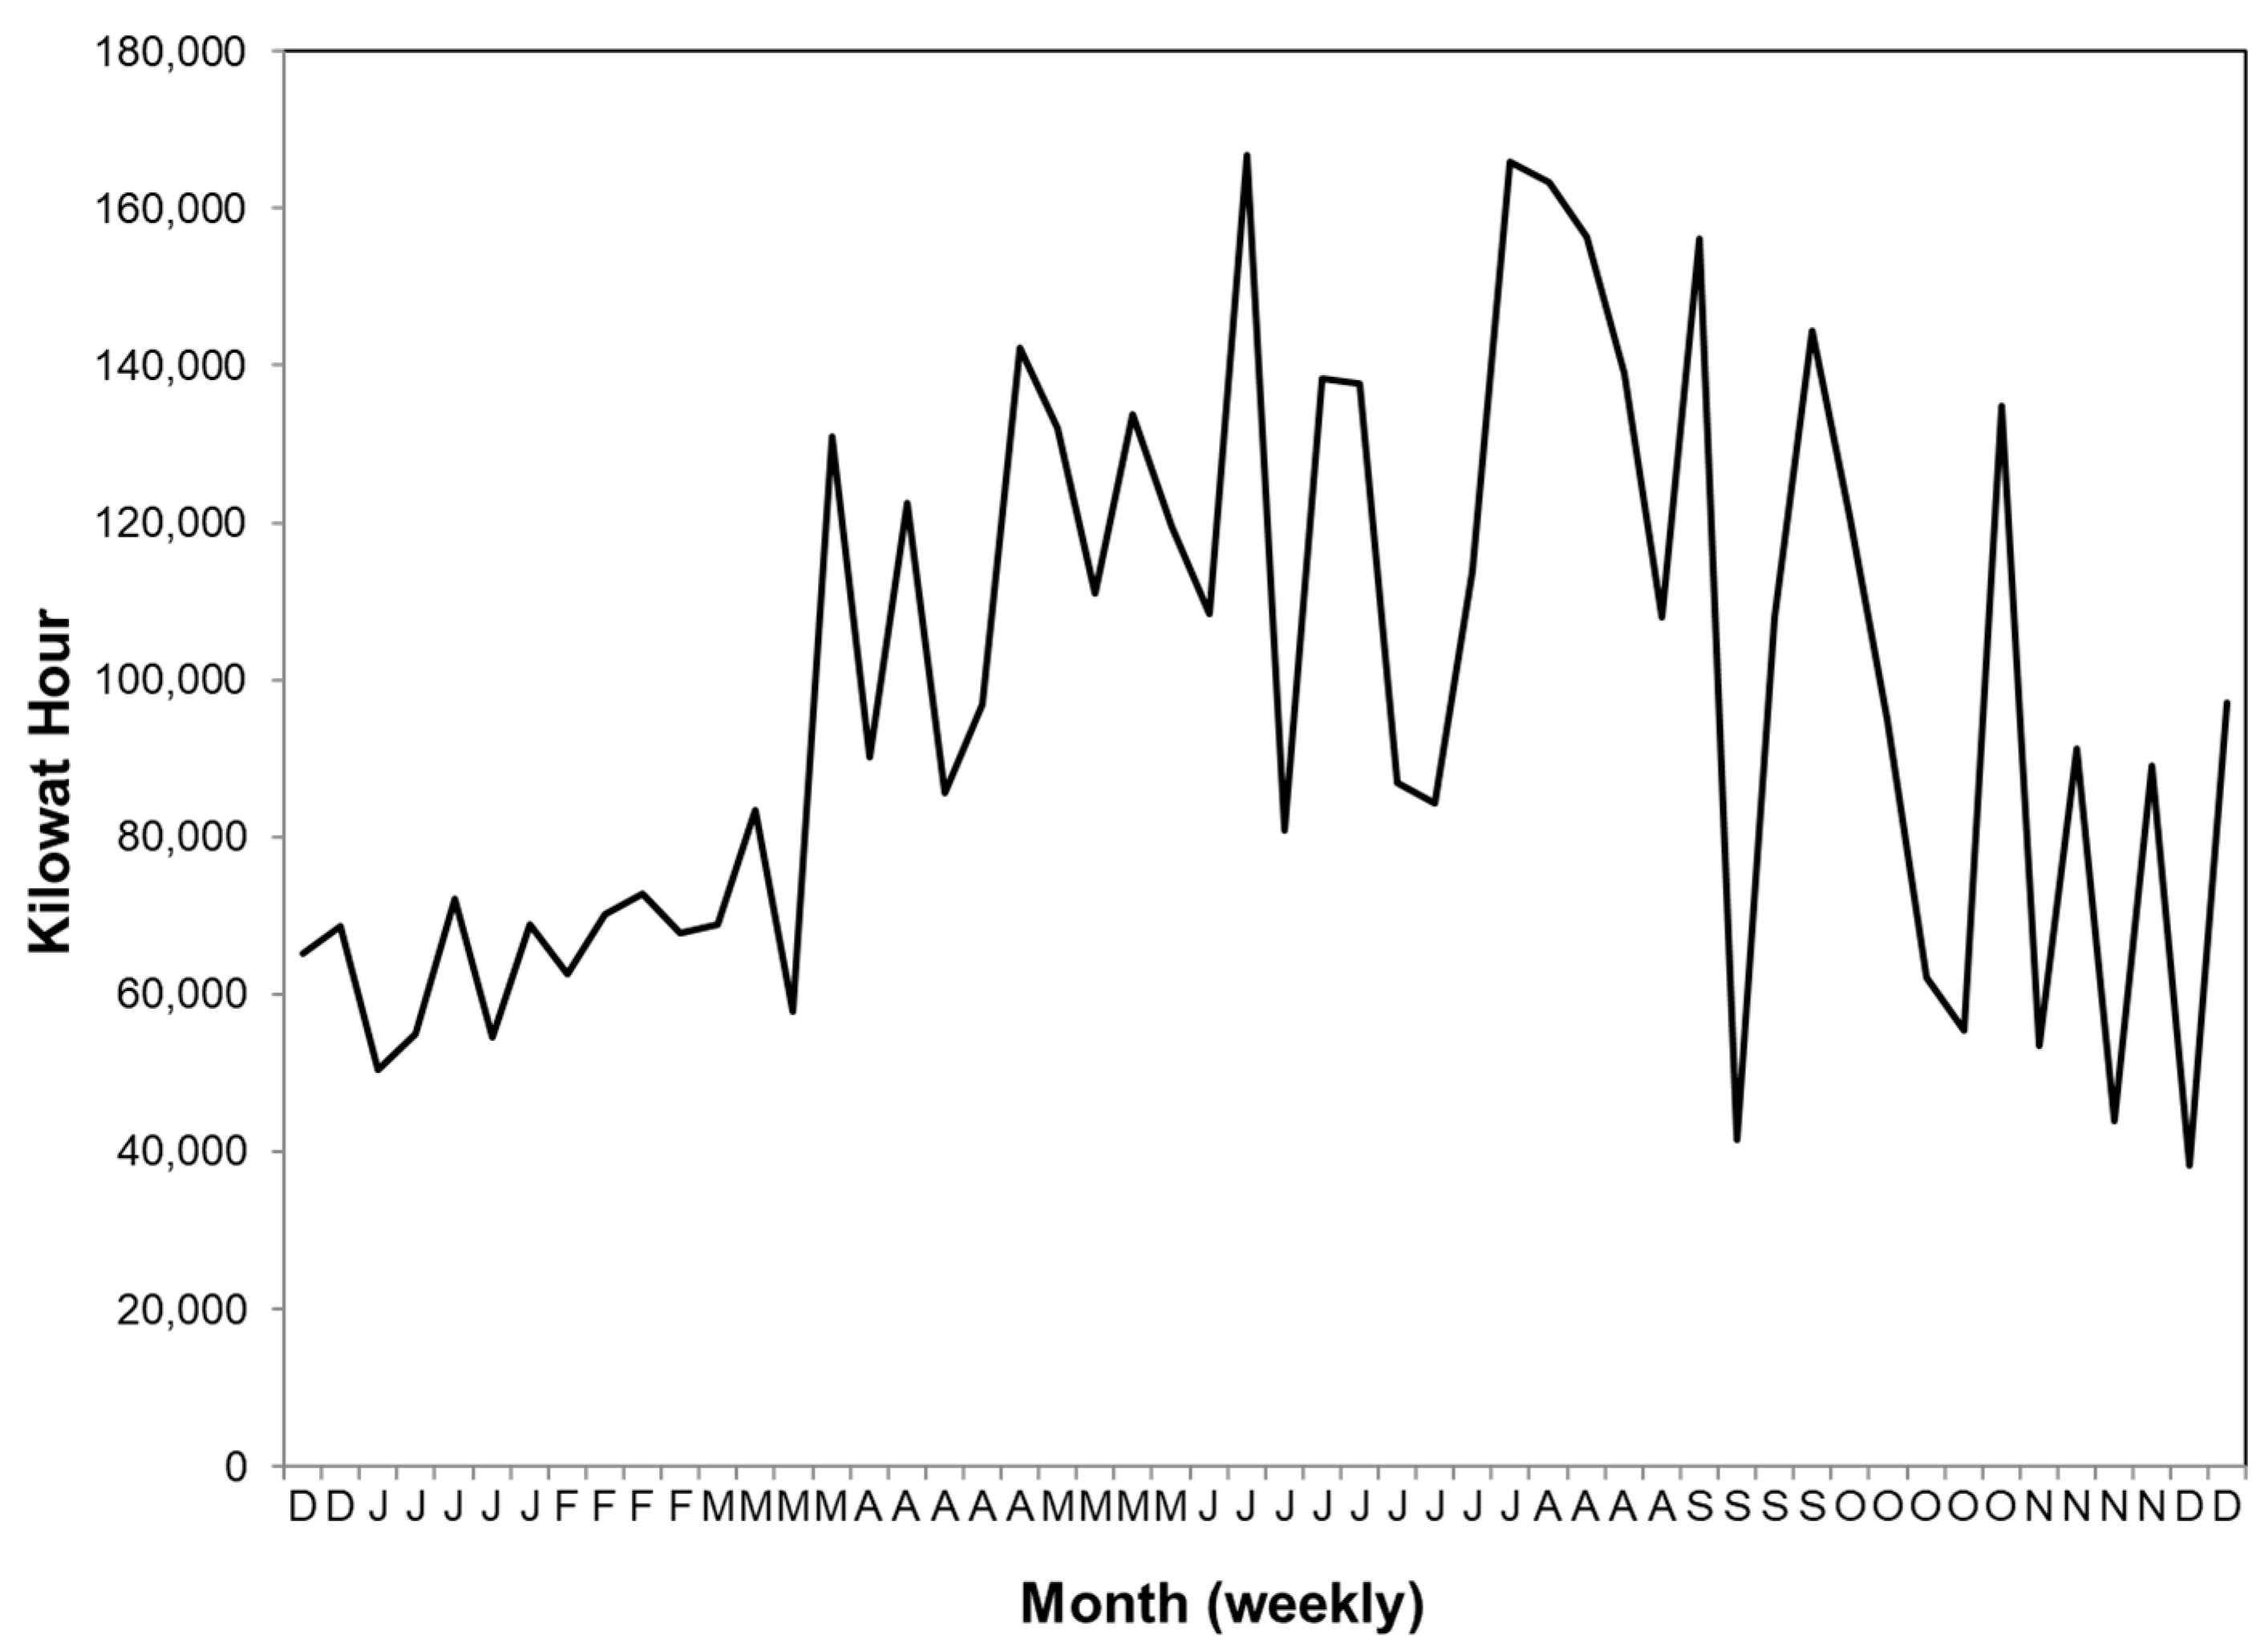
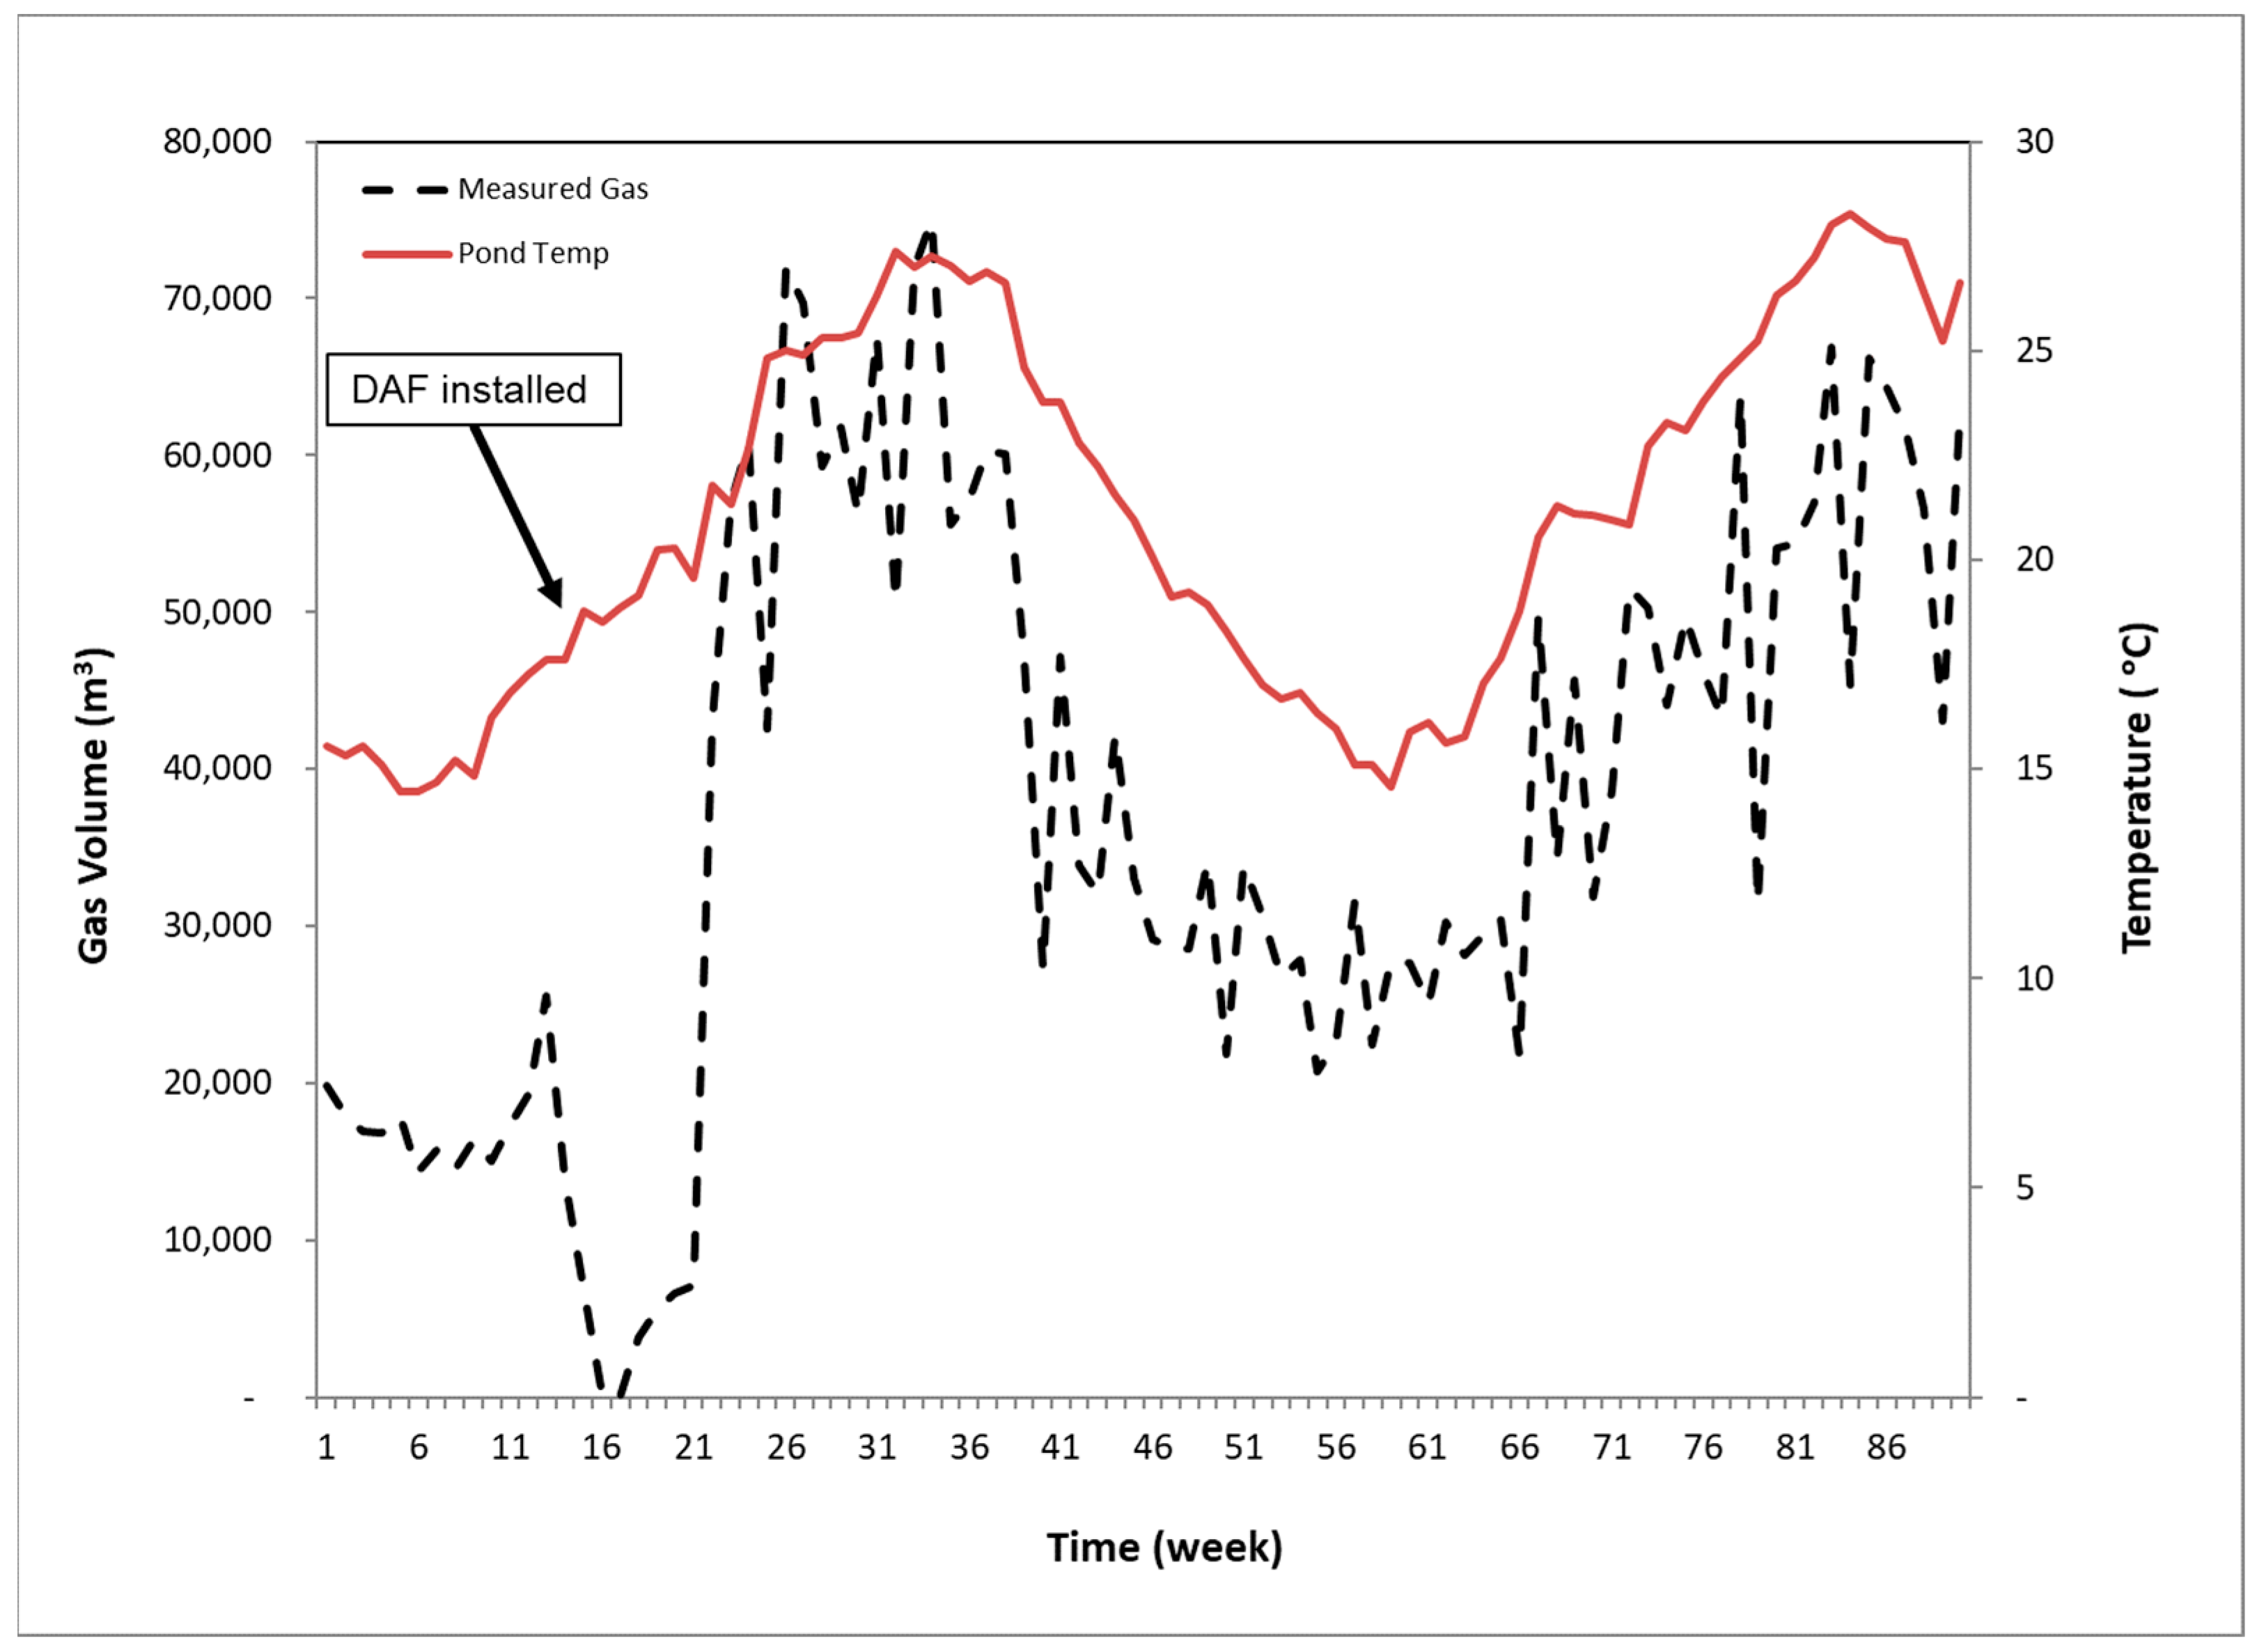
3.1. The Covered Poultry Rendering Wastewater Lagoon
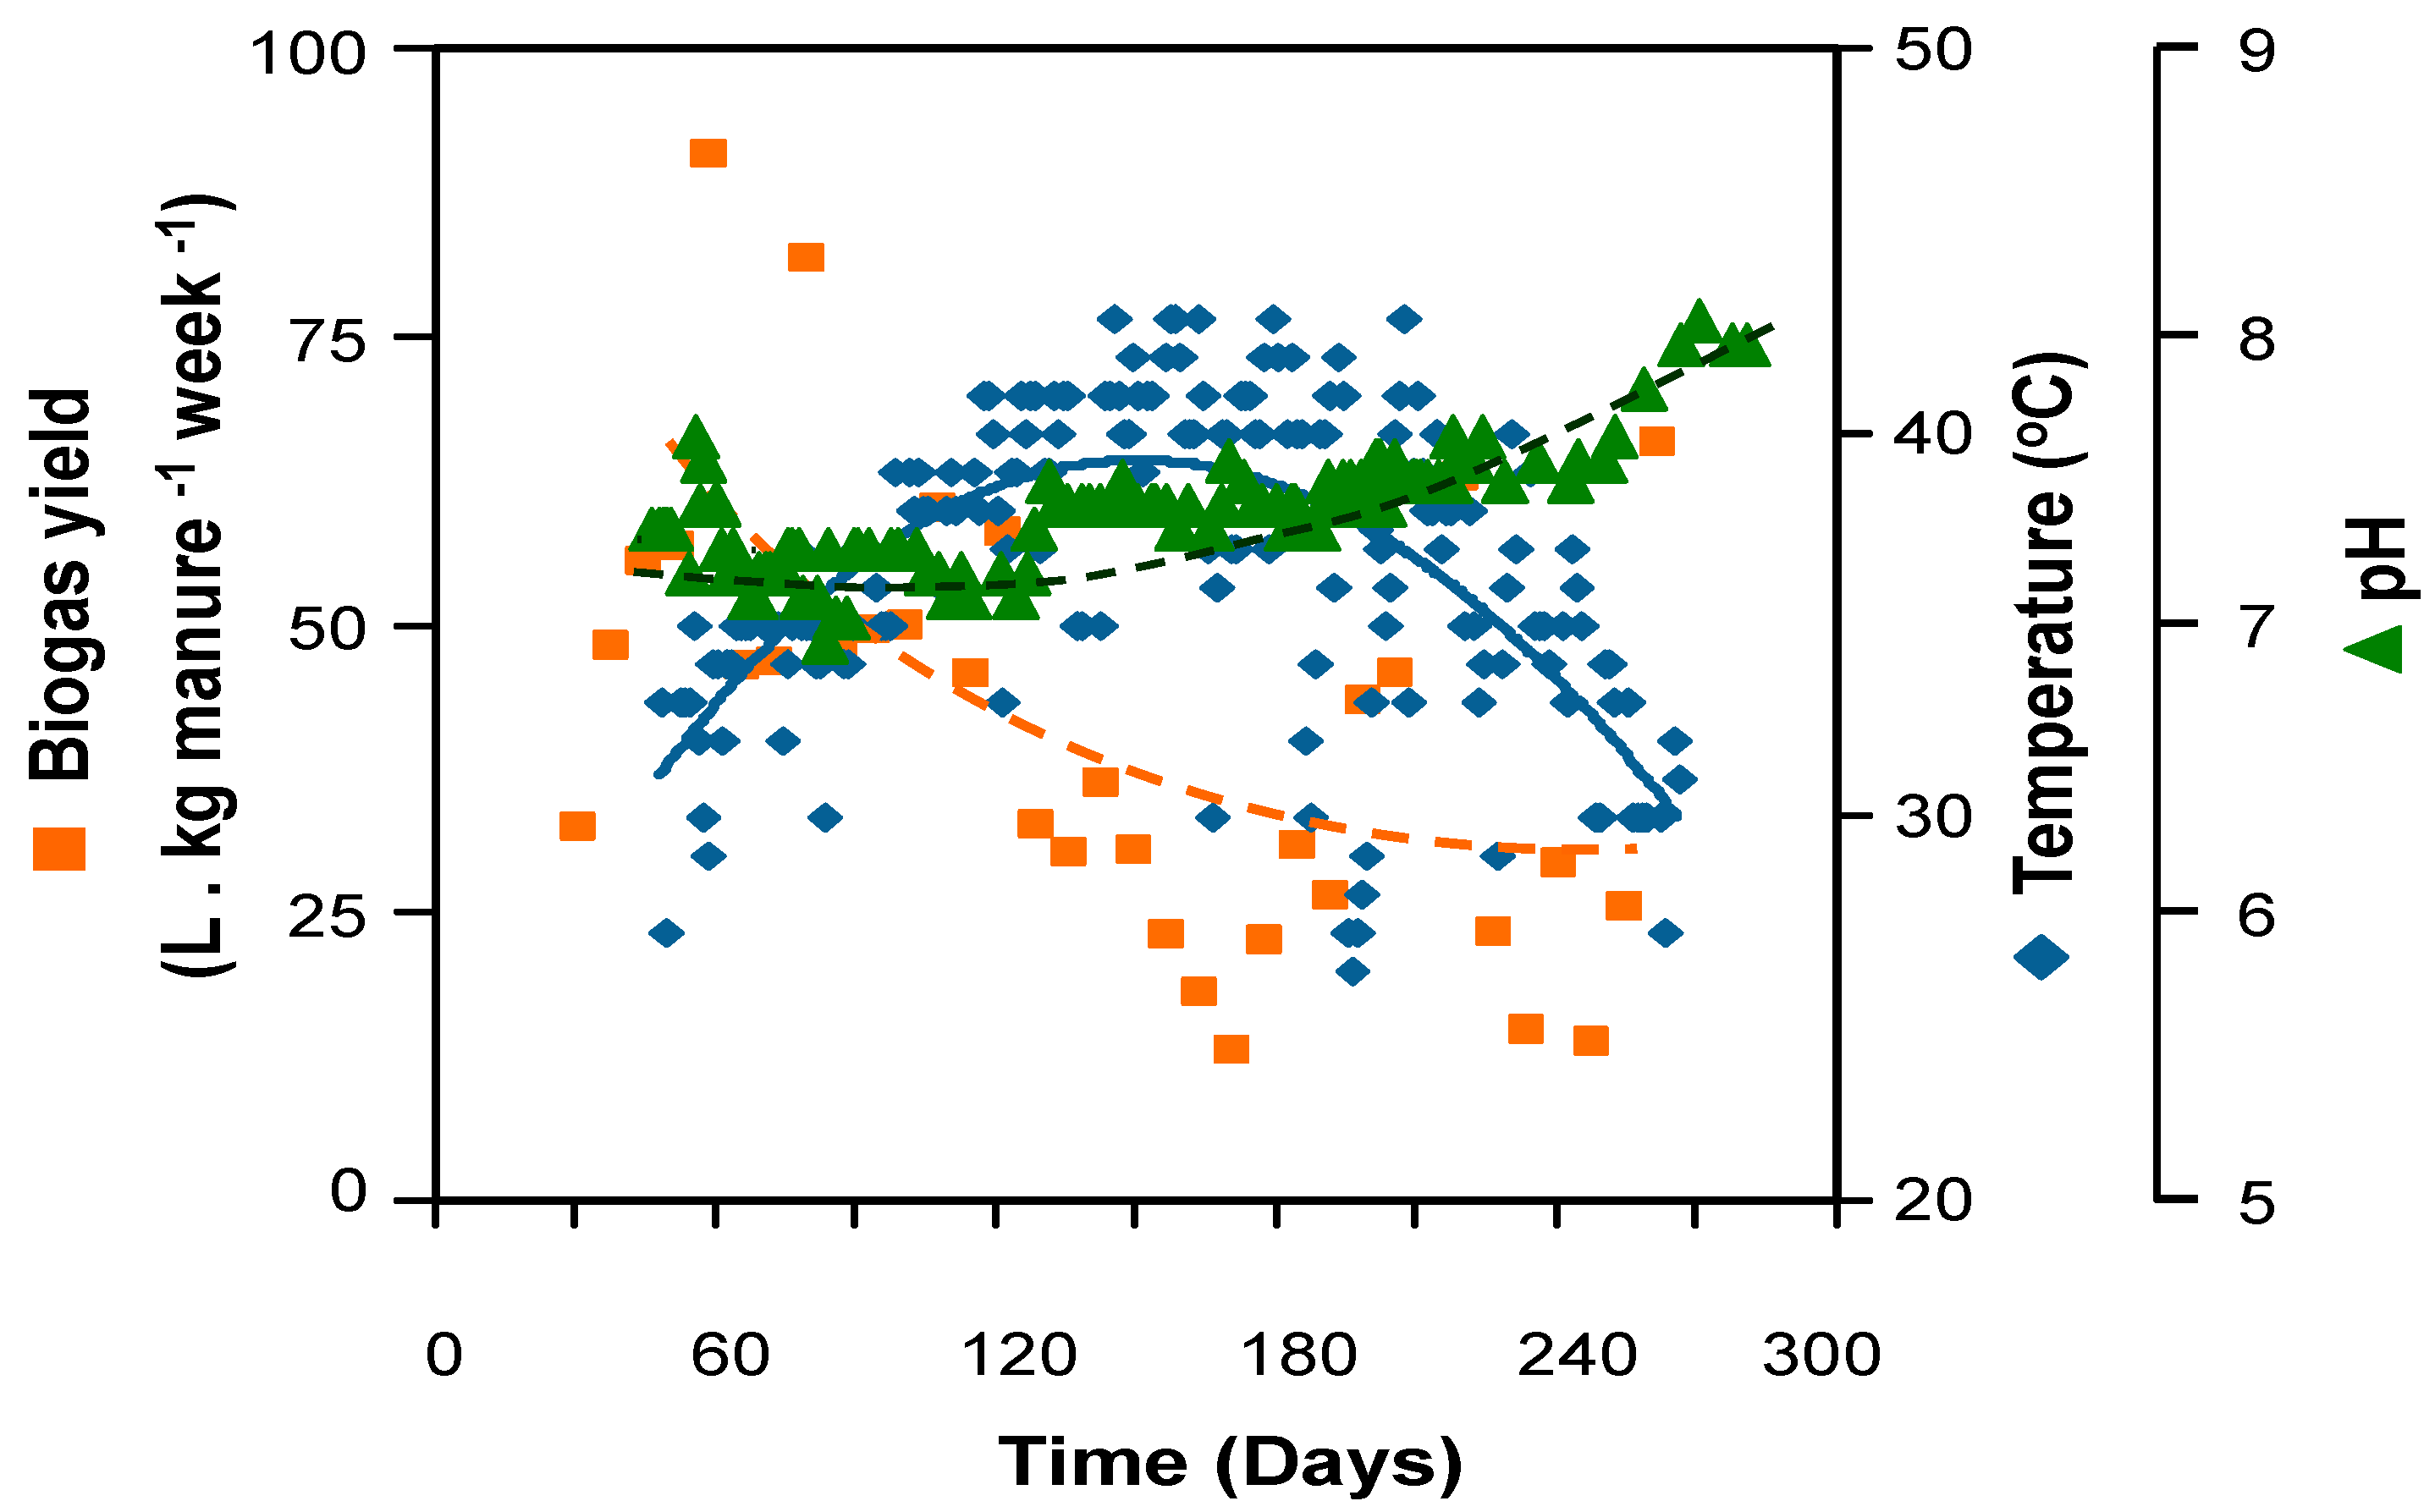
3.2. Pilot-Scale Validation Using Dairy Manure
3.3. Greenhouse Gas and Biomass Reduction
4. Conclusions
Author Contributions
Funding
Data Availability Statement
Acknowledgments
Conflicts of Interest
References
- Rotmans, J.; Den Elzen, M.G.J.; Krol, M.S.; Swart, R.J.; Van Der Woerd, H.J. Stabilizing atmospheric concentrations-towards international methane control. Ambio 1992, 21, 404–413. [Google Scholar]
- IPCC/WMO/UNEP. Climate Change 2007: Impacts, Adaptation, and Mitigation of Climate Change: Scientific-Technical Analyses; Prepared by IPCC Working Group III; Cambridge University Press: Cambridge, UK, 2007. [Google Scholar]
- Scheehle, E.; Godwin, D.; Ottinger, D. Global Anthropogenic Non-CO2 Greenhouse Gas Emissions: 1990–2020; U.S. Environmental Protection Agency: Washington, DC, USA, 2006.
- Scheehle, E.A.; Irving, W.N.; Kruger, D. Global anthropogenic methane emissions. In Non-CO2 Greenhouse Gases: Scientific Understanding, Control Options and Policy Aspects, Proceedings of the 3rd International Symposium NCGG-3, Maastricht, Netherlands, 21–23 January 2002; Van Ham, J., Baede, A.P.M., Guicherit, R., Williams-Jacobse, J.G.F.M., Eds.; Millpress: Rotterdam, The Netherlands, 2002; pp. 257–262. [Google Scholar]
- Lassey, K.R. Livestock methane emission: From the individual grazing animal through national inventories to the global methane cycle. Agric. For. Meteorol. 2007, 142, 120–132. [Google Scholar] [CrossRef]
- Cooper, R.N.; Russel, J.M. Meat industry processing wastes: Characteristics and treatments. In Encyclopaedia of Food Science, Food Technology, and Nutrition; Hui, Y.H., Ed.; Academic Press: Cambridge, MA, USA, 1992; Volume 3, pp. 1683–1690. [Google Scholar]
- Mata-Alvarez, J.; Macé, S.; Llabrés, P. Anaerobic digestion of organic solid wastes. An overview of research achievements and perspectives. Bioresour. Technol. 2000, 74, 3–16. [Google Scholar] [CrossRef]
- Papadopoulos, M.C. Processed chicken feathers as feedstuff for poultry and swine. A review. Agric. Wastes 1985, 14, 275–290. [Google Scholar] [CrossRef]
- Papinaho, P.A. Physiological and Processing Factors Affecting Broiler Musculus Pectoralis Shear Vales and Tenderness. Ph.D. Thesis, Department of Food Technology, University of Helsinki, Helsinki, Finland, 1996. [Google Scholar]
- Hejnfelt, A.; Angelidaki, I. Anaerobic digestion of slaughterhouse by-products. Biomass Bioenergy 2009, 33, 1046–1054. [Google Scholar] [CrossRef]
- Kaparaju, P.; Bayr, S.; Rantanen, M.; Paavola, T.; Rintala, J. Methane and biofertilizer production potential from rendering plant and slaughterhouse wastes. In Proceedings of the 12th World Congress on Anaerobic Digestion, Guadalajara, Mexico, 31 October–4 November 2010. [Google Scholar]
- Rodríguez-Abalde, A.; Fernández, B.; Silvestre, G.; Flotats, X. Effects of thermal pre-treatments on solid slaughterhouse waste methane potential. Waste Manag. 2011, 31, 1488–1493. [Google Scholar] [CrossRef]
- Salminen, E.; Rintala, J. Anaerobic digestion of organic solid poultry slaughterhouse waste—A review. Bioresour. Technol. 2001, 83, 13–26. [Google Scholar] [CrossRef]
- Salminen, E.; Einola, J.; Rintala, J. The methane production of poultry slaughtering residues and effects of pre-treatments on the methane production of poultry feather. Environ. Technol. 2003, 24, 1079–1086. [Google Scholar] [CrossRef]
- Kirchmayr, R. Biogas from waste material as key technology for energy selfsufficient slaughterhouses. In ISWA World Congeress 2009, Book of Abstracts; ISWA (International Solid Waste Association): Lisbon, Portugal, 2009. [Google Scholar]
- Alvarez, R.; Lidén, G. Semi-continuous co-digestion of solid slaughterhouse waste, manure, and fruit and vegetable waste. Renew. Energy 2008, 33, 726–734. [Google Scholar] [CrossRef]
- Mittal, G.S. Treatment of wastewater from abattoirs before land application—A review. Bioresour. Technol. 2006, 97, 1119–1135. [Google Scholar] [CrossRef]
- Baker, B.R.; Mohamed, R.; Al-Gheethi, A.; Aziz, H.A. Advanced technologies for poultry slaughterhouse wastewater treatment: A systematic review. J. Dispers. Sci. Technol. 2020, 42, 880–899. [Google Scholar] [CrossRef]
- Wang, Y.; Serventi, I. Sustainability of dairy and soy processing: A review on wastewater recycling. J. Clean. Prod. 2019, 237, 117821. [Google Scholar] [CrossRef]
- Husted, S. Seasonal Variation in Methane Emission from Stored Slurry and Solid Manures. J. Environ. Qual. 1994, 23, 585–592. [Google Scholar] [CrossRef]
- Craggs, R.; Park, J.; Heubeck, S. Methane emissions from anaerobic ponds on a piggery and a dairy farm in New Zealand. Aust. J. Exp. Agric. 2008, 48, 142–146. [Google Scholar] [CrossRef]
- Leytem, A.B.; Dungan, R.S.; Bjorneberg, D.L.; Koehn, A.C. Emissions of ammonia, methane, carbon dioxide and nitrous oxide from dairy cattle housing and manure management systems. J. Environ. Qual. 2011, 40, 1383–1394. [Google Scholar] [CrossRef] [PubMed]
- Minato, K.; Kouda, Y.; Yamakawa, M.; Hara, S.; Tamura, T.; Osada, T. Determination of GHG and ammonia emissions from stored dairy cattle slurry by using a floating dynamic chamber. Anim. Sci. J. 2013, 84, 165–177. [Google Scholar] [CrossRef] [PubMed]
- Sommer, S.G.; Petersen, S.O.; Søgaard, H.T. Greenhouse Gas Emission from Stored Livestock Slurry. J. Environ. Qual. 2000, 29, 744–751. [Google Scholar] [CrossRef]
- Su, J.-J.; Liu, B.-Y.; Chang, Y.-C. Emission of greenhouse gas from livestock waste and wastewater treatment in Taiwan. Agric. Ecosyst. Environ. 2003, 95, 253–263. [Google Scholar] [CrossRef]
- Todd, R.; Cole, N.; Casey, K.; Hagevoort, R.; Auvermann, B. Methane emissions from southern High Plains dairy wastewater lagoons in the summer. Anim. Feed. Sci. Technol. 2011, 166-167, 575–580. [Google Scholar] [CrossRef]
- APHA; AWWA; WEF. Standard Methods for the Examination of Water and Wastewater, 21st ed.; American Public Health Association/American Water Works Association/Water Environment Federation: Washington, DC, USA, 2005. [Google Scholar]
- Kang, J.; Kim, K.; Oh, G.; Rhee, S. Analysis on biochemical methane potential of agricultural byproducts with different types of silage storage. J. Mater. Cycles Waste Manag. 2013, 16, 468–474. [Google Scholar] [CrossRef]
- Bustillo-Lecompte, C.; Mehrvar, M.; Quinones-Bolanos, E. Slaughterhouse wastewater characterization and treatment: An economic and public health necessity of the meat processing industry in Ontario, Canada. J. Geosci. Environ. Prot. 2016, 4, 175–186. [Google Scholar] [CrossRef]
- Kroeker, E.J.; Schulte, D.D.; Sparling, A.B.; Lapp, H.M. Anaerobic treatment process stability. J. Water Pollut. Control Fed. 1979, 51, 718–727. [Google Scholar]
- Zeeman, G.; Wiegant, W.; Koster-Treffers, M.; Lettinga, G. The influence of the total-ammonia concentration on the thermophilic digestion of cow manure. Agric. Wastes 1985, 14, 19–35. [Google Scholar] [CrossRef]
- Hashimoto, A.G. Thermophilic and mesophilic anaerobic fermentation of swine manure. Agric. Wastes 1983, 6, 175–191. [Google Scholar] [CrossRef]
- Hashimoto, A.G. Methane from swine manure: Effect of temperature and influent substrate concentration on kinetic parameter (K). Agric. Wastes 1984, 9, 299–308. [Google Scholar] [CrossRef]
- Hansen, K.H.; Angelidaki, I.; Ahring, B.K. Improving thermophilic anaerobic digestion of swine manure. Water Res. 1999, 33, 1805–1810. [Google Scholar] [CrossRef]
- Gebauer, R.; Eikebrokk, B. Mesophilic anaerobic treatment of sludge from salmon smolt hatching. Bioresour. Technol. 2006, 97, 2389–2401. [Google Scholar] [CrossRef]


| Poultry Rendering Waste | Dairy Manure | |
|---|---|---|
| COD (mg/L) | 10,000–14,000 | 7500–12,000 |
| TS (mg/L) | 2400–4000 | 3000–6500 |
| pH | 6.3–7.8 | 6.2–9.2 |
| N (%) | 6.5–17.4 | 2.2–4.2 |
| C (%) | 35.3–58.7 | 25.0–35.0 |
| SO4 (mg/L) | 81.2–125.3 | 112–247 |
| NH4 (mg/L) | 15.0–47.4 | 35.0–62.0 |
| Systems | ||
|---|---|---|
| Before DAF (mg/L) | After DAF (mg/L) | |
| Palmitic acid | 23.4 | 11.2–15.3 |
| Stearic acid | 25.1 | 13.7–16.2 |
| Myristic acid | 15.7 | 8.7–9.5 |
| Oleic acid | 29.2 | 17.4–21.6 |
| Palmitoleic acid | 18.5 | 8.4–12.4 |
| Linoleic acid | 13.5 | 5.2–7.4 |
| Cholesterol | 7.2 | 3.7–5.1 |
| Lanosterol | 9.5 | 4.1–6.4 |
| Desmosterol | 6.3 | 3.4–5.1 |
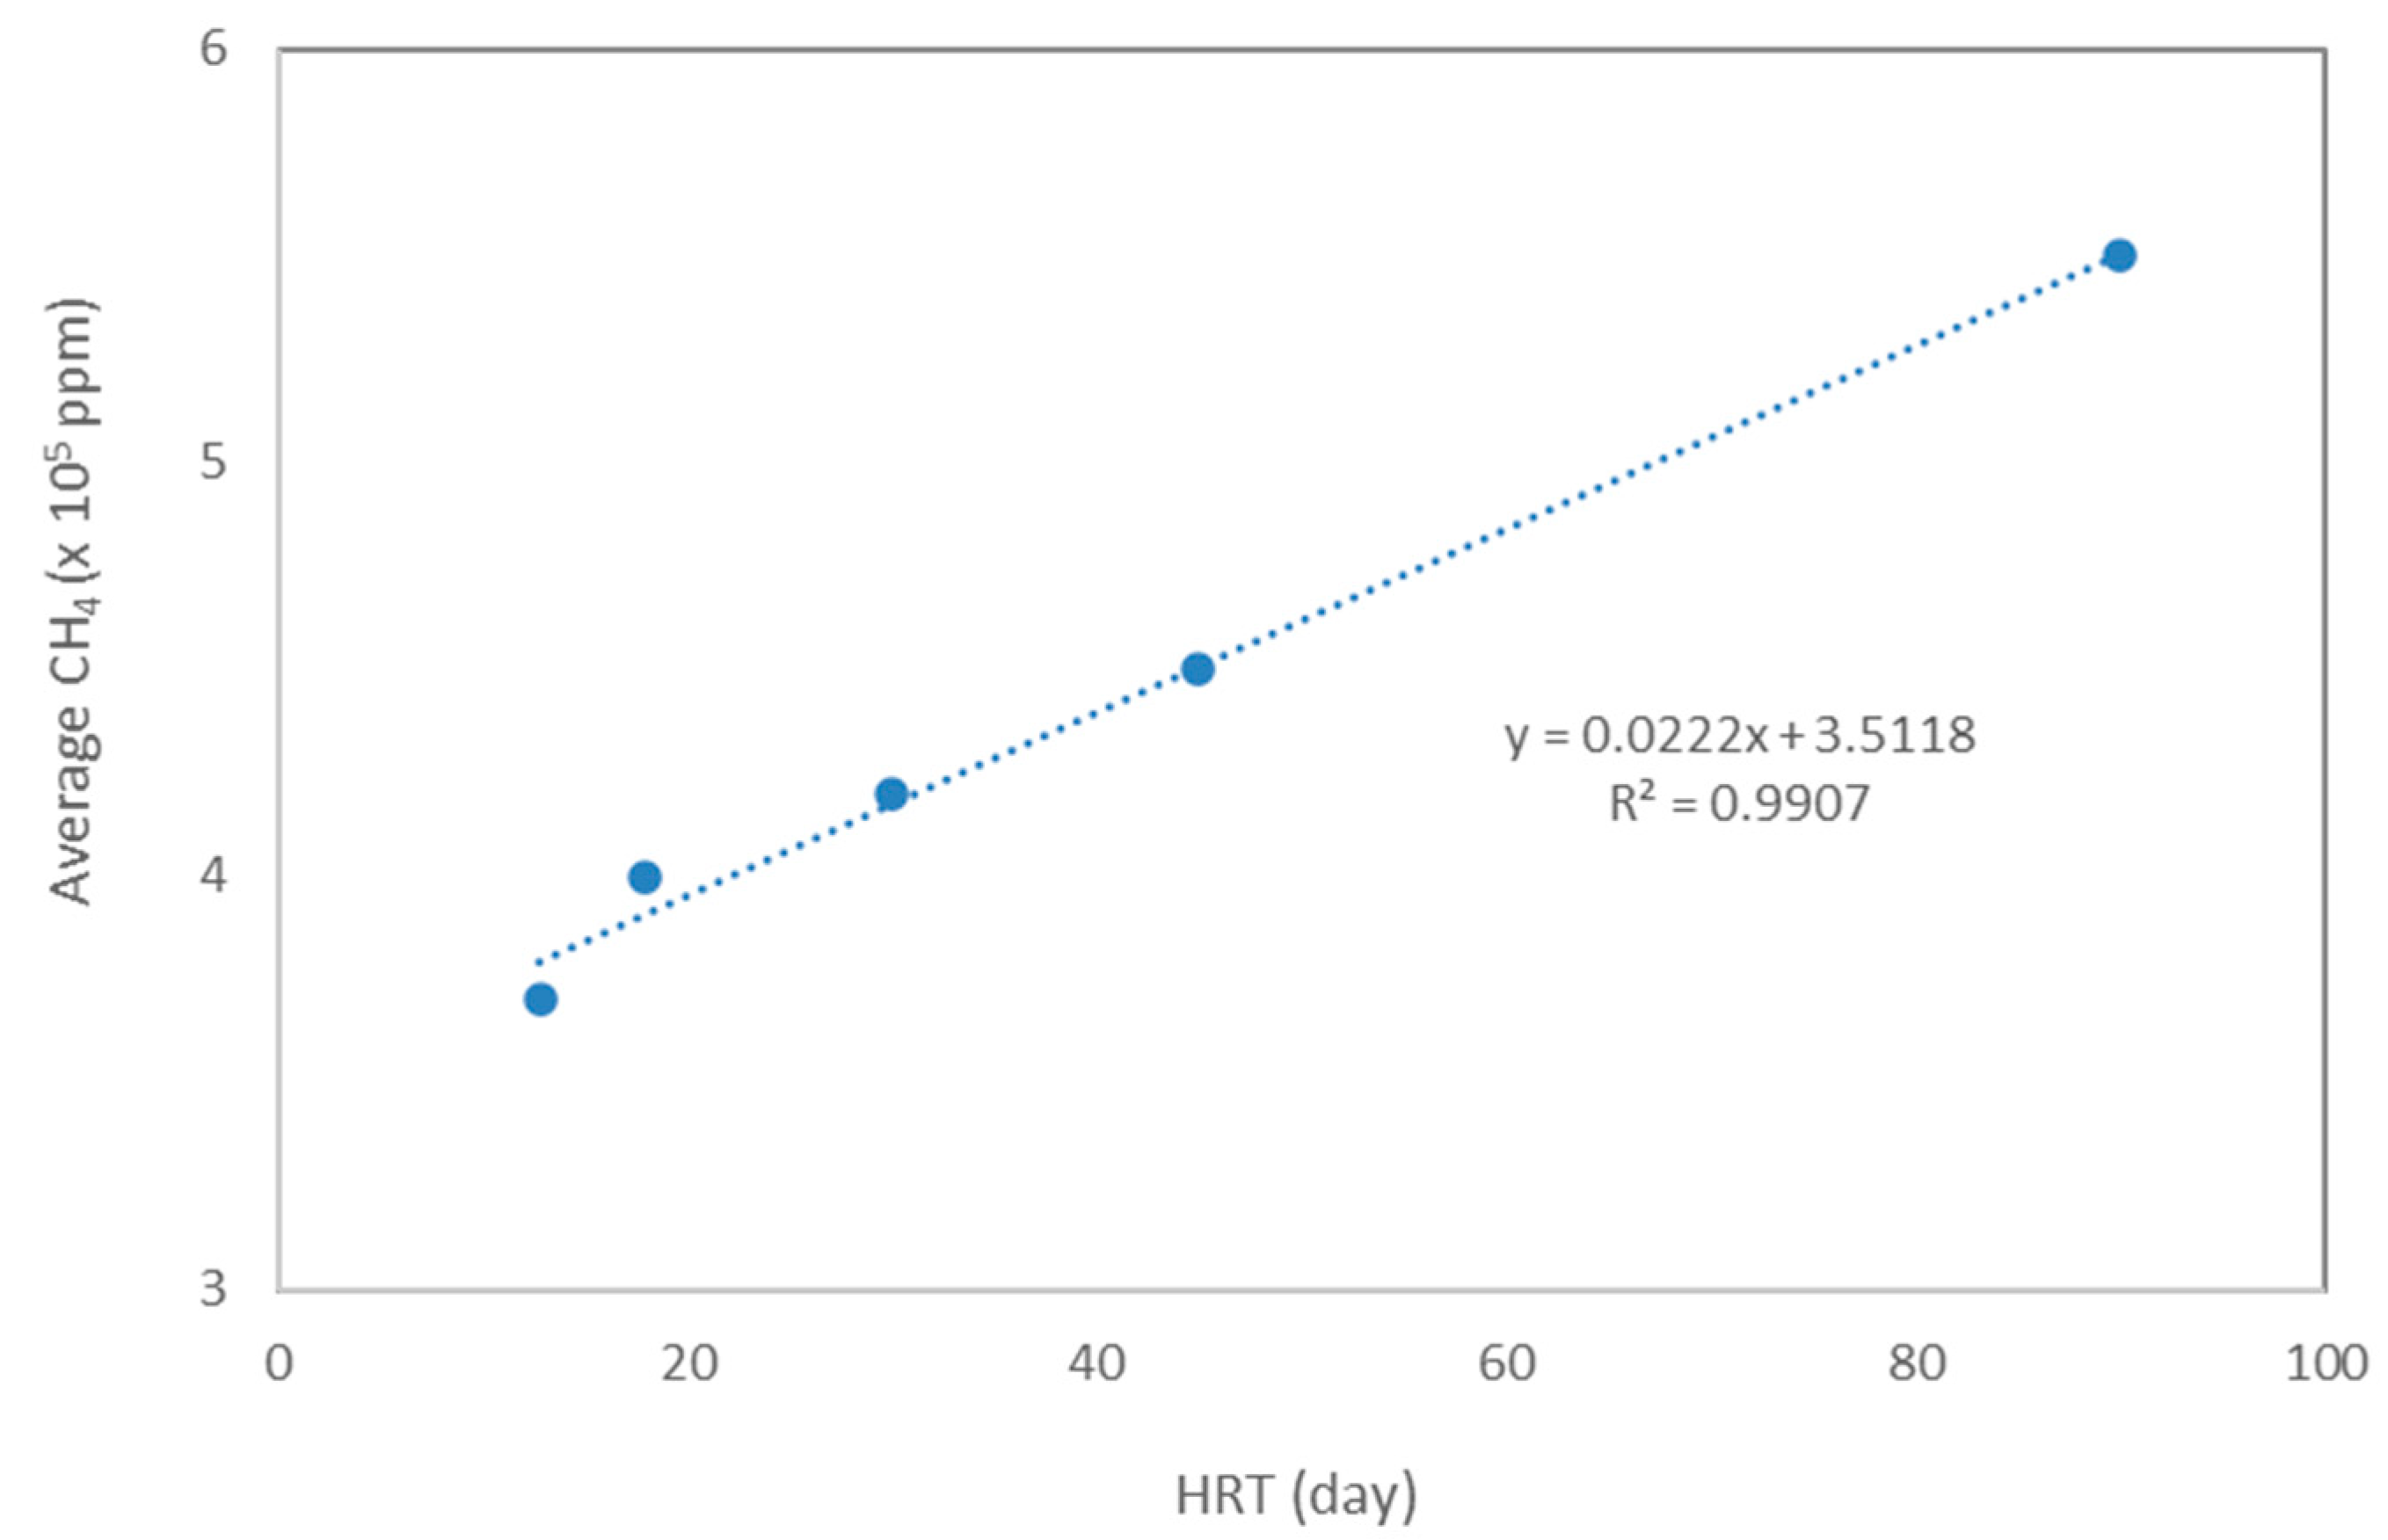
| Hydraulic Retention Time (Day) | Average CH4 (×105 ppm) |
|---|---|
| 90.0 | 5.5 |
| 45.0 | 4.5 |
| 30.0 | 4.2 |
| 18.0 | 4.0 |
| 12.8 | 3.7 |
Disclaimer/Publisher’s Note: The statements, opinions and data contained in all publications are solely those of the individual author(s) and contributor(s) and not of MDPI and/or the editor(s). MDPI and/or the editor(s) disclaim responsibility for any injury to people or property resulting from any ideas, methods, instructions or products referred to in the content. |
© 2023 by the authors. Licensee MDPI, Basel, Switzerland. This article is an open access article distributed under the terms and conditions of the Creative Commons Attribution (CC BY) license (https://creativecommons.org/licenses/by/4.0/).
Share and Cite
Lovanh, N.; Loughrin, J.; Ruiz-Aguilar, G.; Sistani, K. Methane Production from a Rendering Waste Covered Anaerobic Digester: Greenhouse Gas Reduction and Energy Production. Energies 2023, 16, 7844. https://doi.org/10.3390/en16237844
Lovanh N, Loughrin J, Ruiz-Aguilar G, Sistani K. Methane Production from a Rendering Waste Covered Anaerobic Digester: Greenhouse Gas Reduction and Energy Production. Energies. 2023; 16(23):7844. https://doi.org/10.3390/en16237844
Chicago/Turabian StyleLovanh, Nanh, John Loughrin, Graciela Ruiz-Aguilar, and Karamat Sistani. 2023. "Methane Production from a Rendering Waste Covered Anaerobic Digester: Greenhouse Gas Reduction and Energy Production" Energies 16, no. 23: 7844. https://doi.org/10.3390/en16237844
APA StyleLovanh, N., Loughrin, J., Ruiz-Aguilar, G., & Sistani, K. (2023). Methane Production from a Rendering Waste Covered Anaerobic Digester: Greenhouse Gas Reduction and Energy Production. Energies, 16(23), 7844. https://doi.org/10.3390/en16237844