Abstract
Numerous cases of serious accidents related to methane outbursts exist worldwide. Due to their disastrous consequences, a vast quantity of research on underground gas explosions has been conducted using conventional models and laboratory tests, as performing studies at explosion sites is difficult. When conventional models are employed, the results are poor since these models are based on calculations at fixed times for a single point of a single section of an underground space. Computational fluid dynamics (CFD) analysis is necessary to calibrate these models, using measurements obtained in galleries. In this case, the measurements are obtained from methane emissions of 3885 m3. CFD modelling was carried out in three phases. First, the relationship between methane emission and the main ventilation was analysed. Second, the effect of adding an auxiliary ventilation fan to the main ventilation was investigated. Finally, methane evolution over time was analysed. In the first moments, methane produces a reversal at 200 m from the main ventilation entrance of the gallery. When 60 m of auxiliary ventilation is superimposed, the ventilation reversal distance is reduced to 42 m from the methane emission source. The effect of superimposing appropriate auxiliary ventilation on the main ventilation, as well as the correct placement of the auxiliary ventilation fan, can generate safe zones behind the ventilation reversal area. These CFD models are powerful tools for analysing methane explosion emission and propagation.
1. Introduction
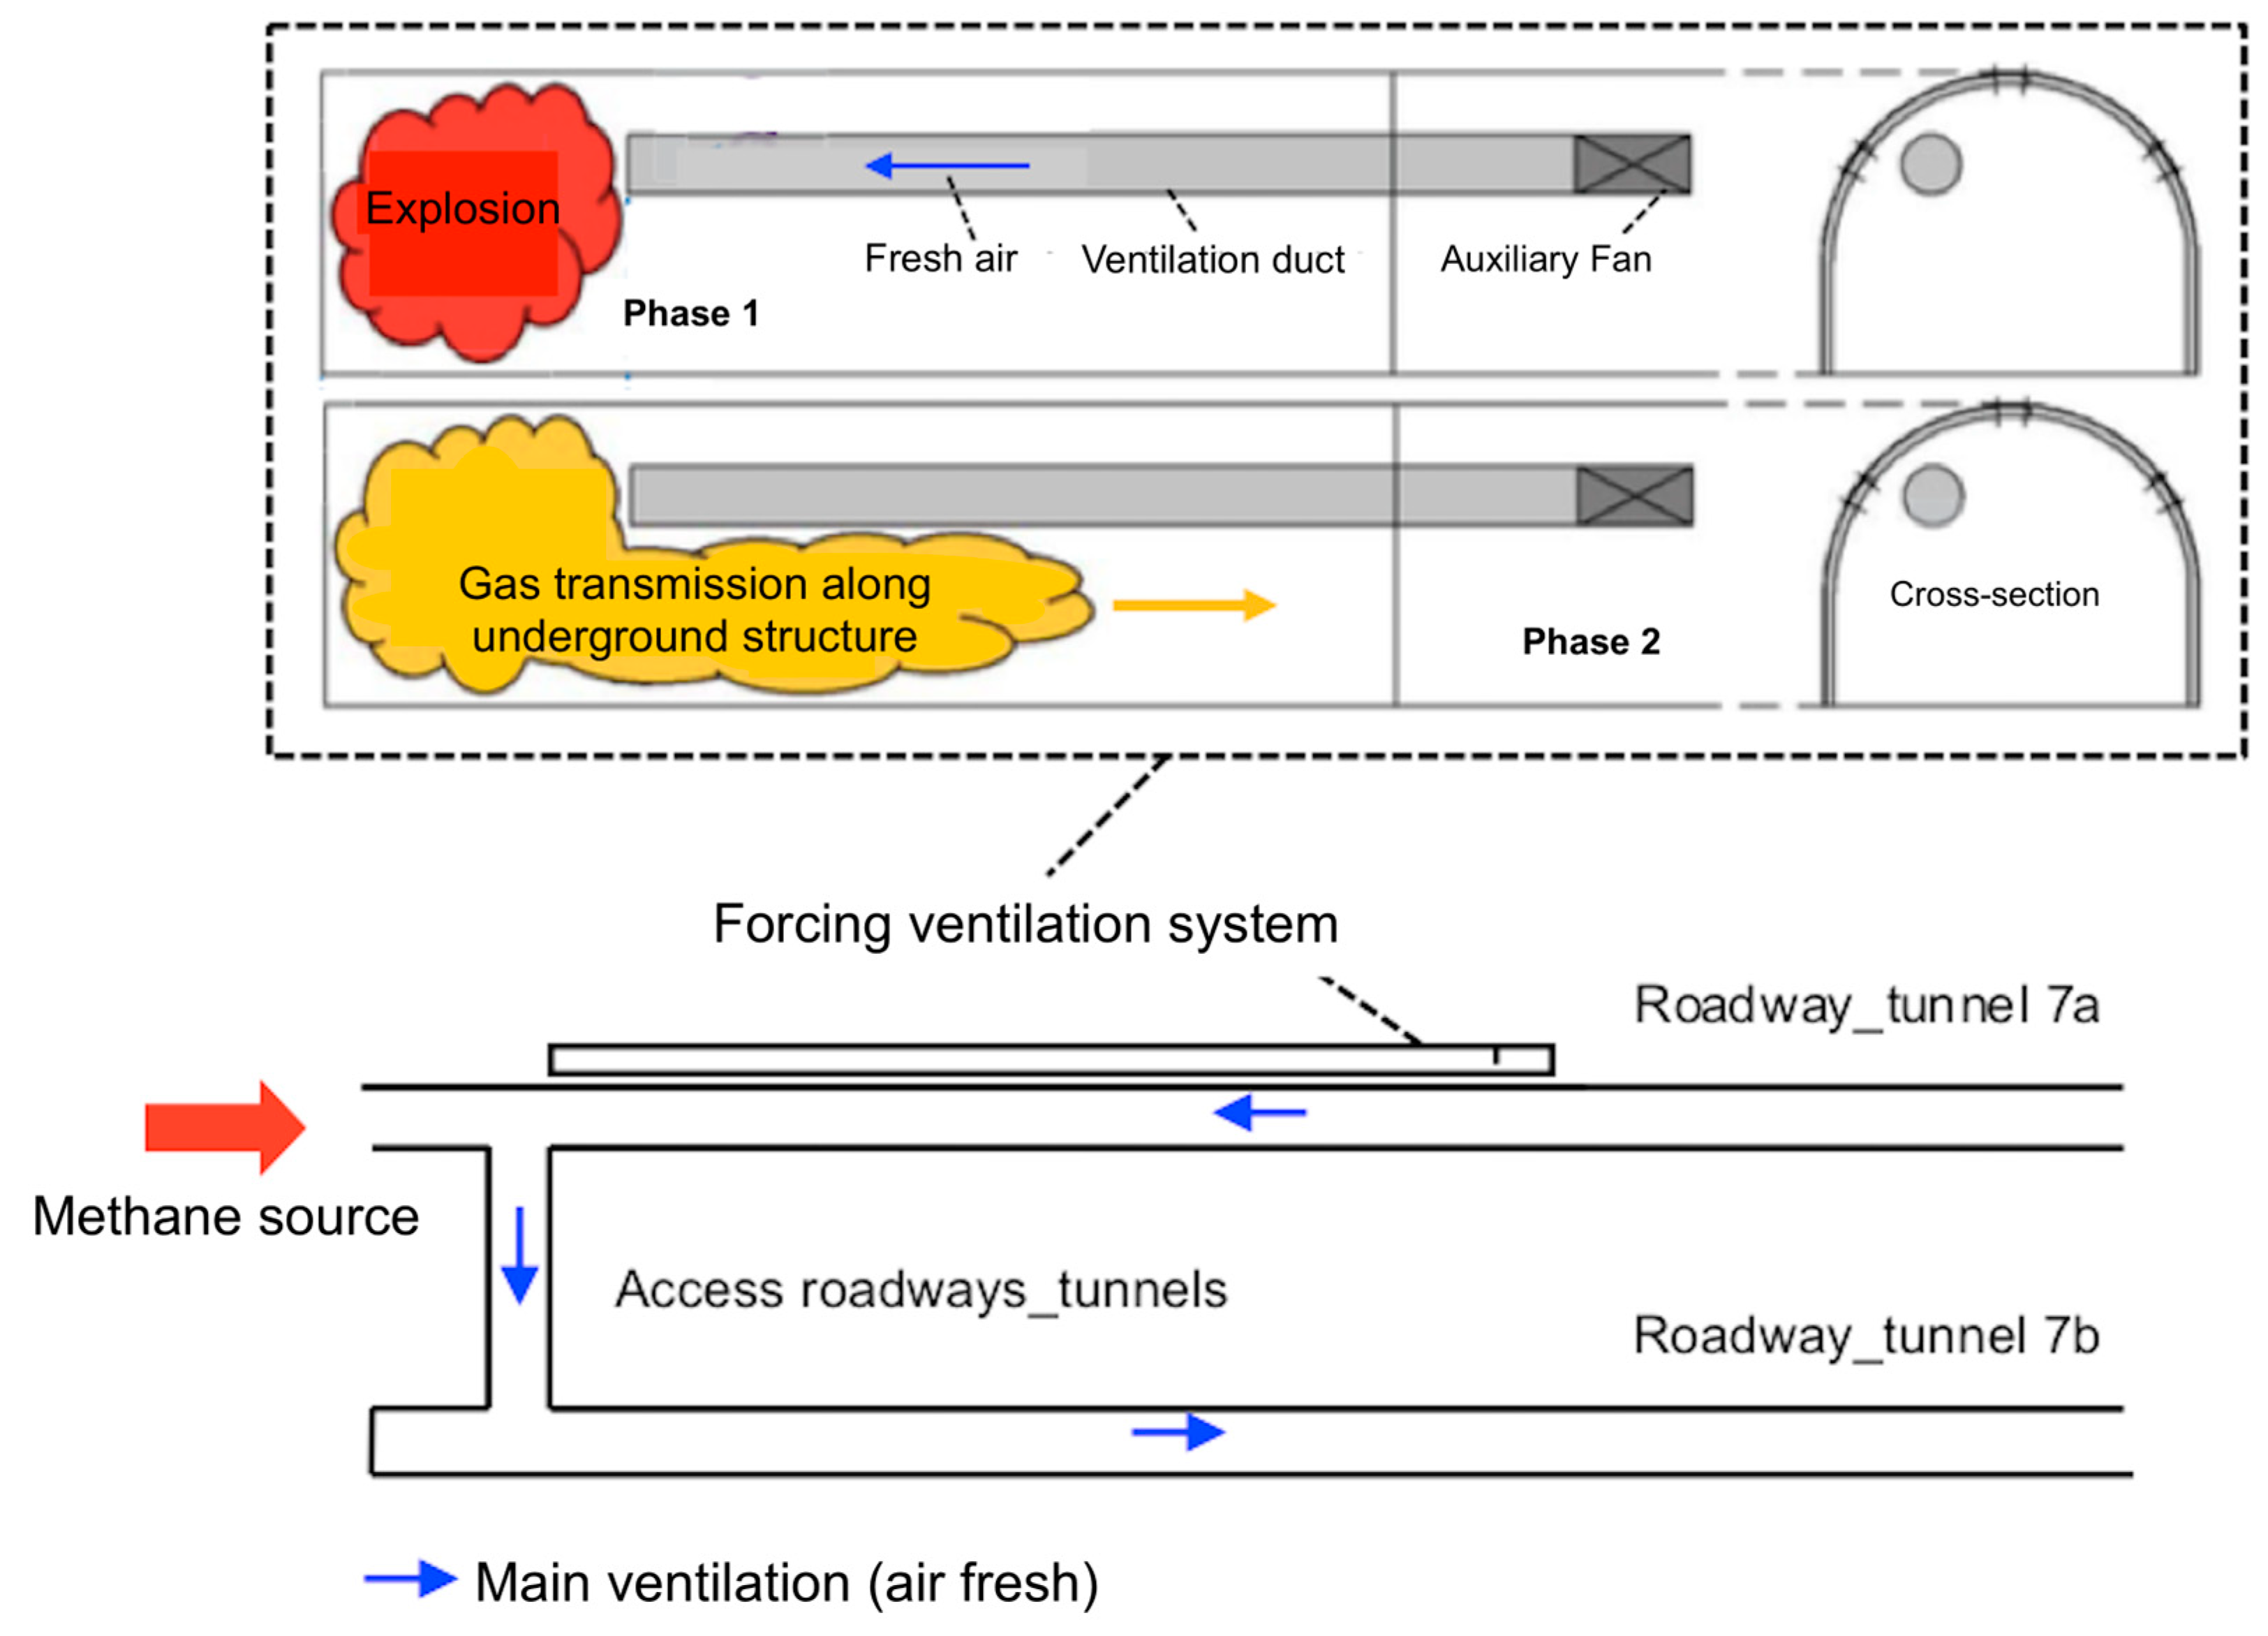
Coal layers in the mine faces of tunnels or mining galleries that are being excavated can cause methane outbursts (sudden and violent ejections of gas). Methane is a gas that is characterised by its explosiveness and ability to reduce the amount of oxygen in the air and cause death by asphyxiation of workers (Figure 1).
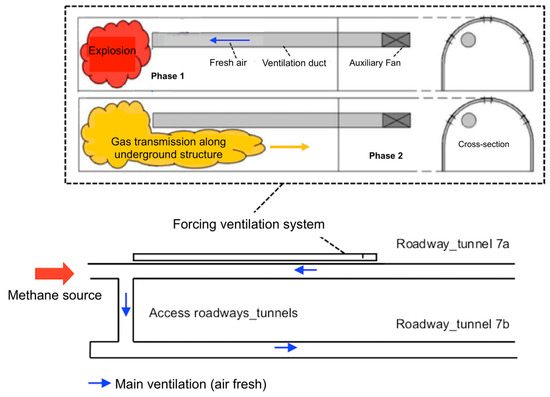
Figure 1.
Methane in roadways or tunnels and main and auxiliary ventilation systems.
Examples of some recent cases of significant outbursts are listed as follows: 148 deaths in the Daping coal mine (China) in 2004 [1]; 214 deaths in the Sunjiawan coal mine (China) in 2005 [2]; 29 deaths in Upper Big Branch Mine-South (West Virginia) in 2010 [3]; the gas explosion in the Zasyadko Coal Mine (Donetsk) in 2015, which caused 33 deaths [4]. On 22 December 2005, a methane explosion occurred in the DJS tunnel (China). The toll was 44 deaths and 11 injuries of varying degrees [5,6]. On 13 February 2015, a methane explosion occurred in the WWL tunnel (China). The toll was 7 deaths and 19 injuries of varying degrees [5,6]. On 2 May 2017, a methane explosion occurred in the QSY tunnel (China). The toll was 12 deaths and 12 injuries [5,6].
Due to the disastrous consequences of methane gas explosions, a large number of studies on underground gas explosions have been conducted. The studies have been carried out using conventional models and laboratory tests since performing studies at explosion sites is difficult [7,8,9,10,11,12,13].
It was already described by Zang and Zang [1] when they analysed the incident in Daping coal mine using the laws of gas geology. Smith [7] carried out measurements in each tunnel, showing the results graphically. Like Xu et al. [5], He et al. [6] and Beamish and Cosdale [12] reviewed different incidents to obtain the causes of outbursts and gave safety recommendations. Zang et al. [13] theoretically investigated different gas explosion mechanisms. Recently, Sanmiguel et al. [14] analysed a historical accident in a Spanish coal mine using two well-known alternatives: (1) the method from the Spanish National Institute of Safety and Health at Work (INSST), where the causes and circumstances of the accident are classified into immediate causes and basic causes; (2) the Feyer and Williamson method, where classification is conducted using precursor events and contributing factors. Therefore, when conventional models are employed, the results are poor since they are based on calculations at fixed times for a single point of a single section of an underground space [15,16]. Computational fluid dynamics (CFD) analysis, which takes into account time, is necessary to calibrate these models using measurements obtained in the gallery or tunnel [17].
Demirkan et al. [18], relate a 3D real-time methane prediction approach that integrates CFD data with an AI model.
In this case, CFD modelling was performed, and these models were calibrated using measurements obtained from methane emissions that occurred in an underground work site.
The underground work consisted of two galleries or tunnels connected by other access galleries (Figure 1). CFD modelling (and its calibration) was carried out in three phases. First, the relationship between methane emission and the main ventilation was analysed. Second, the effect of adding an auxiliary ventilation fan to the main ventilation was investigated. Finally, methane evolution was analysed after emission occurred.
The effect of superimposing a suitable auxiliary vent on the main vent can create safe zones behind the ventilation reversal area. At a time after methane emission (637 s) and with the effects, methane concentrations satisfy the TLV. Additionally, studying the placement of the auxiliary ventilation fan in the correct cross-section can prevent ventilation reversal from ceasing and the main ventilation operation from resuming due to the emission of methane. Based on these CFD models, other models can be developed for other parameters. These CFD models are powerful tools for analysing methane explosion emission and propagation.
2. Measuring Equipment and Experimental Work Area
2.1. Measuring Equipment
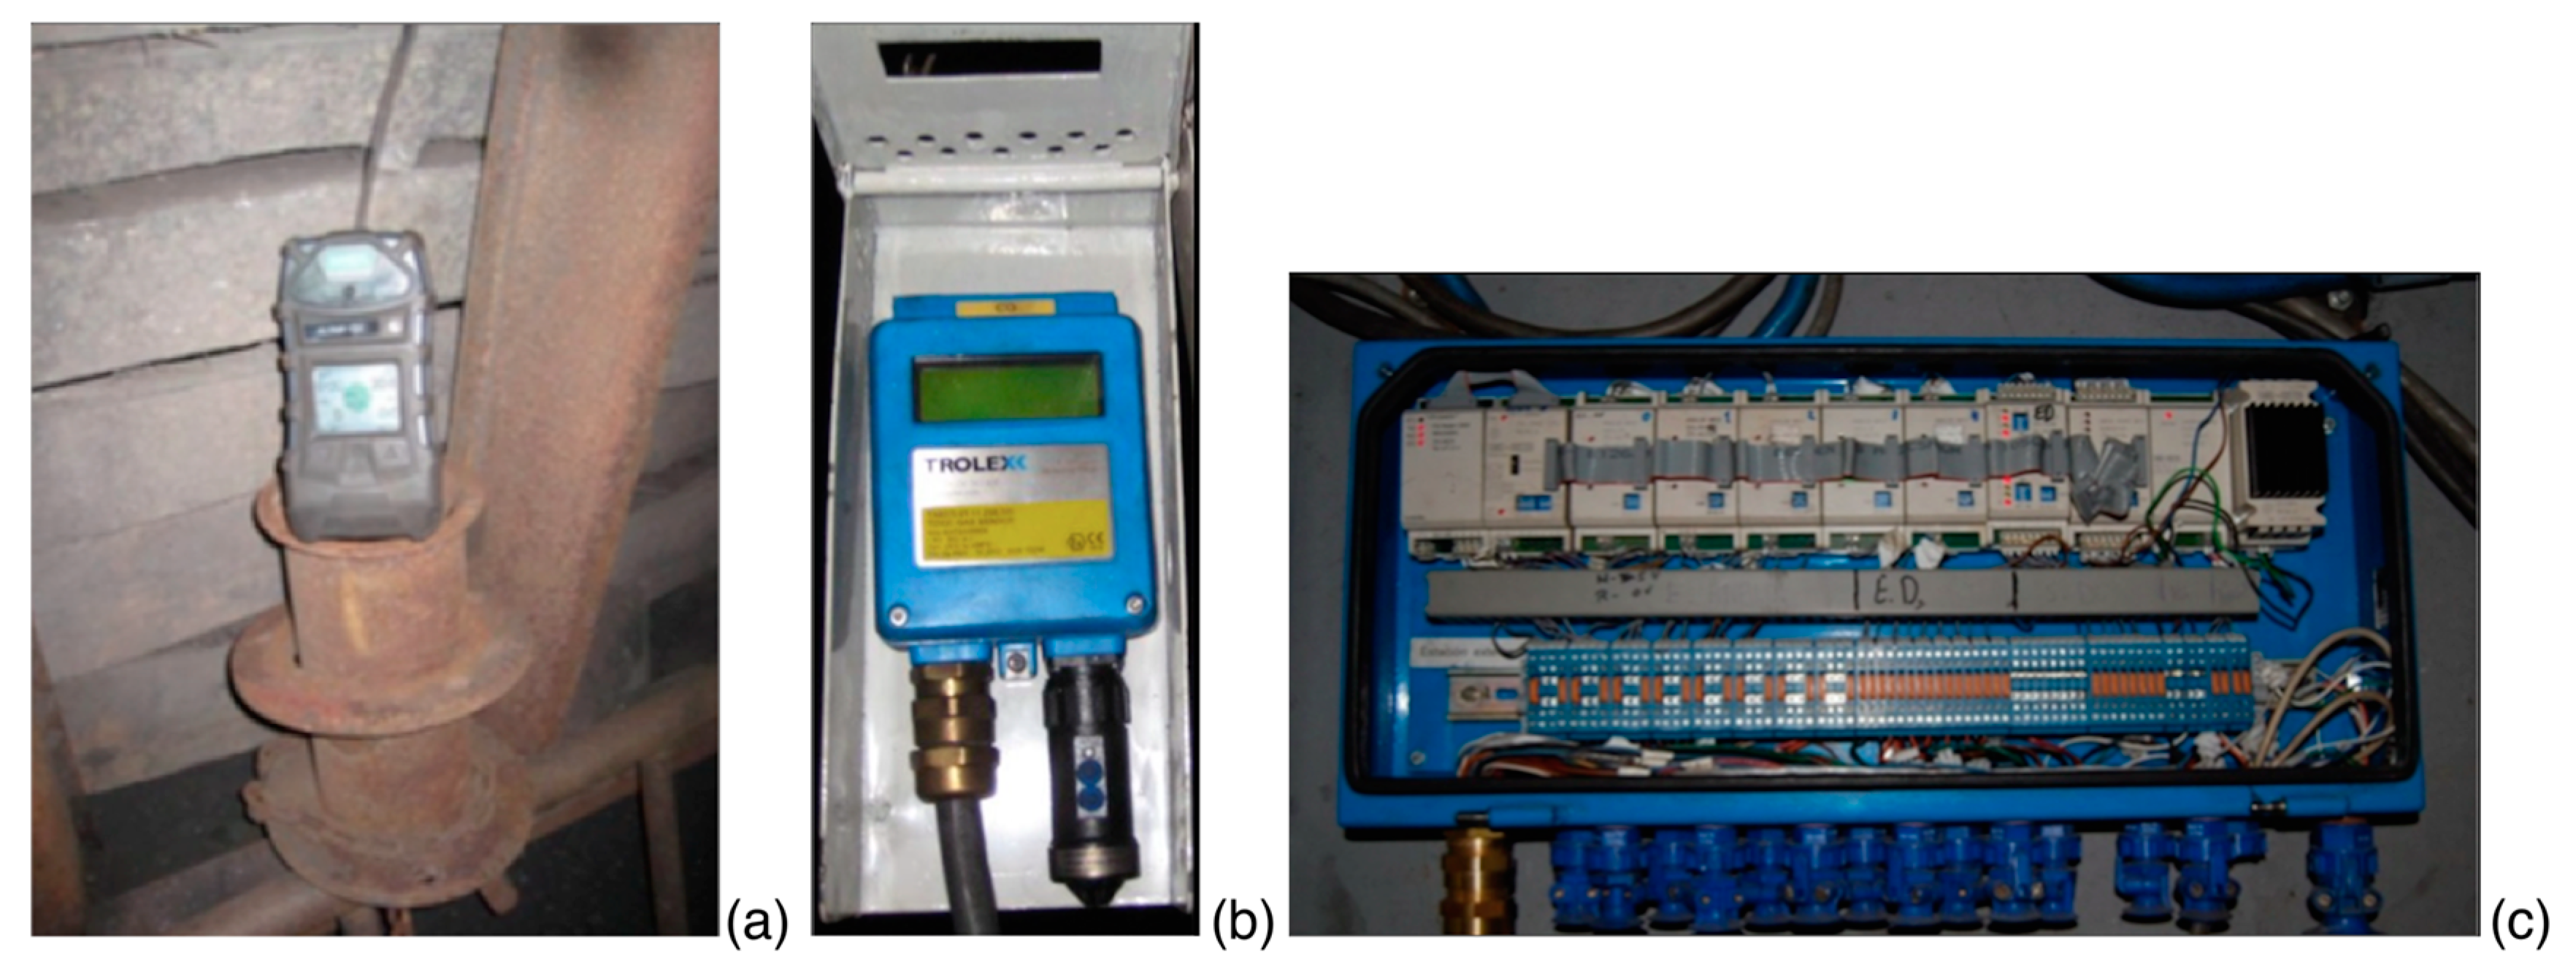
Table 1 and Table 2 show oxygen and methane reading specifications of methanometers and Altair 5x (MSA The Safety Company, Madrid, Spain), Trolex TX6383 (Trolex, Oviedo, Spain) and Trolex TX6373 oximeters (Trolex, Oviedo, Spain). Figure 2 shows the Altair 5x and Trolex TX6373 equipment that was installed in the test gallery and on the remote station of the monitoring and control system.

Table 1.
Altair 5x and Trolex TX6373 specifications.

Table 2.
Altair 5x and Trolex TX6383 specifications.
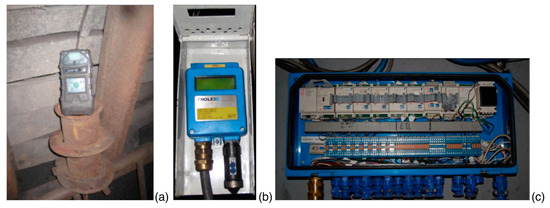
Figure 2.
(a) Altair 5x, (b) Trolex TX6373 and (c) remote station of the monitoring and control system.
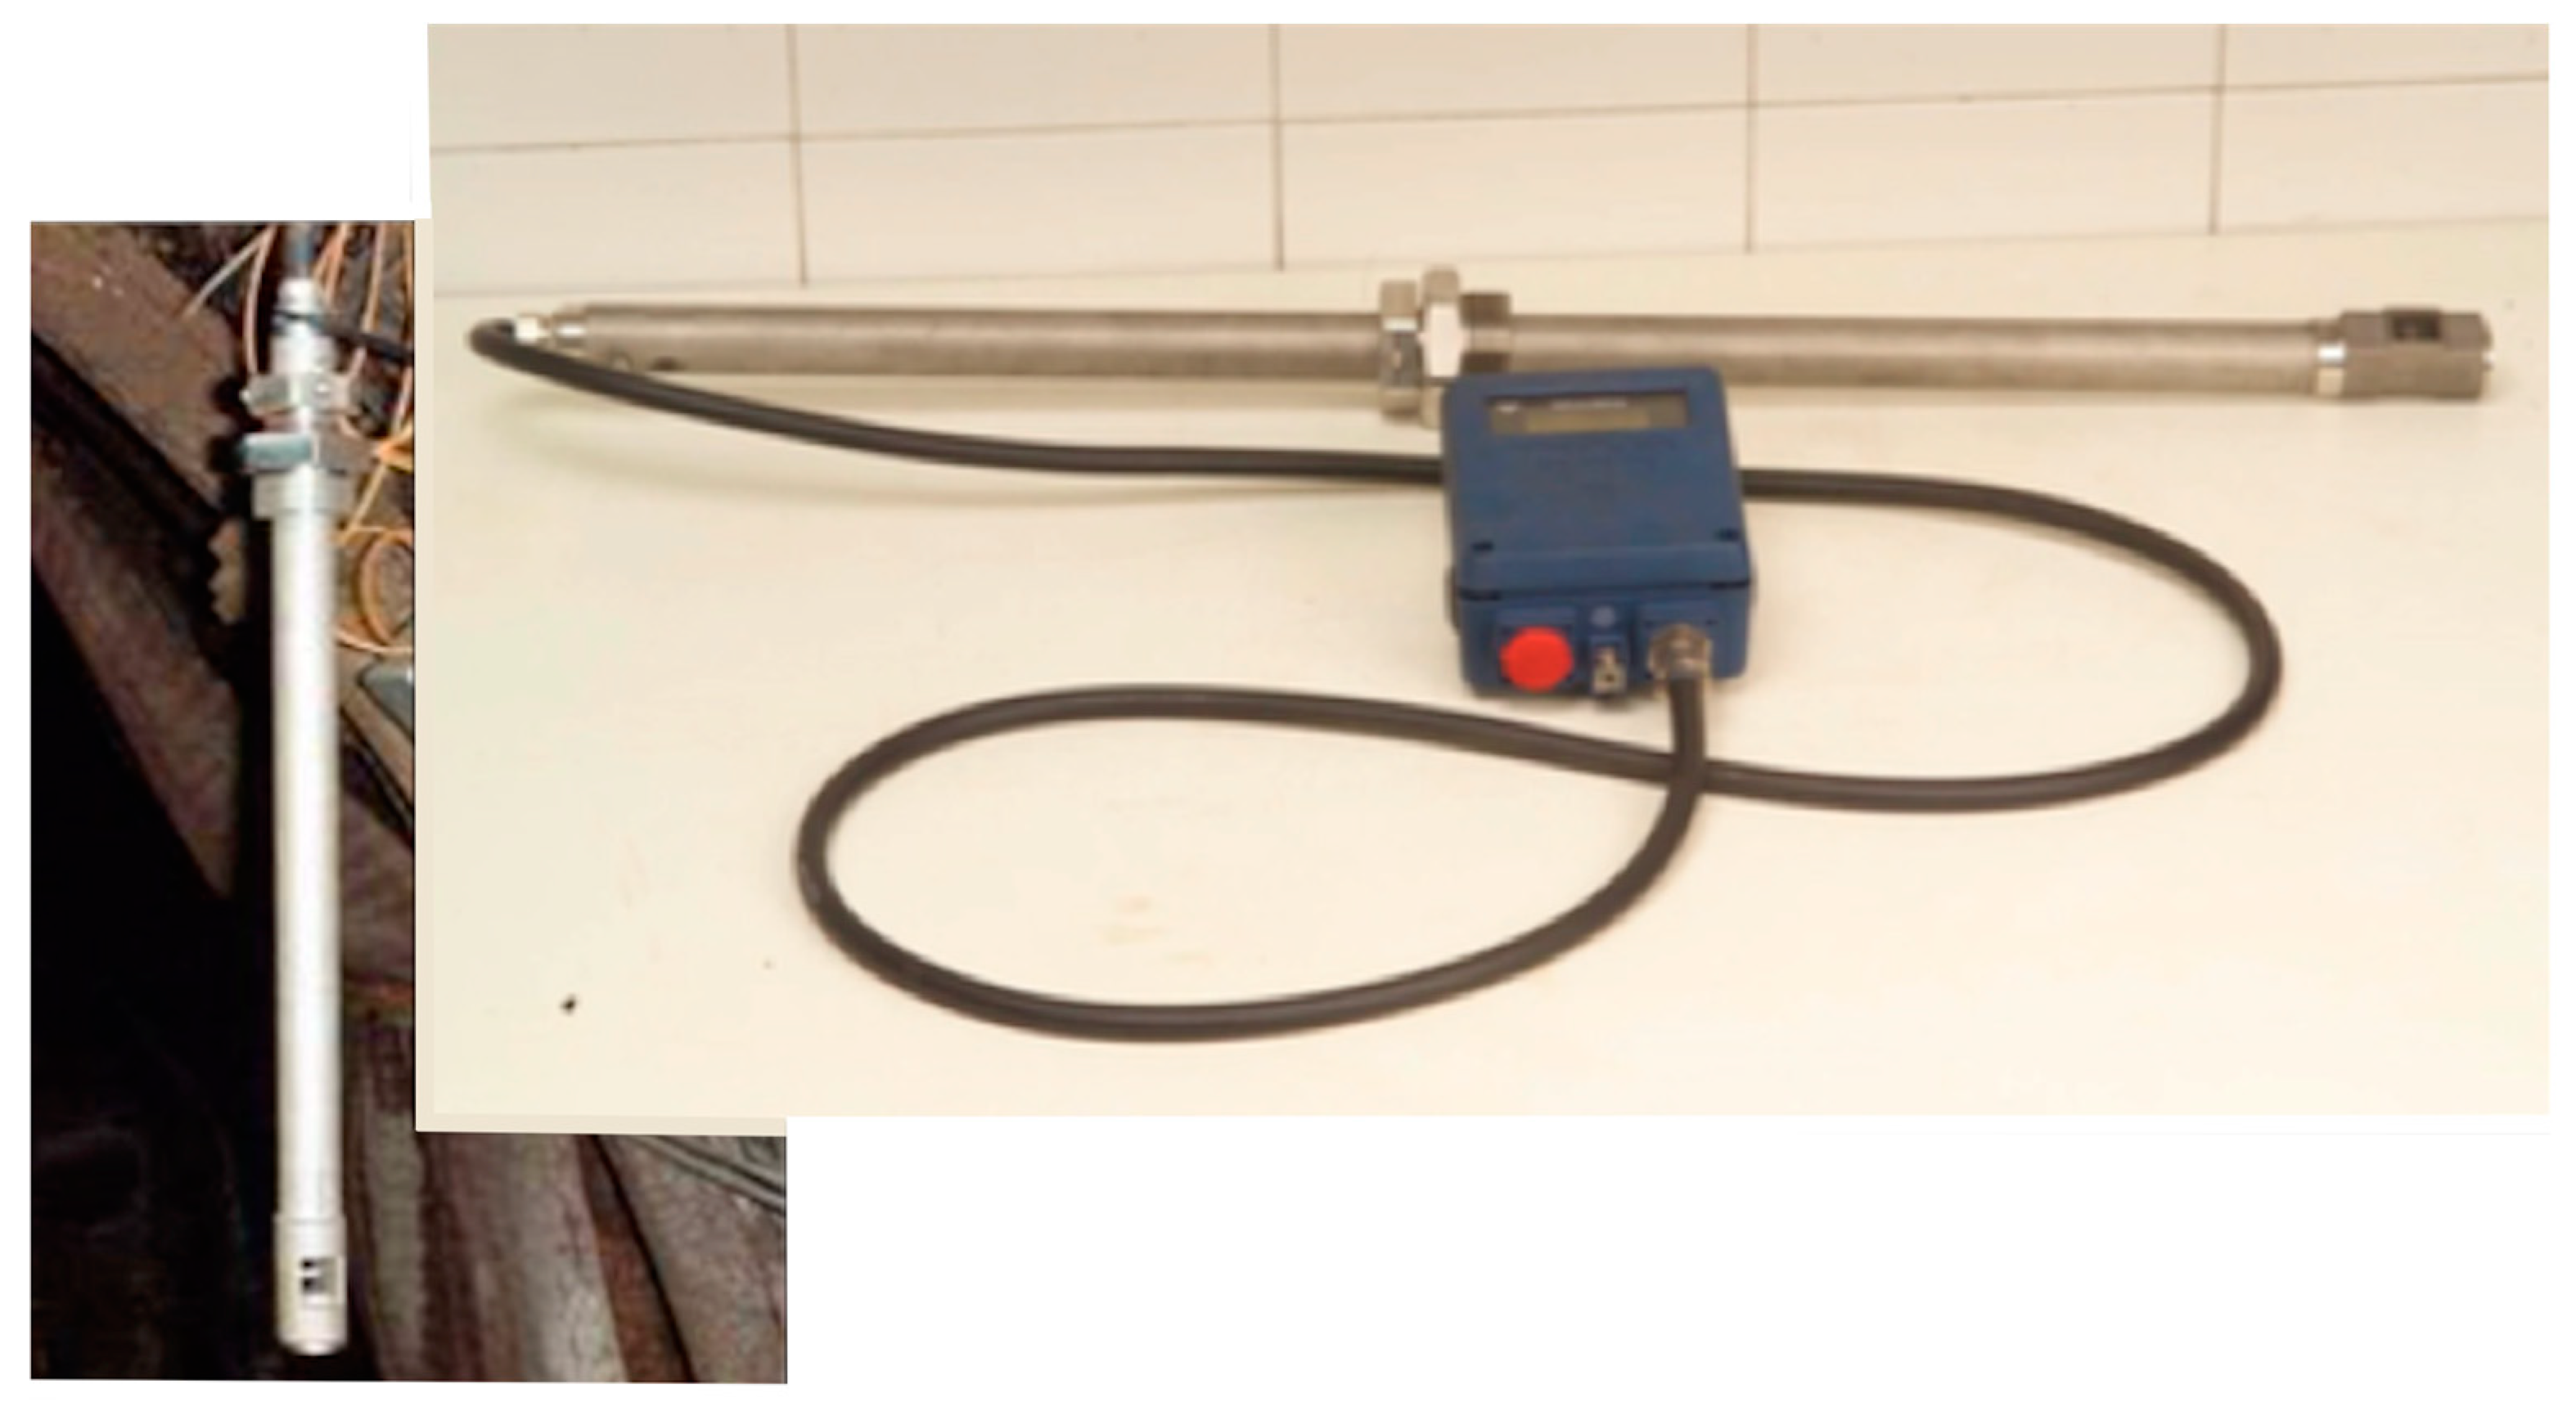
The measurement of air velocity in the main ventilation and methane emitted is performed with the Trolex TX 5920/1 (Trolex, Oviedo, Spain) vortex flow velocity sensing system (Figure 3). Table 3 shows the TX 5920/1 equipment specifications.
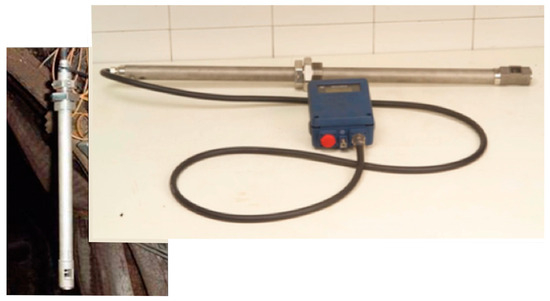
Figure 3.
Trolex TX 5920/1 vortex flow velocity sensing system.

Table 3.
TX 5920/1 specifications.
2.2. Experimental Work Area
An experimental study was conducted in galleries and tunnels at a depth of 400 m in an underground mine in northern Spain. The extensive experience of the authors with calibrated CFD models has been applied in the study of auxiliary ventilation in galleries and tunnels [19] and in models used in blasting at the heading face of galleries [19,20,21,22,23,24]. The basic parameters of models (such as mesh design, boundary conditions and turbulence models) were employed to study methane emissions with satisfactory results.
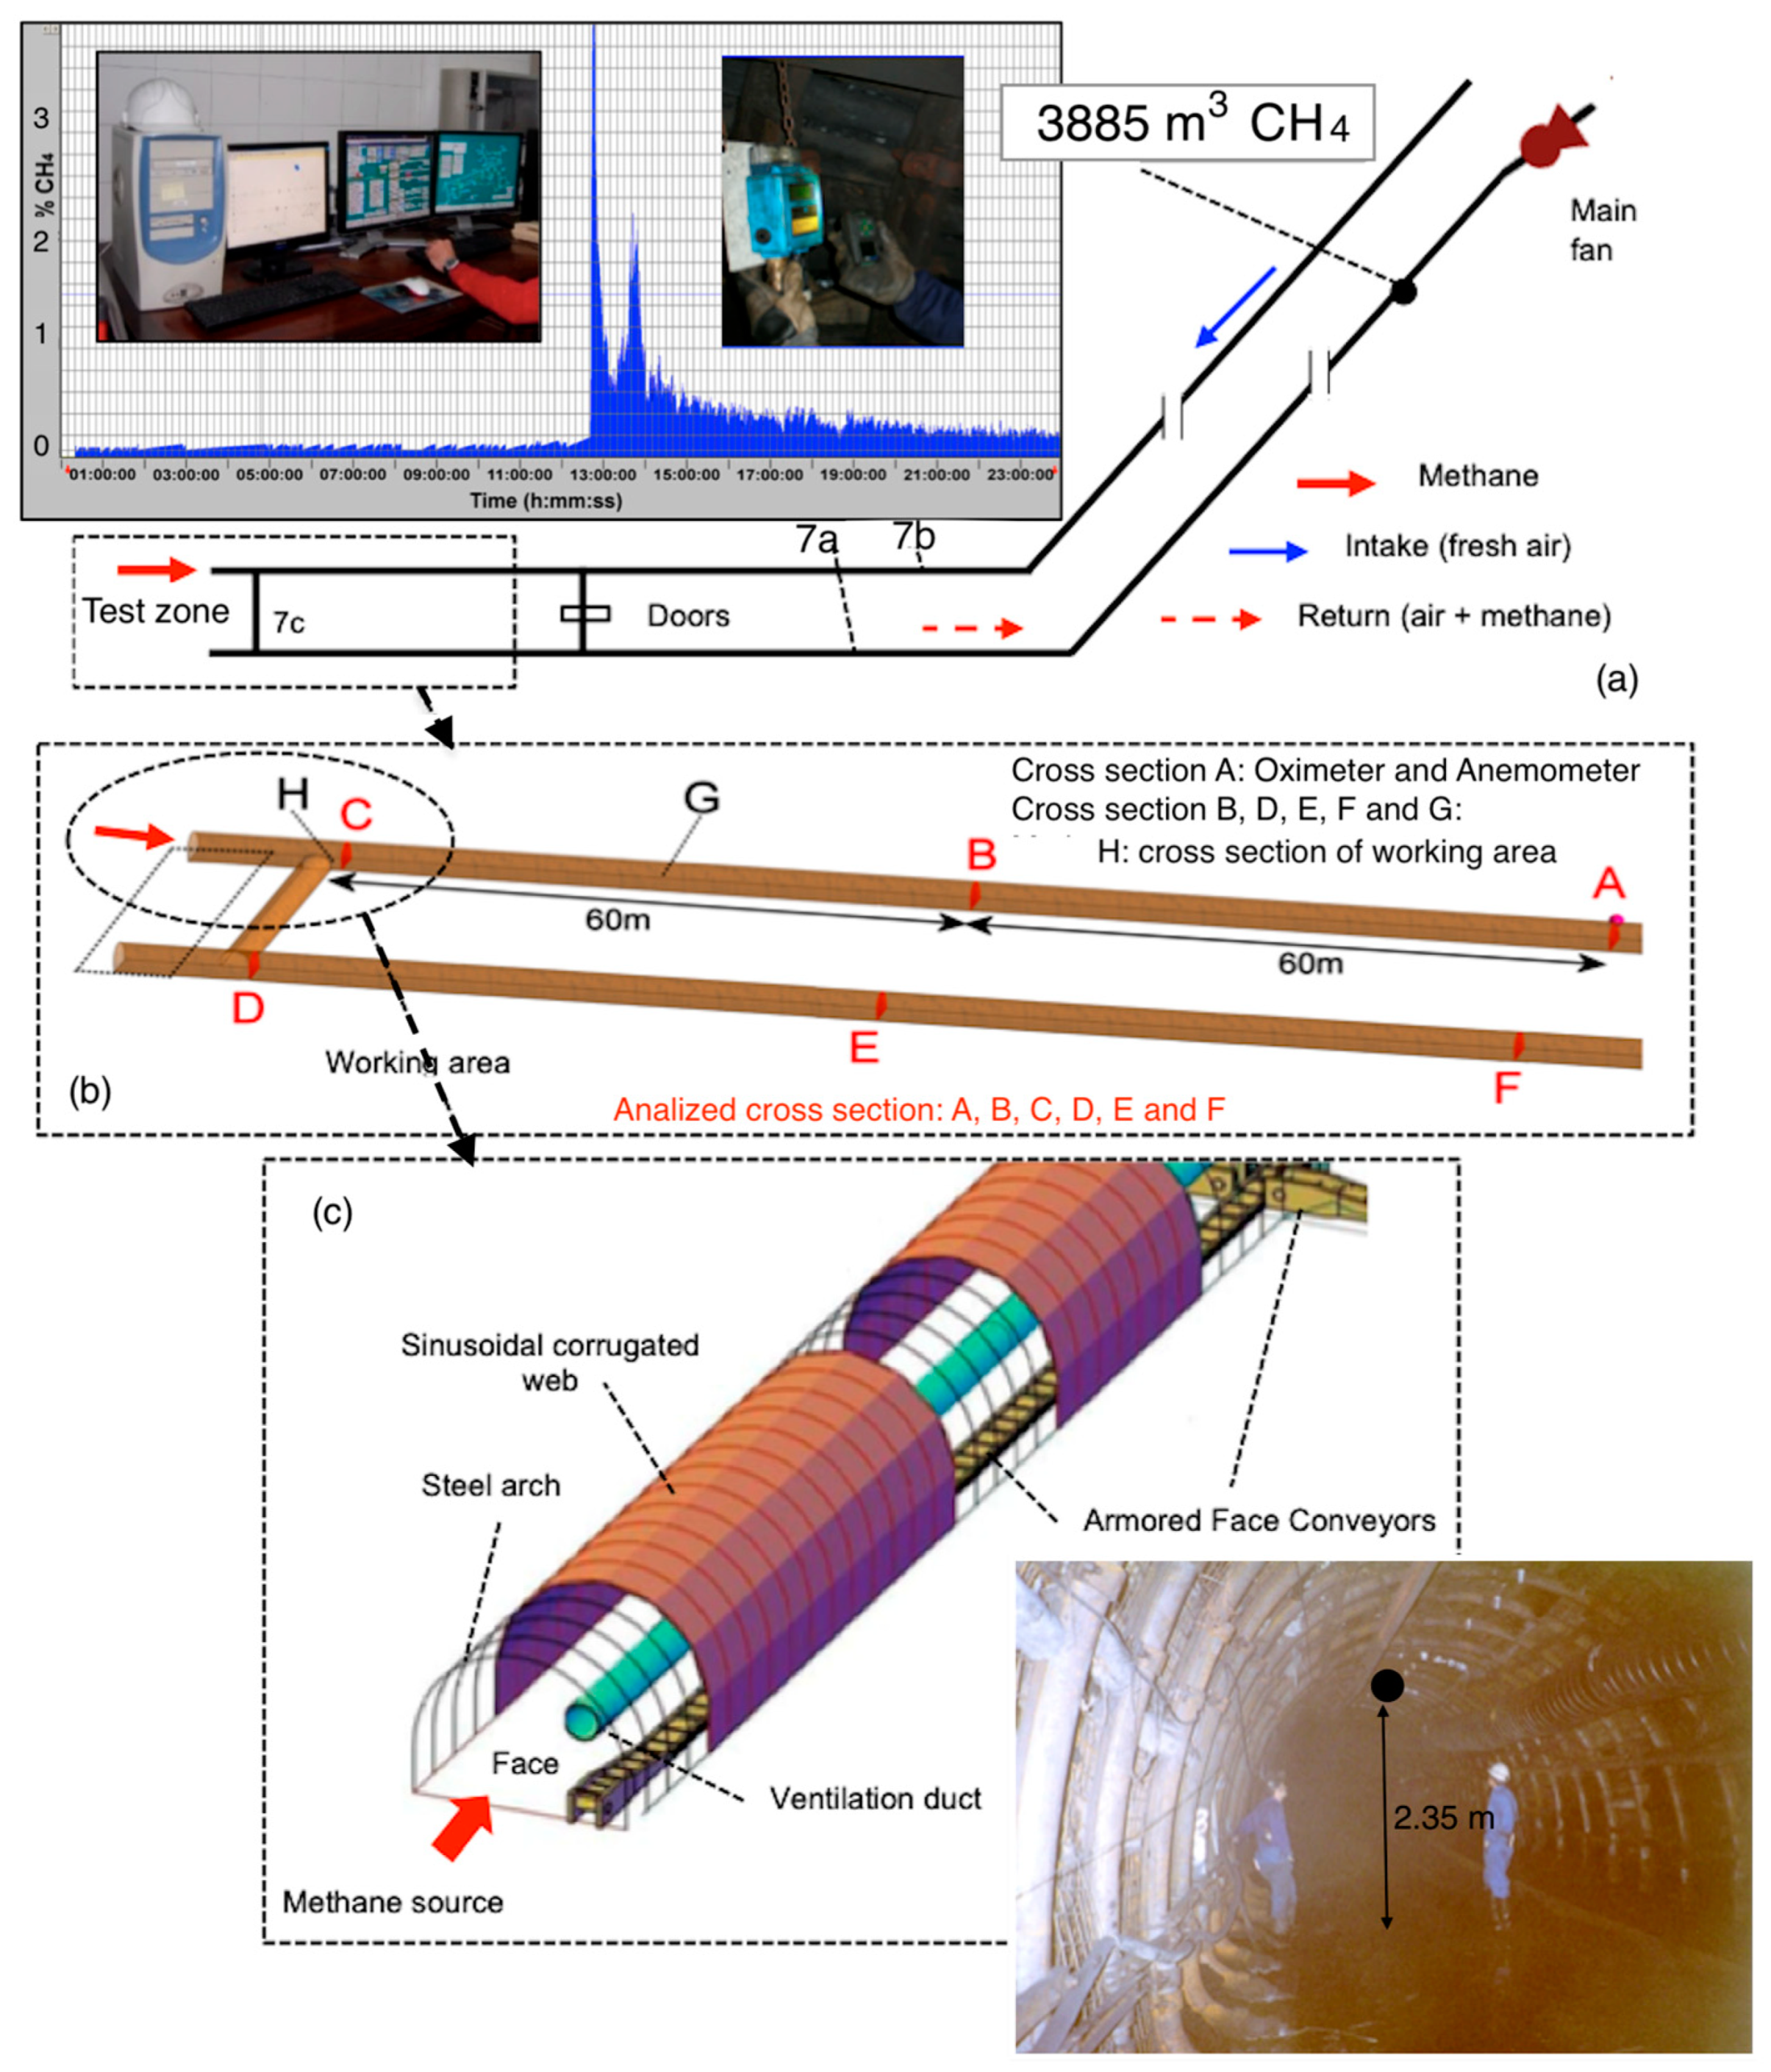
Figure 4 details the test zone where methane emission occurred. Figure 4a shows the diagram of the main galleries, 7a and 7b; the access gallery, 7c; and the flow direction of air from the main ventilation and the methane emitted, as well as a log of the emission of 3885 m3 of methane recorded at the main fan of the underground structure. Figure 4b shows the six cross-sections of the gallery where the measurement devices were located. Figure 4c shows the test gallery with auxiliary ventilation.
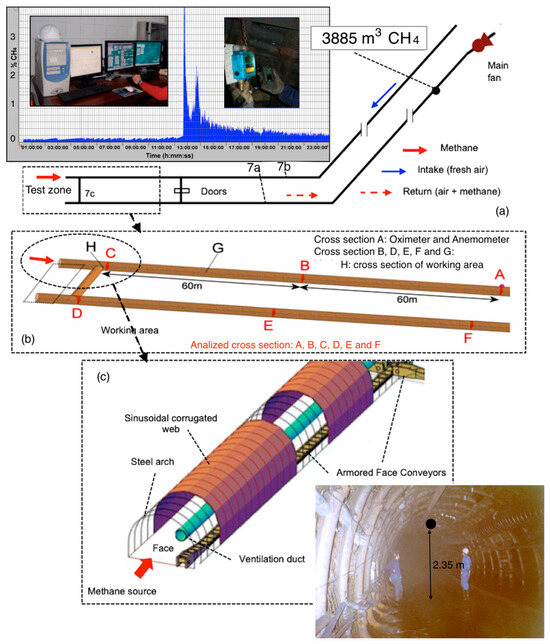
Figure 4.
Methane emission test zone. (a) diagram of the galleries 7a, 7b and 7c; and the flow direction of air from the main ventilation and the methane emitted; (b) the six cross-sections of the gallery; (c) the test gallery with auxiliary ventilation.
Methane was emitted for 37 s and circulated through the gallery in the opposite direction at a higher initial velocity (13.8 m/s), which slowed the entry of air from the main ventilation (2 m/s) and caused the air to reverse its flow at a gallery length of 200 m from the face. When auxiliary ventilation was installed, the indicated ventilation reversal distance is reduced to 42 m from the heading face. Therefore, superimposing adequate auxiliary ventilation on the main ventilation can generate safe zones behind the ventilation reversal area.
2.3. Computational Models
2.3.1. Mathematical Background
The set of equations that describe momentum and heat and mass transfer in a moving fluid are referred to as Navier–Stokes equations [25]. These partial differential equations were derived at the beginning of the 19th century and do not have a known general analytical solution but can be numerically discretised and solved. In this case, the Reynolds-averaged balances of mass, momentum and energy for turbulent flow are used [26].
In principle, Navier–Stokes equations describe both laminar flow and turbulent flow without the need for additional information. However, turbulent flows at realistic Reynolds numbers span a large range of turbulent lengths and time scales and would generally involve considerably smaller length scales and the smallest finite volume mesh, which can be practically applied in numerical analysis. The direct numerical simulation (DNS) of these flows would require substantially greater computing power.
Turbulence models, which can be employed in CFD, range from the simplest zero-equation models to more complicated models, such as large eddy simulation (LES) or detached eddy simulation (DES).
The Reynolds-averaged Navier–Stokes (RANS) methods are intermediate models that are extensively employed in engineering. The Spalart–Allmaras model, in which one equation is added to the calculation, K-epsilon models with two equations or shear stress transport (SST) models with seven equations are available models. The K-epsilon model with its different variants is the most commonly employed model.
2.3.2. Model Description
In this research, modelling was carried out using CFD via Ansys CFX 19.1 software. Solidworks (computer-aided geometric modelling) was employed for three-dimensional modelling, Ansys ICEM-CFD 19.1 [27] for domain meshing and Ansys CFX 19.1 as a solver and for the post-processing of the results.
Various investigations [17,19] consider that a reasonable correlation between the measured results and the predicted results is obtained when the K-epsilon turbulence model is used to simulate air and contaminants flow in tunnels and roads.
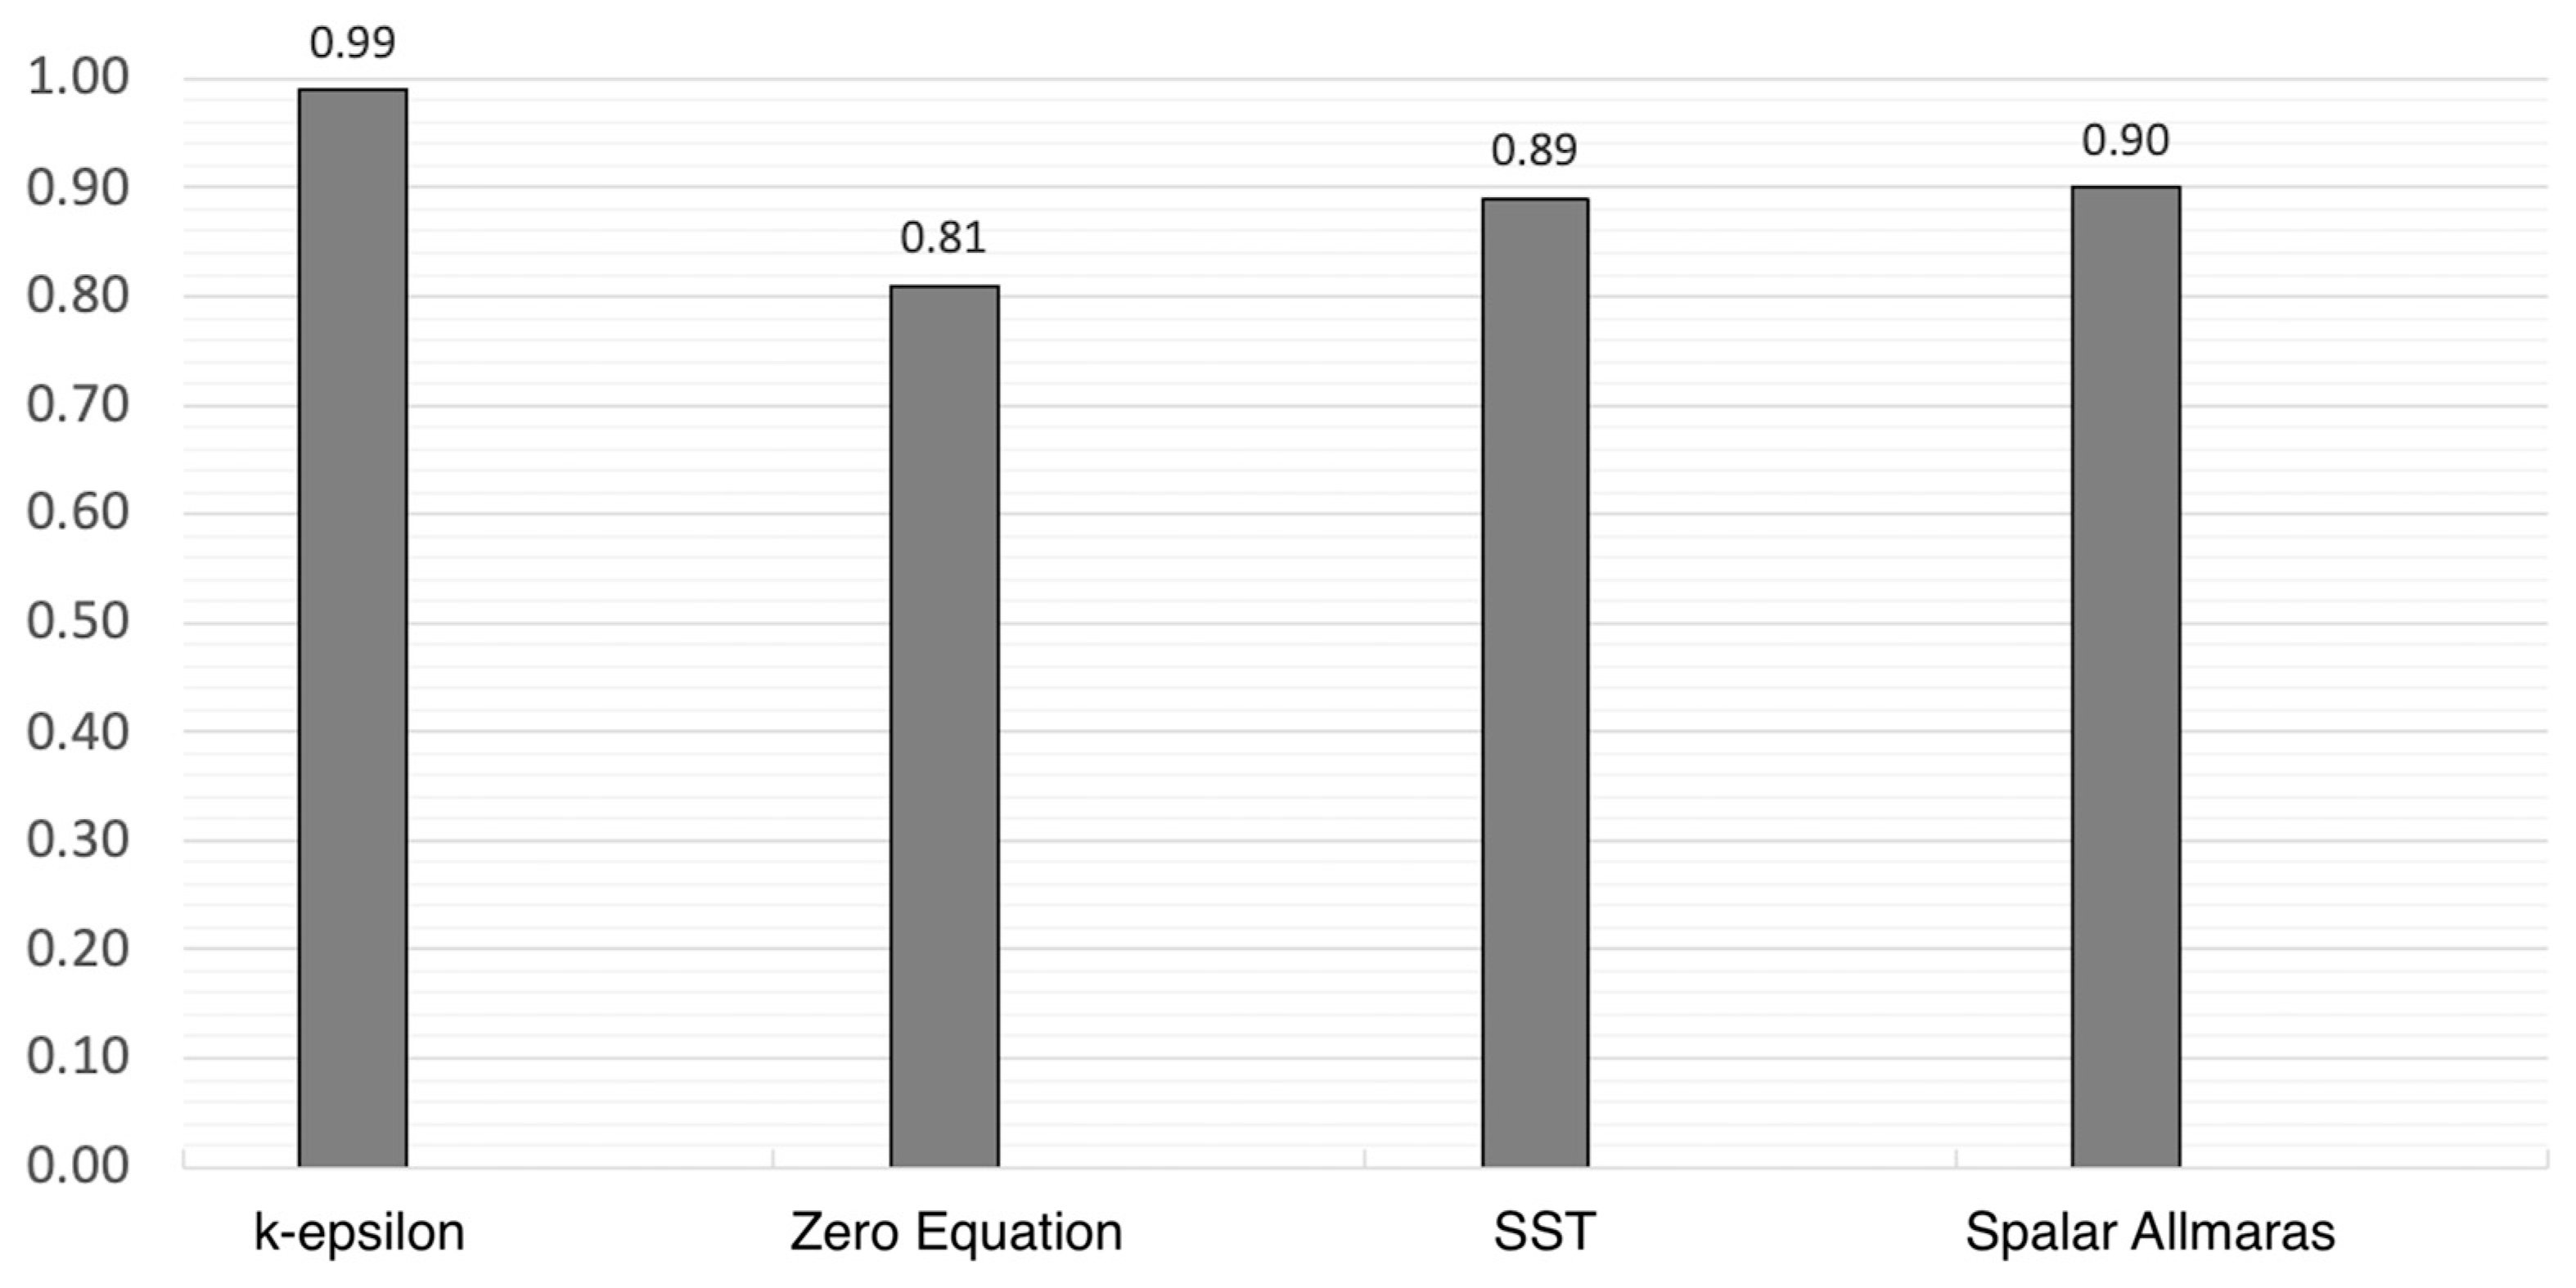
Figure 5 shows the R2 values obtained in simulations performed with the K-epsilon, zero-equation, shear stress transport (SST) and Spalart–Allmaras models, of which K-epsilon is the best. The values were obtained in the adjustments of values from the models, and experimental values were obtained from tests in the mining galleries.
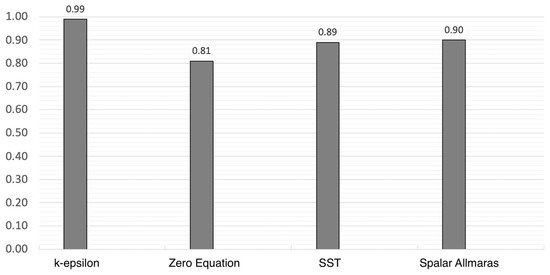
Figure 5.
Comparative analysis (R2) of the turbulence models.
In this research, two different computational models were introduced into roadway 7a: one model in which no auxiliary ventilation overlapped with the main ventilation and another model with an auxiliary ventilation duct with a length of 60 m and a diameter of 400 mm.
The geometry and meshing were developed in 3D using a real scale: a cross-sectional area of 12 m2, a gallery with a length of 200 m and the characteristics of an auxiliary forced ventilation system and a duct with a diameter of 400 mm located 12 m from the face.
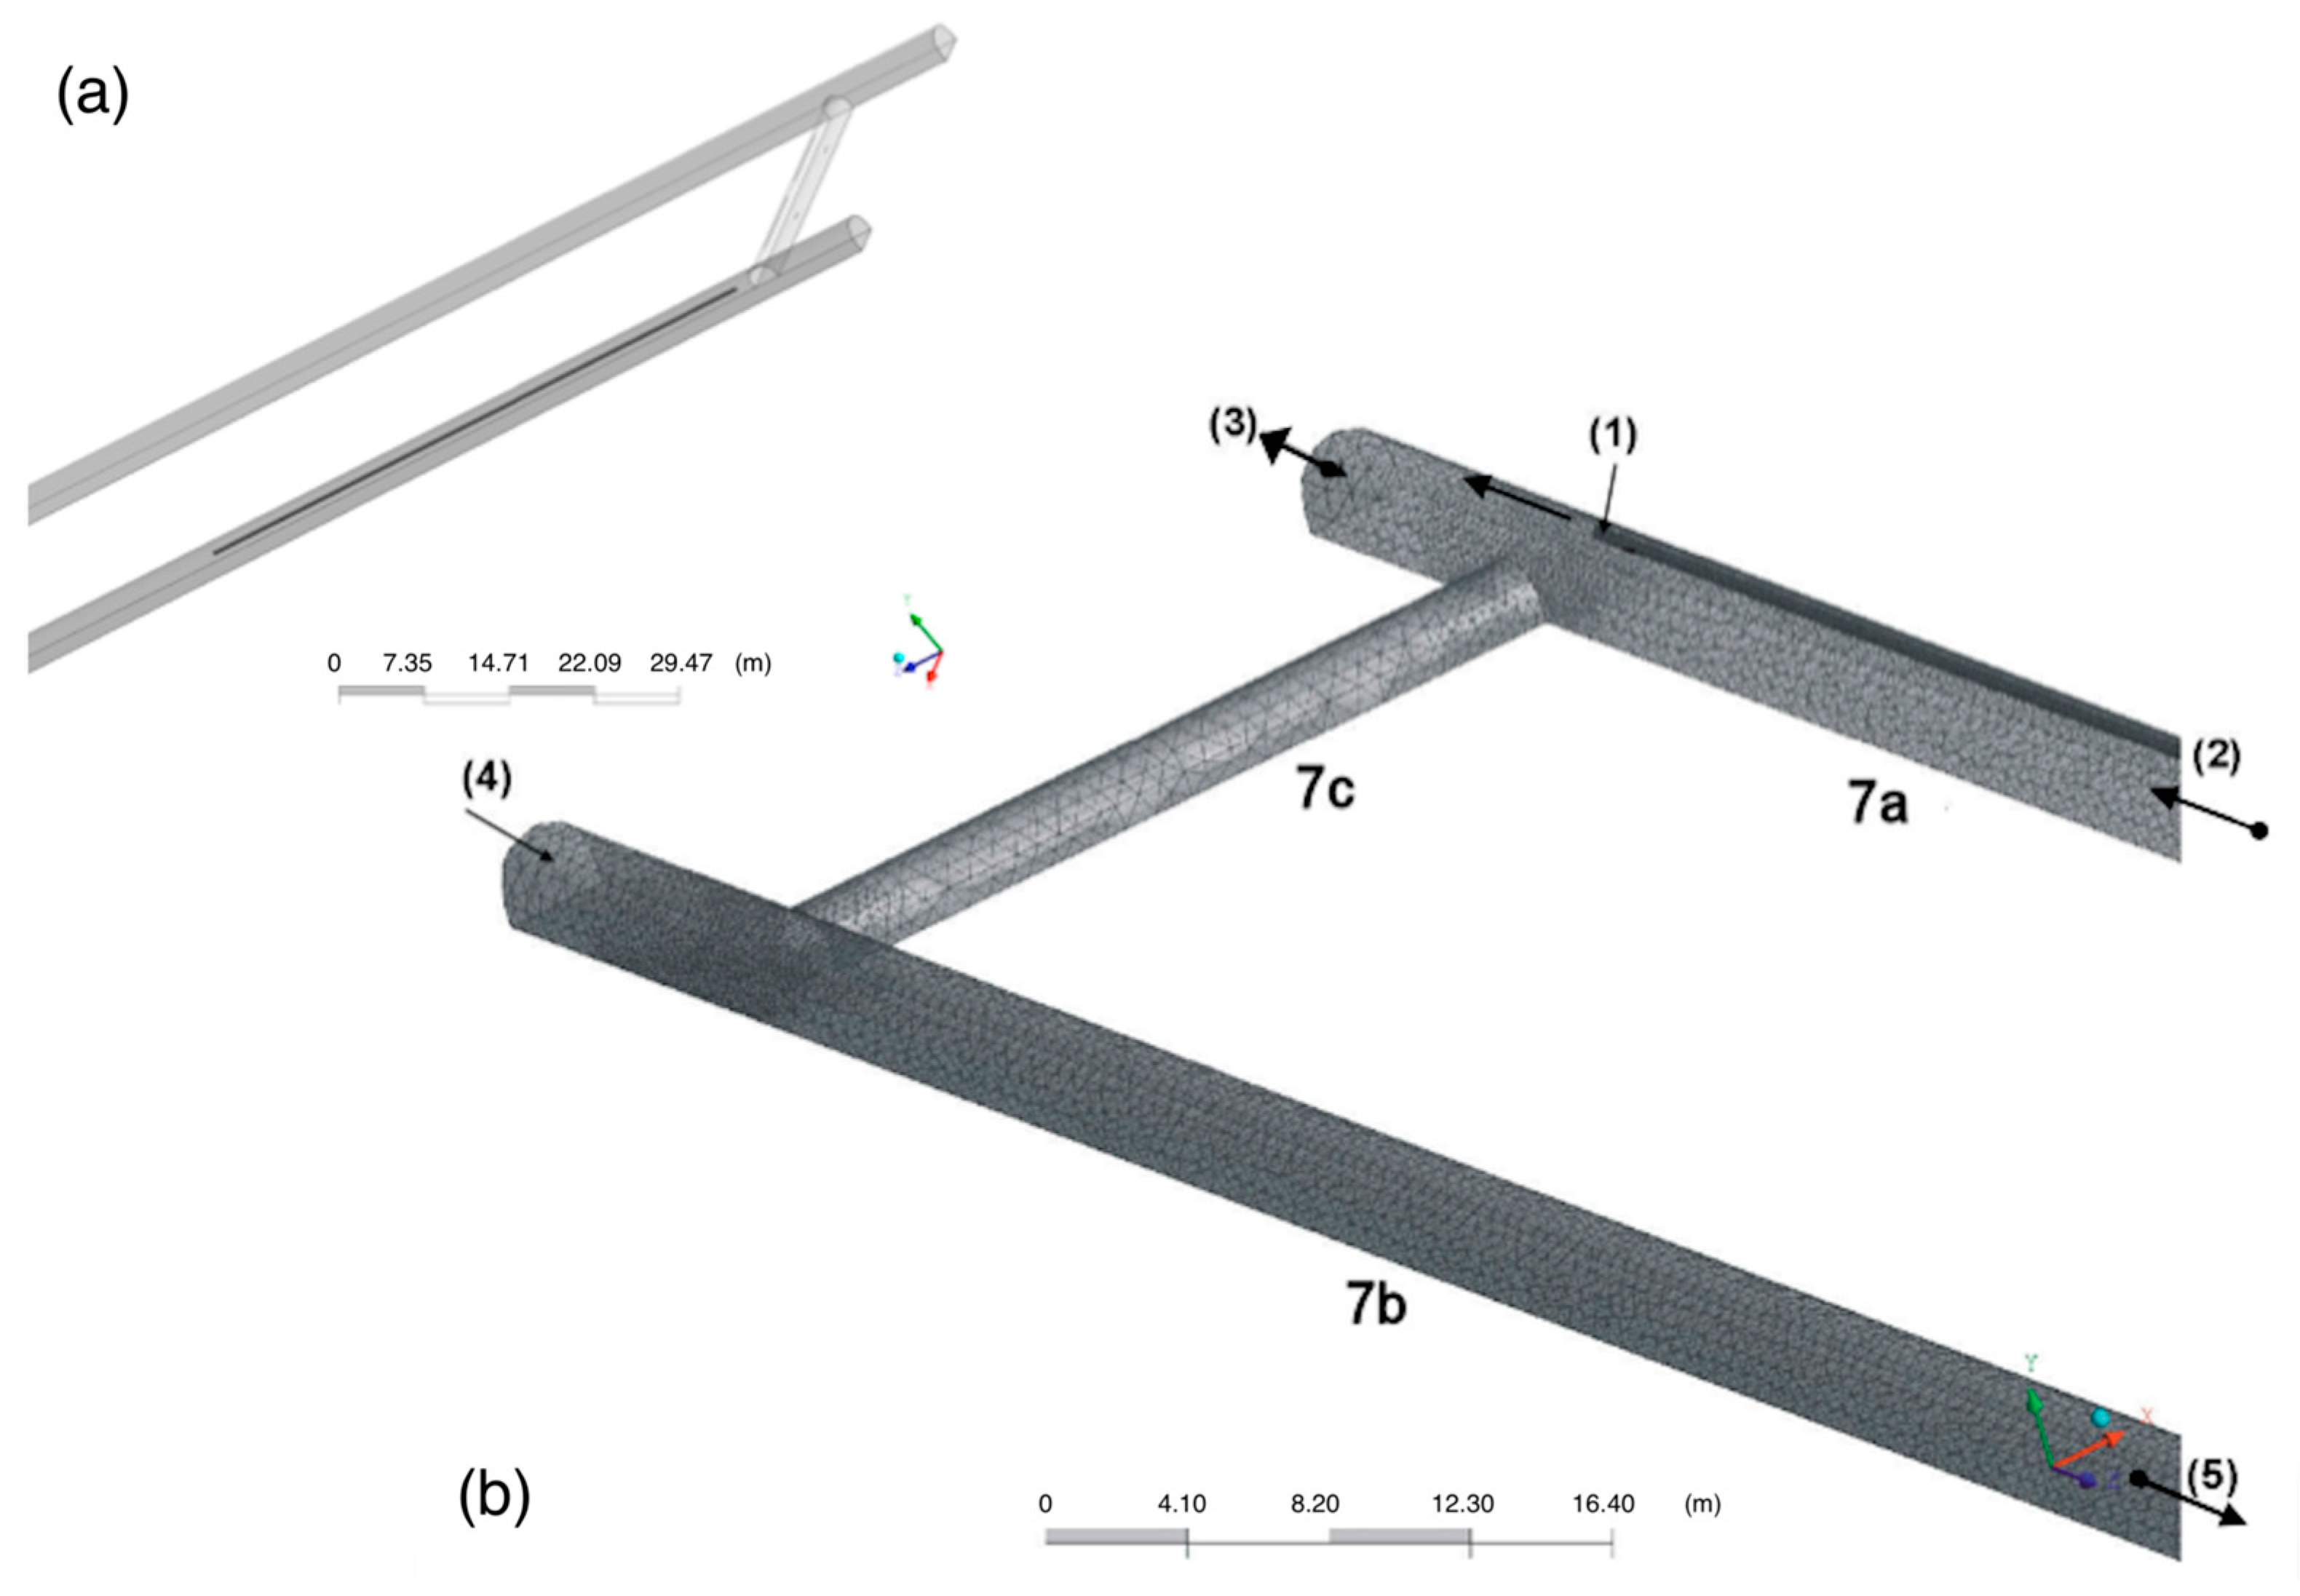
The model meshing was created with 1,238,877 elements (the model without a duct) and 1,295,062 elements (the model with a duct). In this study, two types of mesh were applied with ICEM-CFD 19.1 software: tetrahedrons in the centre of the roadway and prisms in the vicinity of the walls (Figure 6a).
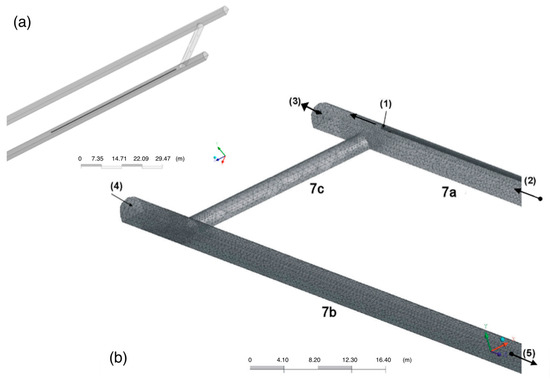
Figure 6.
3D model and mesh of galleries 7a, 7b and 7c and the auxiliary ventilation duct. (a) model geometry; (b) the meshing of the model with the boundary conditions.
The CFD models have three types of boundary conditions: wall, opening and inlet (Figure 6b). The models have four inlets and outlets, as shown in Figure 6. One inlet is located at the ductwork outlet (1) with an airflow of 20 m/s. The second inlet is characterised by the main ventilation of 2 m/s (2). The third inlet (3) and fourth inlet (4) correspond to methane emissions of 3750 m3 towards roadway 7a and 0 m3 towards roadway 7b. The outlet that contains methane is produced by the opening (5), and the remaining surfaces are walls.
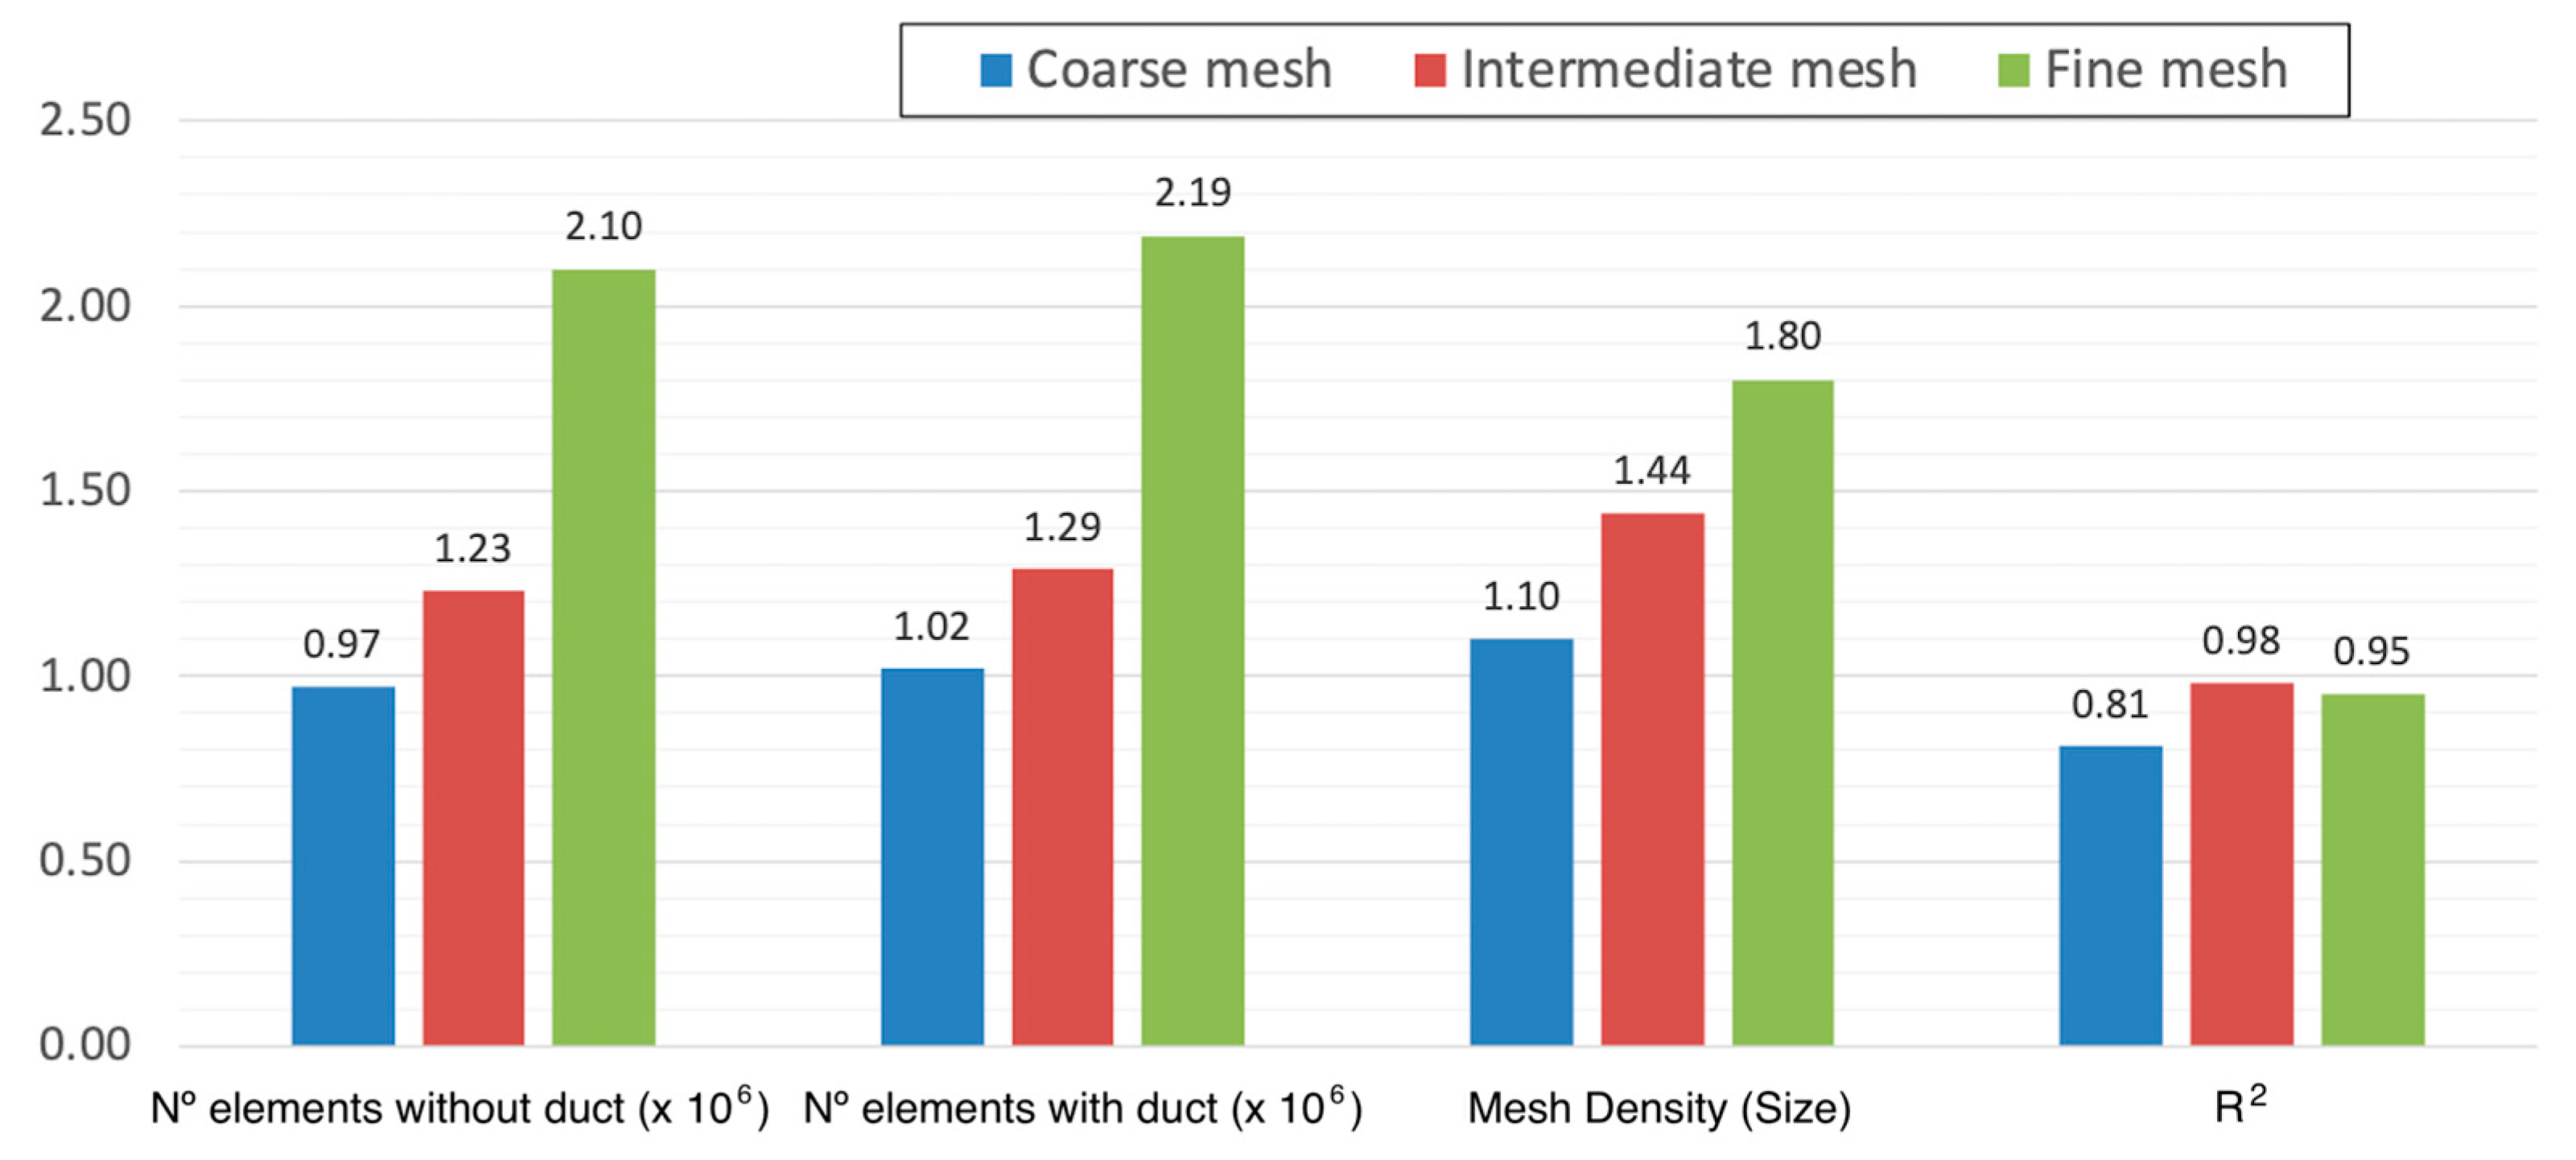
Tests of mesh independence were conducted based on three different meshing creations. The model without a duct included a coarse mesh of 973,206 elements, a fine mesh of 2,100,551 elements and an intermediate mesh of 1,238,877 elements. The model with a duct included a coarse mesh of 1,017,343 elements, a fine mesh of 2,195,815 elements and an intermediate mesh of 1,295,062 elements (Figure 7), where the highest value of R2 (comparison of CFD and experimental values) can be seen for the intermediate mesh.
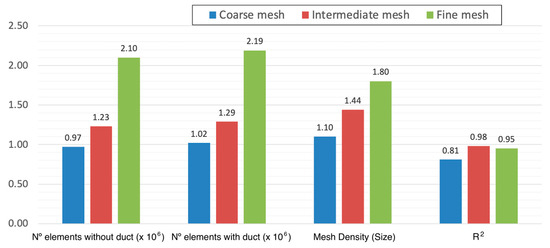
Figure 7.
Test of mesh independence for the studied turbulence model.
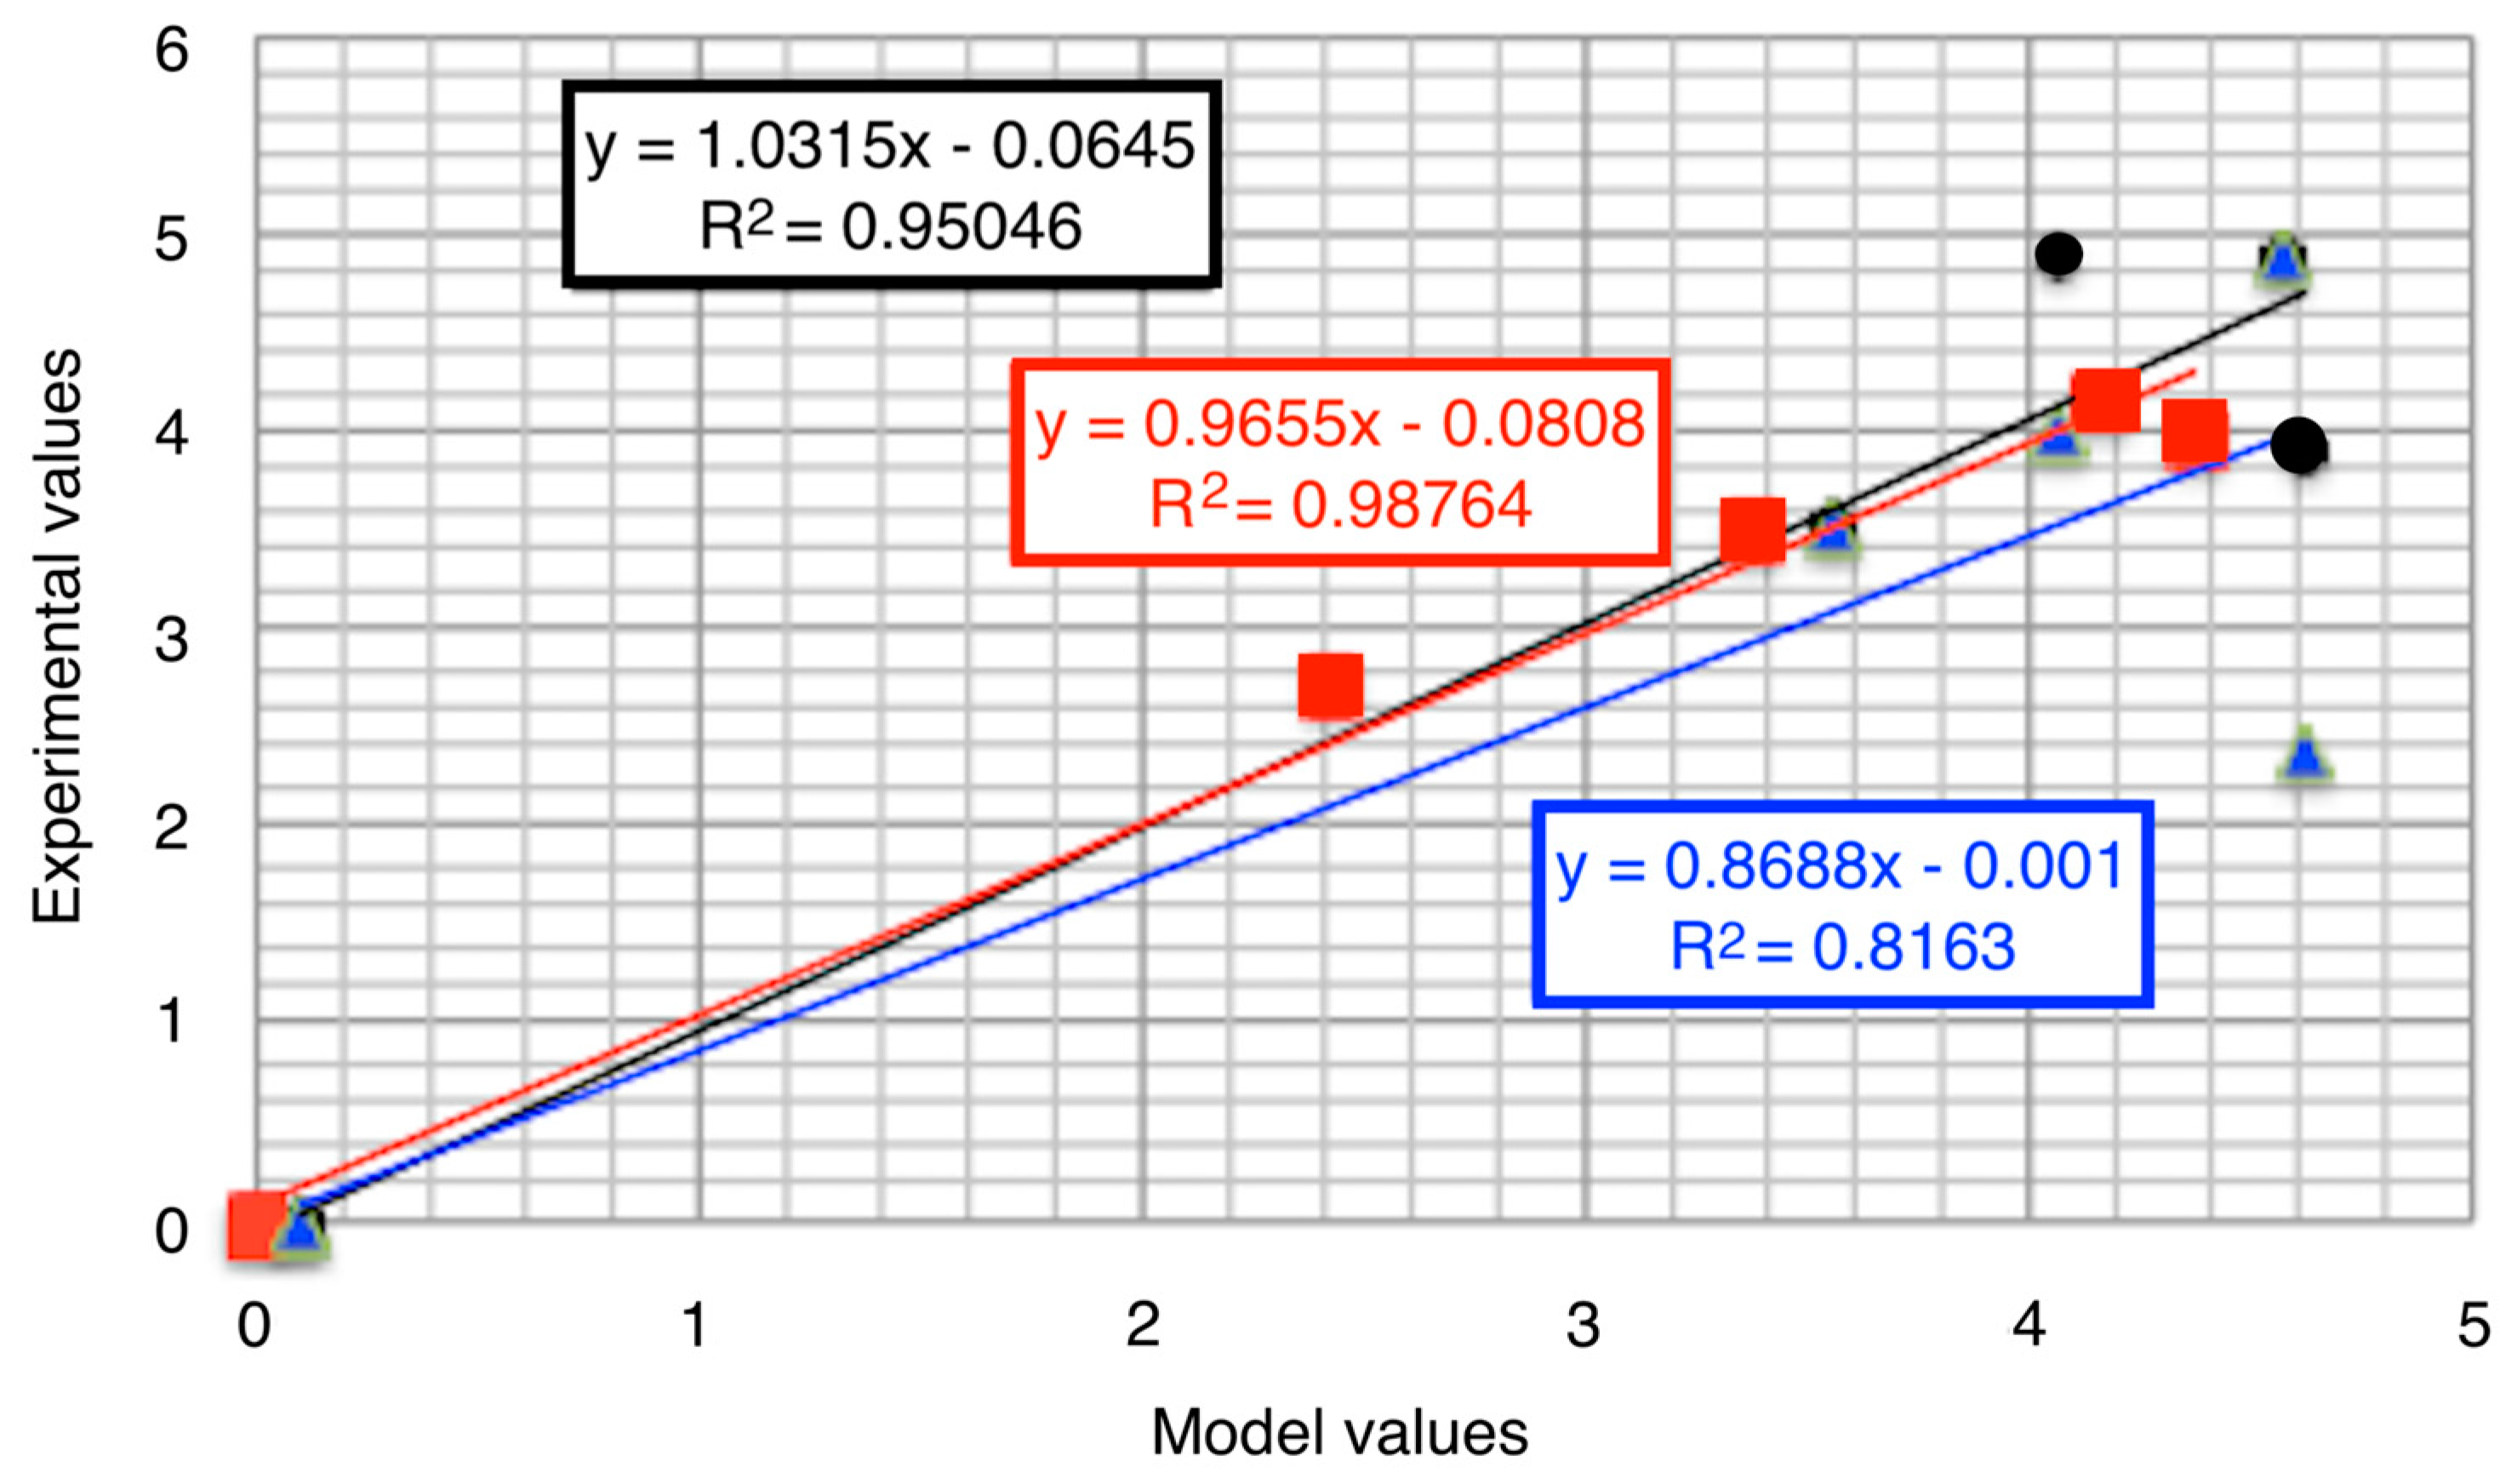
Figure 8 shows an example of CH4 mathematical correlations (R2) for the calibration of the K-epsilon model from the models and the values measured in the galleries.
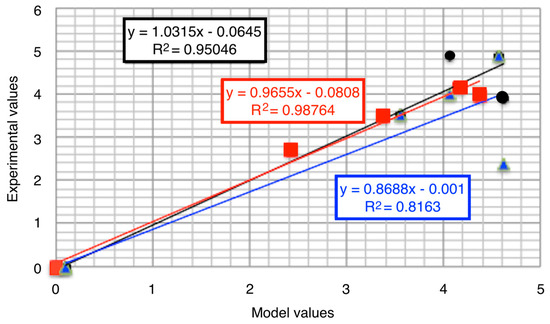
Figure 8.
The relationship between CH4 values obtained via the CFD model and those obtained via experimental measurements.
The results obtained with the fine mesh indicated no appreciable change in the results, whereas the precision of the obtained results diminished with the coarse mesh. Based on the results, an intermediate mesh with a quality of 0.35, which is considered acceptable for the Ansys ICEM-CFD support, was selected [27].
3. Results and Discussion
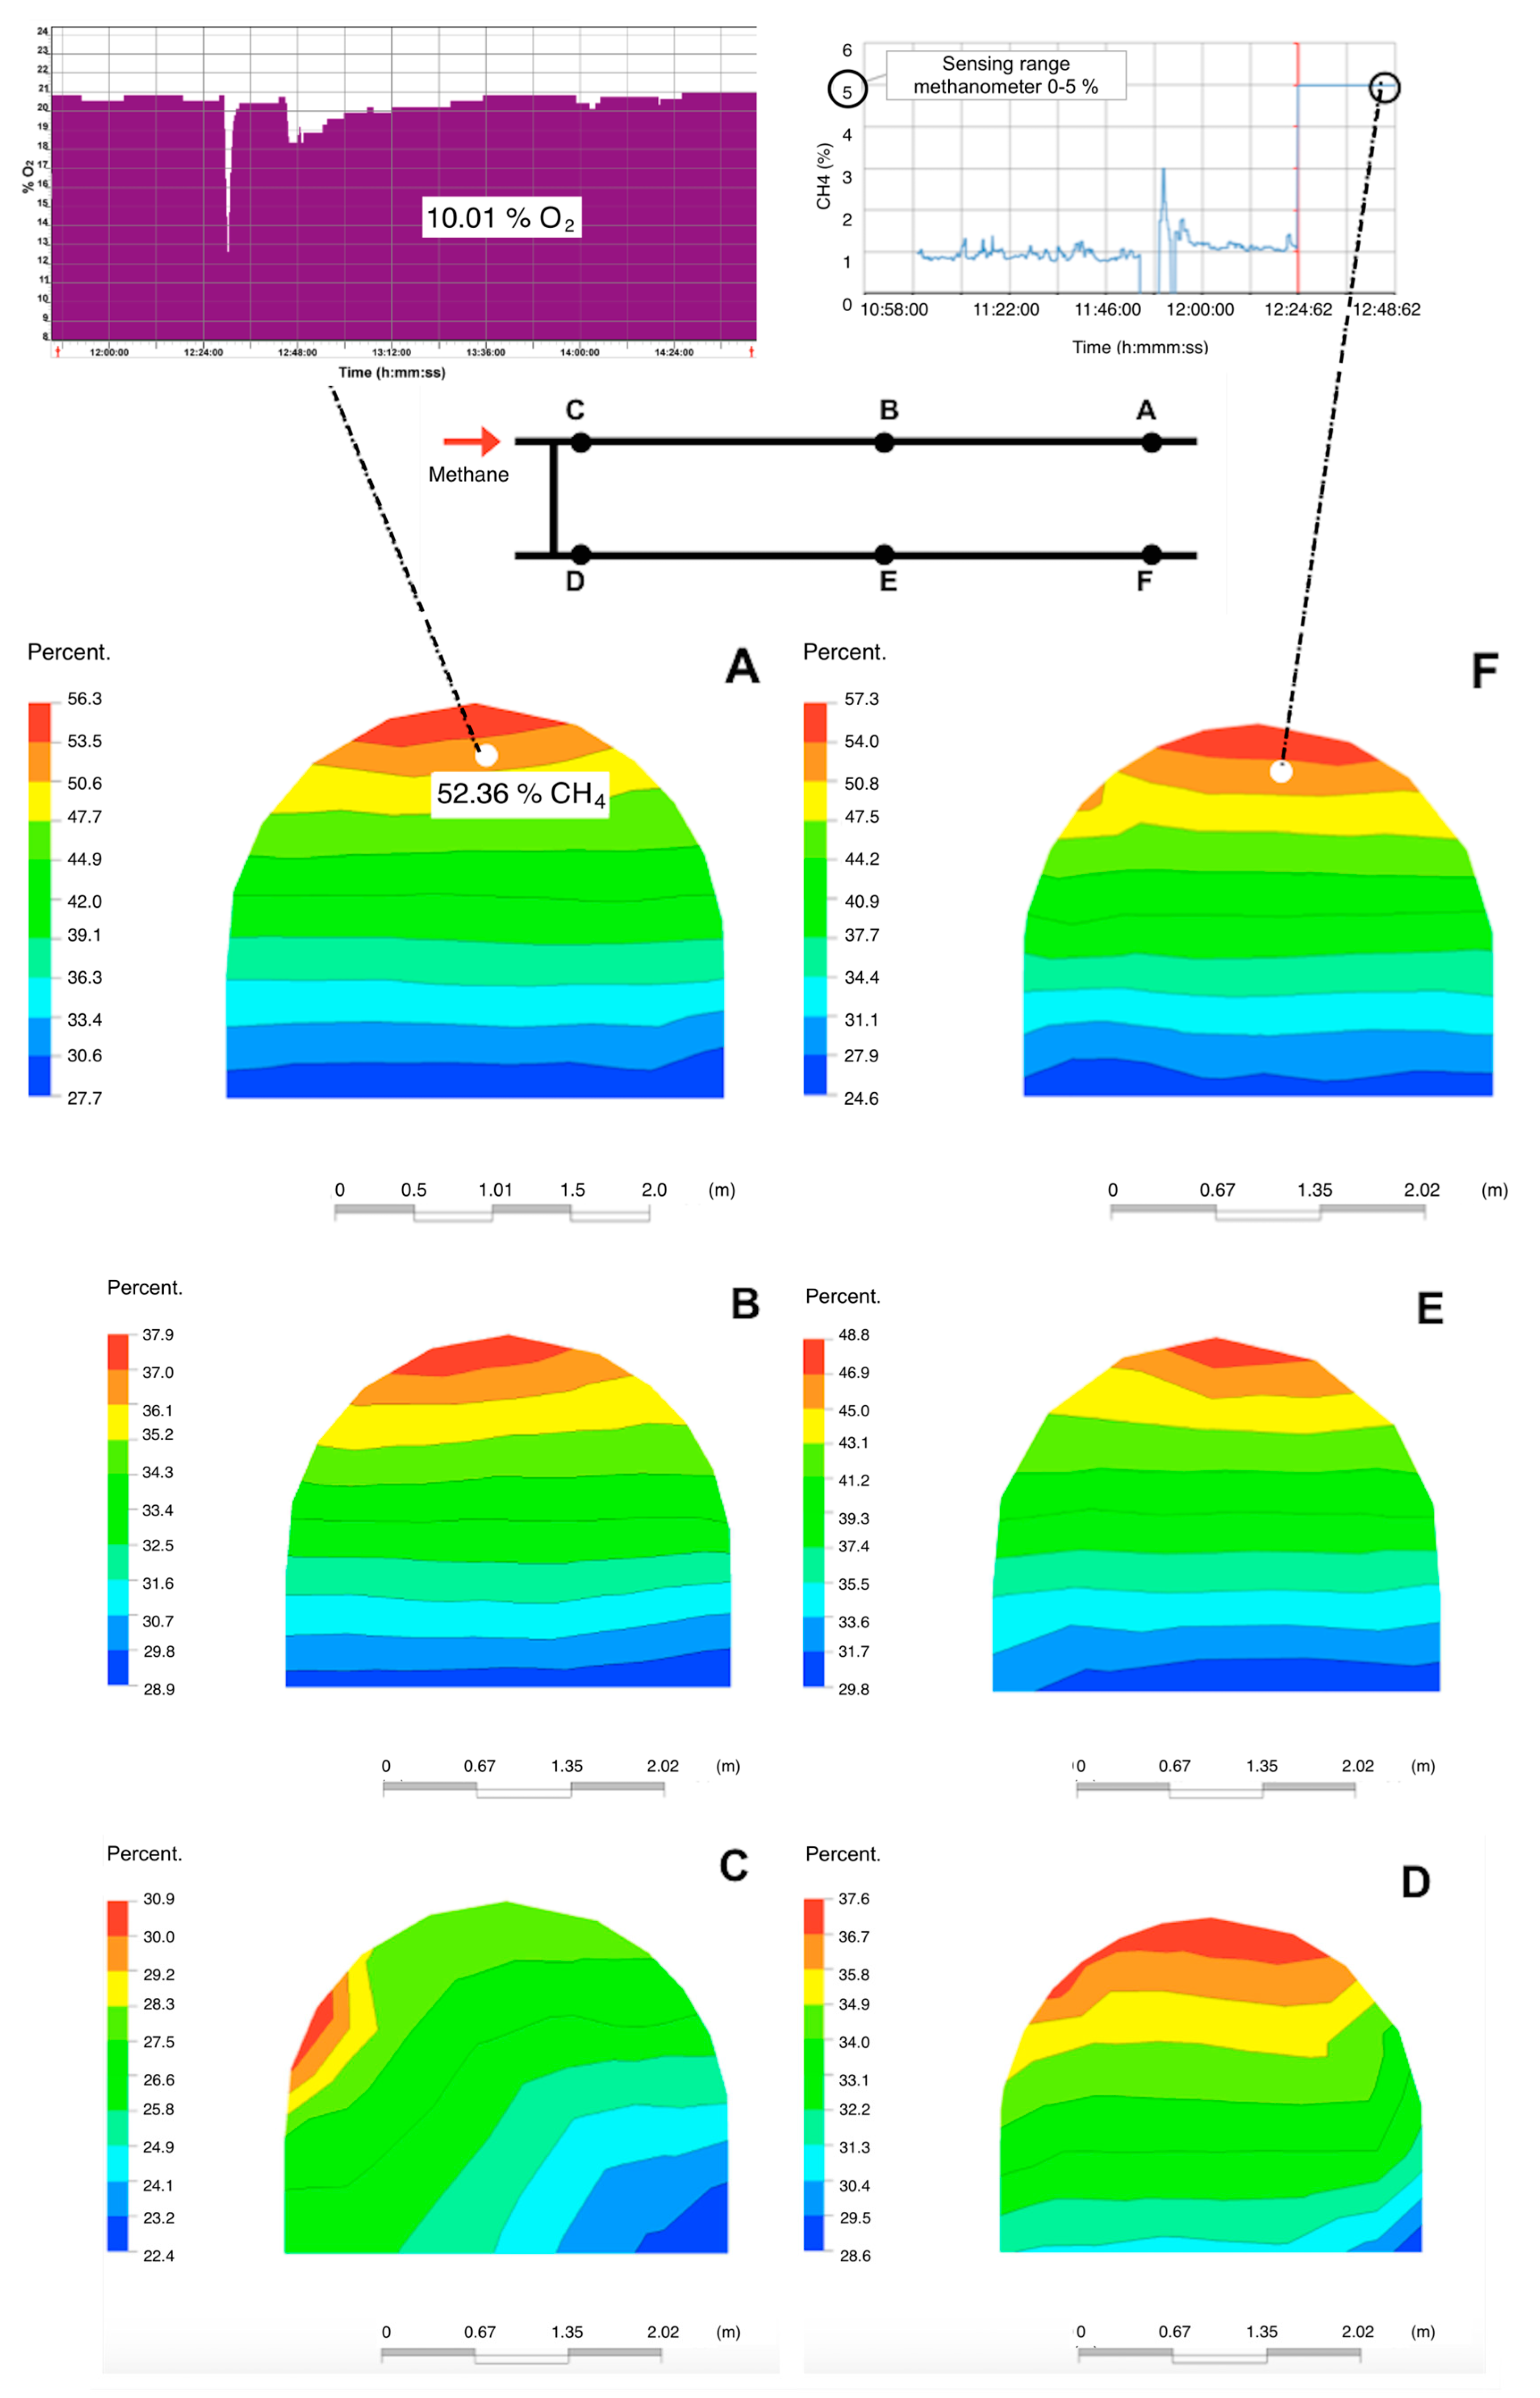
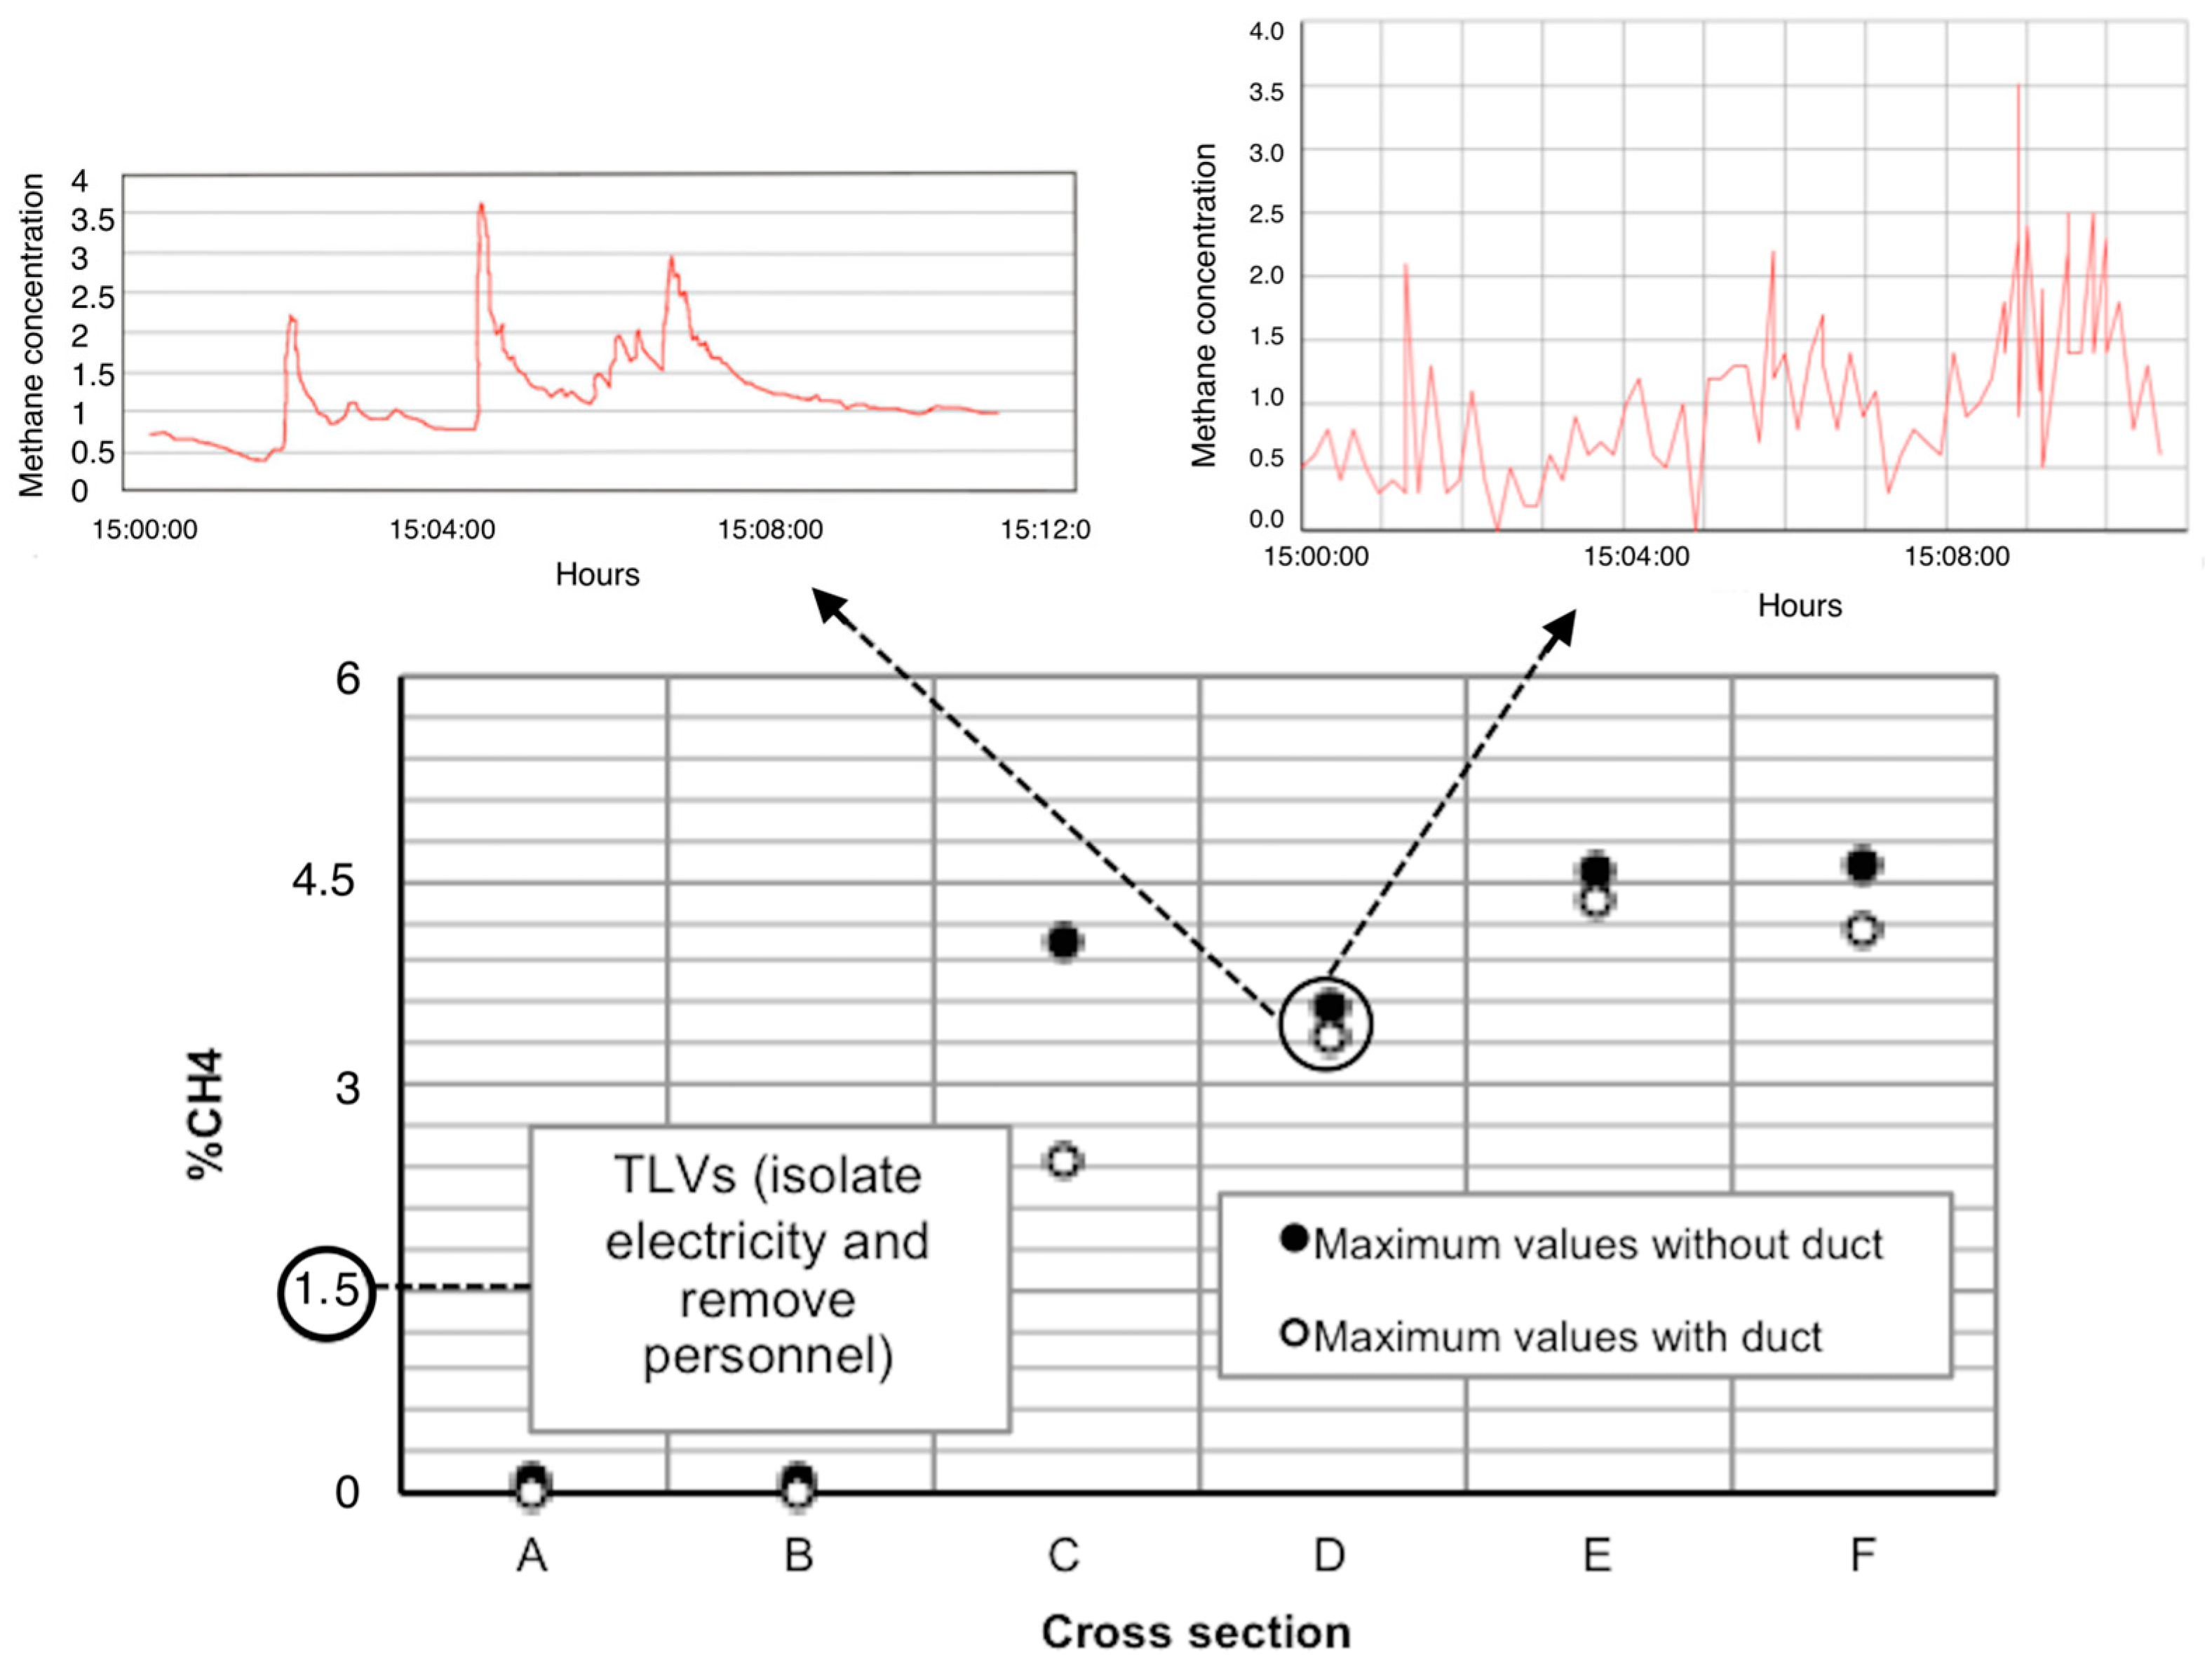
Figure 9 shows the maximum CH4 concentration values in the six cross-sections of the gallery or tunnel, an example of the oximeter recording at section A (the O2 measurement of 10.01% for 37 s during methane emission) and an example of the methanometer recording at section F.
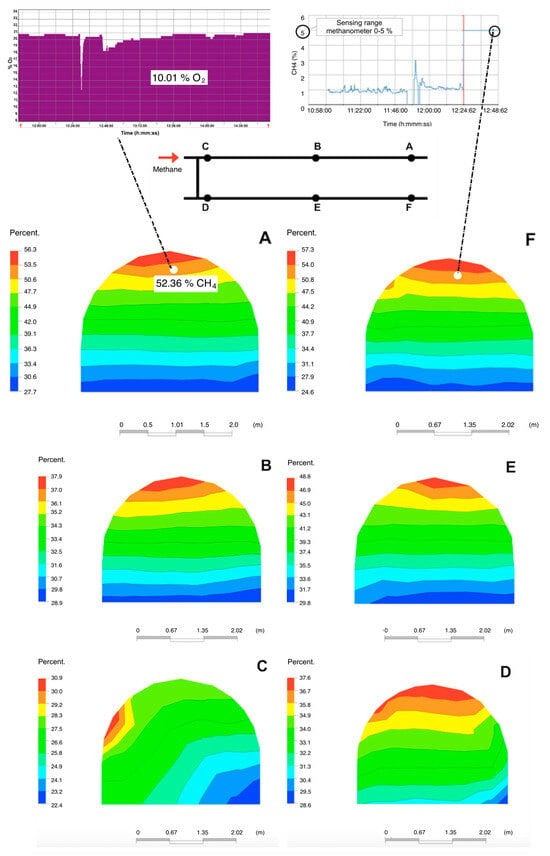
Figure 9.
CH4% in the cross-sections (A–F) without auxiliary ventilation.
When a CH4 concentration greater than 5% reaches the methanometer, the measurement recorded remains at 5%, which is the maximum measurement range of the methanometer.
Methane emissions of all galleries have mean and maximum values above the threshold limit values (TLV or TLV-C) [28,29]. The TLV of CH4 in the air indicate the concentrations to which personnel may be exposed without known adverse effects on their health or safety. When the TLV concentration has been exceeded, this condition is referred to as TLV-Ceiling (TLV-C).
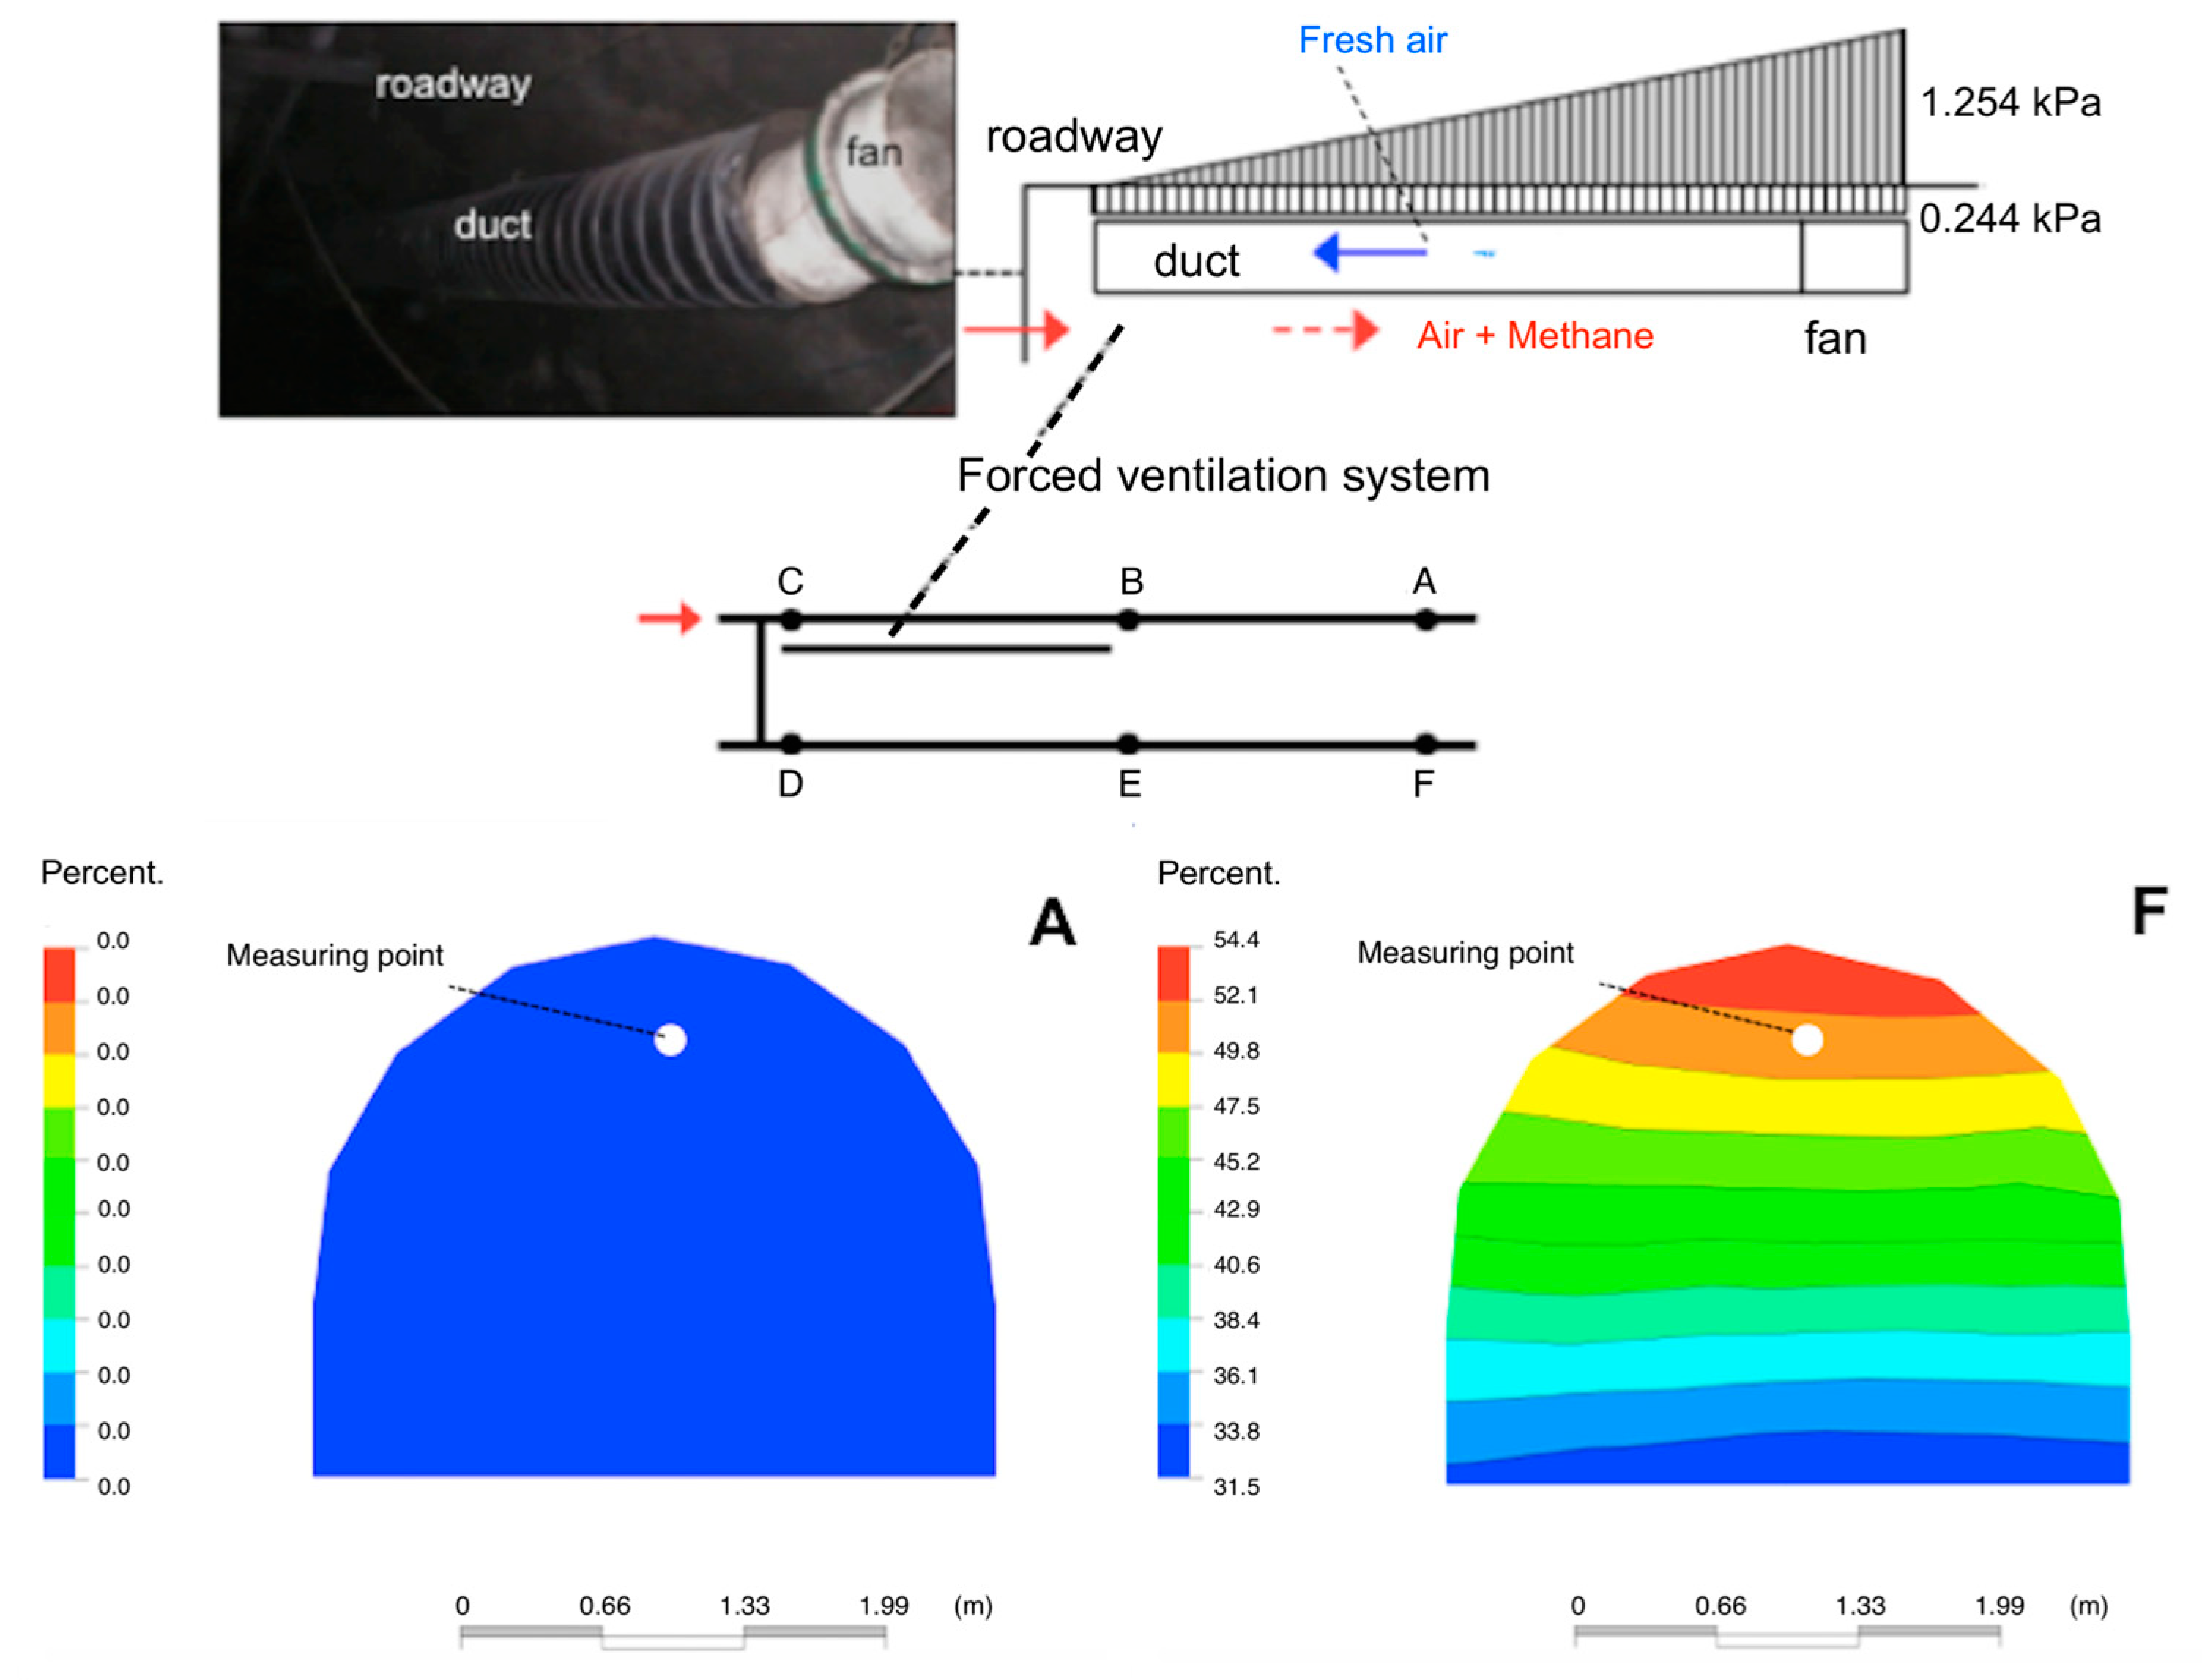
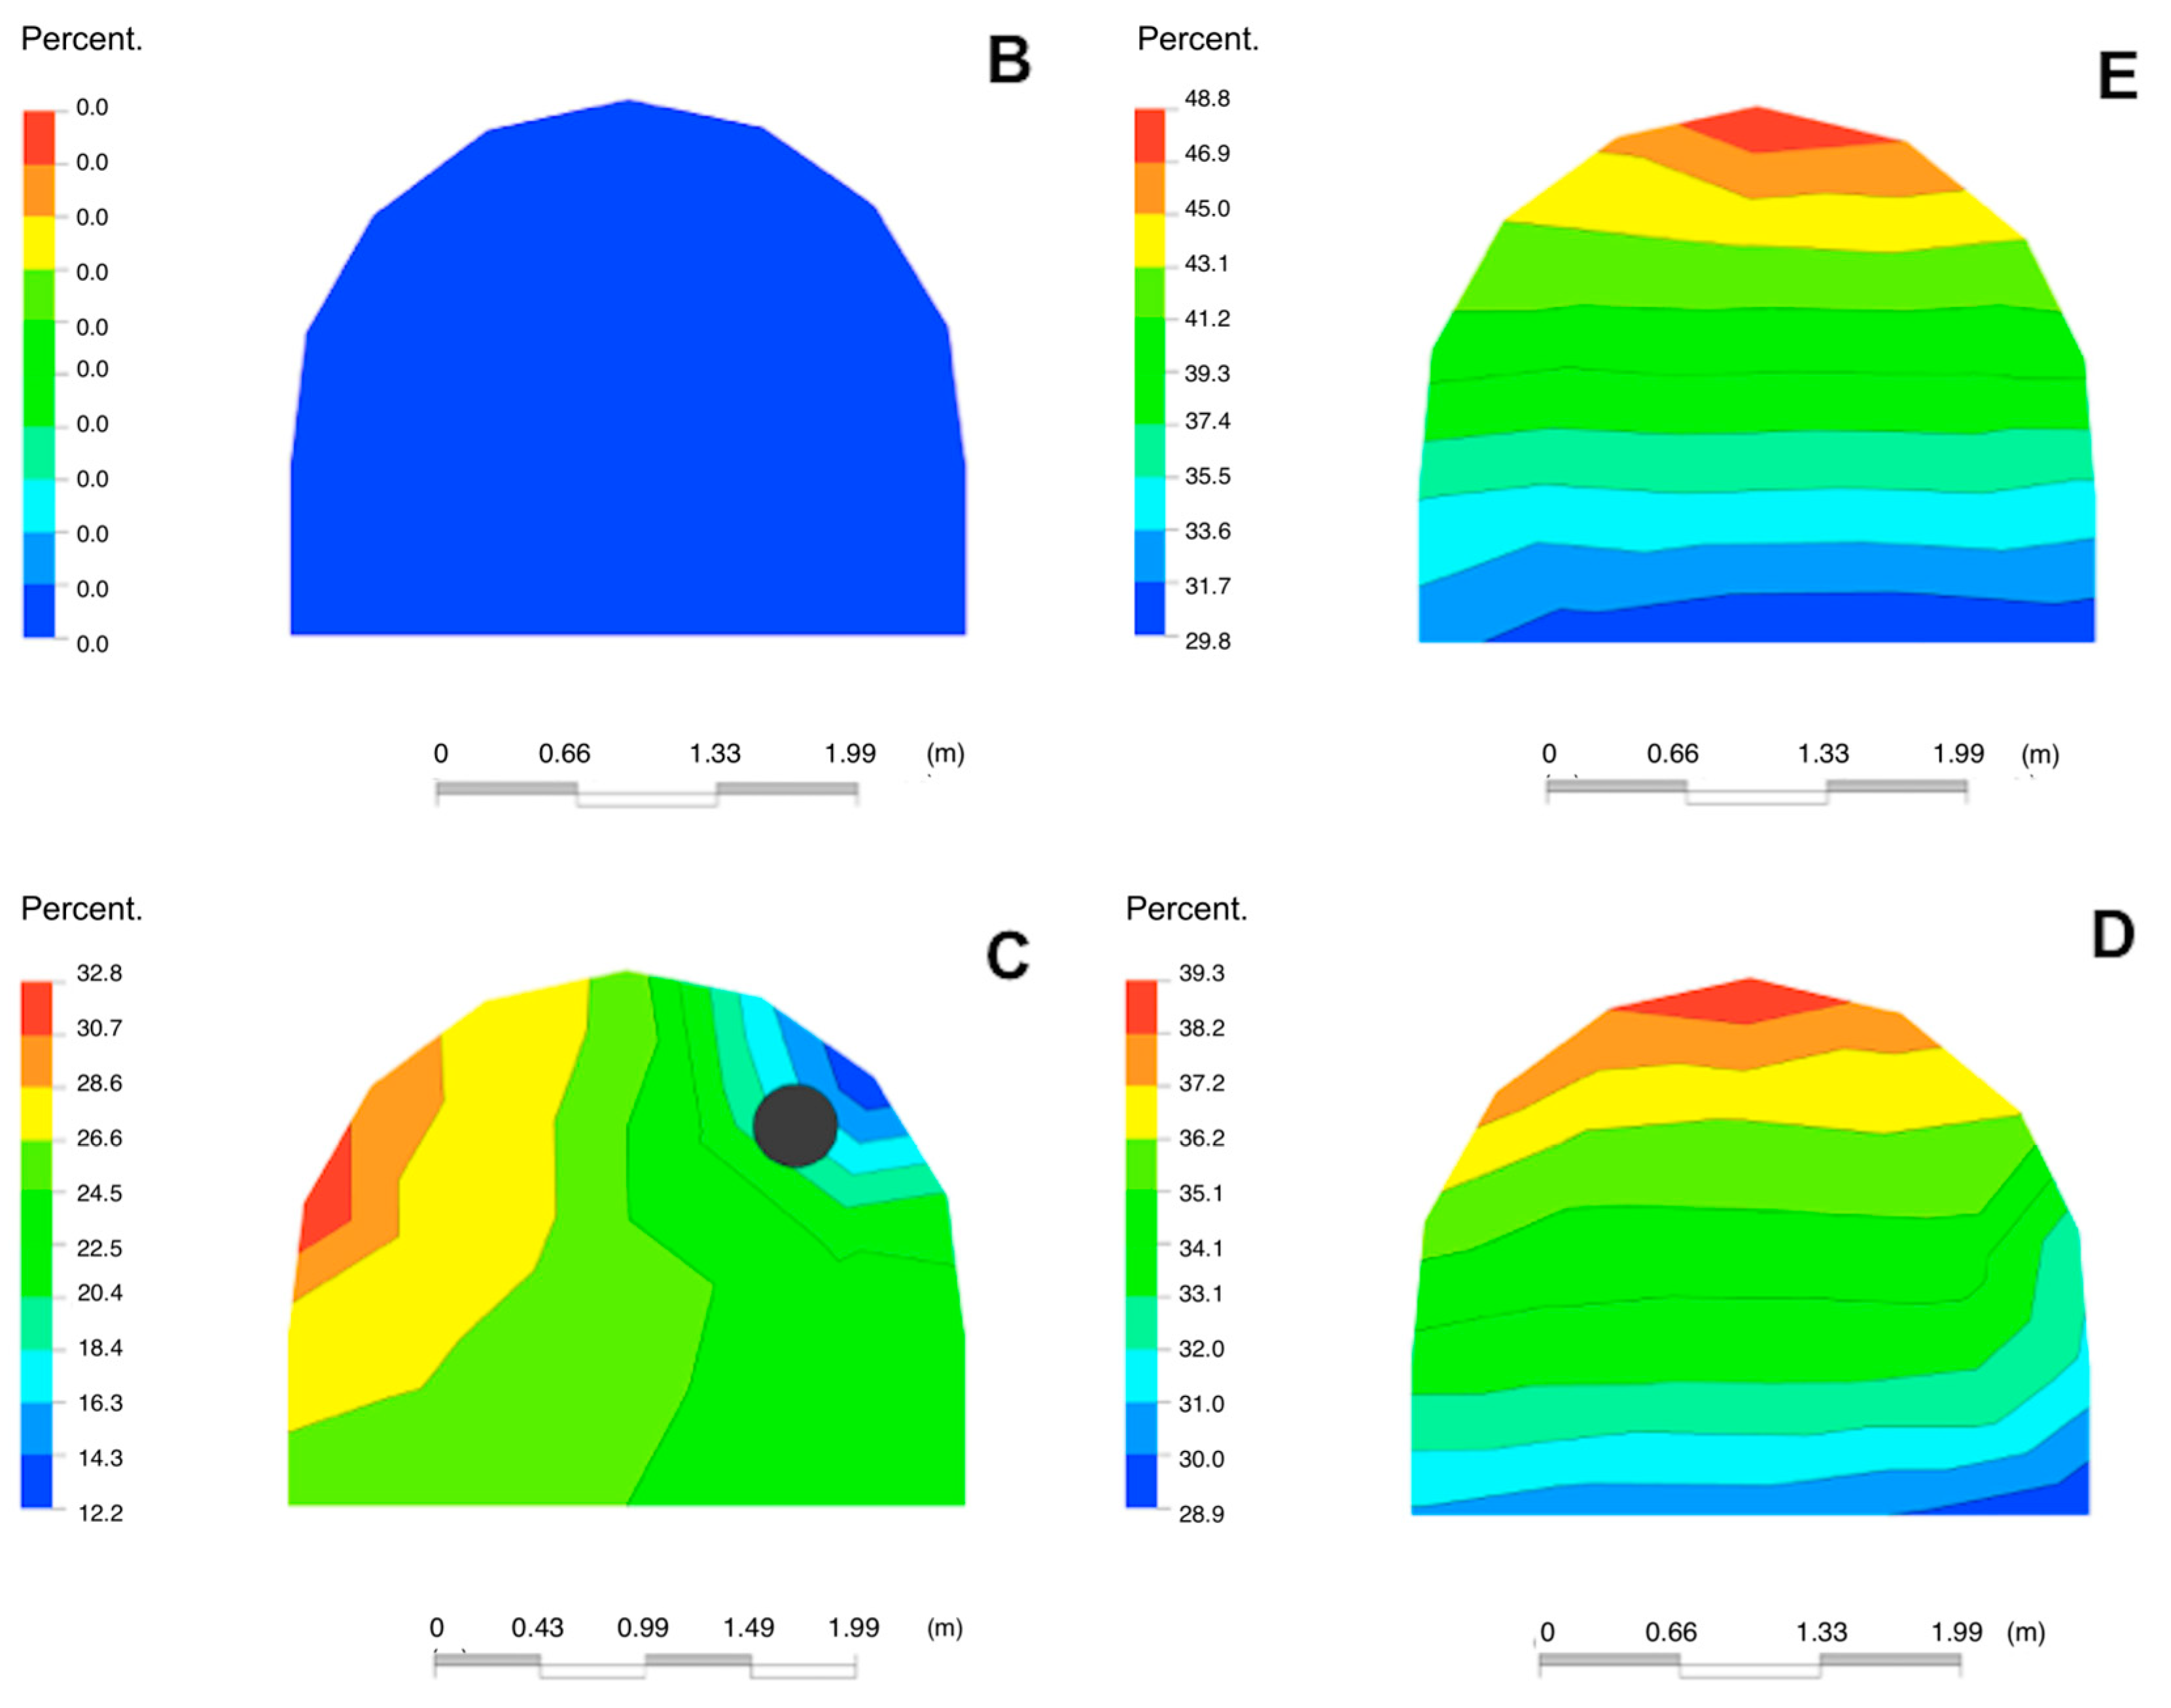
Figure 10 shows the evolution of the maximum CH4 concentration in the six cross-sections of the gallery or tunnel when auxiliary forced ventilation (with a diameter of 400 mm, length of 60 m, flow of 2.6 m3/s and duct air output speed of 20 m/s) is installed between section B and section C in gallery 7a. This figure shows a diagram of auxiliary ventilation and a photograph of the installation. As shown in cross-sections A and B, the maximum CH4 concentration is 0%.
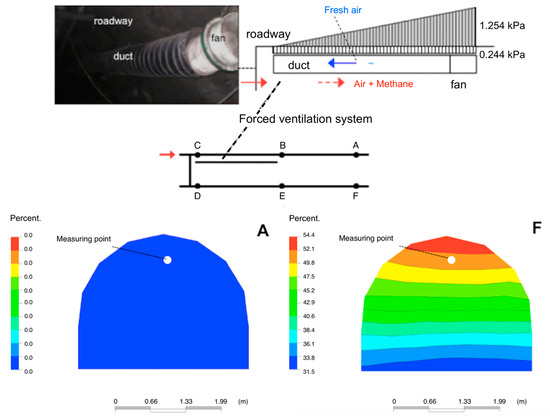
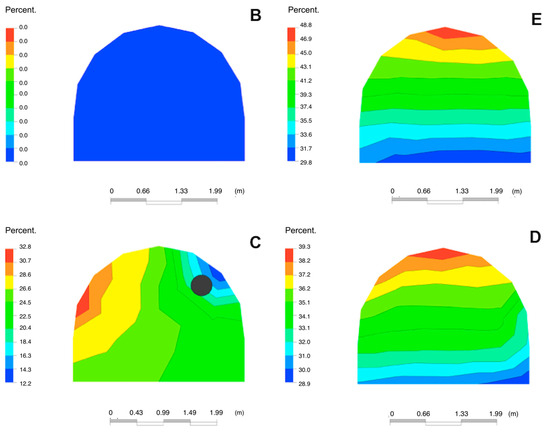
Figure 10.
CH4% in the cross-sections (A–F) with auxiliary ventilation.
For example, Figure 11 shows the CH4 recordings of methanometers in cross-sections A and F.

Figure 11.
CH4 recording of methanometers placed in (a) cross-section A; (b) cross-section F.
Figure 12 shows the effect of the evolution of CH4% in the cross-sections with and without auxiliary ventilation: maximum values are in Figure 12a and average values are in Figure 12b.

Figure 12.
Effect of the maximum and mean CH4% evolution in the cross-sections (a) without auxiliary ventilation and (b) with auxiliary ventilation.
Using the cross-sections (A = 1, B = 2, C = 3, D = 4, E = 5 and F = 6) as X-axis values, the evolution of the CH4 concentration (as Y-axis values) can be expressed via Equations (1) and (2) for the maximum concentration values in the case of main ventilation without and with an auxiliary fan.
y = 3.6552 x2 − 24.127 x + 74.149… (R2 = 0.87)
y = 1.081 x4 − 16.036 x3 + 80.354 x2 − 142.08 x + 76.182 … (R2 = 0.87)
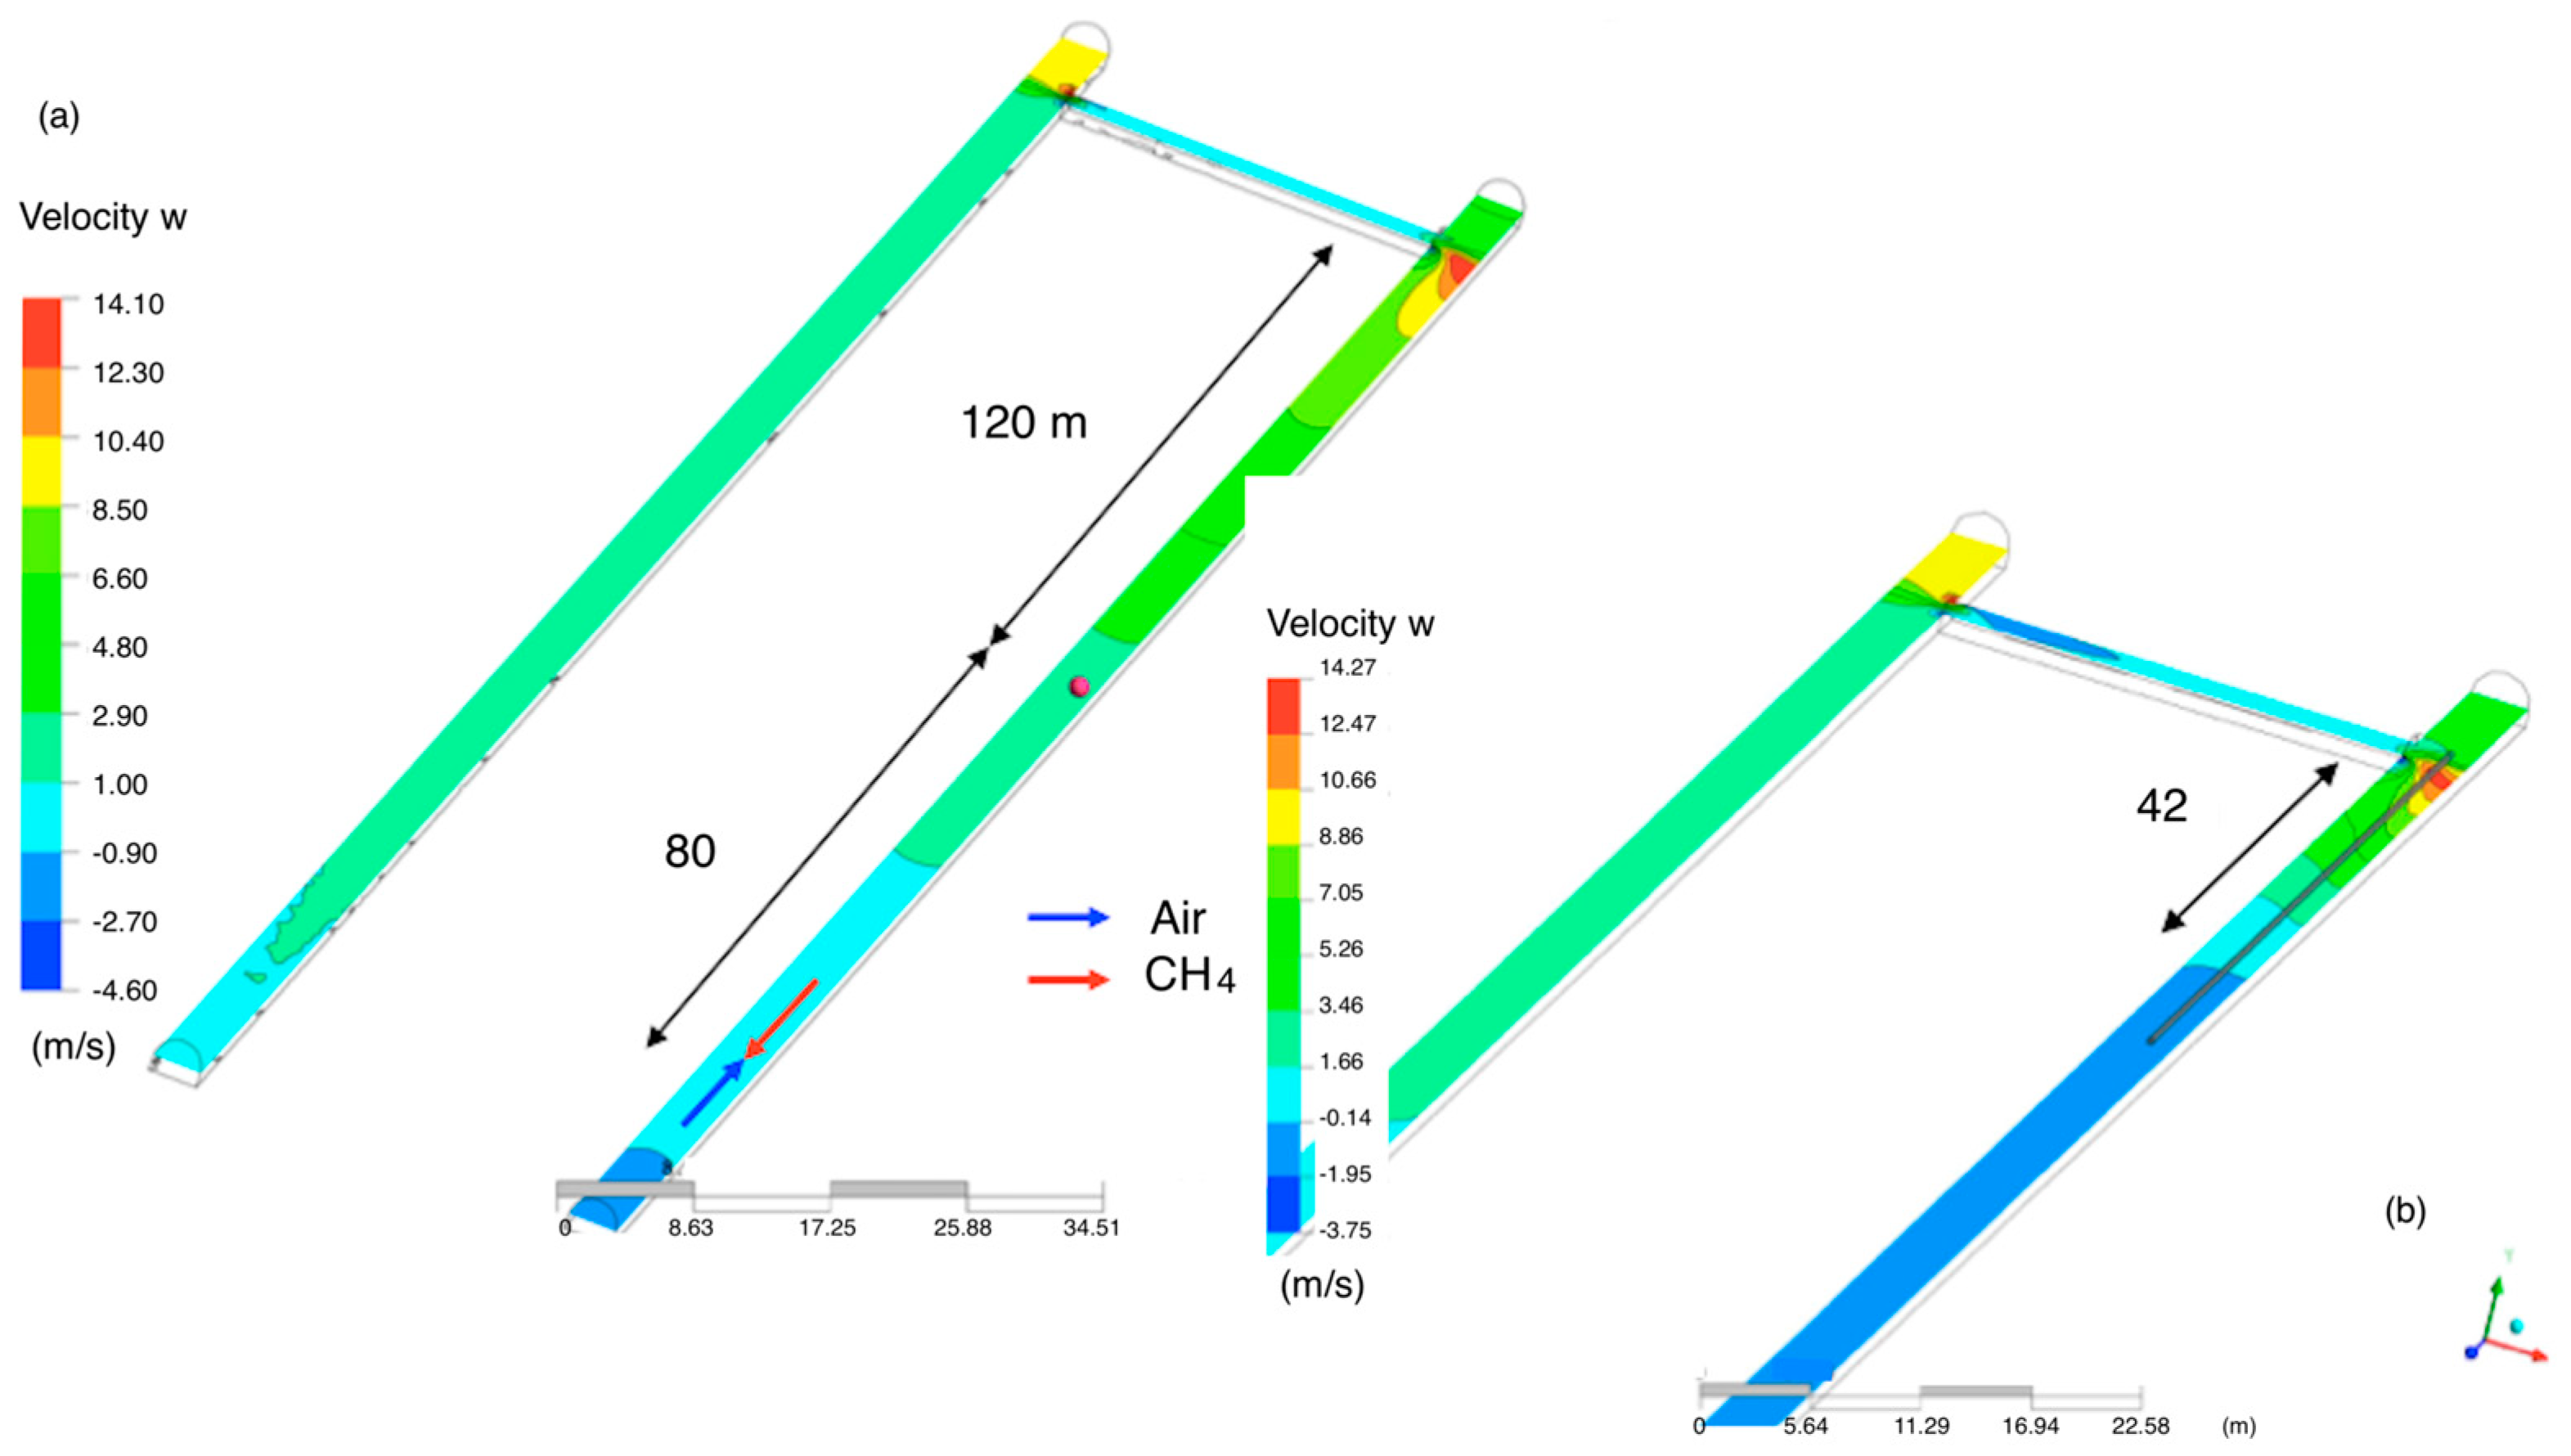
The main ventilation air flows through gallery 7a at 2 m/s. Emitted methane circulates through gallery 7a in the opposite direction at a higher initial velocity (13.8 m/s in cross-section C and 3.24 m/s in cross-section B, as measured using the Trolex TX 5920/1 vortex flow velocity sensing system), which slows the entry of air from the main ventilation and causes the air to reverse its flow at a gallery length of 200 m (Figure 13a). When auxiliary ventilation is installed, the indicated ventilation reversal distance is reduced to 42 m (Figure 13b).
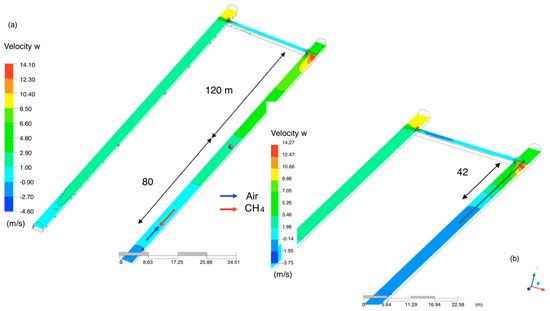
Figure 13.
Effect of auxiliary ventilation on the reversal of the main ventilation produced by methane emission. (a) without auxiliary ventilation; (b) with auxiliary ventilation.
As a result, the maximum and mean CH4 concentrations in the cross-sections behind the 42 m gallery section are reduced to 0%. Superimposing an adequate auxiliary ventilation on the main ventilation can generate safe zones behind the ventilation reversal area.
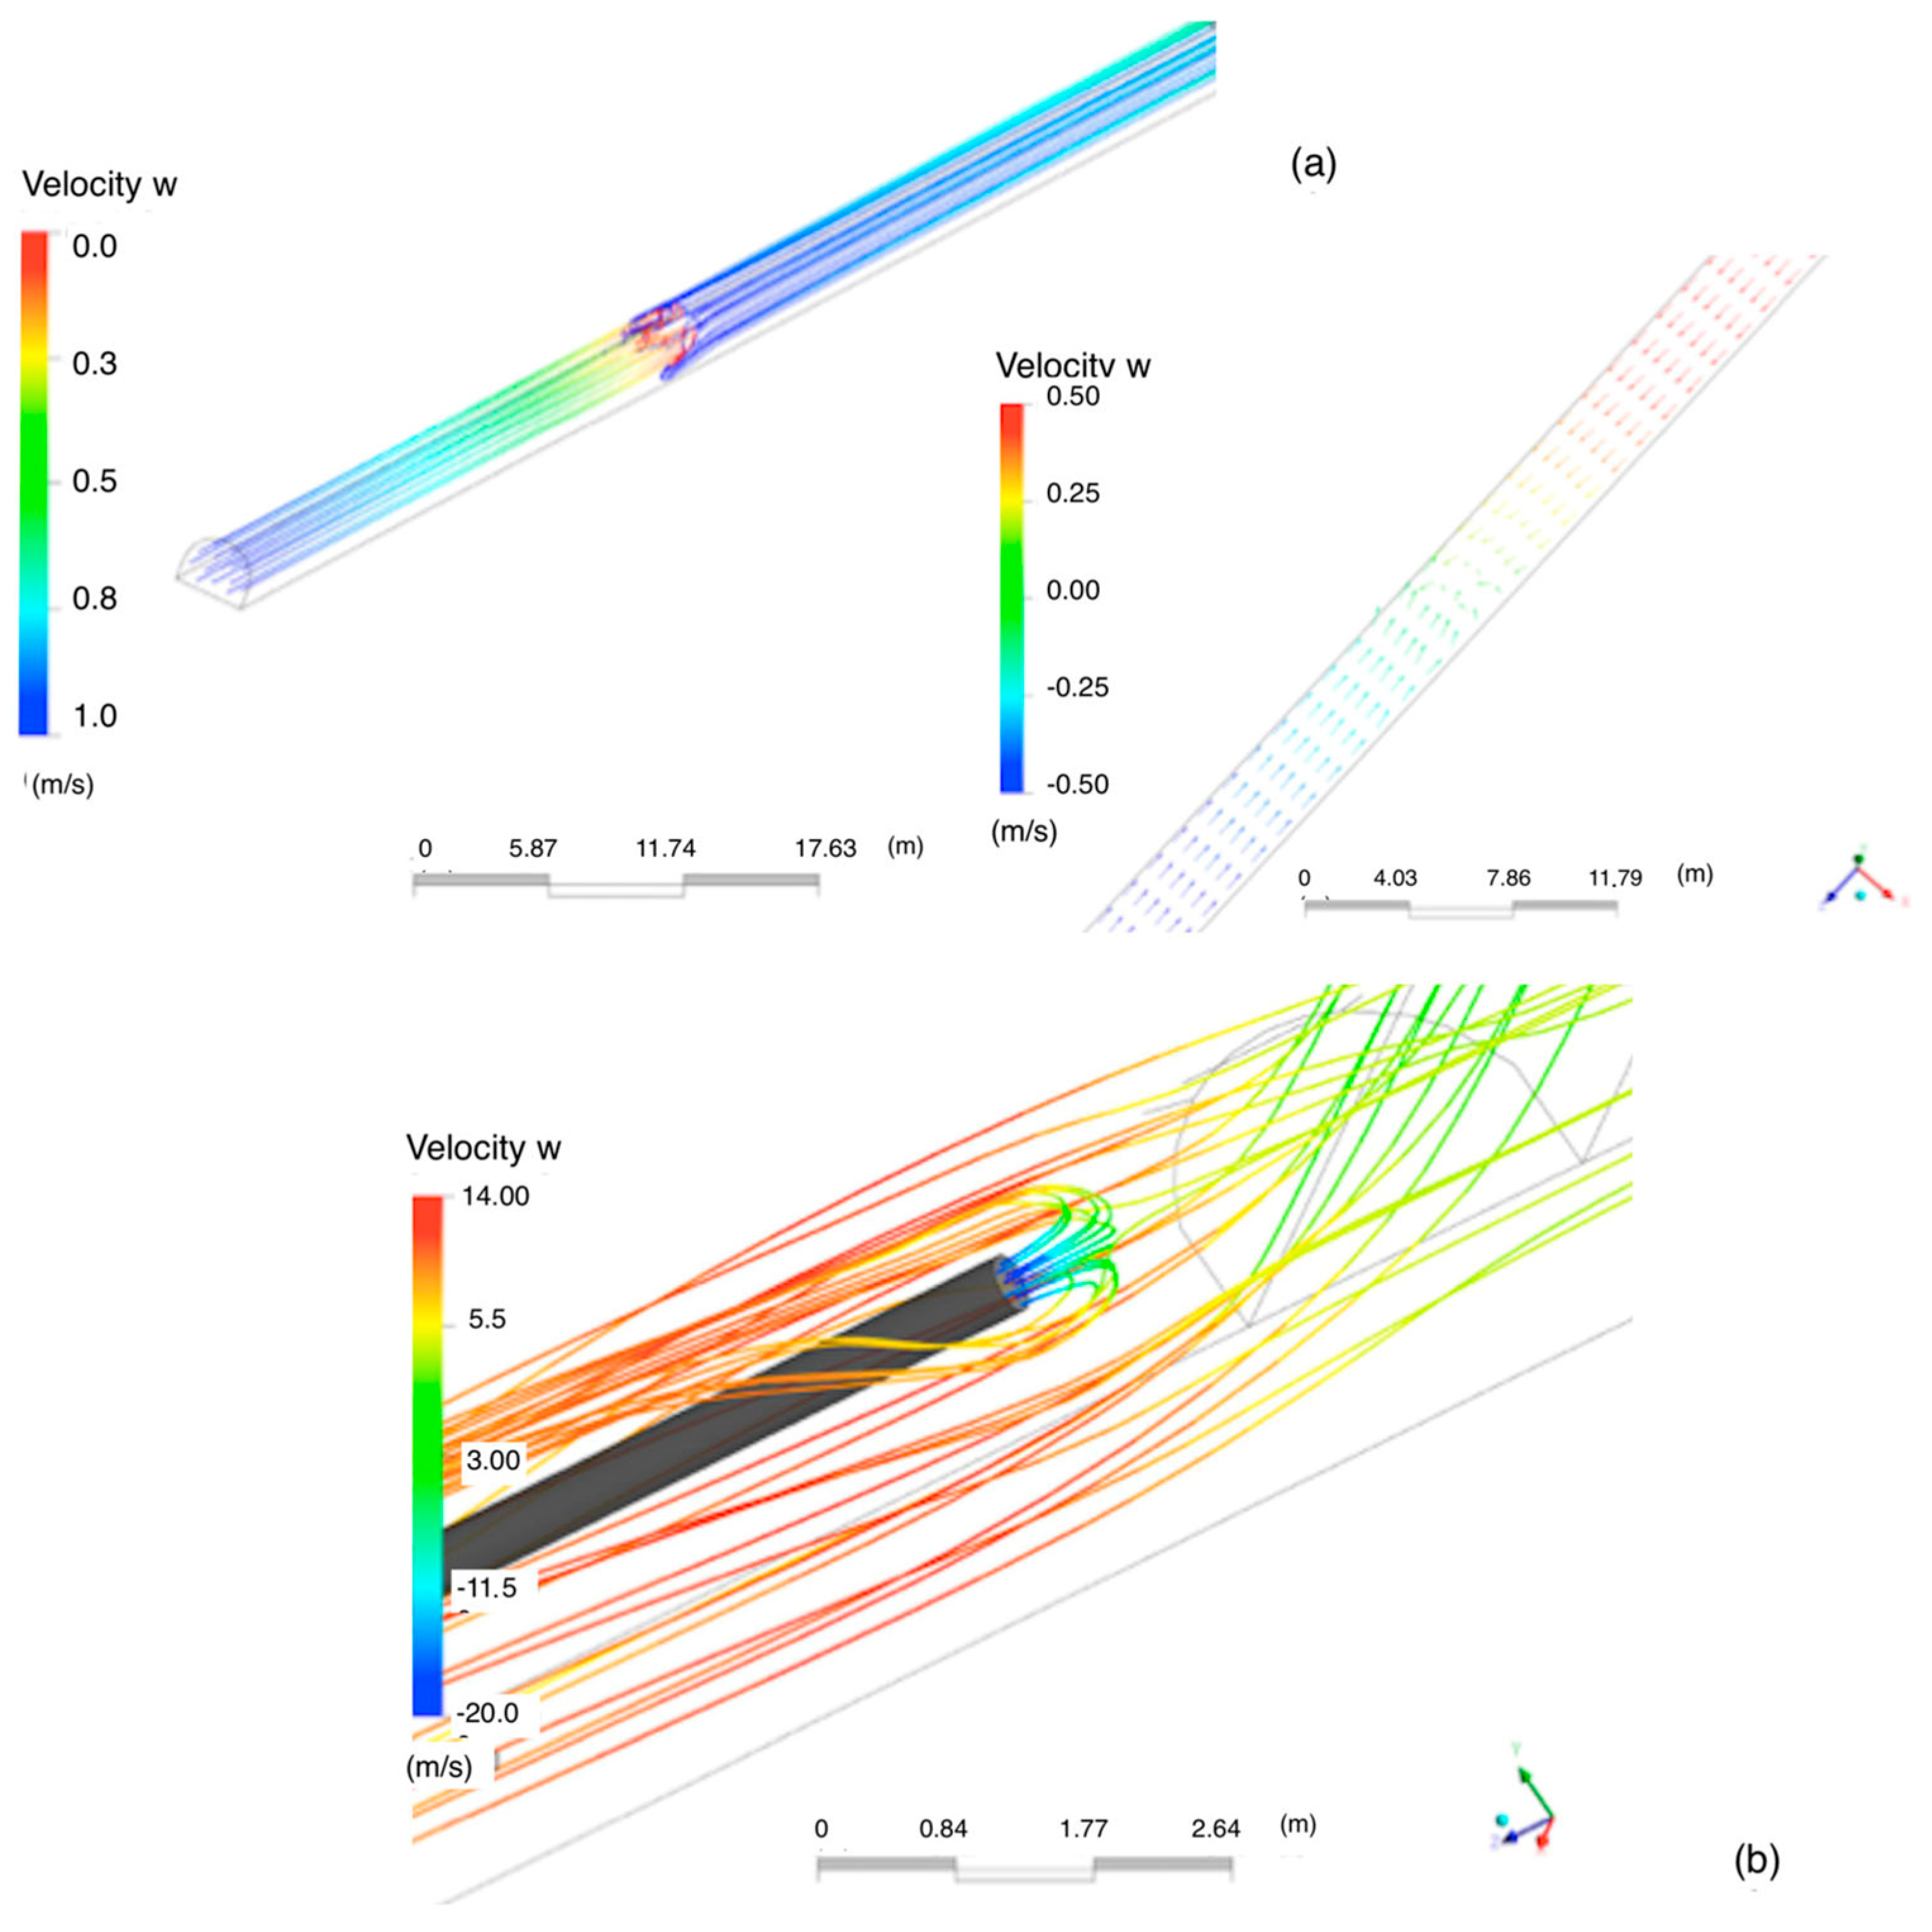
Figure 14a shows the streamlines and velocity vectors at the instant of ventilation reversal. Figure 14b shows the variation in the streamlines (trajectory and velocities) in the air outlet of the auxiliary ventilation duct when air collides with the methane emitted.
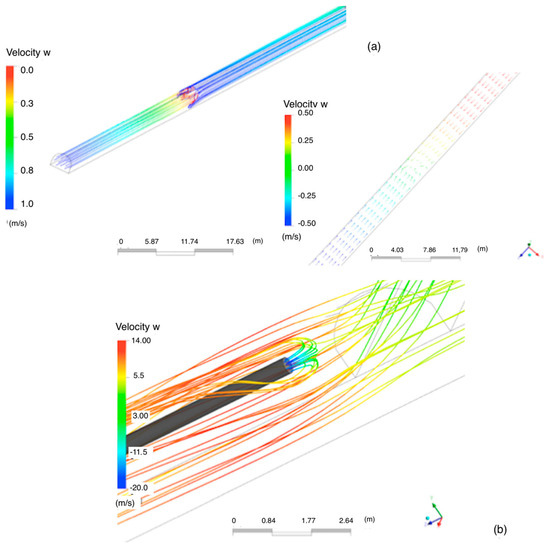
Figure 14.
Streamlines and velocity vectors at the reversal of the main and auxiliary ventilation system. (a) the streamlines and velocity vectors at the instant of ventilation reversal; (b) the streamlines in the air outlet of the auxiliary ventilation duct.
Note that in the location of the auxiliary ventilation fan in cross-section B in this study, if the CH4% is greater than the TLV-C, electric power to the fan is interrupted for safety reasons, which ceases the ventilation reversal and resumes the actuation of the main ventilation for methane emission.
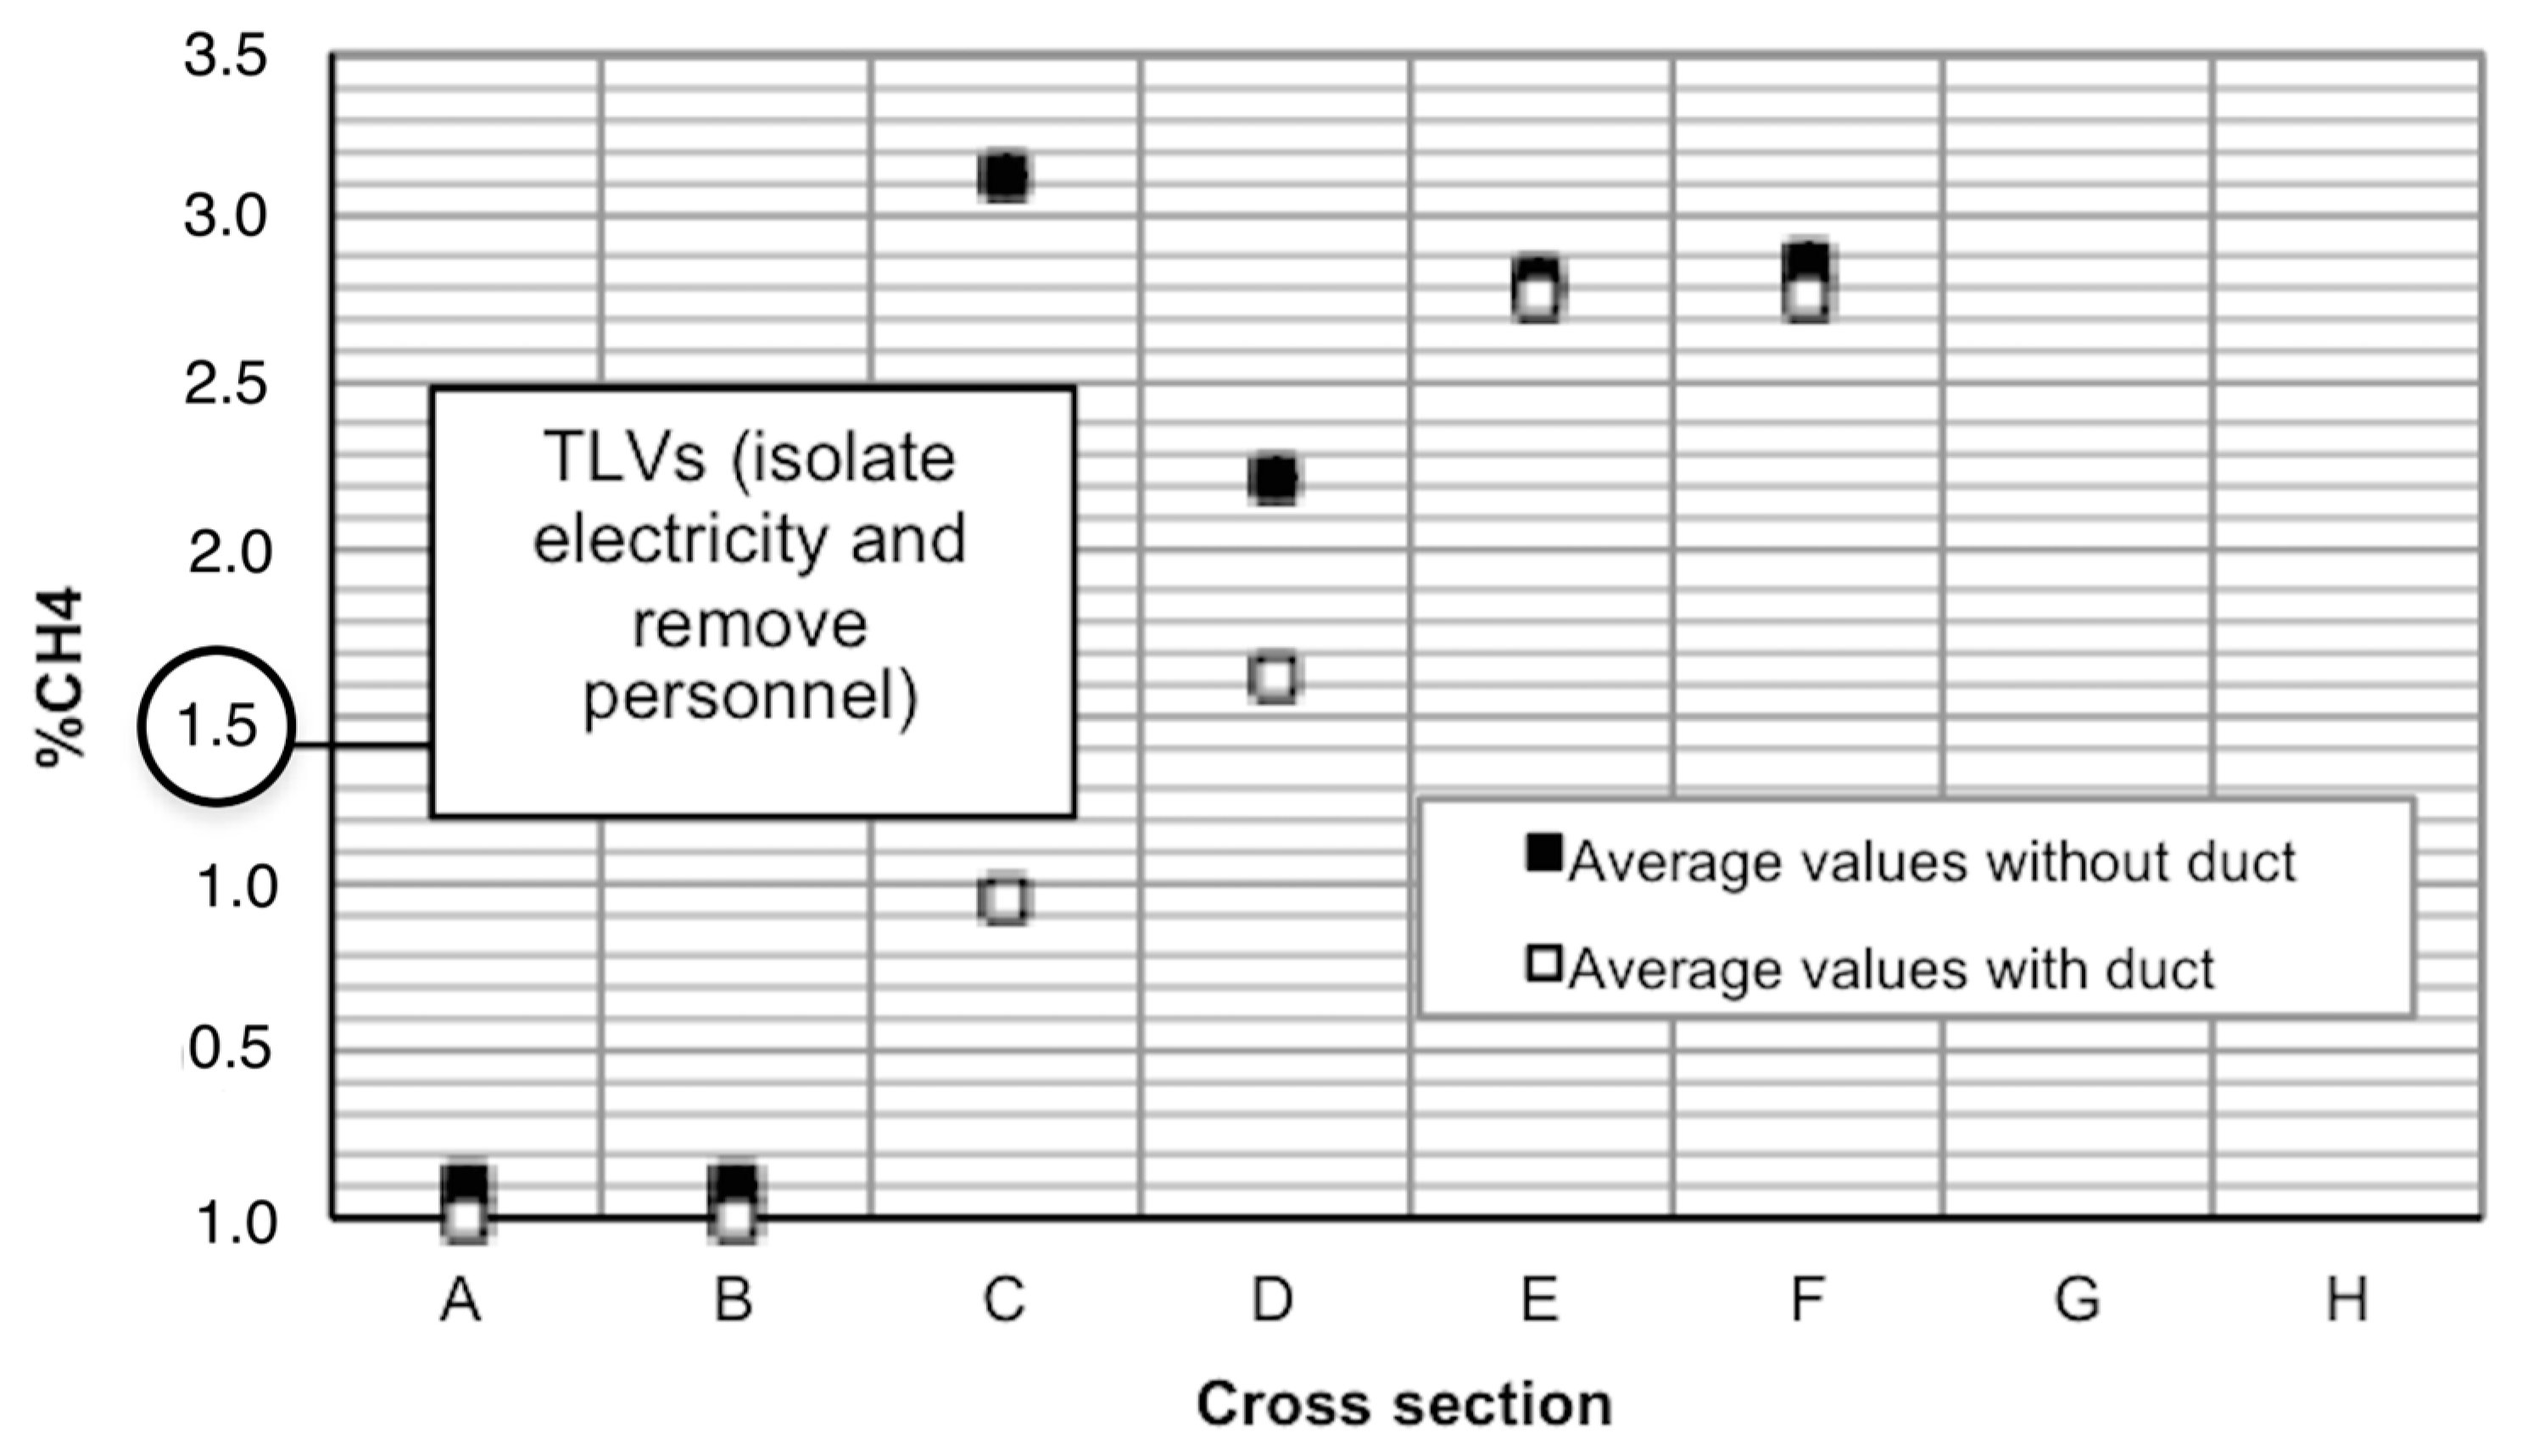
Figure 15 and Figure 16 show the CH4 concentration (maximum and mean) in the cross-sections and instants (450 s) after the reversal of ventilation. The maximum values significantly decreased in all cross-sections, and in cross-sections A and B, the CH4 concentration is 0%. In the other cross-sections, the values are less than 5% but higher than those indicated in the TLV-C. For these values to be lower than 1.5% for CH4, the elapsed time of the dilution of CH4 by the ventilation air should be 637 s.
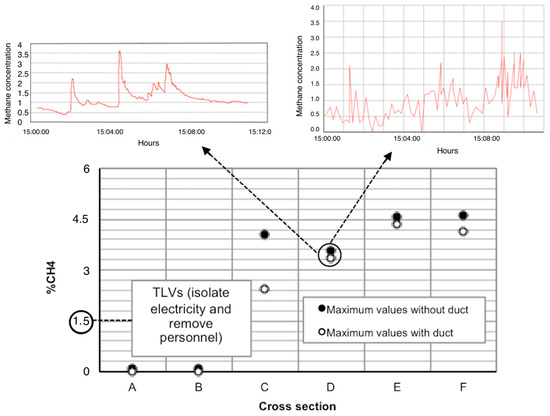
Figure 15.
Effect of the maximum CH4% evolution in the cross-sections.
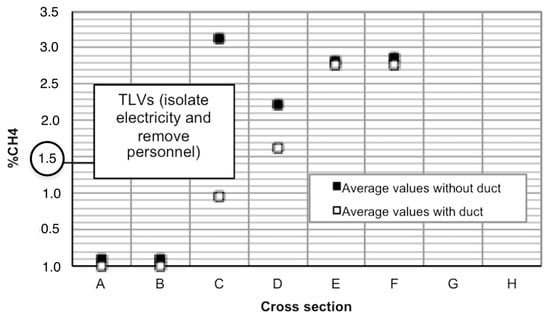
Figure 16.
Effect of the mean CH4% evolution in the cross-sections.
If the cross-sections (A = 1, B = 2, C = 3, D = 4, E = 5 and F = 6) represent the X-axis values, the evolution of CH4 concentration (values on Y axis) can be expressed via Equations (1) and (2) for maximum concentration values in the case of main ventilation without and with an auxiliary fan and via Equations (3) and (4) for mean concentration values in the case of the main ventilation without and with an auxiliary fan.
y = −0.1255 x3 + 1.1965 x2 − 2.1352 x + 0.9367 … (R2 = 0.97)
y = 0.1244 x4 − 1.8028 x3 + 8.7372 x2 − 14.911 x + 7.8617… (R2 = 0.87)
Figure 17 shows the R2 value of the statistical adjustment of the CH4 values measured in the gallery and obtained from the model.

Figure 17.
R2 value of the statistical adjustment of the values measured and obtained from the model. (a) Maximum values without duct; (b) Maximum values with duct.
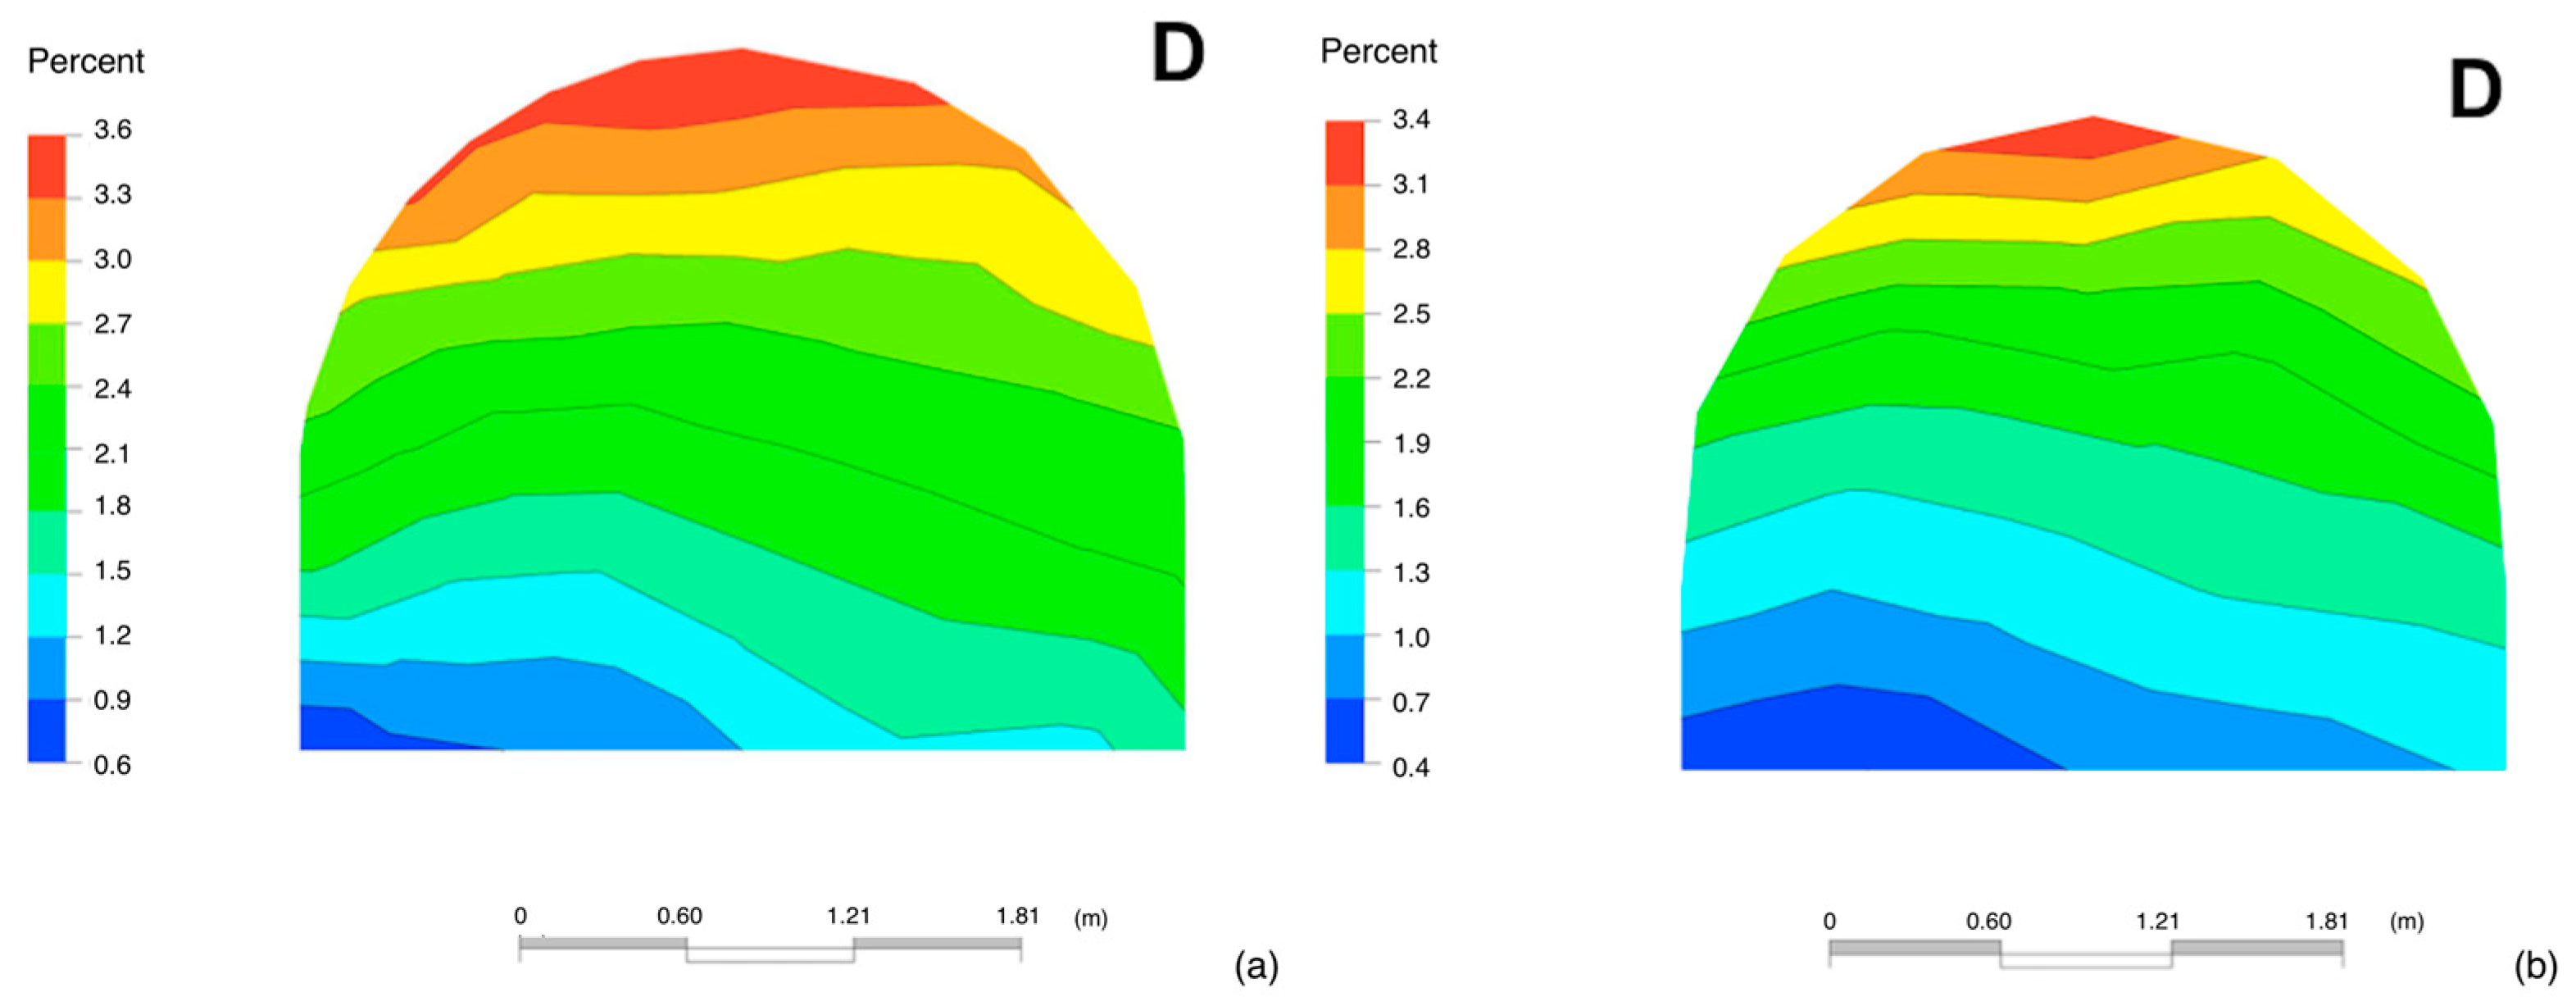
The streamlines in the crosscut zone (velocity in the Z direction) without and with auxiliary ventilation (Figure 18) and the maximum methane concentration values in cross-section D for the case without an auxiliary fan (Figure 19a) and with an auxiliary fan (Figure 19b) are shown as an illustrative example.

Figure 18.
Streamlines in the crosscut zone (velocity in the Z direction). (a) without auxiliary fan; (b) with auxiliary fan.
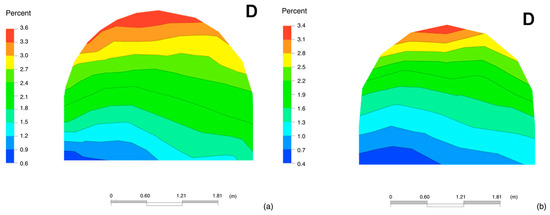
Figure 19.
CH4% in the cross-sections D. (a) without auxiliary ventilation; (b) with auxiliary ventilation.
The effect of superimposing a suitable auxiliary vent on the main vent can create safe zones behind the ventilation reversal area. At a time after methane emission (637 s) and with the effects, the methane concentrations satisfy the TLV.
Additionally, studying the placement of an auxiliary ventilation fan in the correct cross-section can prevent ventilation reversal from ceasing and the main ventilation operation from resuming due to the emission of methane.
Based on these CFD models, other models can be developed for other parameters. These CFD models are powerful tools for analysing methane explosion emission and propagation.
4. Conclusions
In the first moments of methane emission, methane concentrations in all galleries and access points exceed the TLV-C as the methane emitted produces a reversal at 200 m from the main ventilation entrance of the gallery.
When 60 m of auxiliary ventilation is superimposed on the main ventilation in the vicinity of the methane emission source, the ventilation reversal distance is reduced to 42 m from the methane emission source. The methane concentration is reduced to 0% behind 42 m of the gallery. The effect of superimposing an appropriate auxiliary ventilation on the main ventilation can generate safe zones behind the ventilation reversal area.
At a time after methane emission (637 s) and with the effects described in the previous paragraph, methane concentrations satisfy the TLV.
Note that during the placement of the auxiliary ventilation fan in cross-section B in this study, if the CH4% is greater than the TLV-C, electric power to the fan is interrupted as a safety precaution, which ceases ventilation reversal and resumes the actuation of the main ventilation on methane emission.
In this way, methane emissions can be analysed using CFD, since better results can be obtained compared with those obtained via conventional methods or laboratory tests.
If the evolution of methane emissions is known over time through CFD, preventive measures can be taken in each case and therefore future disasters can be avoided.
In addition, CFD demonstrates that adequate auxiliary ventilation superimposed on the main ventilation can generate safe zones downstream of the ventilation inversion zone, which are valid as safe areas for workers.
Based on these CFD models, other models can be developed for other parameters. These CFD models are powerful tools for analysing methane explosion emission and propagation.
Author Contributions
Conceptualisation, J.T. and S.T.; methodology, J.T.; software, S.T.; validation, S.T.; formal analysis, J.T.; investigation, S.T. and J.T.; resources, S.T.; data curation, S.T. and J.T.; writing—original draft preparation, J.T.; writing—review and editing, S.T.; visualisation, S.T.; supervision, S.T. and J.T.; project administration, S.T. and J.T.; funding acquisition, J.T. All authors have read and agreed to the published version of the manuscript.
Funding
This research was funded by Hullera Vasco Leonesa S.A. Company, (Vice-Rectorate for Research: 0039/001).
Data Availability Statement
The data presented in this study are available on request from the corresponding author. The data is not publicly available due to the fact that the data is judicially required by the incident which occurred at the mine.
Acknowledgments
This research was conducted by the Mining and Civil Works Research Group of Oviedo University in collaboration with Hullera Vasco Leonesa S.A. Company (Vice-Rectorate for Research: 0039/001). We thank HVL S.A. Mining Company for the access to their underground mines and for financing this study.
Conflicts of Interest
The authors declare no conflict of interest. The funders had no role in the design of the study; in the collection, analyses, or interpretation of data; in the writing of the manuscript; or in the decision to publish the results.
References
- Zhang, Z.M.; Zhang, Y.G. Investigation into coal gas outburst occurred in Daping Coalmine by using theories of gas-geology. J. China Coal Soc. 2005, 30, 137–140. [Google Scholar]
- Liu, M.J.; Mitri, H.S.; Wei, J.P. Recent trends of coal and gas outburst accidents in China. In Proceedings of the 27th International Conference on Ground Control in Mining, Morgantown, WV, USA, 29–31 July 2008; pp. 66–71. [Google Scholar]
- Mine Safety and Health Administration (MSHA). Report of Investigation: Fatal Underground Mine Explosion April 5, 2010; Alvin L. Brown Program Analyst: Barbourville, KY, USA, 2010; pp. 1–174.
- Russia’s Emergencies Minister. 2015. Available online: https://www.industriall-union.org/9-miners-dead-and-23-missing-after-explosion-in-ukrainian-coal-mine (accessed on 4 March 2015).
- Xu, Y.; Huang, Y.; Ma, G. A review on effects of different factors on gas explosions in underground structures. Undergr. Sp. 2020, 5, 298–314. [Google Scholar] [CrossRef]
- He, S.; Su, L.; Fan, H.; Ren, R. Methane explosion accidents of tunnels in SW China. Geomat. Nat. Haz. Risk 2019, 10, 667–677. [Google Scholar] [CrossRef]
- Smith, P.D. Blast wave transmission along rough-walled tunnels. Int. J. Impact Eng. 1998, 21, 419–432. [Google Scholar] [CrossRef]
- Van den Berg, A.C.; Weerheijm, J. Blast phenomena in urban tunnel systems. J. Loss Prevent. Proc. Ind. 2006, 19, 598–603. [Google Scholar] [CrossRef]
- Lönnermark, A. New Energy Carriers in Tunnels. In Proceedings of the Fourth International Symposium on Tunnel Safety and Security, Frankfurt, Germany, 17–19 March 2010; SP Technical Research Institute of Sweden: Borås, Sweden, 2010. [Google Scholar]
- Weerheijm, J. Explosion risks and consequences for tunnels. In Proceedings of the ISTSS 6th International Symposium on Tunnel Safety and Security, Marseille, France, 12–14 March 2014; SP Technical Research Institute of Sweden: Borås, Sweden, 2014. [Google Scholar]
- Malmtorp, J. Safety in road tunnels. Safety target proposal. In Proceedings of the ISTSS 7th International Symposium on Tunnel Safety and Security, Montreal, QC, Canada, 16–18 March 2016; SP Technical Research Institute of Sweden: Borås, Sweden, 2016. [Google Scholar]
- Beamish, B.; Crosdale, P.J. Instantaneous outbursts in underground coal mines: An overview and association with coal type. Int. J. Coal Geol. 1998, 35, 27–55. [Google Scholar] [CrossRef]
- Zhang, R.; Nie, B.S.; He, H.Q. Different gas explosion mechanisms and explosion suppression techniques. Procedia Eng. 2011, 26, 1467–1472. [Google Scholar]
- Sanmiquel, L.; Bascompta, M.; Anticoi, H.F. Analysis of a historical accident in a Spanish coal mine. Int. J. Environ. Res. Public Health 2019, 16, 3615. [Google Scholar] [CrossRef] [PubMed]
- Kissel, F.N.; Wallhagen, R.E. Some new approaches to improve ventilation of the working face. In Proceedings of the Fourth Symposium on Surface Mining and Reclamation: NCA/BCR Coal Conference and Expo III, Louisville, KY, USA, 19–21 October 1976; National Coal Association: Lexington, KY, USA, 1976; pp. 325–338. [Google Scholar]
- Wala, A.; Jacob, J.; Brown, J.; Huang, G. New approaches to mine-face ventilation. Min. Eng. 2003, 55, 25–30. [Google Scholar]
- Wala, A.M.; Vytla, S.; Taylor, C.D.; Huang, G. Mine face ventilation: A comparison of CFD results against benchmark experiments for the CFD code validation. Min. Eng. 2007, 59, 49–55. [Google Scholar]
- Demirkan, D.C.; Duzgun, H.S.; Juganda, A.; Brune, J.; Bogin, G. Real-Time Methane Prediction in Underground Longwall Coal Mining Using AI. Energies 2022, 15, 6486. [Google Scholar] [CrossRef]
- Torno, S.; Toraño, J. On the prediction of toxic fumes from underground blasting operations and dilution ventilation. conventional and numerical models. Tunn. Undergr. Space Technol. 2020, 96, 103194. [Google Scholar] [CrossRef]
- Wang, Z.; Ren, T.; Ma, L.; Zhang, J. Investigations of Ventilation Airflow Characteristics on a Longwall Face. A Computational Approach Energies. Energies 2018, 11, 1564. [Google Scholar] [CrossRef]
- Nan, C.; Ma, J.; Luo, Z.; Zheng, S.; Wang, Z. Numerical study on the mean velocity distribution law of air backflow and the effective interaction length of airflow in forced ventilated tunnels. Tunn. Undergr. Space Technol. 2015, 46, 104–110. [Google Scholar] [CrossRef]
- Ming, L.; Aminossadati, M.S.; Wu, C. Numerical simulation of air ventilation in super-large underground developments. Tunn. Undergr. Space Technol. 2016, 52, 38–43. [Google Scholar]
- Shao, S.; Yang, X.; Zhou, J. Numerical analysis of different ventilation schemes during the construction process of inclined tunnel groups at the Changheba Hydropower Station, China. Tunn. Undergr. Space Technol. 2016, 59, 157–169. [Google Scholar] [CrossRef]
- Fernánez-Alaiz, F.; Castañón, A.M.; Gómez-Fernández, F.; Bernardo-Sánchez, A.; Bascompta, M. Analysis of the Fire Propagation in a Sublevel Coal Mine. Energies 2020, 13, 3754. [Google Scholar] [CrossRef]
- ANSYS Fluent Theory Guide; ANSYS Inc.: Canonsburg, PA, USA, 2021; pp. 1–5.
- Ansys CFX-Solver, Release 12.0: Modelling. Theory; ANSYS Inc.: Canonsburg, PA, USA, 2009; pp. 241–262.
- Ansys ICEMCFD 10.0, Tutorial Manual. Tetra Meshing; ANSYS Inc.: Canonsburg, PA, USA, 2008; pp. 309–310.
- Appendices A: Threshold limit values and biological exposure indices for 1989–1990. In Industrial Ventilation. A Manual of Recommended Practice, 23rd ed.; ACGIH: Cincinnati, OH, USA, 1998.
- NIOSH. Pocket Guide to Chemical Hazards; National Institute for Occupational Safety and Health, US Department of Health and Human Services: Washington, DC, USA, 1987.
Disclaimer/Publisher’s Note: The statements, opinions and data contained in all publications are solely those of the individual author(s) and contributor(s) and not of MDPI and/or the editor(s). MDPI and/or the editor(s) disclaim responsibility for any injury to people or property resulting from any ideas, methods, instructions or products referred to in the content. |
© 2023 by the authors. Licensee MDPI, Basel, Switzerland. This article is an open access article distributed under the terms and conditions of the Creative Commons Attribution (CC BY) license (https://creativecommons.org/licenses/by/4.0/).

