Article

Voltage Stability Assessment of a Campus DC Microgrid Implemented in Korea as a Blockchain-Based Power Transaction Testbed

1
Department of Electrical and Control Engineering, Mokpo National University, Mokpo 58554, Republic of Korea
2
Division of Electrical, Electronic and Control Engineering, Kongju National University, Cheonan-si 31080, Republic of Korea
3
Department of Electrical and Control Engineering, Cheongju University, Cheongju-si 28503, Republic of Korea
4
Power Grid Research Division, Korea Electrotechnology Research Institute (KERI), Changwon 51543, Republic of Korea
5
Chum-Dan Industry-Academia Campus, Attached Institute of Chosun University, Gwangju 61012, Republic of Korea
*
Author to whom correspondence should be addressed.
Energies 2023, 16(21), 7297; https://doi.org/10.3390/en16217297
Submission received: 9 October 2023 / Revised: 22 October 2023 / Accepted: 24 October 2023 / Published: 27 October 2023
(This article belongs to the Special Issue Modeling, Optimization, and Control in Smart Grids)

Abstract

:
Recently, the generalization of P2P (peer-to-peer) technology with enhanced security due to blockchain technology and the expansion of renewable energy-based distributed energy resources have led to blockchain technology being applied in power transactions, thus giving the potential to become a new platform for DC microgrid operation. Meanwhile, the voltage of a DC microgrid represents the balance of energy supply and demand and also serves as a stability index. The balance is represented as a steady state; the stability is represented during and after events. This paper examines the stability of the DC microgrid built on a university campus in Korea and, in particular, the blockchain technology-based power transactions performed in the DC microgrid. The test is based on the pre-planned transaction schedule applied in the DC microgrid. The transaction schedule has used day-ahead and real-time bidding data. Although many technologies are included in the project, this paper focuses on the voltage stability of the DC microgrid. In addition, the DC protection is applied and evaluated. To consider general DC protection, the DC breaker was simplified with several IGBTs, diodes, capacitors, and arrestors and was designed to interrupt the fault current within five milliseconds. The stability was evaluated using a PSCAD/EMTDCTM.

1. Introduction

1.1. Motivation and Incitement

Since the UN General Assembly in 2015, renewable-based distributed energy resources (DERs) have been expanding globally to achieve the seventh sustainable development goal (SDG) related to energy [1,2]. This expansion has led to the increase of microgrids, which can efficiently and integrally manage renewable-based DERs, with the installed capacity of confirmed microgrids reaching 19,575 MW as of 2018 [3].
Meanwhile, a microgrid consisting of a large number of renewable-based DERs must be operated flexibly in consideration of intermittent energy fluctuations. For this purpose, an appropriate control strategy, such as interconnection with the existing utility grid or island mode, must be applied [4,5]. In particular, the voltage stability of the microgrid under such a control strategy is of utmost importance, and this is due to the following reasons. First, from the perspective of the AC network, the microgrid acts as a negative load and supplies power to the grid under certain circumstances. When these microgrids are small, their voltage and frequency are regulated by synchronous generators, so they do not significantly impact grid stability. However, when large-scale and multiple microgrids are integrated into the utility grid, excessive power may be injected or consumed into the AC network, which may reduce the reliability of voltage stability, frequency stability, etc., of the existing power grid. In addition, voltage instability within a microgrid leads to an imbalance in energy demand and supply, so stable independent operation cannot be performed. Therefore, a microgrid must have an appropriate control architecture that considers the components of the microgrid, and voltage stability must be guaranteed [6].

1.2. Literature Review

Microgrids are broadly classified into three categories based on system architecture and voltage characteristics [7]: AC microgrid, DC microgrid, and Hybrid AC/DC microgrid. Among these microgrids, DC microgrid is gaining attention because most renewable-based DERs currently produce DC power, and the utilization of DC loads such as EV chargers has increased [8]. In addition, unlike a conventional AC microgrid, a DC microgrid does not need to fulfill all the considerations such as synchronization, reactive power, and frequency control, and the stability judgment mainly depends on the DC bus voltage. Furthermore, since a DC microgrid does not require AC–DC or DC–AC conversion stages, it has the advantage of overall higher system efficiency compared to an AC microgrid [9].
Along with the electrical advantages of DC of the previously described DC microgrid, the development of communication protocols has promoted the development of DC microgrids by proposing various control architectures for DC microgrids. The main examples of these control architectures are centralized, distributed, hierarchical, and P2P, each of which has the following characteristics, advantages, and disadvantages [10]. First, centralized control enhances the reliability and stability of grid operation as it acquires parameters of DERs from all nodes and adjusts energy supply and demand balance [11]. However, it has a low response speed because it calculates and delivers the command values to the DERs after considering all variables, and it has the potential for network collapse in the event of a major failure [12]. In contrast to centralized control, distributed control allows for rapid energy management because each DER’s local agents (LAs) communicate with each other [13,14]. However, a controller with high complexity is required to perform proper interactions between LAs [15]. Hierarchical control, an alternative to distributed control, adjusts the energy supply and demand balance of the DC microgrid through hierarchical control [16]. This mechanism is as follows. For example, a high-level controller reflects data from other LAs (e.g., output variation of each DER) and delivers the results to a low-level controller, which finally controls the control target of the DER. This hierarchical control can improve the overall efficiency of the DC microgrid, but it requires data transmission delays between each layer and complex control algorithms [17,18]. P2P control is a fully distributed system that allows a single node to communicate with all other nodes through a software platform [19]. In particular, it acts as an operation method for energy trading within a DC microgrid and has the advantage that real-time power trading can be performed through fast response speed. However, high security is required because the responsible entity for microgrid operation is unclear, and some nodes can access and influence the whole [20]. The high-security level required by P2P control is gradually being achieved due to the development of blockchain technology, which is attributed to the tamper-proof nature of blockchain technology [21]. This is expected to improve the reliability of power transactions, increasing the participation of prosumers and accelerating the activation and penetration of DC microgrids.

1.3. Contribution and Paper Organization

The main objective of the research presented in this paper is to examine the DC bus voltage stability, which is a prerequisite for stable power transactions, before performing blockchain-based power transactions in a DC microgrid testbed built on a university campus in Korea. Due to the different time scales of power transactions and stability assessment, voltage stability was examined by forming major scenarios as test cases resulted from the outcomes of blockchain-based power transactions conducted according to a pre-planned transaction schedule. In detail, compliance with the DC microgrid’s grid code (by referring to AC grid code ± 5%) is judged by the steady-state voltage reflecting the power transaction data. Voltage stability is examined by adding various events to the transactions. To investigate the voltage stability before and after a proper trip of the fault, a DC breaker was applied, which was generalized by using only essential components such as IGBTs, diodes, capacitors, and arrestors. By reflecting the general requirements of a DC breaker, the fault current was interrupted within 5 ms [22].
To review the voltage stability of the DC microgrid in this paper, the transaction schedule is set up by considering the following.
  • The transaction schedule maximizes the sales revenue per time period according to the participant bids and maximizes the efficiency of power trading, reflecting the constraint of the DC microgrid and the flexibility of the supply and demand balance.
This paper is organized as follows. First, Section 2 introduces the campus DC microgrid demonstration complex in Korea. Then, Section 3 debriefs the transaction schedule to be applied to the DC microgrid operation. Next, in Section 4, the voltage stability of the DC microgrid is examined both before and after applying generalized DC breakers. Finally, the conclusion is given in Section 5.

2. The Campus DC Microgrid Implemented in Korea

The campus DC microgrid implemented in Korea as a blockchain-based power transaction testbed is organized as shown in Figure 1. The AC network is on the left side of the power conditioning systems (PCSs), and the other one is the DC community network. where PCSs #1–3 are responsible for supplying building load (BL) power, and PCS #4 is responsible for BL power supply, demand response (DR), and during late night hours, energy storage systems (ESSs) charging.
The AC network consists of an existing 0.38/0.34 kV transformer on each branch and a newly installed 0.34/0.38 kV transformer to match the voltage to the PCS. The secondary neutral of the PCS connection transformer is not grounded to prevent DC short-circuit current from the mono-pole DC microgrid.
The DC community network consists of 3 PVs, 2 ESSs, 2 EV chargers, and V2Gs, all interconnected to a single DC main bus. Power balancing in the frequency of power transactions is conducted by the bidirectional DC–DC converter of ESS #1. Balance in real time is maintained by the bidirectional DC–DC converter of ESS #2, which controls the DC bus voltage to 0.75 kV. The AC and DC underground cables connecting the pieces of equipment to the DC main bus were modeled using a frequency-dependent model to ensure high accuracy over a wide frequency band.

Unit Configuration and Control

To assess the DC bus voltage stability in general conditions, the detailed and small effect of a specific device is excluded by simplifying the power supply and load into active and passive elements. PVs, V2Gs, ESSs, and EV chargers are composed of current sources and diodes, current sources, voltage sources, and resistors, respectively. The PCS is composed of a general grid-connected inverter, and its control is performed by a generic PQ controller, as shown in Figure 2 [23]. The PQ controller consists of an outer loop for power and an inner loop for current, where the control variables are on the d-q axis synchronized to the grid voltage via a phase-locked loop (PLL).
P and Q of the grid-connected inverter are controlled as the result of the current control. The outputs of the outer loop are used for id,ref and iq,ref, which in turn derive vsd and vsq through the inner loop. The vsd and vsq are then inversely transformed to the abc axis and supply the instantaneous three-phase voltages through PWM that result in the controlled P and Q. In other words, the difference between the inverter and PCC voltages determines the real and reactive powers, where the current inner loop is implemented based on Equation (1).
d d t i d i q = 0 ω ω 0 i d i q + 1 L v d + Δ v d v q + Δ v q
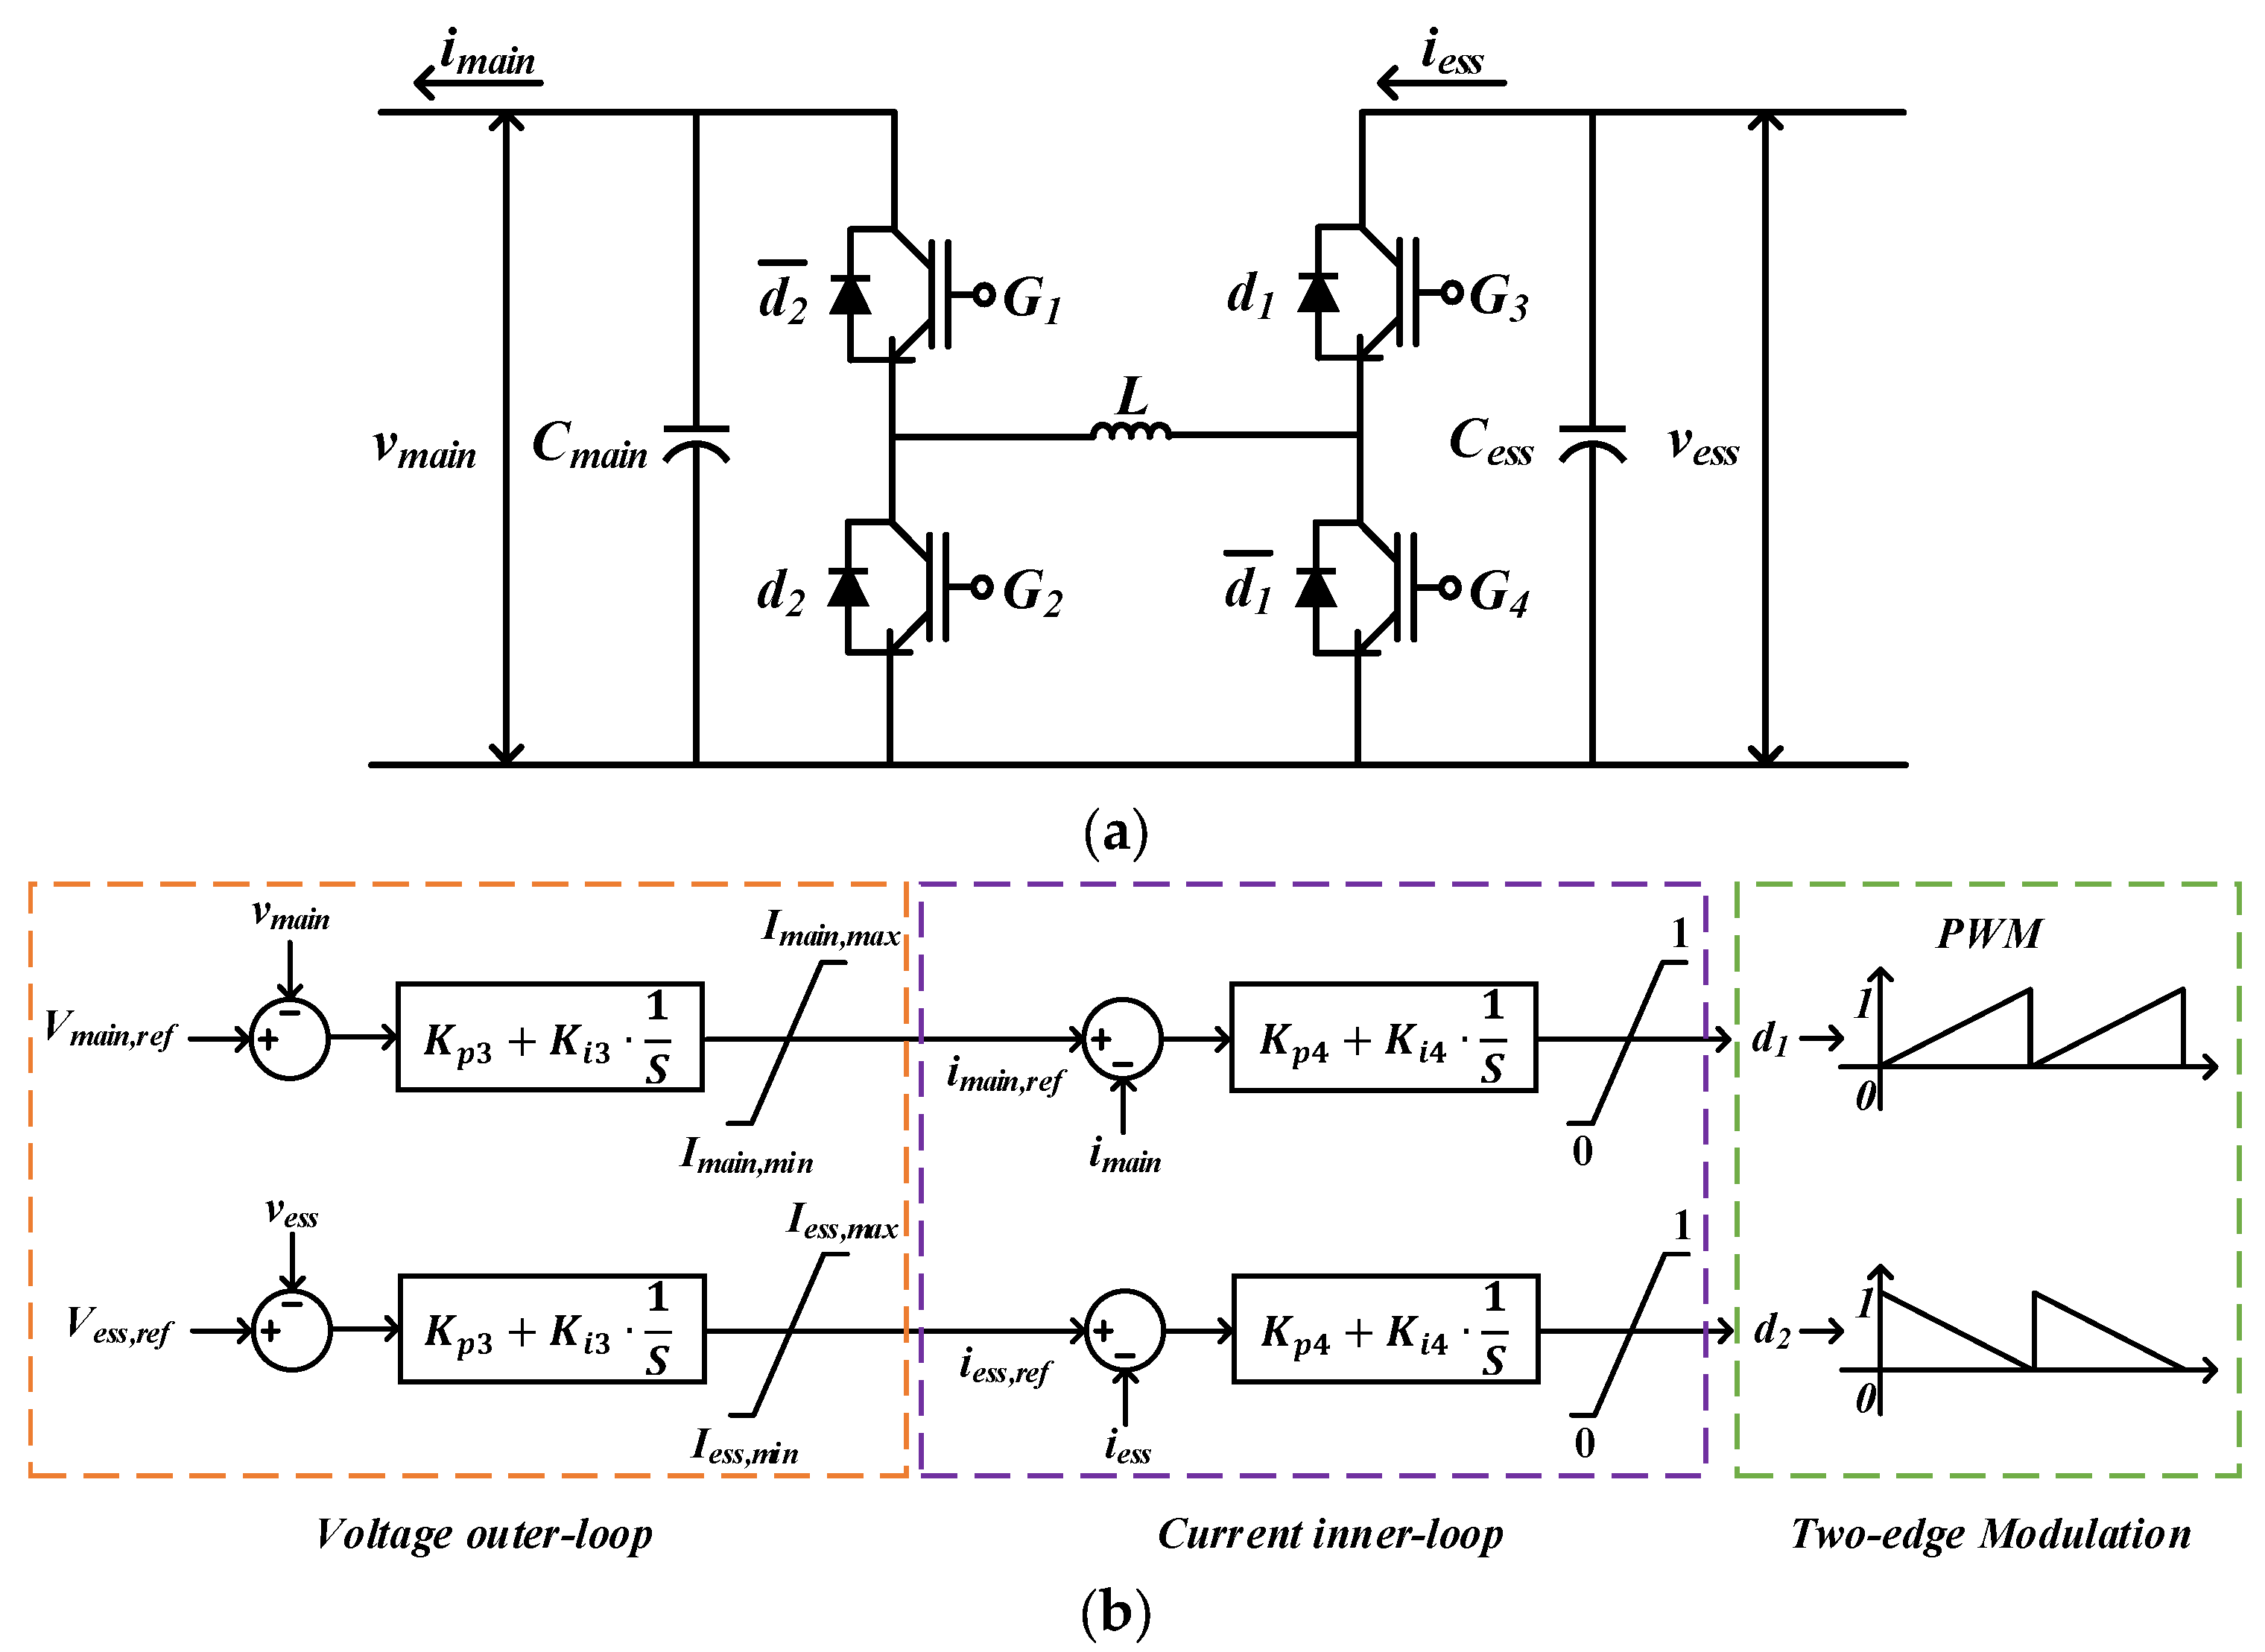
The bidirectional DC–DC converter used in this DC microgrid testbed consists of 25 kW four-switch buck-boost converter (FSBB) modules paralleled to each other, as shown in Figure 3a. Only converter #9 has two 125 kW FSBB modules and controls the DC bus voltage. The same parameter values are set to both 125 kW and 25 kW FSBB modules. Each module is assigned 1/n of the total value of the output command and evenly shares the power.
The FSBB module is controlled using two duty cycles [24]. If d1 and d2 are set to the duty cycles for G3 and G2, respectively, the voltage gain is derived as Equation (2) [25].
V m a i n V e s s = d 1 1 d 2
Also, the input and output currents must be within the rated current range according to this voltage regulation. Therefore, the voltage controller of the FSBB can be configured, as shown in Figure 3b. On the other hand, this control method uses two duties ranging from 0 to 1, which results in overlapping switching periods in a buck or boost mode. During this overlapping period, the larger the charge–discharge current of the inductor, the higher the power loss, so two-edge modulation (TEM) is applied to minimize the inductor current [26].
The FSBB modules must be properly controlled without interfering with each other. Therefore, the controllers of the bidirectional DC–DC converters are configured as follows. To prevent control hunting between modules, converter #9, which controls the DC bus voltage, is set to operate identically for both modules using one voltage controller. The load side of converters #5 and #6 is set as a voltage control converter to ensure that the V2G connection voltage is maintained at the rated voltage (0.75 kV). Among the multiple modules of converter #1 and #3, one module controls the voltage of the DC charger (0.55 kV), and the input and output power of the voltage-control module serves as a power reference for the remaining FSBB modules so that the same power is distributed among the modules. The remaining converters are set to control their power according to the output command. The topology parameters of PCSs and bidirectional DC–DC converters and the control variables of controllers are shown in Table A1 (Appendix A).

3. Transaction Schedule

The blockchain-based DC community network’s power trading operation requires efficient coordination of power transactions in sudden climate changes and other factors, all while maintaining an energy supply and demand balance. Therefore, a transaction schedule is needed to support this.
In this viewpoint, the DC microgrid testbed is now in the process of securing sufficient data by testing and operating the transaction schedule in a limited range to verify stability before full-scale operation. Therefore, this paper assesses the stability based on the data obtained from the grid test operation. The simulation results reflect the corresponding transaction schedule in the most severe conditions. Based on this, the transaction schedule is continuously updated by improving vulnerabilities. The stability evaluation proceeds through a precise system simulation of a very short time compared to power trading, so it reflects the result of the transaction schedule at a specific transaction time, not the whole transaction. The following introduces the schematic transaction schedule in the trading times used in the grid simulation.
  • The output metering of each DER is measured through the metering point Mn, as shown in Figure 4 (n: 1, ⋯, 15).
  • The operating capacity of the ESSs is set to 70% (maximum charge 80% – minimum charge 10%) of the installed capacity (750 kWh + 273 kWh), and the capacity sharing of the ESSs is allocated as 73.3% for ESS #1 and 26.7% for ESS #2 after scheduling. Accordingly, the maximum output of ESS #1 is 91 kW.
  • The hourly transaction price is based on the existing power provider’s tariff, which is reflected in the real-time power transaction price of the day.
  • Bidding transactions are excluded during the nighttime hours (22:00~23:00), including the late-night hours (22:00~08:00). During the nighttime hours, the remaining power of the ESSs is analyzed to set the charging and transaction schedule of the ESSs for the next day.
  • The transaction schedule here is the transaction schedule in independent operation, excluding uncertainty factors such as faults and DR.
The real-time supply and demand balance of power transactions is shown in Equation (3). The left and right terms refer to the total amount of purchased and supplied power (kWh) at time t, and each of the remaining elements is defined as follows.
t c P B L , t + t c P E V , t + t c P G 2 V , t = t c P P V , t + t c P E S S , t + t c P V 2 G , t
  • t: trading time in m minutes per day (total daily transaction data: 60/m × 24).
  • b, c: bidding, transaction contract.
  • P B L ,   P E V ,   P G 2 V : power of BLs, EVs, G2Vs, PVs, ESSs, V2Gs.
  • P P V ,   P E S S ,   P V 2 G : supply(sales) power of PVs, ESSs, V2Gs.
Considering the electrical distance and flexibility of supply and demand balance, the output of PVs is set to priority contract to BLs, which is the same as Equation (4).
c 1 P B L , t = c 1 P P V , t = m i n b P B L , t ,   b P P V , t
The remaining PV power after trading is supplied to the community to trade with other prosumers (EVs, V2Gs, ESSs, etc.), which is equivalent to Equation (5).
c 2 P P V , t = b P P V , t c 1 P P V , t
Similarly, EV chargers and G2Vs are set to be priority contracts through ESSs, where the daily supply capacity of ESSs must be greater than the daily charging capacity of EV charges and G2Vs (Equation (6)).
t c P E V , t + t c P G 2 V , t = t c 1 P E S S , t t c P E S S , t t c P m a x , E S S , t
If the BLs’ power needs are still large after the preferential contracting of PVs and ESSs described above, the BLs will bid through the community to trade the shortfall. The remaining amount of power is shown in Equation (7).
b 1 P B L , t = b P B L , t c 1 P B L , t
Meanwhile, ESSs purchase power from the grid operator during the lowest tariff periods (overnight hours after 22:00), store it, and sell it during higher tariff periods. Here, the power sales revenue of ESSs, excluding priority contracts, can be maximized through bidding, especially by selling power to BLs during peak load times. Therefore, in order to maximize sales revenue, the residual power requirement of BLs ( b 1 P B L , t ) should be greater than the power of PVs and ESSs after the priority contract ( c 2 P P V , t + t c 2 P E S S , t ). However, if there is a shortage of supplied power compared to the purchase bid, the trade volume is allocated by applying an adjustment factor ( a d j t ), which is the supply divided by the bid amount (Equation (9)). Therefore, by reflecting this and adjusting the sales income at this time ( m r t ), the sales income maximization of ESSs is derived as shown in Equation (10).
t c 2 P E S S , t = t c P E S S , t t c 1 P E S S , t
t c 2 P B L , t = t c 2 P E S S , t + t c 2 P P V , t = a d j t · t b P B L , t t c 1 P B L , t
M a x i m i z i n g   R e v e n u e   f r o m   E S S   S a l e s = m r t t c 2 P E S S , t
Finally, the prosumer’s transaction power amount by time of day is equal to Equations (11)(14).
b P B L , t = c 1 P B L , t + c 2 P B L , t
b P P V , t = c 1 P P V , t + c 2 P P V , t
b P E V , t + b P G 2 V , t = c P E V , t + c P G 2 V , t
c P E S S , t = c 1 P E S S , t + c 2 P E S S , t

4. Voltage Stability Assessment of the Campus DC Microgrid Testbed

4.1. Grid Test Operation

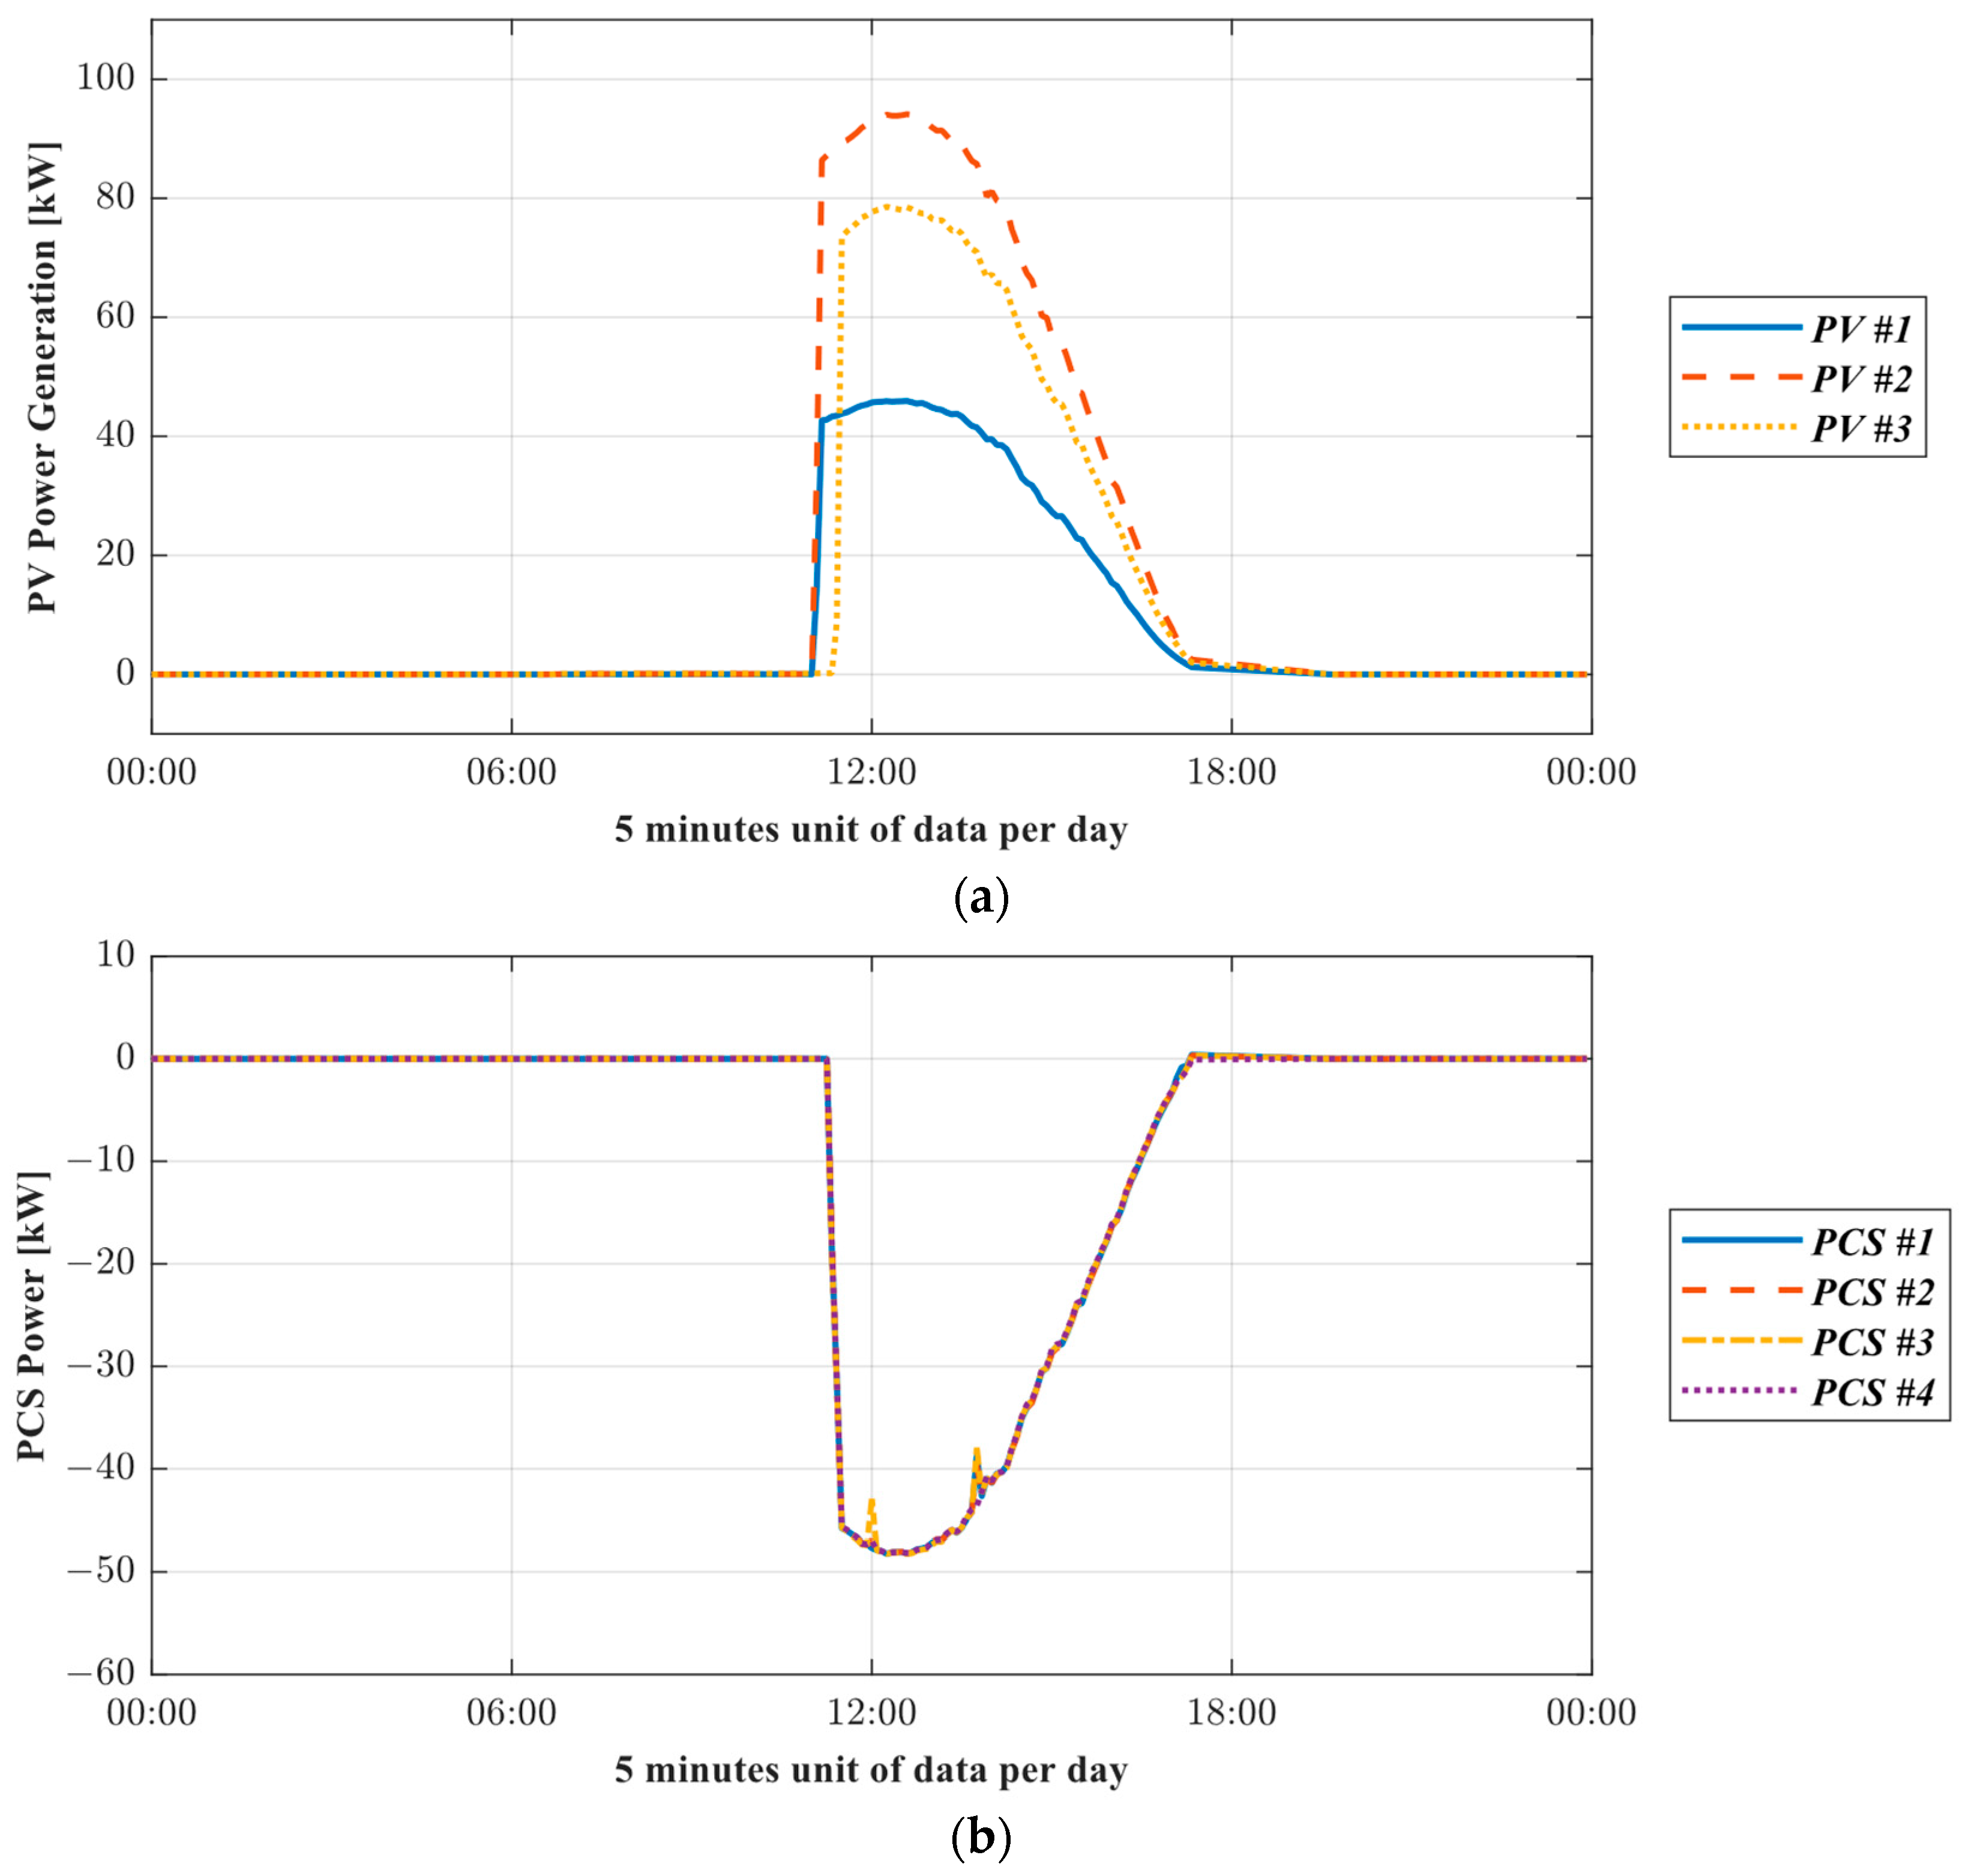
The voltage stability is assessed under the following conditions to ensure whether the voltage complies with the grid code without power trading: (1) distribute the power generated by the PVs evenly and set it as the output command of the PCS; (2) converter #9 controls the voltage of the DC main bus (0.75 kV) and reflects the impedance difference of 5% between modules to reflect the effect of the error between devices; (3) set the output command value of converter #10 to zero. The acquired real data are shown in Figure 5. The data at the maximum power generation point of PVs (12 h:15 m) are extracted as Table A2 (Appendix B) and applied to the DC microgrid testbed, and the results are shown in Figure 6. ESS #2 absorbed 5 kW of surplus power, so the DC microgrid maintained a supply and demand balance, and thus, the voltage of the DC main bus satisfied the grid code. The output values of PVs and PCSs are also consistent.

4.2. DC Breaker

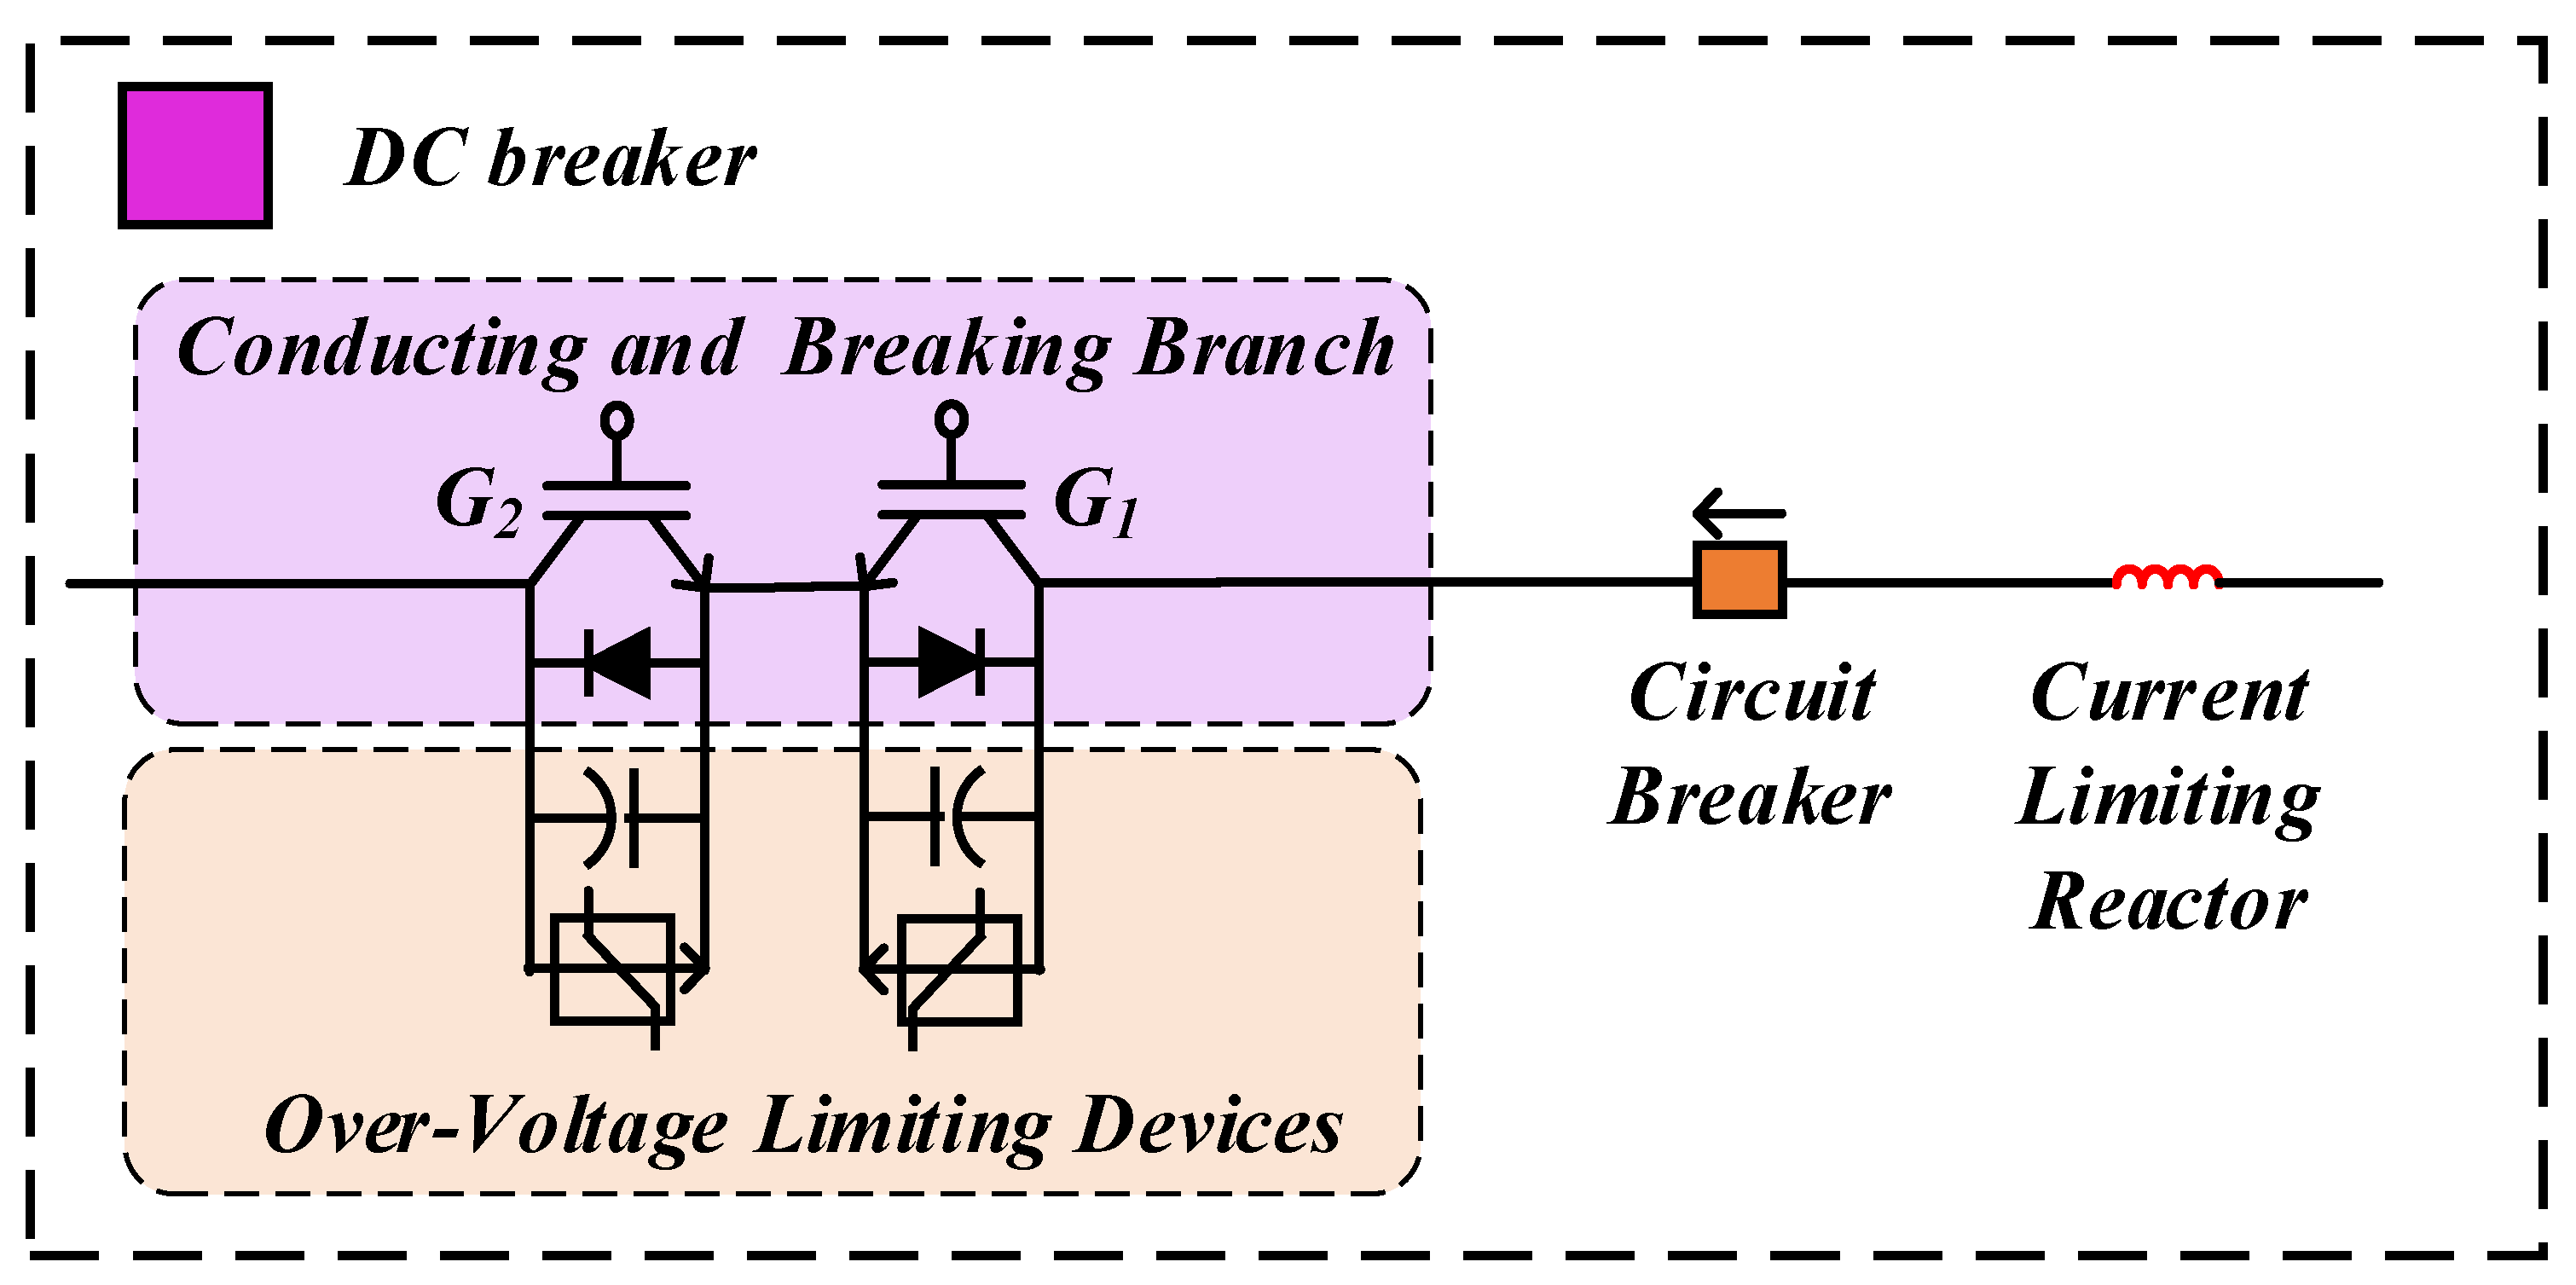
To check the effect of applying DC protection to this DC microgrid, a DC breaker consisting of the common elements of a DC breaker is reflected, as shown in Figure 7. The DC breaker consists of a current limiting reactor (CLR), a residual current disconnecting circuit breaker, conducting and breaking branches, and over-voltage limiting devices. The CLR mitigates the inrush current to secure the operation time of the IGBT. The residual current is removed by an ultra-fast disconnector based on electromagnetic force impulse, which opens when the IGBTs are fully opened. Over-voltage limiting devices consist of capacitors and arrestors. Capacitors limit the ramp of voltage rise when the IGBT turns off. Arrestors discharge the fault current when the voltage across the capacitors exceeds the rated voltage of the arrestors, thereby reducing the voltage surge through the IGBT. Here, the rated voltage of the arrestor is usually 1.25 times the maximum continuous operating voltage (MCOV), but in this design, it is set to 1.05 times the MCOV because the voltage across the turn-on IGBT is almost zero (recommendation in IEC-60099-5: minimum 1.05 times the MCOV). L ( V L × d t / d i ) and C ( i c × d t / d V c ) of DC breakers on the input and output sides of each DER are shown in Table A3 (Appendix C).
The sequence interrupting the fault current is described with an example as follows: a fault occurs on the DC main bus side of converter #7; the terminal voltage of the CLR is immediately 0.75 kV. This abrupt voltage increase is used as the turn-off signal of G1 and G2. A delay time of 2 ms was applied until the turn-off signal was applied to each IGBT to reflect the real circuit breaker’s operation [27]. When all IGBTs are turned off, the charged fault current is resolved through over-voltage limiting devices, suppressing excessive increases in the voltage across the IGBT. When the fault current reduces to zero, the residual current circuit breaker opens to completely disconnect the fault from the grid; within 5 ms is the entire operation time of the DC breaker.
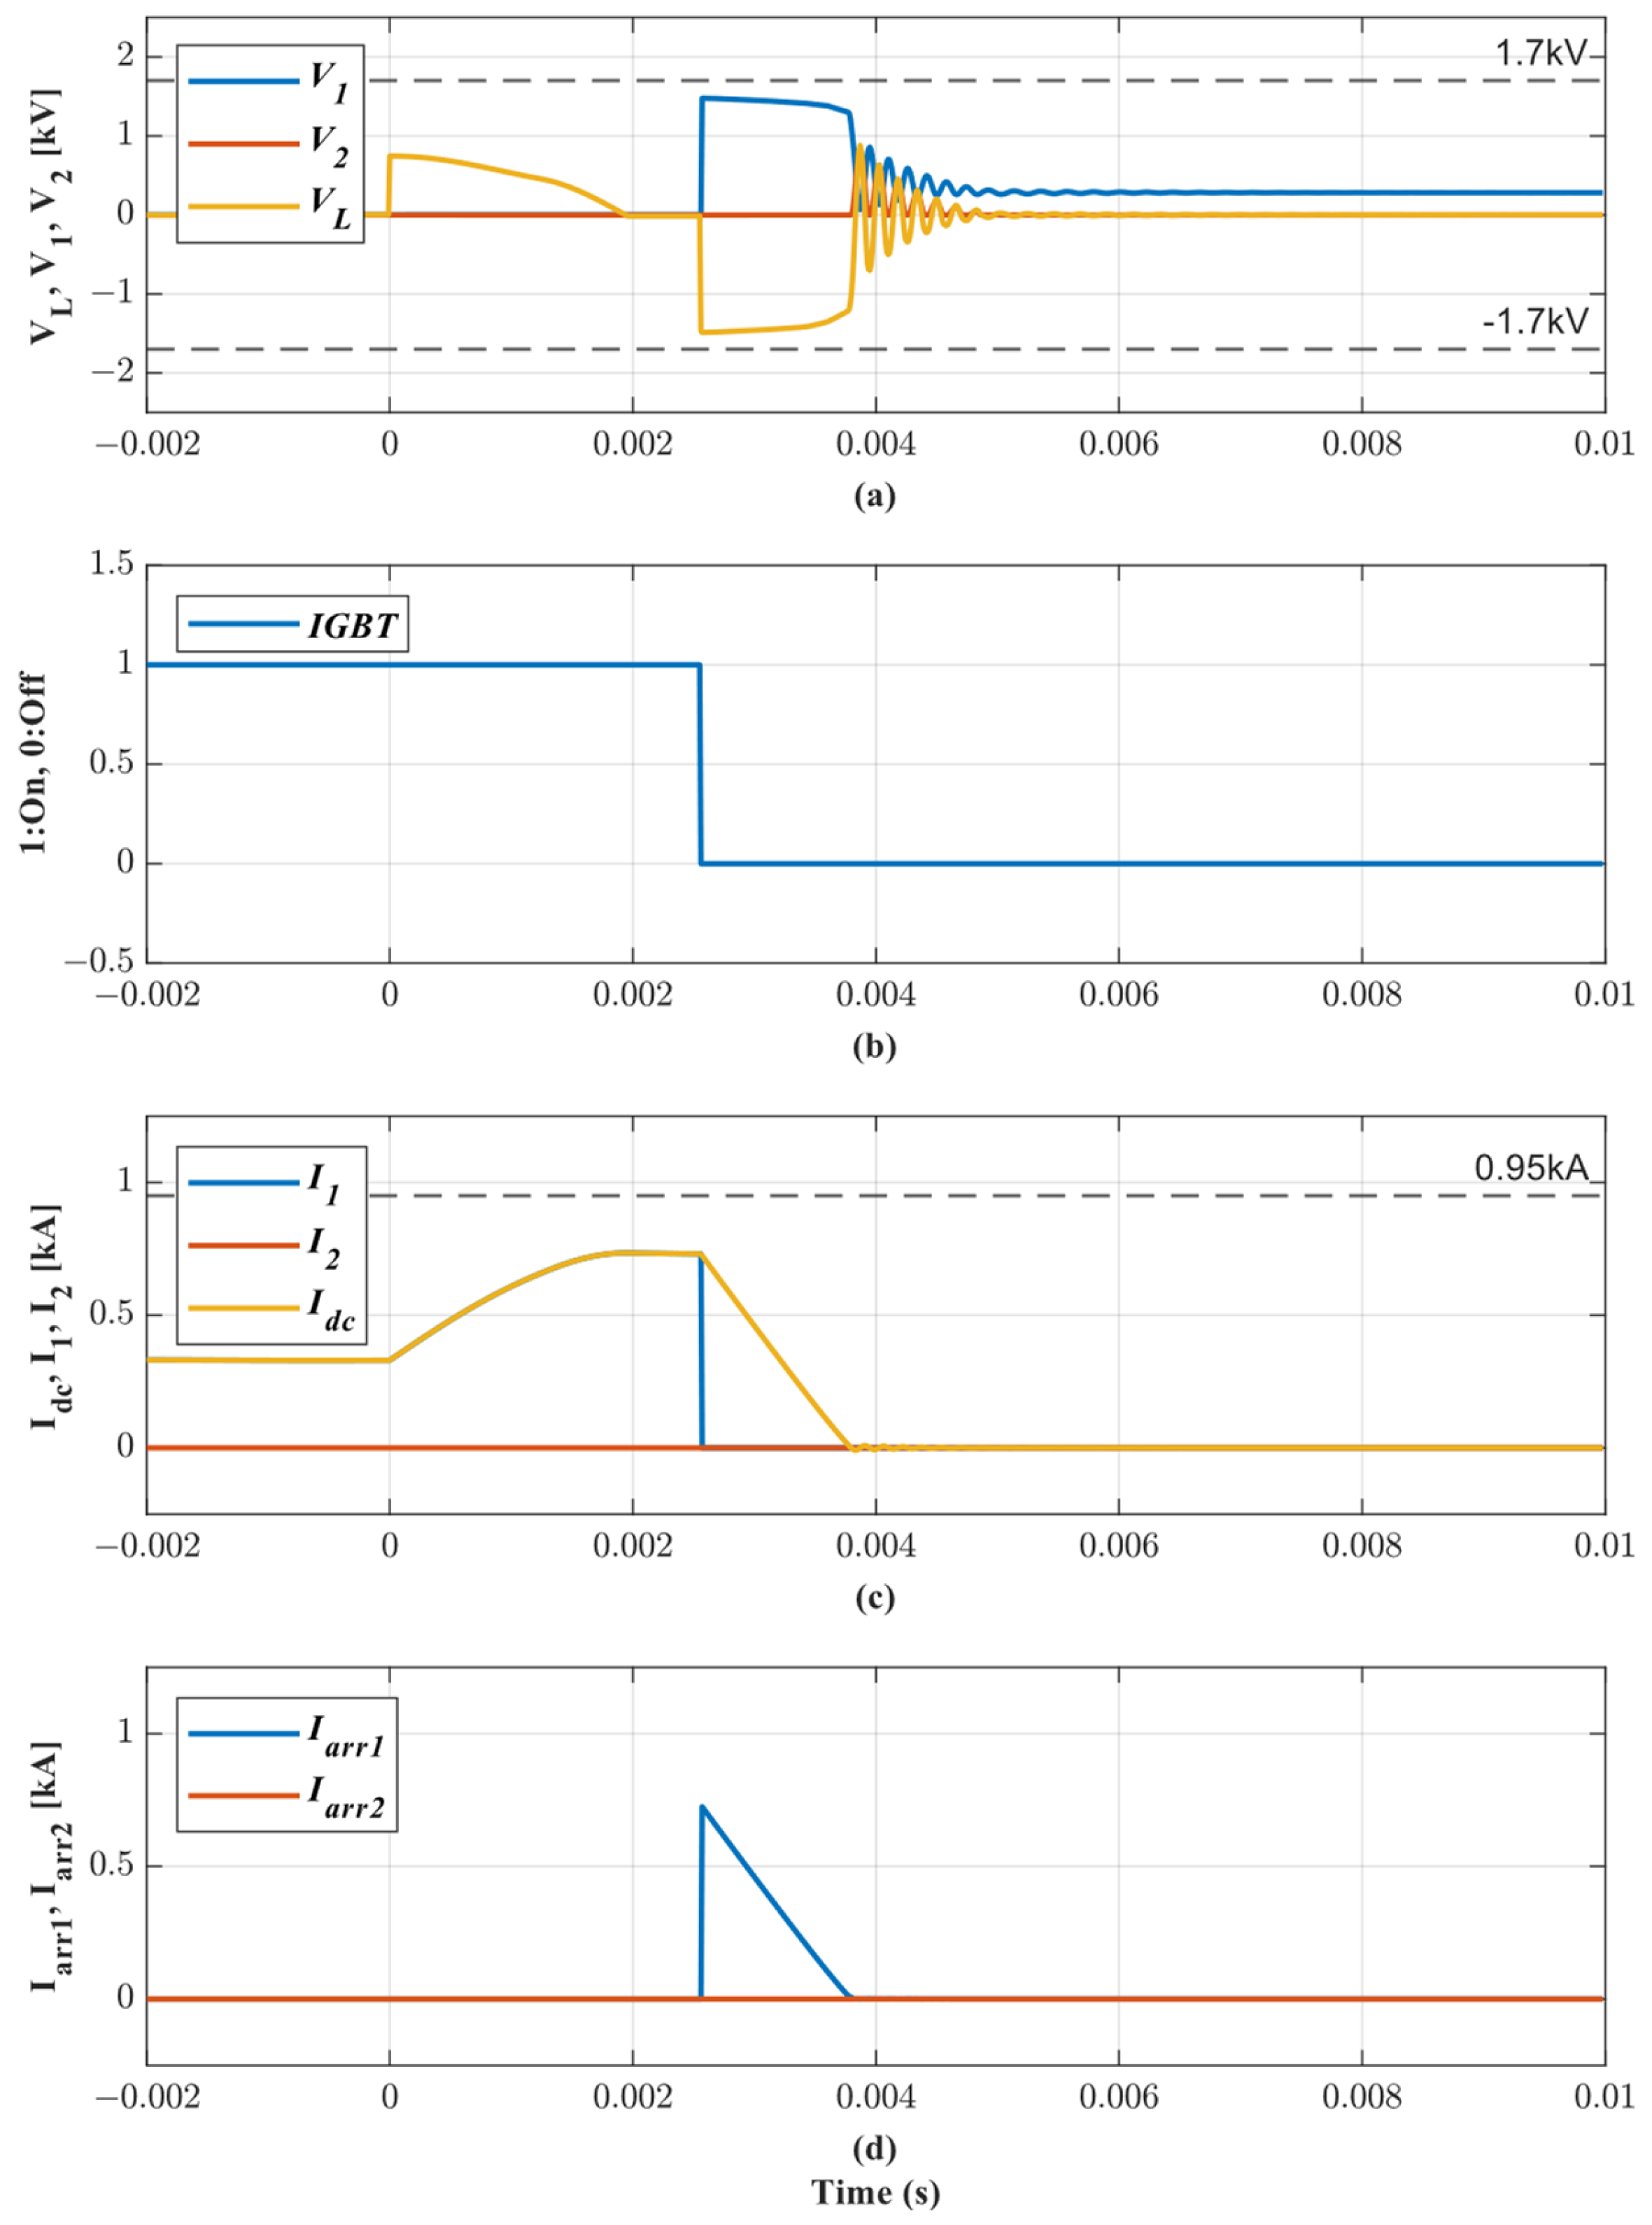
Figure 8 shows the DC breaker operation with the fault impedance of 1 mΩ occurring at 0 s when converter #9 is at the rated capacity of 0.25 MW. Instantly, the voltage across the CLR reaches (VL) 0.75 kV, and the IGBTs open after 2 ms (Figure 8b). Simultaneously, the fault current is absorbed by the capacitor and arrester (Iarr1), as shown in Figure 8d, and the fault current reduces to zero within 5 ms. In addition, the voltage and current through the G1 and G2 (see. V1, V2, I1, and I2) meet the electrical specifications of the IGBT.

4.3. Case Studies

To evaluate voltage stability, several case studies were conducted as follows: For case 1, PVs increase total power from 218.55 kW to 342 kW between 1 s and 1.5 s (i.e., 36% increase in PV power). For case 2, a line-to-ground fault occurs between DC charger #1 and converter #1 at 1 s. For case 3, a short circuit fault occurs in ESS #2 at 1 s. These case studies were conducted by reflecting the conditions resulting from the transaction schedule as follows.
  • [Load]
    (a)
    DC Charger #1 (PEV1 + PEV2): −0.1 MW
    (b)
    DC Charger #2 (PEV3 + PEV4): −0.05 MW
    (c)
    V2G #1: −0.015 MW
    (d)
    V2G #2: −0.01 MW
  • [Source]
    (a)
    ESS #2(0.128275 MW): 73.3% of load
    (b)
    ESS #1(0.046725 MW): 26.7% of load
In addition, DC breakers were reflected for realistic grid conditions. The applied fault impedance is 1 mΩ. Meanwhile, according to IEEE Standard 1547-2018, in the interconnection between utility electric power systems (EPSs) and DERs, if the voltage of the DER exceeds or falls below ±20% of the reference voltage, it should be interrupted within the set clearing time (0.16 s) [28]. In these case studies, accordingly, the DC breakers on the main bus side were set to trip when the voltage of the DC main bus reached ±20% of the reference voltage.

4.3.1. Case 1: Increase in PV Generations

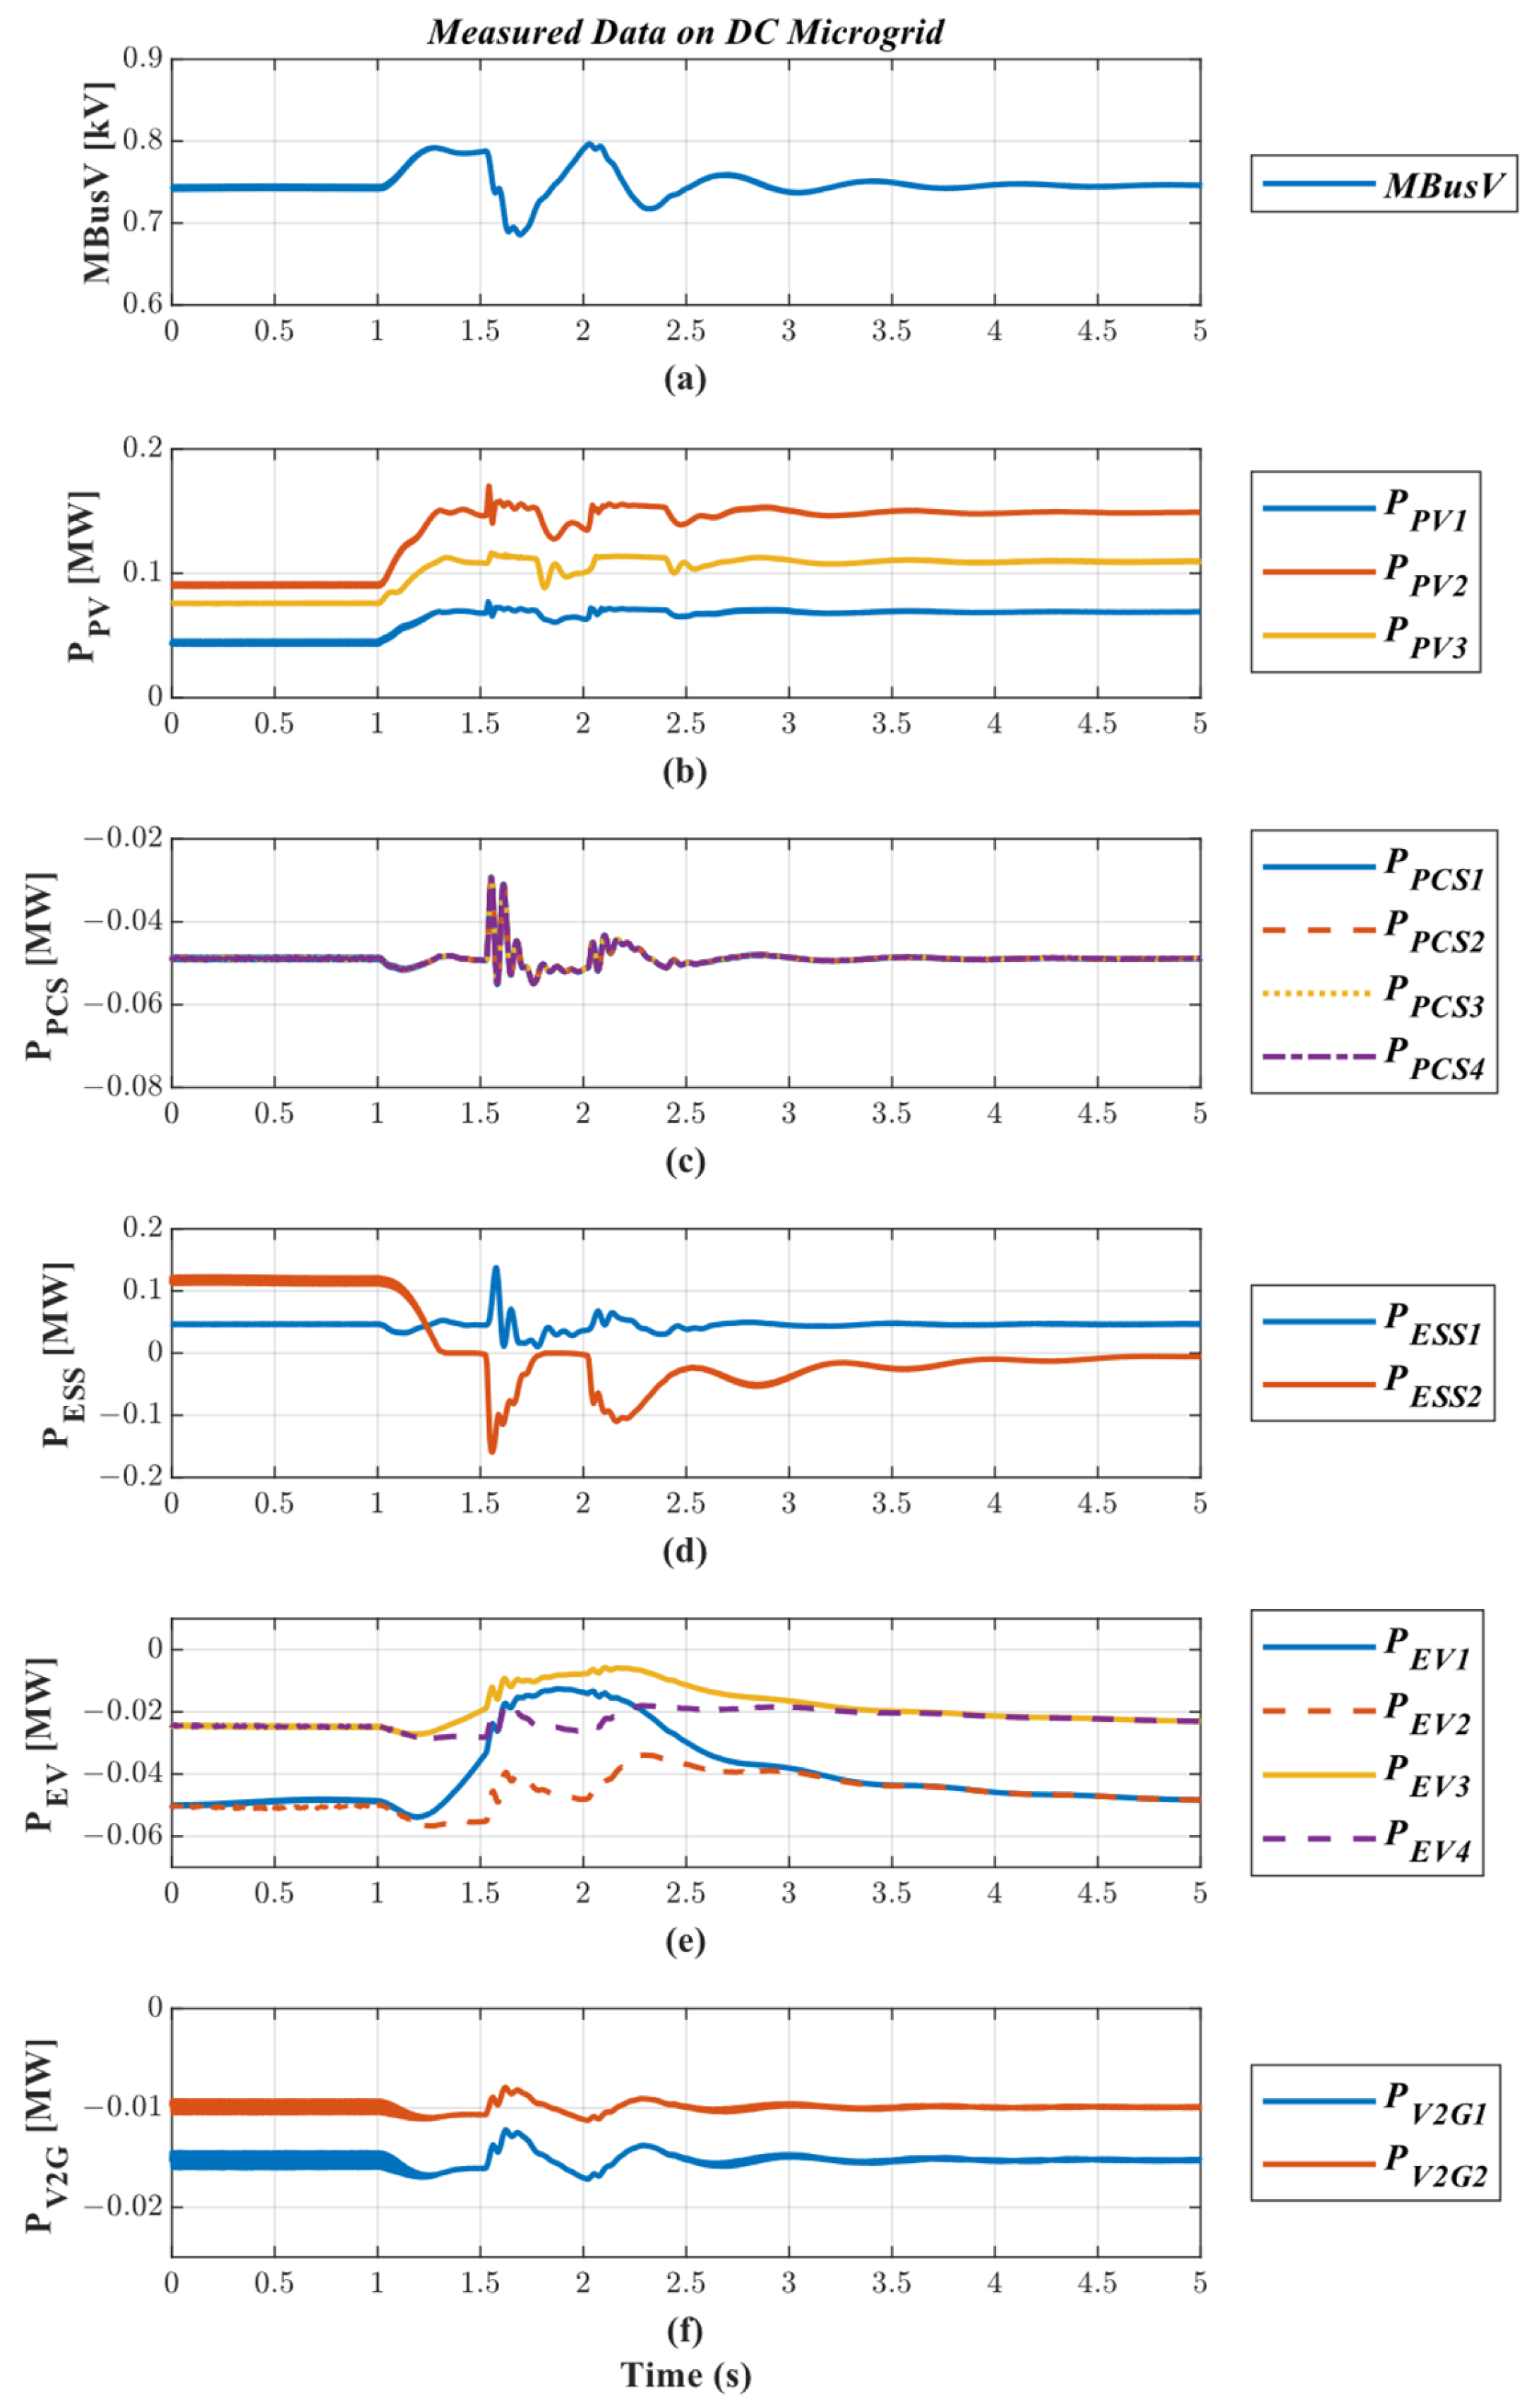
In the DC microgrid, ESS #2 is in charge of the main bus voltage. This was assessed according to rapid increase of solar power generation between 1 s and 1.5 s. As the total solar power generation increases from 218.55 kW to 342 kW (PV1: 72 kW, PV2: 156 kW, PV3: 144 kW), the main bus voltage increases to 0.79 kV at 1.5 s (Figure 9a), and ESS #2 reduces power to zero. This is resulted by the difference between the supply (PPVs + PESS1) of 388.725 kW and the load (PEVs + PV2Gs) of 367.91 kW. The main bus voltage and the output of each DER are regulated in 3 s after the event (Figure 9b–f).

4.3.2. Case 2: Line-to-Ground Fault between DC Charger #1 and Converter #1

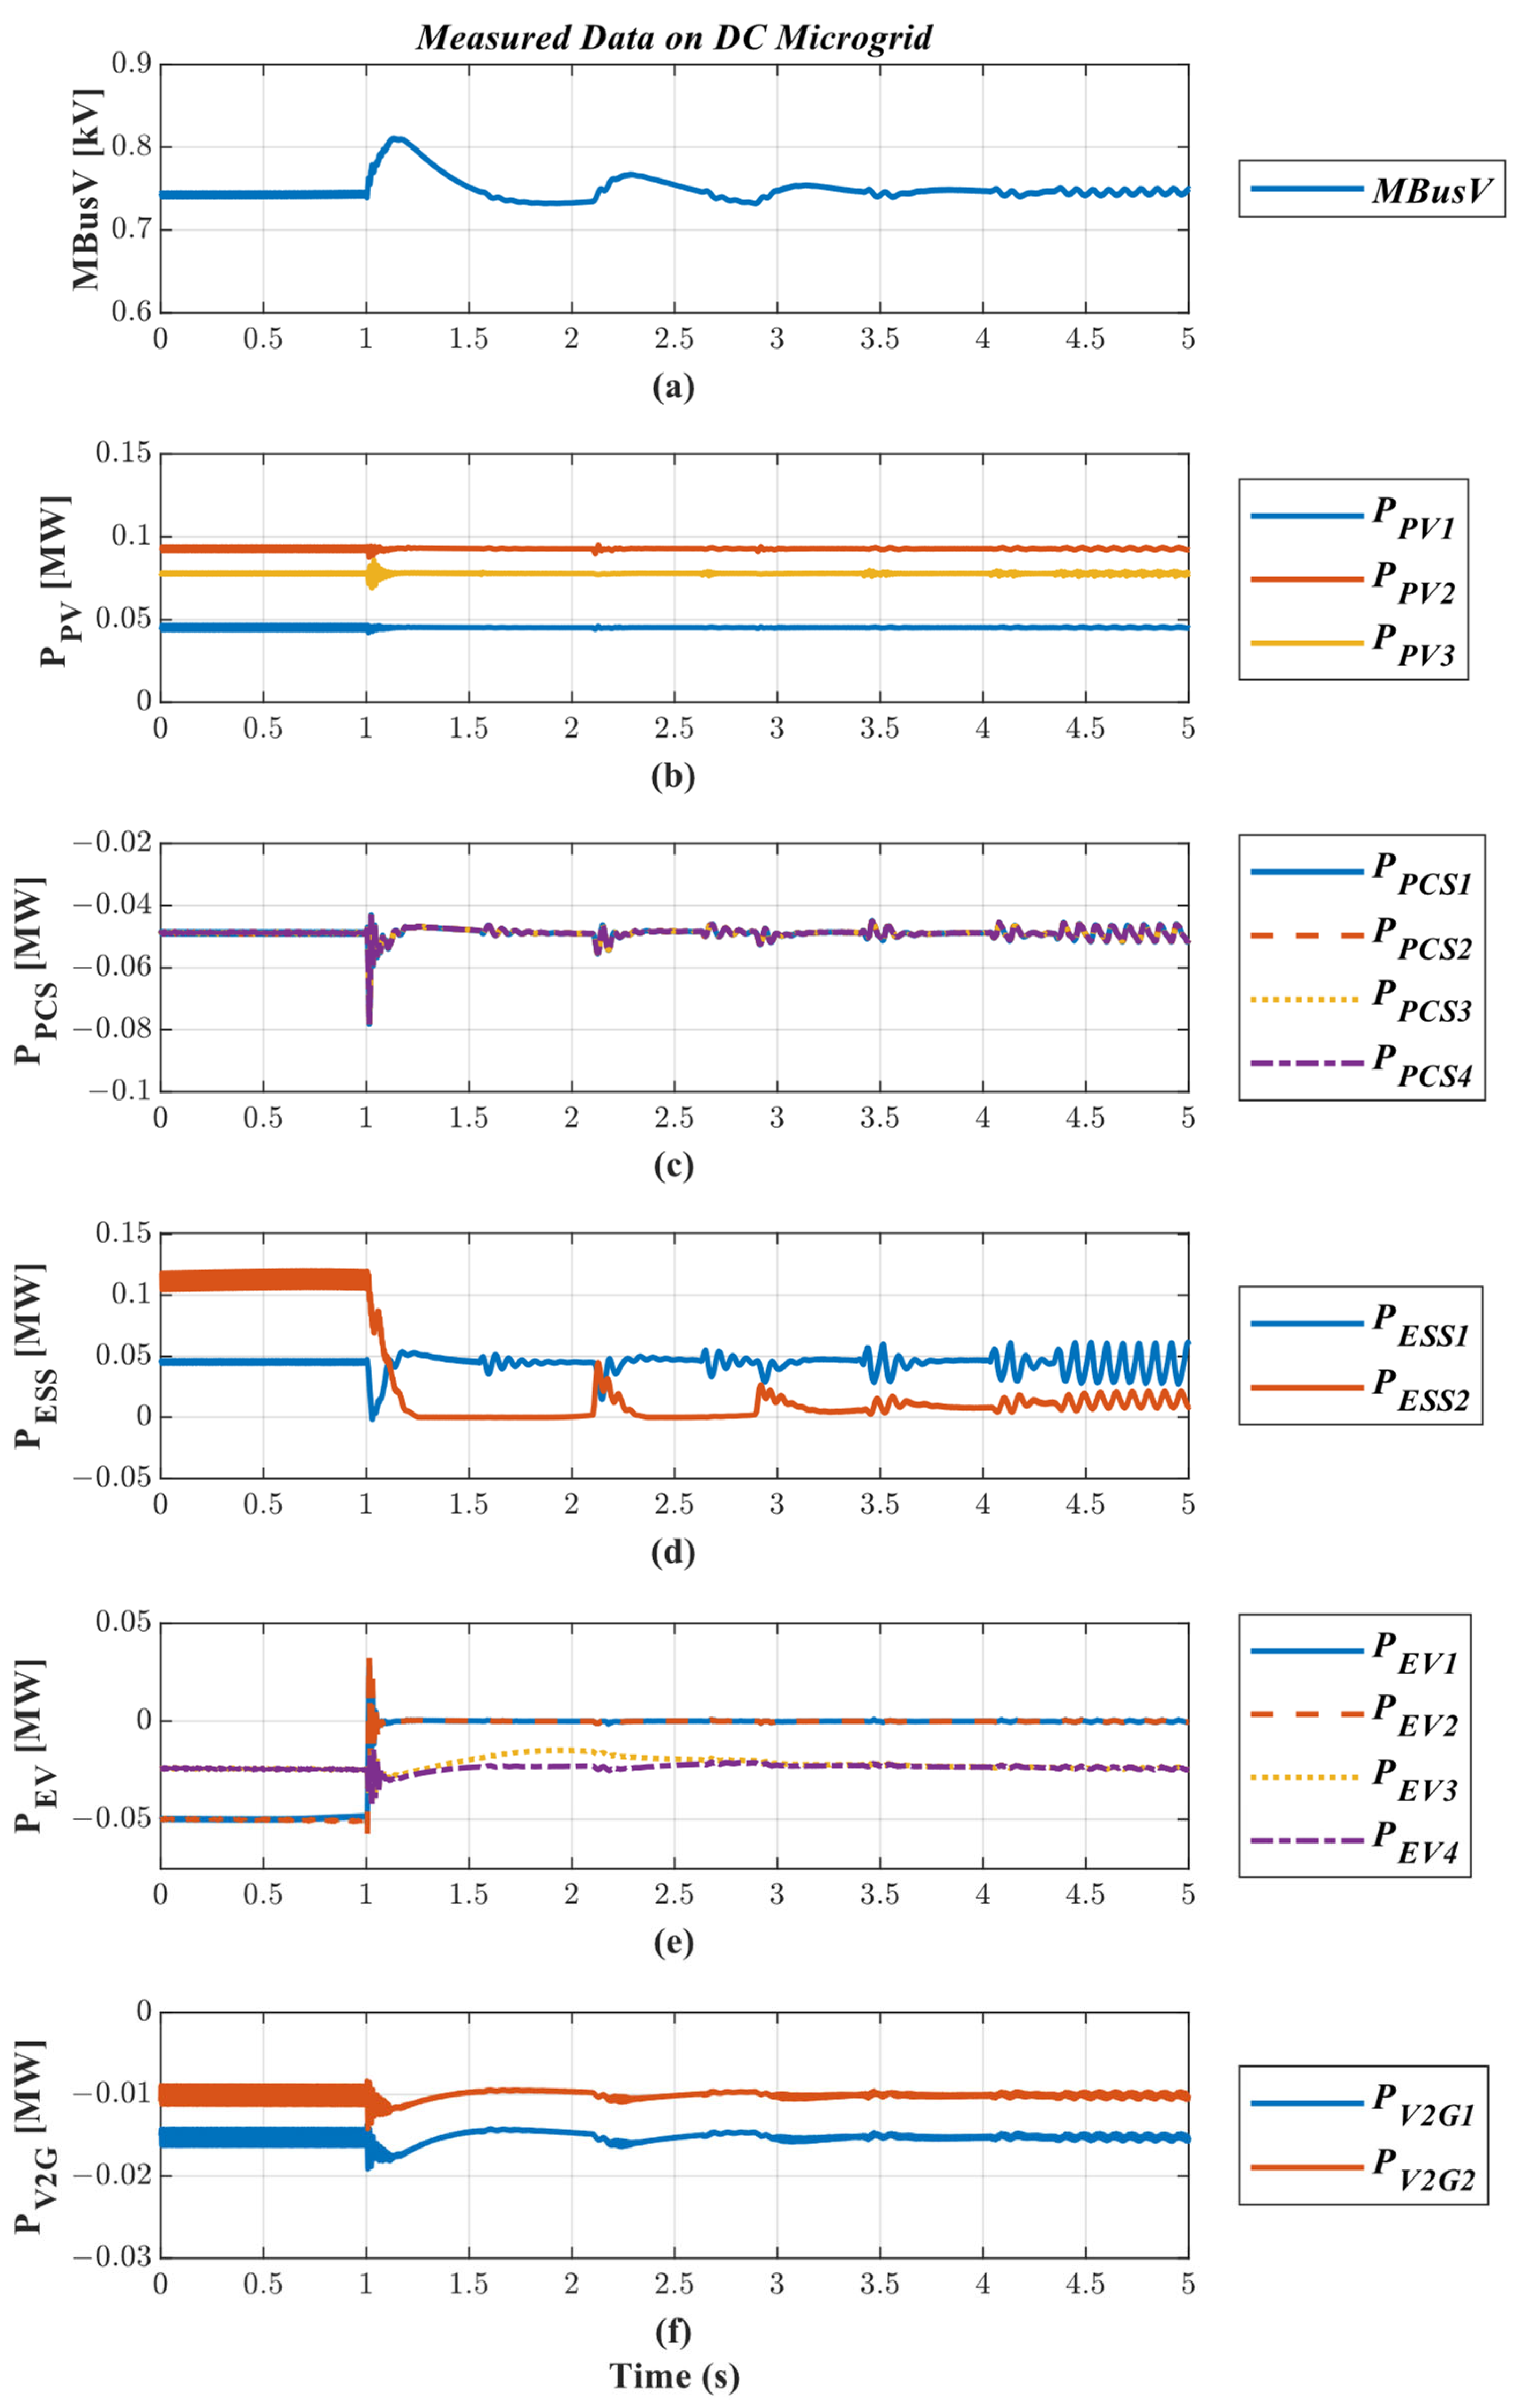
The voltage stability is assessed according to disconnection of DC charger #1 as the result of a line-to-ground fault, which was applied to the load side of converter #1 at 1 s. Thus, the DC charger #1 is separated from the DC microgrid with the internal transitions as shown in Figure 10. Therefore, the main bus voltage increased to 0.8 kV as shown in Figure 11a, and ESS #2 tried to regulate that voltage near the reference voltage (Figure 11d). To balance the power difference between the supply of 265.275 kW and the load of 267.91 kW, ESS#2 must supply 2.635 kW. The pulsation of PVs, PCSs, ESSs, DC Charger #2, and V2Gs is removed in 4.3 s (Figure 11b–f). The main bus voltage ripple is related to the topology and control of converter #9. It is difficult to remove without degrading other performance using the conventional design process with simple load. Thus, it is necessary to consider the entire grid during the converter design process.

4.3.3. Case 3: ESS #2 Disconnection

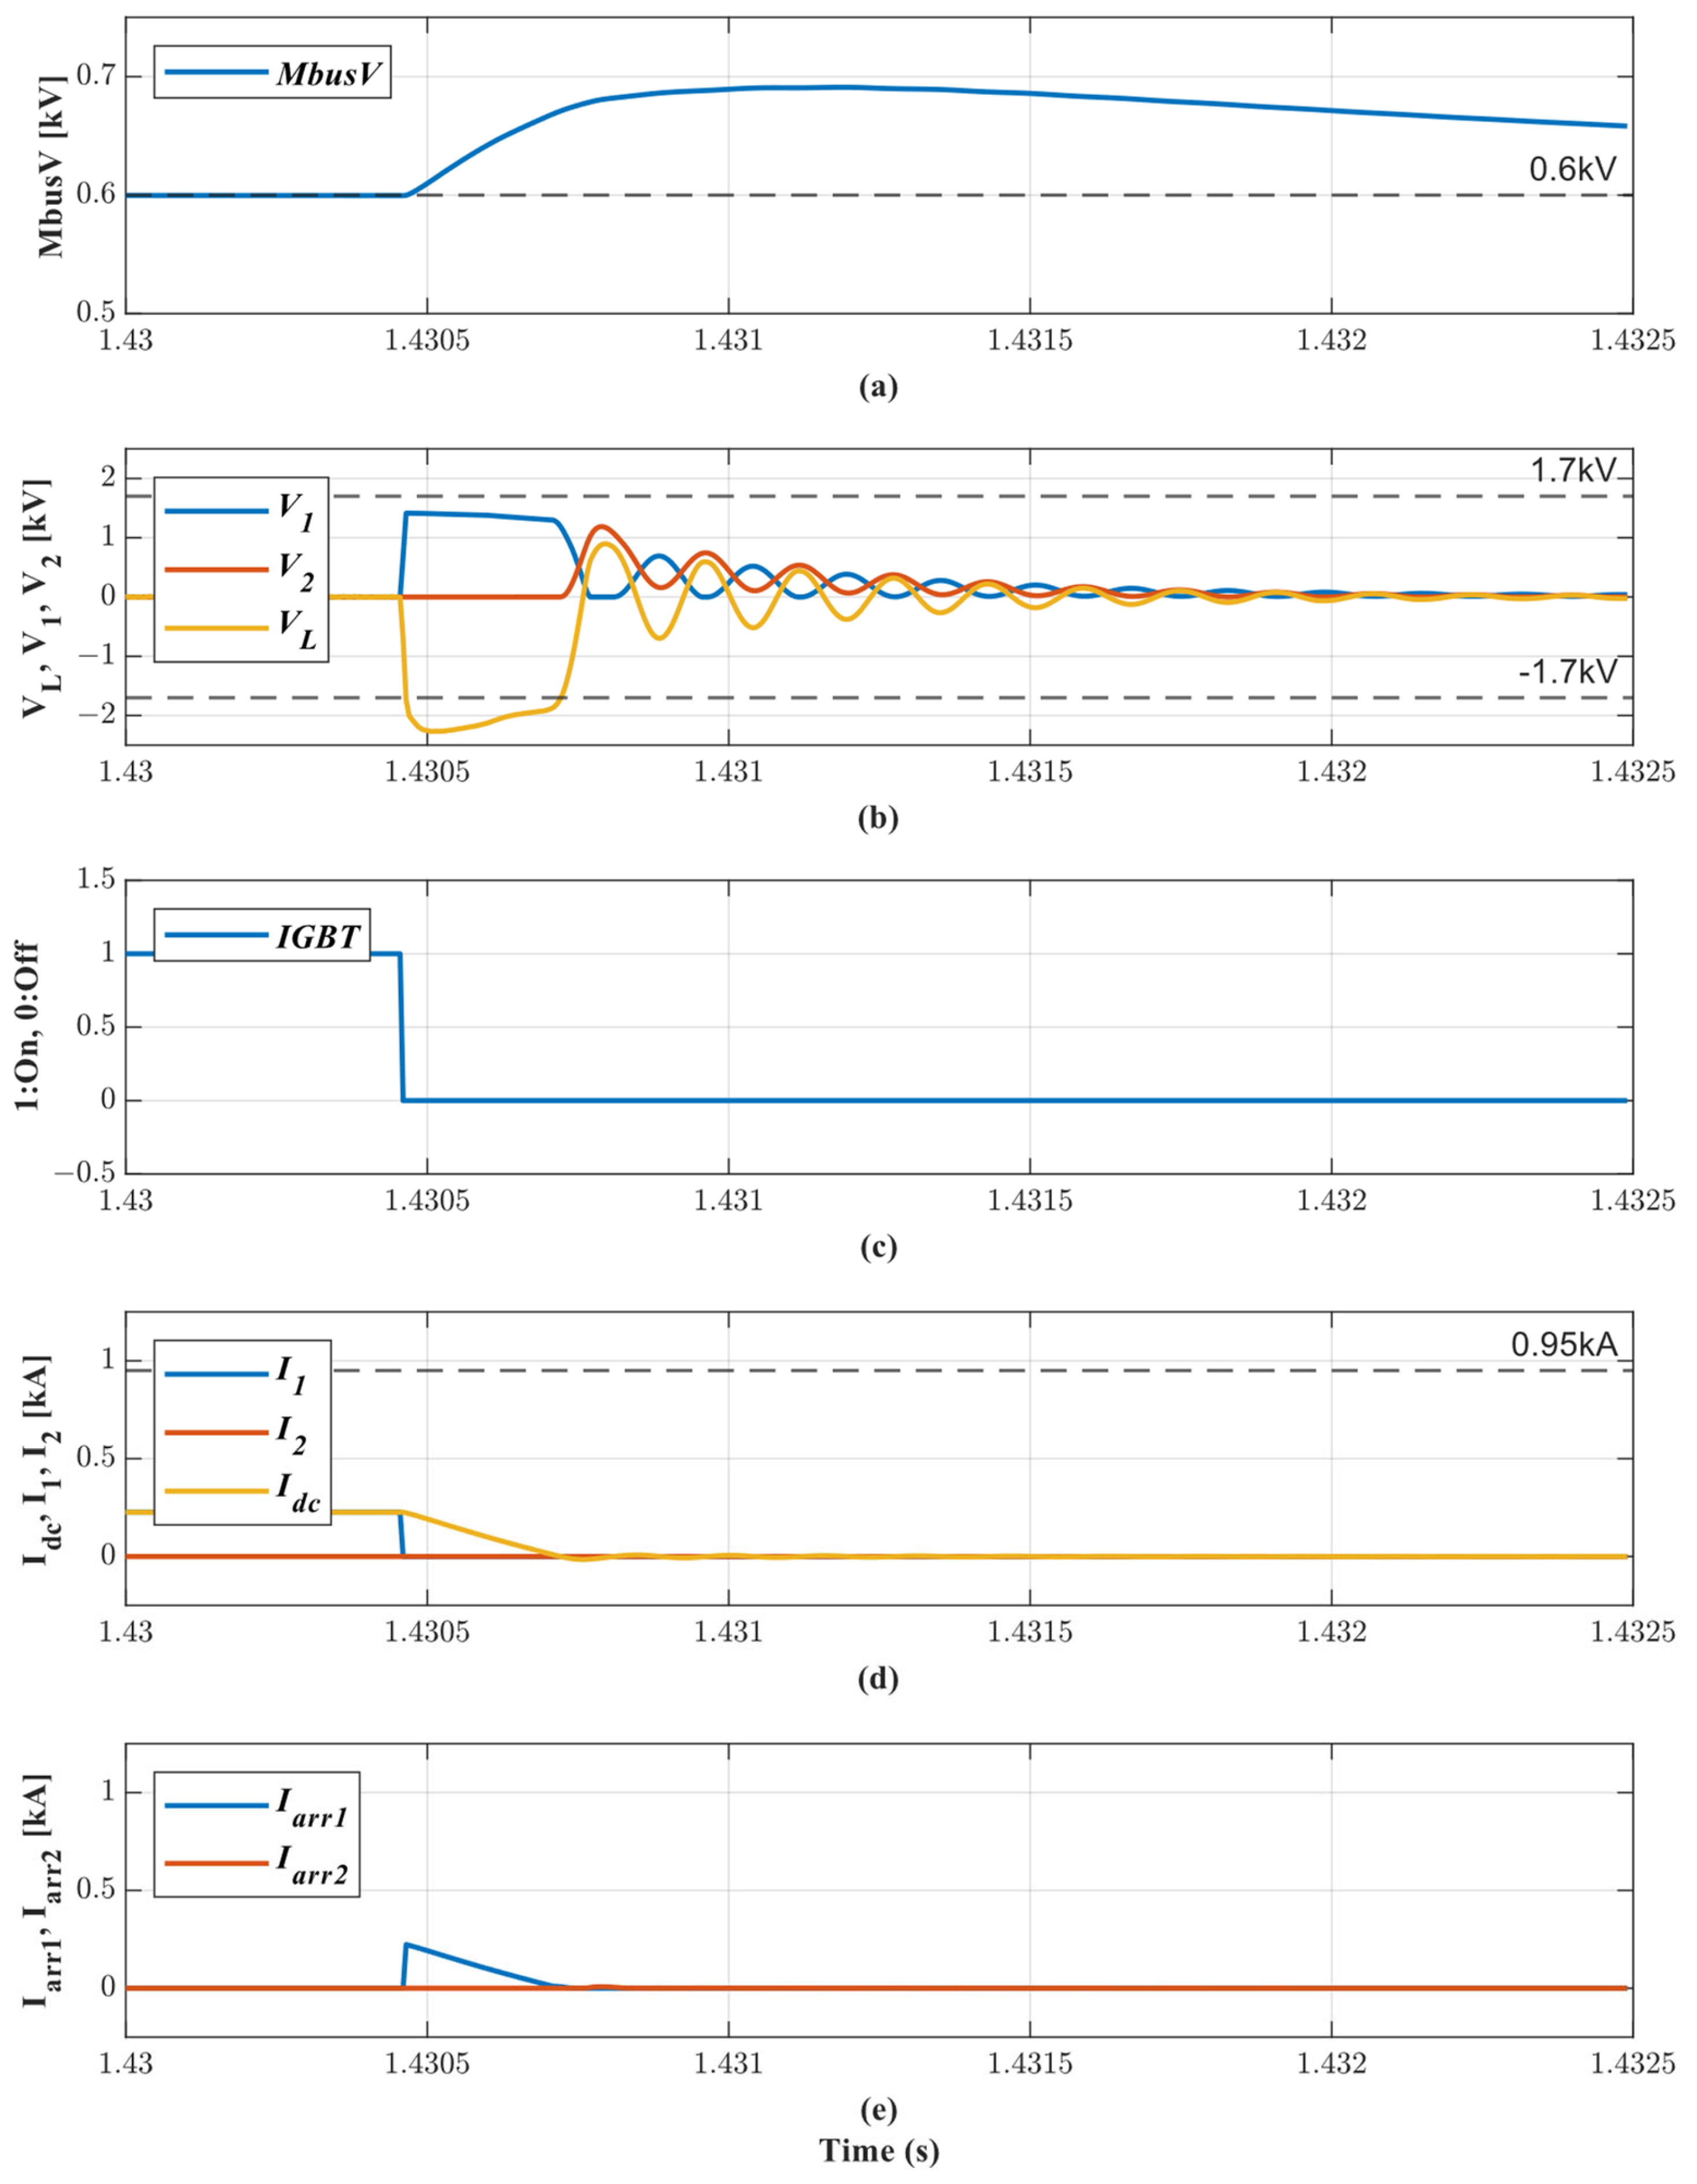
The disconnection of ESS #2 causes loss of voltage control in the DC microgrid. Therefore, all DC breakers in the DC microgrid must be tripped and completely disconnect the EPS. To verify this, a short-circuit fault was applied to ESS #2 at 1 s. As described in Figure 12d, ESS #1 increased its output immediately to maintain power balance but was unable to supply power beyond its rated capacity, resulting in a decline in the main bus voltage. About 0.43 s after the fault, the main bus voltage dropped to 0.6 kV (Figure 12a). This is the same with the preset voltage for DC breaker operation (i.e., 80% of the rated 0.75 kV), so it is tripped that all the DC breakers connected to the main bus (Figure 13). Thus, all DERs’ powers come to zero (Figure 12b–f), also the DC microgrid was completely disconnected from the AC grid.

5. Conclusions

This paper described the voltage stability evaluation results of a DC microgrid testbed on a campus in Korea for the demonstration of blockchain-based power trans-actions. For accurate assessment, EMT models of transformers, underground cables, and converters in the field were built and analyzed. Also, data acquired through grid test operation, and reflection data of the transaction schedule were incorporated to check compliance with the grid code in a steady state. In addition, voltage stability was examined by assuming severe events. Where, a generalized DC breaker model was applied to reflect the proper fault removal by breakers in the actual power system. In the cases 1 and 2, the first overshoot exceeds the grid code and stabilizes after at least 3 s, but oscillation occurs continuously. In other words, the current real grid converges somewhat slower than the convergence speed of the conventional primary control (0.2~1 s), so a highly responsive voltage control and a damping control to eliminate oscillation are required. To do this, the grid must be reflected in the converter design process. In a follow-up study, the DC-DC converter will be designed by reflecting the real grid topology and its operation data. This will be applied to the grid to further analyze the voltage stability, and finally, update the transaction schedule based on the stable voltage stability.
Based on the results of these studies, it is expected that many will consider the grid condition for the grid connected converter design. It is also expected to contribute to the vigorous deployment of microgrid-connected renewable energy.

Author Contributions

This research was conducted with the collaboration of all authors. H.H. wrote the draft; S.H.L. supervised the stability research and revised the paper; D.C. revised the paper; S.C. gave the bidding results; B.S. supervised the project. All authors have read and agreed to the published version of the manuscript.

Funding

This work was supported by the Korea Institute of Energy Technology Evaluation and Planning (KETEP) grant funded by the Korea government Ministry of Knowledge Economy (MOTIE) in part (Development of DC Power Trade Platform System in Public Community Which is Connected by EV-Renewable Based on Block Chain Technology) under Grant 20192010107050 and in part (20223A10100030, Development of Synchronous Condenser Model and Power System Inertia Operating Technology).

Data Availability Statement

Not applicable.

Conflicts of Interest

The authors declare no conflict of interest.

Appendix A

Table A1. Parameters of PCS and four switch buck-boost converter module.
Topology ParametersValues
Filter Inductance of PCS, Lf (mH)1
DC-Link Capacitor of PCS, Cf (mF)10
Switching Frequency of PCS, fs (kHz)10
Inductance of FSBB, L (mH)1.5
Input and Output side capacitance of FSBB, C (mF)0.28
IGBT Turn-On Resistance of FSBB, Ri,on (mΩ)1.1
IGBT Forward Breakover Voltage of FSBB, Vi,brk (kV)1.7
IGBT Continuous DC collector current of FSBB, IC (kA)0.95
IGBT Turn-off delay time of FSBB, td,off (us)0.73
Antiparallel Diode Turn-On Resistance of FSBB, Rd,on (mΩ)1.1
Antiparallel Diode Forward Breakover Voltage of FSBB, Vd,brk (kV)1.7
Antiparallel Diode Continuous DC forward current FSBB, IF (kA)0.6
Switching Frequency of FSBB, fs (kHz)4
K p 1 ,   K i 1 of Power Outer Loop10, 10
K p 2 ,   K i 2 in Current Inner Loop1, 100
K p 3 ,   K i 3 in Voltage Outer Loop1, 100
K p 3 ,   K i 3 in Power Outer Loop1, 10
K p 4 ,   K i 4 in Current Inner Loop0.1, 100

Appendix B

Table A2. Grid test operation acquisition data at the point of maximum generation in Figure 5.
Time (12:15, 8 November 2022)Value
PV #1 (kW)45.91
PV #2 (kW)94.05
PV #3 (kW)78.59
PCS #1 (kW)−48.24
PCS #2 (kW)−48.23
PCS #3 (kW)−48.23
PCS #4 (kW)−48.21

Appendix C

Table A3. Parameters of DC breakers L and C.
Topology ParametersValues
L of DC breaker on PV #1 input and output side (mH)1.8, 1.9
L of DC breaker on PV #2 input and output side (mH)2.2, 2.1
L of DC breaker on PV #3 input and output side (mH)1.9, 1.9
L of DC breaker between PV bus and ESS #2 (mH)2.4
L of DC breaker on ESS #1 input and output side (mH)2.4, 2.4
L of DC breaker on ESS #2 input and output side (mH)1.9, 1.9
L of DC breaker on EV #1 input and output side (mH)2.5, 2.6
L of DC breaker on EV #2 input and output side (mH)2.5, 2.6
L of DC breaker on EV #3 input and output side (mH)2.5, 2.6
L of DC breaker on EV #4 input and output side (mH)2.5, 2.6
L of DC breaker on V2G #1 input and output side (mH)1.6, 1.6
L of DC breaker on V2G #2 input and output side (mH)1.6, 1.6
L of DC breaker on PCS #1 input side (mH)1.9
L of DC breaker on PCS #2 input side (mH)1.9
L of DC breaker on PCS #3 input side (mH)1.9
L of DC breaker on PCS #4 input side (mH)1.9
C in all DC breakers (uF)0.5

References

  1. United Nations General Assembly. Transforming Our World: The 2030 Agenda for Sustainable Development; A/RES/70/1; United Nations General Assembly: New York, NY, USA, 2015.
  2. Ramsebner, J.; Haas, R.; Auer, H.; Ajanovic, A.; Gawlik, W.; Maier, C.; Nemec-Begluk, S.; Nacht, T.; Puchegger, M. From single to multi-energy and hybrid grids: Historic growth and future vision. Renew. Sustain. Energy Rev. 2021, 151, 111520. [Google Scholar] [CrossRef]
  3. Microgrid Deployment Tracker 4Q18. Available online: https://www.navigantresearch.com/reports/microgrid-deployment-tracker-4q18 (accessed on 19 April 2019).
  4. Nejabatkhah, F.; Li, Y.W.; Tian, H. Power Quality Control of Smart Hybrid AC/DC Microgrids: An Overview. IEEE Access 2019, 7, 52295–52318. [Google Scholar] [CrossRef]
  5. Qu, Z.-W.; Chong, Z.-X.; Wang, Y.-J.; Shi, Z. Control Method for Grid-connected/Islanding Switching of Hybrid AC/DC Microgrid. JEET 2023, 18, 15–25. [Google Scholar] [CrossRef]
  6. Ahmed, M.; Meegahapola, L.; Vahidnia, A.; Datta, M. Stability and Control Aspects of Microgrid Architectures—A Comprehensive Review. IEEE Access 2020, 8, 144730–144766. [Google Scholar] [CrossRef]
  7. Yadav, M.; Pal, N.; Saini, D.K. Microgrid Control, Storage, and Communication Strategies to Enhance Resiliency for Survival of Critical Load. IEEE Access 2020, 8, 169047–169069. [Google Scholar] [CrossRef]
  8. Mohan, H.M.; Dash, S.K. Renewable Energy-Based DC Microgrid with Hybrid Energy Management System Supporting Electric Vehicle Charging System. Systems 2023, 11, 273. [Google Scholar] [CrossRef]
  9. Gelani, H.E.; Dastgeer, F.; Siraj, K.; Nasir, M.; Niazi, K.A.K.; Yang, Y. Efficiency Comparison of AC and DC Distribution Networks for Modern Residential Localities. Appl. Sci. 2019, 9, 582. [Google Scholar] [CrossRef]
  10. Shrestha, A.; Bishwokarma, R.; Chapagain, A.; Banjara, S.; Aryal, S.; Mali, B.; Thapa, R.; Bista, D.; Hayes, B.P.; Papadakis, A.; et al. Peer-to-Peer Energy Trading in Micro/Mini-Grids for Local Energy Communities: A Review and Case Study of Nepal. IEEE Access 2019, 7, 131911–131928. [Google Scholar] [CrossRef]
  11. Lasseter, R.H. Smart Distribution: Coupled Microgrids. Proc. IEEE 2021, 99, 1074–1082. [Google Scholar] [CrossRef]
  12. Hatziargyriou, N.D.; Dimeas, A.; Tsikalakis, A.G.; Lopes, J.A.P.; Karniotakis, G.; Oyarzabal, J. Management of microgrids in market environment. In Proceedings of the 2005 International Conference of Future Power Systems, Amsterdam, The Netherlands, 18 November 2005; p. 7. [Google Scholar]
  13. Gupta, P.K.; Duchon, M. Developing Self-Similar Hybrid Control Architecture Based on SGAM-Based Methodology for Distributed Microgrids. Designs 2018, 2, 41. [Google Scholar] [CrossRef]
  14. Li, X.; Zheng, T.; Huang, J.; Li, X.; Xiong, W. Decentralized Multiple Control for DC Microgrid with Hybrid Energy Storage. JEET 2023, 18, 1301–1311. [Google Scholar] [CrossRef]
  15. Dragičević, T.; Lu, X.; Vasquez, J.C.; Guerrero, J.M. DC Microgrids—Part I: A Review of Control Strategies and Stabilization Techniques. IEEE Trans. Power Electron. 2016, 31, 4876–4891. [Google Scholar]
  16. EEE Std 1547.4-2011; IEEE Guide for Design, Operation, and Integration of Distributed Resource Island Systems with Electric Power Systems. IEEE: Piscataway, NJ, USA, 20 July 2011; pp. 1–54.
  17. Dou, C.X.; Liu, B. Multi-agent based hierarchical hybrid control for smart microgrid. IEEE Trans. Smart Grid 2013, 4, 771–778. [Google Scholar] [CrossRef]
  18. Bintoudi, A.D.; Zyglakis, L.; Apostolos, T.; Ioannidis, D.; Al-Agtash, S.; Martinez-Ramos, J.L.; Onen, A.; Azzopardi, B.; Hadjidemetriou, L.; Martensen, N.; et al. Novel hybrid design for microgrid control. In Proceedings of the IEEE PES Asia–Pacific Power and Energy Engineering Conference, APPEEC, Bangalore, India, 8–10 November 2017; pp. 1–6. [Google Scholar]
  19. Steinmetz, R.; Wehrle, K. 2. What Is This “Peer-to-Peer” About? In Peer-to-Peer Systems and Applications; Springer: Berlin/Heidelberg, Germany, 2005; Volume 3485, pp. 9–16. [Google Scholar]
  20. Xia, Y.; Peng, Y.; Yang, P.; Yu, M.; Wei, W. Distributed Coordination Control for Multiple Bidirectional Power Converters in a Hybrid AC/DC Microgrid. IEEE Trans. Power Electron. 2017, 32, 4949–4959. [Google Scholar] [CrossRef]
  21. Andoni, M.; Robu, V.; Flynn, D.; Abram, S.; Geach, D.; Jenkins, D.; McCallum, P.; Peacock, A. Blockchain technology in the energy sector: A systematic review of challenges and opportunities. Renew. Sustain. Energy Revies 2019, 100, 143–174. [Google Scholar] [CrossRef]
  22. Barnes, M.; Vilchis-Rodriguez, D.S.; Pei, X.; Shuttleworth, R.; Cwikowski, O.; Smith, A.C. HVDC Circuit Breakers—A Review. IEEE Access 2020, 8, 211829–211848. [Google Scholar] [CrossRef]
  23. Lee, S.H. Scaled-Up Slack Generator Based on Parallel Inverters for a Reliable IFSA Microgrid. IEEE Access 2021, 9, 133204–133214. [Google Scholar] [CrossRef]
  24. Ekin, Ö.; Arena, G.; Waczowicz, S.; Hagenmeyer, V.; De Carne, G. Comparison of Four-Switch Buck-Boost and Dual Active Bridge Converter for DC Microgrid Applications. In Proceedings of the 2022 IEEE 13th International Symposium on Power Electronics for Distributed Generation Systems (PEDG), Kiel, Germany, 26–29 June 2022; pp. 1–6. [Google Scholar]
  25. Orellana, M.; Petibon, S.; Estibals, B.; Alonso, C. Four Switch Buck-Boost Converter for Photovoltaic DC-DC power applications. In Proceedings of the IECON 2010—36th Annual Conference on IEEE Industrial Electronics Society, Glendale, AZ, USA, 7–10 November 2010; pp. 469–474. [Google Scholar]
  26. Ren, X.; Ruan, X.; Qian, H.; Chen, Q. Three-Mode Dual Frequency Two-Edge Modulation Scheme for Four-Switch Buck-Boost Converter. IEEE Trans. Power Electron. 2009, 24, 499–509. [Google Scholar]
  27. Zen, S.; Inada, Y.; Ohnishi, W.; Fukai, Y.; Takayasu, N.; Maeyama, M.; Yamano, Y. Prototype Current-Limiting Hybrid DC Circuit Breaker Incorporating a Fuse and a Semiconductor Device. IEEE Trans. Power Deliv. 2021, 36, 2231–2233. [Google Scholar] [CrossRef]
  28. IEEE Std 1547-2018 (Revision of IEEE Std 1547-2003); IEEE Standard for Interconnection and Interoperability of Distributed Energy Resources with Associated Electric Power Systems Interfaces. IEEE: Piscataway, NJ, USA, 6 April 2018; pp. 1–138.
Figure 1. One-line diagram of a university campus DC microgrid testbed in Korea.
Energies 16 07297 g001
Figure 2. Block diagram of a real and reactive power controller.
Energies 16 07297 g002
Figure 3. Four-switch buck-boost converter module topology (a) and controller (b).
Energies 16 07297 g003
Figure 4. Schematic of the DC microgrid platform.
Energies 16 07297 g004
Figure 5. Measured power from test operation; (a) solar generation and (b) load.
Energies 16 07297 g005
Figure 6. (a) Main bus voltage and (bd) powers from PCSs, PVs, and ESSs with the maximum measured PV outputs.
Energies 16 07297 g006
Figure 7. Schematic of a typical DC breaker.
Energies 16 07297 g007
Figure 8. DC breaker operation with the fault impedance of 1 mΩ occurring at the main bus side of rated converter #9 at 0 s; (a) voltages through the CLR, G1, and G2 (i.e., VL, V1, and V2), (b) IGBT gate signal, (c) currents through the circuit breaker, G1 and G2 (i.e., Idc, I1, and I2), (d) currents through the arresters connected in parallel with G1 and G2 (i.e., Iarr1, Iarr2).
Energies 16 07297 g008
Figure 9. Responses to increasing the PVs in the DC microgrid at 1 s; (a) main bus voltage, (b) powers from PVs, (c) powers from PCSs, (d) powers from ESSs, (e) powers from rapid chargers of EVs, and (f) powers from slow charger with function of vehicle to grid.
Energies 16 07297 g009
Figure 10. Transitions of internal variable of DC breakers between the converters #1–2 and DC charger #1; (left) on the converter #1, (right) on the converter #2, (a,b) voltages through CLR, G1, and G2 of each DC breaker (i.e., VL, V1, V2), (c,d) IGBTs’ states of each DC breaker, (e,f) currents through CLR, G1, and G2 (i.e., Idc, I1, I2), and (g,h) currents through the arresters in parallel with G1 and G2 (Iarr1 and Iarr2).
Energies 16 07297 g010
Figure 11. Transitions of representative variables according to disconnection of DC Charger #1 at 1 s; (a) main bus voltage, (b) powers from PVs, (c) powers from PCSs, (d) powers from ESSs, (e) powers from rapid chargers of EVs, and (f) powers from slow charger with function of vehicle to grid.
Energies 16 07297 g011
Figure 12. Transitions of representative variables according to disconnection of ESS #2 at 1 s; (a) main bus voltage, (b) powers from PVs, (c) powers from PCSs, (d) powers from ESSs, (e) powers from rapid chargers of EVs, and (f) powers from slow charger with function of vehicle to grid.
Energies 16 07297 g012
Figure 13. DC breaker operation at the main bus side of rated converter #9; (a) main bus voltage, (b) voltages through the CLR, G1 and G2 (VL, V1, V2), (c) IGBT gate signal, (d) currents through the circuit breaker, G1 and G2 (Idc, I1, I2), (e) currents through the arresters connected in parallel with G1 and G2 (Iarr1, Iarr2).
Energies 16 07297 g013
Disclaimer/Publisher’s Note: The statements, opinions and data contained in all publications are solely those of the individual author(s) and contributor(s) and not of MDPI and/or the editor(s). MDPI and/or the editor(s) disclaim responsibility for any injury to people or property resulting from any ideas, methods, instructions or products referred to in the content.