Abstract
The Smart Readiness Indicator (SRI) was included in the third version of the Energy Performance of Buildings Directive (EPBD) and has since been used in research involving a variety of building types and climate zones. While numerous studies highlighted the qualitative characteristics of the current SRI framework, this work describes a methodology for adding quantitative features to it. It uses indicators for each effect area and proposes multiple standards as rating assessment factors. We specify the integration of this crucial component enhancing the framework. This enhanced framework is applied to a hypothetical use case, and the outcomes are compared with those of the current framework. The results demonstrate that the SRI score was increased after adding quantitative elements to the SRI framework.
1. Introduction
Buildings are major contributors to energy consumption in any city [1]. This is no different for countries in the European Union (EU). Buildings amount to up to 40% of the energy consumption in the European Union (EU) [2]. The Energy Performance of Buildings Directive (EPBD) has further highlighted the massive potential for energy savings via working on buildings and the related energy efficiencies. Adding to this statistic, recent events in Ukraine have put the spotlight on EU’s dependence on Russia with regards to energy, consequently reviving the debate about energy and energy efficiency. Smart buildings have become a hot topic for research in the EU as they have the potential to achieve the energy goals set by the European commission. Smartness, with reference to a building, can be referred to as a building’s ability to sense, interpret, communicate and actively respond efficiently to ever-changing environments with respect to three main aspects, namely building technical operation, external factors such as grids and building occupants [3,4].
Smart buildings are a result of the digitization efforts made towards how energy is generated, transmitted and utilized with regards to buildings [5]. Smart buildings are part of the larger scheme which includes the synergies among the Energy and the Information and Communication Technology (ICT) industries. This synergy allowed for the development of smart grids becoming connected with smart buildings, as well as with renewable energy generation sources [6]. It also allowed for buildings to become better equipped with the fluctuating demand, while also becoming prosumers in cases of low demand [7]. In this new paradigm, it is important for smart buildings to perform at the optimum level in order to meet the demand and still be energy efficient [8]. For this purpose, many indicators and metrics have been developed to judge a building’s performance from different aspects.
Many sustainability rating systems have been developed for the purpose of judging a building’s performance [9]. From a holistic point of view, there are three major categories of this type of rating system:
- Cumulative Energy Demand (CED) systems, which only focus on energy consumption criteria. A good example of CED is the Energy Performance Certificate (EPC), which is internationally standardized and was introduced under the European standard of EN 15217 [10]. The purpose of EPC is to standardize, to facilitate regulations and encourage people to improve the performance of buildings affecting renovation rates, costs, emissions and energy consumption [11]. In the EU, Finland uses EPC as a legally mandatory rating scheme for buildings. In EPC, the value for E is calculated by evaluating factors like outer walls, doors, windows, roof, floor, heating system, domestic water system, ventilation system, lighting, cooling system, additional electrical heating systems and other systems affecting building energy usage [12].
- Life Cycle Analysis (LCA) has a focus on environmental factors like emissions only [13]. Total Quality Assessment (TQA) is a multi-criteria system and focuses not only on the economic but also the environmental and social factors [14]. A good example for TQA is Green Public Procurement (GPP), which was introduced as a result of guidelines for TQA by the European commission. GPP is not necessarily a rating system; rather, it gives sustainable and environmentally friendly suggestions related to material procurement for buildings [15]. The GPP system is based on two versions: the core one which offers a much easier implementation of the methodology and the comprehensive one offering an extensive implementation of the methodology.
- Another scheme under TQA is the Building Research Establishment Environmental Assessment Method (BREEAM), which was established in the UK. It is a certification scheme. BREEAM is based on extensive life-cycle sustainability performance criteria for buildings, including land use, material use and pollution [16]. The main objective of BREEAM is to reduce life cycle impact, recognize environmental benefits and to encourage the demand and value of energy-efficient buildings.
- Another example of sustainable rating systems is the international Common Carbon Metric by the United Nations Environment Program’s Sustainable Buildings and Climate Initiative (UNEP-SBCI). It measures energy use and reports Greenhouse Gas (GHG) emissions from building operations [17].
Apart from sustainability rating systems, there are various rating systems for buildings that do not just focus on one parameter and fall into multiple categories. The Smart Readiness Indicator (SRI) is one such rating system. SRI primarily focuses on the technical aspects of a smart building. An SRI can be defined as a parameter which simply provides information on the readiness of any given building with respect to the three aspects mentioned in the above definition of smartness, namely, the technical operation of the building, the external environment (communication with the grid) and the residents of the building. The SRI was introduced in 2018 via the European parliament where the main objective for the SRI was set as, an indicator which should be able to measure a building’s capacity to use information and communication technologies electronic systems to adjust to occupant needs and the grid to improve energy efficiency and performance. The SRI differs from traditional rating systems by placing emphasis on the degree of automation for each service and its consequent impact, thereby prioritizing the digital readiness of the building. In the two years of its existence, there have been various studies implementing the SRI framework [18,19,20], and some common issues relating to the subjective nature of the framework have been pointed out.
The novelty of this work is attributed to the fact that it proposes an improvement in the current framework by introducing quantitative elements for the key functionality Energy Savings and Operation with the impact criteria Energy Savings and Maintenance and Fault Prediction, and the key functionality Respond to User Needs with the impact criteria Comfort and Health and Wellbeing. This will elevate the possibilities for a wider adaptation of the SRI framework while also partially tackling the subjectivity introduced by it (i.e., limited smart technologies/services in a building).
The rest of this paper is structured as follows: Section 2 presents a literature review. Section 3.1 points out the contribution of this work, while Section 3 proposes improvements for the current SRI framework by integrating a quantitative scheme. Section 4 presents the results of the proposed approach, also offering a comparison with the existing framework. Finally, Section 5 contains concluding remarks and highlights the main findings of this work, along with implications and future directions.
2. Related Work
The rating systems discussed in Section 1 evaluate traditional buildings in a proper manner, yet they do not fully address the “smart” aspects of modern structures. The SRI was developed with the purpose of creating a framework that assesses a building’s technological readiness to interact with the occupants and energy grids, considering its ability to be energy efficient in its operations through the use of ICT technologies [21]. In accordance with this purpose, the SRI focuses on three key areas, namely, (i) occupant needs, (ii) interaction with the grid and (iii) energy-efficient operation. To foster the development of the SRI framework, a total of two technical studies were organized. The first technical study [3] came up with the actual definition and draft methodology for the framework. The SRI framework largely depends on an inventory of smart ready services which could be present in a building and an inspection of functionalities these services can offer. There is a degree of ‘smartness’ to which these functionalities operate. This means from manual control to an automated system with a feedback loop.
Some important terminologies related to the SRI framework are (i) domains, (ii) impact criteria (areas) and (iii) functionalities. Functionalities are basically the degrees of smartness. The services in any given building operate in certain domains and have an impact on certain areas. To include all the domains and the impact criteria, a multi-criteria framework was developed in the first technical study. The total domains and impact criteria are presented in Table 1.

Table 1.
Energy performance.
The associated functionality levels vary for each domain. In some domains there are a maximum of four functionality levels starting from zero. In some domains, there are only three levels of functionality. The SRI assessment is flexible in a way that its assessment can either be done by an individual with a checklist (a brief assessment), or it can be done by an expert (a detailed assessment).
For an SRI assessment, the first step is to determine the building type and climate zone. After selecting the appropriate smart service catalogue, the domains present in the building are identified and their respective functionality levels are assessed. All steps up until this point are manual and require user interaction. In the next step, actual domain scores are allocated per available service in the building. These scores are expressed as percentages of the actual rating and the highest possible rating. A sum of all the domains and impact criteria is then taken. For the weightings, the average of the impact criteria is taken to calculate the scores for three main impact criteria (occupant needs, interaction with grid and energy efficient operation). Lastly, a final average is taken to calculate the SRI score. The detailed step by step SRI assessment is depicted in Figure 1.
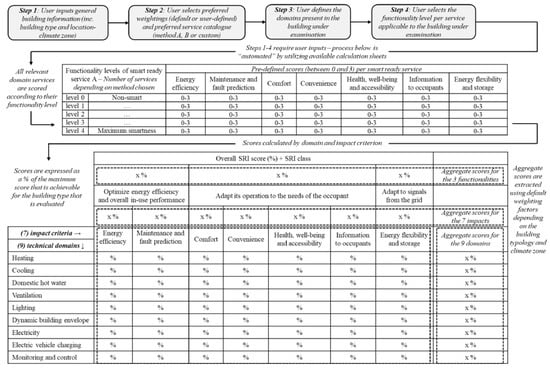
Figure 1.
SRI assessment methodology [22].
Multiple studies have been conducted ever since the introduction of the SRI framework in 2018. The authors of reference [2] studied the implementation of the SRI in northern European countries and concluded that, with the current SRI concept, it is incapable of recognizing the peculiarities of cold climate buildings. Furthermore, the study stated that the subjective nature of the selection of proposed services will cause problems in the implementation of the SRI throughout the EU states. Addressing this subjective nature issue, in reference [23], two teams of experts were used to analyze and give recommendation for the effective and broad application of the SRI. In reference [18], it is stated that the SRI can be harsh for buildings that have no building management system.
The root cause for the problems in the implementation of the SRI in cold climate countries is the smart services catalog. While some services are not mentioned altogether, certain services like District Heating (DH) are mentioned, but not along with their full capabilities. The reason why this is important is because this affects the number of smart services being considered, which consequently affect the SRI scoring. Moreover, the triage process (the calculation methodology) is problematic because it only considers the services that are available in the building for the SRI score. This makes the SRI score not very appropriate for comparison with multiple buildings, as buildings with fewer services tend to score higher due to the inherent calculation method.
Lastly, the subjective nature of the the SRI compromises its legitimacy. This means that the act of selecting relevant smart-ready services is not exactly black and white. It is open to misinterpretation which makes it subjective. So, each expert might come up with a different understanding of the building, therefore the SRI score will vary. The framework was initially approved due to its inherent flexibility, which is derived from the subjective nature of the framework. Thus, the primary objective of the framework was to establish a standardized score that could enable comparisons across various European countries. However, subsequent to the implementation studies, the existing body of literature appears to indicate that there is a trade-off between flexibility and comparability. The acquisition of one necessitates the compromise of the other. The main contribution of this work is the presentation of an approach (Section 3.1) to address the aforementioned issue.
3. Research Design
3.1. Proposal for the Quantitative Assessment
Multiple studies, which focused on the implementation of the SRI framework (Section 2), concluded that the SRI assessment methodology is too subjective. Thus, future work suggestions related to adding more quantitative measures were presented. In reference [24], the authors proposed a quantitative method for energy flexibility in the SRI framework. It introduced a mathematical model which would determine a building’s load-shifting capability. This work builds upon this conception, proposing a quantitative method that only proposes improvements for the key functionalities and impact criteria marked with red in Figure 2. More specifically, these include the key functionality Energy Savings and Operation with the impact criteria Energy Savings and Maintenance and Fault Prediction, and the key functionality Respond to User Needs with the impact criteria Comfort and Health and Wellbeing. The impact criteria of energy flexibility and storage were not considered in this study since their quantitative aspects have been already investigated [24]. As for the impact criteria of convenience and information to occupants, the rationale for their exclusion stems from the lack of established quantitative criteria to be utilized for their assessment in the current literature.

Figure 2.
Impact criteria targeted for improvement in this paper.
3.2. Standards/Indicators Used for the Quantitative Assessment
In order to add a quantitative element, certain indicators must be set that can represent the impact criteria. It is important to note that the proposed indicators are not fixed and may be changed to an appropriate indicator depending on the state in which it is applied. Since the SRI is a flexible framework, it allows the member states to modify the framework (by changing weightings); similar flexibility is proposed in this methodology. The main contribution is the development of a scoring criteria and the use of quantitative performance benchmarks to reduce the subjectivity of the results, focusing on specific SRI key functionalities. The selection of these performance benchmarks might be up to the member state.
3.2.1. Energy Savings and Operation
Table 2 summarizes the indicators for the key functionality Energy Savings and Operations, while further elaboration on each indicator follows.
Table 2.
Energy performance indicators.
For the Energy Savings impact criteria, a performance benchmark is needed in order to get a reference value and assign a score. EPCs can help with this as they usually contain the information related to energy consumption, as well as the total floor area. Thus, Energy Use Intensity (EUI) can be calculated. For making the decision, the value for EUI can be compared with similar buildings using the EPC information to assign a score. The information of other buildings can be retrieved based on the EPBD per country [25], allowing for comparisons to be made.
For the Maintenance and Fault Prediction impact criterion, the following metrics can help in a quantitative evaluation:
- Mean Time Between Failures (MTBF): MTBF is a metric that measures the average time between failures of a building system or component. It provides an indication of how frequently failures occur and can be used as a benchmark to evaluate the effectiveness of maintenance practices. A longer MTBF suggests that maintenance efforts are successful in preventing failures and extending the operational life of the equipment or system.
- Mean Time to Repair (MTTR): MTTR measures the average time required to repair a failed system or component. It can be used as a benchmark to assess the efficiency of maintenance processes. A shorter MTTR indicates that maintenance teams are effectively identifying and addressing faults, minimizing downtime and restoring normal operation promptly.
- Predictive Maintenance Accuracy (PMA): In the context of fault prediction, the accuracy of predictions can serve as a performance benchmark. This can be evaluated by comparing the predicted faults or maintenance needs with the actual occurrences. Metrics like true positive rate, false positive rate and predictive accuracy can be used to assess the effectiveness of fault prediction methods and algorithms.
The selection of a metric from the options listed above is dependent on the accessibility of the data. The values for these metrics can be obtained from building maintenance logbooks. The metric values can be informed by comparing the numerical values with reference values collected from similar buildings, as the specific values of these metrics may vary depending on the type of building under consideration. Such a comparison with reference values will aid in the scoring phase.
3.2.2. Respond to User Needs
Table 3 summarizes the indicators for the key functionality Respond to User Needs, while further elaboration on each indicator follows.
Table 3.
Response to user needs indicators.
The impact criterion Comfort has been assigned the indicators discussed below:
- Thermal Comfort (TC): This refers to the subjective perception of comfort related to the temperature and airflow within a space. The following metrics are used to evaluate thermal comfort:
- –
- Predicted Mean Vote (PMV): PMV is a widely accepted index that predicts the average thermal sensation of a group of occupants.
- –
- Predicted Percentage of Dissatisfied (PPD): PPD estimates the percentage of occupants who may feel dissatisfied with the thermal conditions.
- –
- Operative Temperature (OT): It is the average of the air and mean radiant temperatures, which are important factors in determining thermal comfort.
The method for calculating PMV is the same as the one developed by Fanger [26]. Prior to conducting any building assessment, it is essential to collect the necessary data. This involves obtaining measurements for air temperature, radiant temperature, relative humidity, air velocity and clothing insulation. The desired outcome can be attained through the utilization of sensors in conjunction with a comprehensive survey. After the calculation of PMV, the estimation of PPD can be achieved by employing a formula that establishes the relationship between PPD and PMV, as outlined in ASHRAE standard 55 [27].
- Visual Comfort (VC): VC indicators assess the quality and appropriateness of lighting conditions within a space. Some common metrics include:
- –
- Daylight Factor (DF): This measures the amount of natural light available in a space relative to the total light available outdoors.
- –
- Unified Glare Rating (UGR): This quantifies the discomfort glare caused by lighting fixtures and luminaires.
The process for determining the UGR involves a room by room assessment if deemed necessary. It includes identifying the area, the luminance values (measured using a lux meter) and the solid angle (the angle formed by the task area as seen from the position of the observer). These values are then inserted into the UGR formula, as mentioned in the EN 12464-1 [28] standard, in order to obtain the final rating.
- Acoustic Comfort (AC): AC indicators evaluate the sound levels and acoustic quality within a space. Some metrics for assessing acoustic comfort are as follows:
- –
- Sound Pressure Level (SPL): This measures the intensity of sound within a space.
- –
- Noise Criteria (NC): NC curves define the acceptable noise levels in different spaces based on their use and function.
The process for obtaining acoustic data measurements involves the identification of sound sources within the building and then the utilization of a sound level meter to quantify the SPL in decibels at these specific locations.
The reference values needed in order to give a score for these indicators are discussed below:
- Thermal Comfort (TC):
- –
- ASHRAE Standard 55 [27]: This standard provides guidance on TC in occupied spaces. It recommends a PMV range of −0.5 to +0.5 and a PPD of less than 10% for TC in most situations.
- –
- ISO 7730 [29]: This international standard provides a framework for evaluating TC and recommends a PMV range of −0.5 to +0.5 for TC in office environments.
- Visual Comfort (VC):
- –
- Illuminating Engineering Society of North America (IESNA) Lighting Handbook [30]: This handbook provides lighting design guidelines and suggests a daylight factor of 2–5% for general VC in offices.
- –
- Unified Glare Rating (UGR) standards [31]: UGR values are used to assess the discomfort glare caused by luminaires. For example, UGR values of less than 19 are typically recommended for comfortable office environments.
- Acoustic Comfort:
- –
- ISO 3382-1 [32]: This international standard specifies measurement methods for evaluating room acoustics. It sets thresholds for background noise levels, reverberation time and speech intelligibility
- –
- ANSI S12.60 [33]: This American National Standard provides guidelines for classroom acoustics and recommends specific criteria for background noise levels, sound absorption and speech intelligibility.
The impact criterion Health and Wellbeing has been assigned the indicators discussed below:
- Indoor Air Quality (IAQ): IAQ indicators assess the quality and cleanliness of the indoor air. Common metrics for IAQ include:
- –
- Carbon Dioxide () levels: Elevated levels can indicate poor ventilation and may lead to discomfort and reduced cognitive function.
The calculation of levels in a building necessitates the execution of an analysis concerning the zoning of the building. The layout of the building will determine the crucial positions where the sensors should be placed. In the majority of modern buildings, strategically placed sensors facilitate the seamless acquisition of data.
The reference values for these indicators are discussed below:
- ASHRAE Standard 62.1 [34]: This standard provides ventilation guidelines for acceptable indoor air quality. It recommends maximum levels of 700–1000 Parts Per Million (PPM) above outdoor levels for comfort.
- EPA Indoor Air Quality Guidelines [35]: The U.S. Environmental Protection Agency provides guidelines for indoor air quality parameters such as Volatile Organic Compounds (VOCs), particulate matter (PM2.5 and PM10) and other contaminants.
3.3. Coupling of Quantitative Measures with the Current SRI Framework
In the proposed method, a 50% quantitative score and 50% qualitative score will contribute to the final score, as shown in Figure 3. The decision to proceed with a 50–50 ratio between qualitative and quantitative scores in the SRI framework is based on insights gained from the literature review, which highlight a trade-off between the flexibility and comparability of scores.
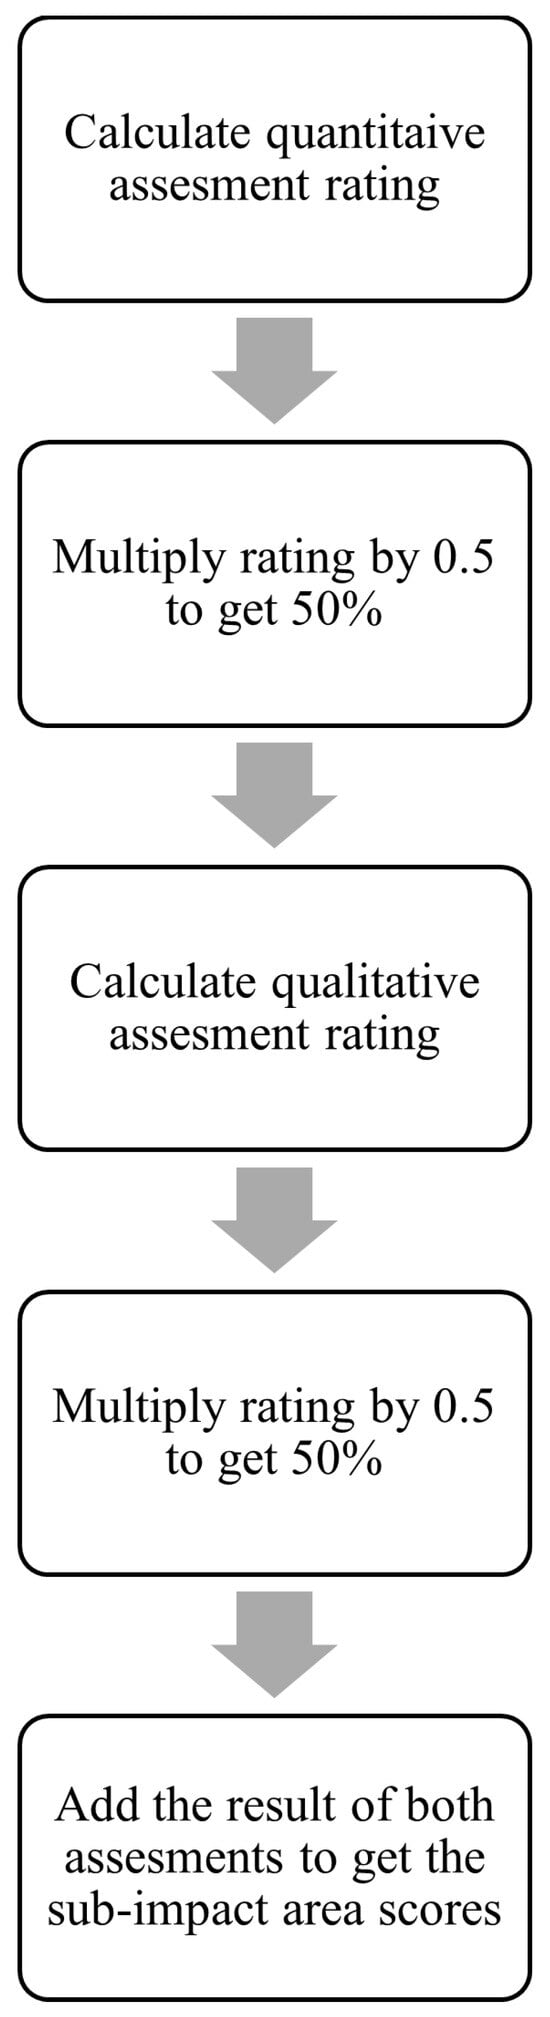
Figure 3.
Coupling of qualitative and quantitative assessments.
For the purpose of elaboration, some cases are discussed below to show how different impact criteria in the building will be scored under the proposed scoring criteria and how that score will be coupled with the existing framework. The process flow for this decision criteria is shown in Figure 4.
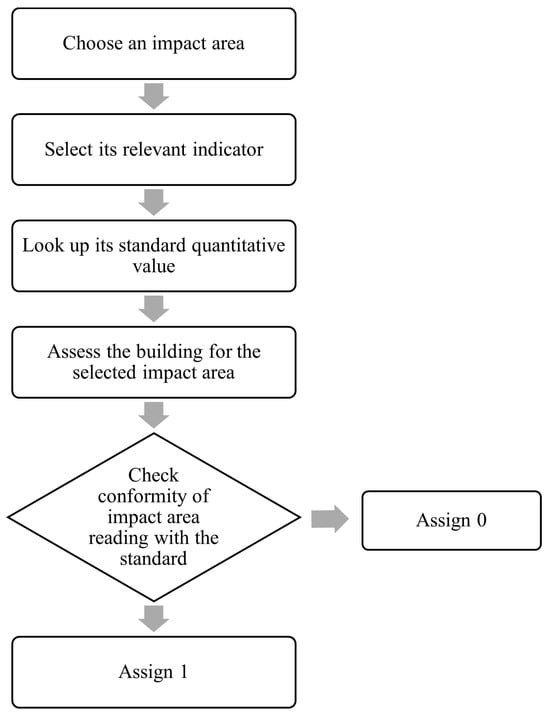
Figure 4.
Criteria for quantitative assessment.
- If a building is able to achieve the EUI benchmark value mentioned in the EPC certificate, then it will have a score of one from the quantitative framework. This quantitative framework has a total weighting of 50% in the whole SRI framework and the other 50% belongs to the existing SRI framework.
- For the Maintenance and Fault Prediction impact criterion, if the building being assessed is found to be non-compliant with the existing MTBF or MTTR (reference value can be taken from other similar buildings), then it scores zero in the quantitative framework. This way, the building scores zero from the quantitative side and its score will depend on how it performs from the qualitative side.
- For the impact criterion Comfort, as mentioned in the previous section, it has three different indicators and the building must be in compliance with all three in order to obtain a score of one from the quantitative framework. If it fails in any one of the indicators, it scores a zero, as all three indicators ensure a state of comfort in the building. In any case, the 50% of this quantitative score will be added to the overall SRI score.
- For the impact criterion Health and Wellbeing, if a given building has satisfactory levels of , meaning it complies with the standards in place, it will be given a score of 1. If it does not comply with the standards, it will score 0. Then, 50% of this score will be taken and added to the 50% of the qualitative assessment.
4. Results and Analysis
To gain a deeper comprehension of the potential effects of the proposed methodology, it has been decided that an SRI multi-criteria score of a building, as presented in reference [3], should be utilized. Thus, modifications were implemented on this existing SRI score by incorporating assumptions regarding the quantitative indicators that assess the performance of the building. It is noteworthy that explicit computations were not performed; nevertheless, the approaches employed for obtaining results are discussed in both Section 3 and the present section. The quantitative indicators, along with the assumed building performance and the method for obtaining these measurements, are discussed in the following points. The SRI score with the old framework is shown in Table 4.
Table 4.
Obsolete SRI framework results.
- For the impact criterion Energy Savings, it is assumed that the building under consideration fulfils the standard for EUI, meaning that, if the value for EUI is 20 kWh/ft2/year, which is calculated with the help of information from EPC (Annual Energy consumption/Total floor area), and if the acceptable range for similar buildings is found to be around 20 kWh/ft2/year in the EPCs, in that case, the building conforms with the standard, and thus a score of one is given (Table 5).
- For the impact criterion Maintenance and Fault Prediction, it is assumed that the building fails to meet the specified quantitative criterion and the metric is considered to be the MTTR. The information for the MTTR is retrieved from the building maintenance logbook and then compared with the MTTR value of other similar buildings (Table 6).
- For the impact criterion Comfort, three sub-impact criteria are taken into consideration, i.e., TC, AC and VC. For the TC, it is supposed that the building scored 0.1 in PMV and 5% in PPD, which is in compliance with the ASHRAE standard 55. For the AC, it is assumed that the building satisfies the sound level indicated in ISO 3382-1. Similarly, for the VC, it is assumed that the building rooms have a UGR value less than 19. Given these TC, AC and VC values, the building satisfies all categories of comfort, so a score of one is assigned (Table 7).
- For the impact criterion Health and Wellbeing, it is assumed that the building rooms comply with the ASHRAE Standard 62.1, having levels between 700 and 1000 PPM. Therefore, a score of one is assigned using PPM as a standard (Table 8).
Table 5.
Energy savings.
Table 5.
Energy savings.
| Qualitative Score1 | Quantitative Score2 | Sum1+2 |
|---|---|---|
| 0.39 × 0.5 | 0.5 | 69.5% |
Table 6.
Maintenance and fault prediction.
Table 6.
Maintenance and fault prediction.
| Qualitative Score1 | Quantitative Score2 | Sum1+2 |
|---|---|---|
| 0.18 × 0.5 | 0 | 9% |
Table 7.
Comfort.
Table 7.
Comfort.
| Qualitative Score1 | Quantitative Score2 | Sum1+2 |
|---|---|---|
| Thermal = 0.33 | ||
| Acoustic = 0.33 | ||
| Visual (lighting) = 0.33 | ||
| 0.60 × 0.5 | Total = 1 × 0.5 | 80% |
Table 8.
Health and wellbeing.
Table 8.
Health and wellbeing.
| Qualitative Score1 | Quantitative Score2 | Sum1+2 |
|---|---|---|
| 0.48 × 0.5 | 1 × 0.5 | 74% |
The outcomes of the individual smart-ready impact criteria assessments are consolidated to form a final comprehensive SRI score, which quantifies the degree of proximity of the building to achieve maximum smart readiness. Thus, the calculation of the SRI score involves the assignment of a percentage value to each impact criterion, leading to the estimation of the overall SRI score. An SRI score of 100% denotes a building’s perfect capacity to interact with its occupants and the energy networks/grids.
In the present study, following the compilation of scores derived from the impact criteria, the resulting values are utilized to generate a domain–impact matrix. Subsequently, the scores are re-calibrated, leading to the acquisition of a revised SRI percentage, as indicated in the final column of Table 9. The proposed modifications in the standard SRI framework have resulted in a 10% increase in the final score. The observed increase can be attributed to the inherent scoring methodology employed according to the proposed quantitative assessment framework. Given a score of one, if the building meets a quantitative criterion, it is ensured that a minimum score of 50% is attained, thereby resulting in an increase in the overall SRI score.
Table 9.
Updated SRI framework results.
Table 9.
Updated SRI framework results.
| Energy Savings | Maintenance and Fault Prediction | Comfort | Convenience | Health and Wellbeing | Information to Occupants | Energy Flexibility and Storage | SRI | |
|---|---|---|---|---|---|---|---|---|
| Heating | 39% | 18% | 62% | 55% | 24% | 74% | 0% | - |
| Sanitary hot water | 17% | 0% | 45% | 70% | 67% | 83% | 0% | - |
| Cooling | 65% | 51% | 78% | 72% | 61% | 55% | 0% | - |
| Controlled ventilation | 41% | 0% | 55% | 60% | 34% | 44% | 0% | - |
| Lighting | 85% | 14% | 90% | 100% | 83% | 15% | 0% | - |
| Dynamic building envelope | 10% | 0% | 31% | 56% | 22% | 46% | 0% | - |
| Electricity | 10% | 0% | - | - | - | 68% | 0% | - |
| Electric vehicle charging | - | 38% | - | 82% | - | 84% | 0% | - |
| Monitoring and control | 52% | 43% | 62% | 72% | 45% | 64% | 0% | - |
| Total | 69.5% | 9% | 80% | 71% | 74% | 59% | 0% | 52% |
5. Conclusions
This paper proposes a novel quantitative approach to the existing SRI framework by using various standards. The SRI was introduced as a result of a new regulation in EPBD. The current framework of the SRI mainly consists of qualitative methods. As previous studies have highlighted, there is a clear need to add quantitative elements to the current framework. The methodology proposed in this paper addresses this research gap. It mainly builds on the existing qualitative framework and extends by adding quantitative elements. More specifically, this paper introduced a method to make the framework more objective by addressing the key functionality Energy Savings and Operation with the impact criteria Energy Savings and Maintenance and Fault Prediction, and the key functionality Respond to User Needs with the impact criteria Comfort and Health and Wellbeing. Quantitative elements are added by identifying indicators and establishing standards using available sources. In addition, the proposed approach offers a way to integrate the quantitative elements with the existing qualitative framework. With more quantitative elements included, this paper makes the SRI framework more objective and the SRI score more comparable among different buildings.
5.1. Implications
The adoption of the proposed modifications of the current SRI assessment methodology would have significant real-world implications, which are discussed as follows:
- The current SRI methodology has a greater dependence on the manner in which the building is evaluated. This particular method of evaluation introduces subjectivity into the scoring process, hence posing challenges in comparing the results of buildings across different European nations. Nevertheless, the suggested changes would enable individuals to render quantitative assessments, leading to a standardized score that would be more universally applicable and comparable.
- The adoption of a more objective and standardized SRI methodology would provide policymakers with more reliable data on building smart readiness. These data could be used to develop more effective and targeted policies to incentivize the adoption of smart technologies in buildings, promoting energy efficiency and sustainability.
- With a standardized SRI methodology, investors and stakeholders from different European nations would have a more reliable basis for assessing the smart readiness of buildings across borders. This increased confidence in the SRI scores could stimulate cross-border investments in energy-efficient and smart buildings.
- By providing a quantitative and comparable assessment of smart readiness, this would allow the facilitating of the transfer of best practices and smart technologies between different buildings and countries. This knowledge exchange could lead to accelerated advancements in smart building solutions.
- By making the SRI methodology more objective and standardized, the reliability and accuracy of the smart readiness assessment will improve. When integrated with the EPC, this comprehensive evaluation can provide a more holistic understanding of a building’s overall performance, encompassing both its energy efficiency and its smart features.
5.2. Future Work
The future work on the SRI framework shall continue the attempts to make the framework more objective. In reference [24], the authors proposed a mathematical model to address the SRI key functionality Respond to the needs of the grid and made an attempt to make it more objective and quantitative. The next step should be to combine this quantitative methodology with the one proposed in this paper and come up with an improved framework which would take advantage of both qualitative and quantitative approaches and produce more comparable SRI scores. Also, a much more detailed scoring system could be conceived, where instead of assigning a value of one to buildings that conform with standards, a grading system could be deployed, meaning a variety of different scores (less than one) can be given to variety of readings obtained from the building for different impact criteria.
Author Contributions
Conceptualization, M.T.S. and D.I.; methodology, M.T.S. and P.K.; software, M.T.S.; validation, M.T.S. and P.K.; formal analysis, M.T.S.; investigation, M.T.S., P.K., D.I. and C.T.; resources, D.I.; data curation, M.T.S.; writing—original draft preparation, M.T.S. and P.K.; writing—review and editing, M.T.S., P.K. and C.T.; visualization, M.T.S.; supervision, P.K. and D.I.; project administration, P.K. and C.T.; funding acquisition, C.T. All authors have read and agreed to the published version of the manuscript.
Funding
This research is co-financed by Greece and the European Union (European Social Fund-SF) through the Operational Programme “Human Resources Development, Education and Lifelong Learning 2014–2020” in the context of the project “Support for International Actions of the International Hellenic University”, (MIS 5154651).
Institutional Review Board Statement
Not applicable.
Informed Consent Statement
Not applicable.
Data Availability Statement
The data presented in this study are available upon request from the authors. The data are not publicly available due to working on more research analyses.
Conflicts of Interest
School of Science and Technology, International Hellenic University, Researchers in Information Technologies Institute, Centre for Research and Technology.
Abbreviations
The following abbreviations are used in this manuscript:
| AC | Acoustic Comfort |
| ANSI | American National Standard |
| ASHRAE | American Society of Heating, Refrigerating and Air-Conditioning Engineers |
| BREEAM | Building Research Establishment Environmental Assessment Method |
| Carbon Dioxide | |
| CBECS | Commercial Buildings Energy Consumption Survey |
| CED | Cumulative Energy Demand |
| DF | Daylight Factor |
| DH | District Heating |
| EPBD | Energy Performance of Buildings Directive |
| EPC | Energy Performance Certificate |
| EU | European Union |
| EUI | Energy Use Intensity |
| GHG | Greenhouse Gas |
| GPP | Green Public Procurement |
| IAQ | Indoor Air Quality |
| ICT | Information and Communication Technology |
| IESNA | Illuminating Engineering Society of North America |
| ISO | International Organization for Standardization |
| LCA | Life Cycle Analysis |
| MTBF | Mean Time Between Failures |
| MTTR | Mean Time to Repair |
| NC | Noise Criteria |
| OT | Operative Temperature |
| PMA | Predictive Maintenance Accuracy |
| PMV | Predictive Mean Vote |
| PPD | Predicted Percentage of Dissatisfied |
| PPM | Parts Per Million |
| SPL | Sound Pressure Level |
| SRI | Smart Readiness Indicator |
| TC | Thermal Comfort |
| TQA | Total Quality Assessment |
| UGR | Unified Glare Rating |
| UNEP-SBCI | United Nations Environment Program’s Sustainable Buildings and Climate Initiative |
| VOC | Volatile Organic Compound |
References
- Pérez-Lombard, L.; Ortiz, J.; Pout, C. A review on buildings energy consumption information. Energy Build. 2008, 40, 394–398. [Google Scholar] [CrossRef]
- Janhunen, E.; Pulkka, L.; Säynäjoki, A.; Junnila, S. Applicability of the smart readiness indicator for cold climate countries. Buildings 2019, 9, 102. [Google Scholar] [CrossRef]
- Verbeke, S.; Aerts, D.; Reynders, G.; Ma, Y.; Waide, P. Final Report on the Technical Support to the Development of a smart Readiness Indicator for Buildings; European Commission: Brussels, Belgium, 2020.
- Bäcklund, K.; Molinari, M.; Lundqvist, P.; Palm, B. Building Occupants, Their Behavior and the Resulting Impact on Energy Use in Campus Buildings: A Literature Review with Focus on Smart Building Systems. Energies 2023, 16, 6104. [Google Scholar] [CrossRef]
- Froufe, M.M.; Chinelli, C.K.; Guedes, A.L.A.; Haddad, A.N.; Hammad, A.W.; Soares, C.A.P. Smart buildings: Systems and drivers. Buildings 2020, 10, 153. [Google Scholar] [CrossRef]
- Koukaras, P.; Tjortjis, C.; Gkaidatzis, P.; Bezas, N.; Ioannidis, D.; Tzovaras, D. An interdisciplinary approach on efficient virtual microgrid to virtual microgrid energy balancing incorporating data preprocessing techniques. Computing 2021, 104, 209–250. [Google Scholar] [CrossRef]
- Koukaras, P.; Gkaidatzis, P.; Bezas, N.; Bragatto, T.; Carere, F.; Santori, F.; Antal, M.; Tjortjis, C.; Tzovaras, D. A Tri-Layer Optimization Framework for Day-Ahead Energy Scheduling Based on Cost and Discomfort Minimization. Energies 2021, 14, 3599. [Google Scholar] [CrossRef]
- Koukaras, P.; Bezas, N.; Gkaidatzis, P.; Ioannidis, D.; Tzovaras, D.; Tjortjis, C. Introducing a novel approach in one-step ahead energy load forecasting. Sustain. Comput. Inform. Syst. 2021, 32, 100616. [Google Scholar] [CrossRef]
- Fowler, K.M.; Rauch, E.M. Sustainable Building Rating Systems Summary; Technical Report for Pacific Northwest National Lab; PNNL: Richland, WA, USA, 2006. [Google Scholar]
- Kolesnik, E.; Splavska, V.; Farenyuk, E.; Farenyuk, G.; Deshko, V.; Strelkova, G.G.; Sukhodub, I.; Shevchenko, O.; Ageeva, G.M.; Ageeva, G.N.; et al. DSTU B EN 15217: 2013 Energy Efficiency of Life. Methods for Presenting Energy Performance and Energy Certification Life; Technical Report for Ministry of Ukraine; Ministry of Ukraine: Kyiv, Ukraine, 2014.
- Ferrantelli, A.; Kurnitski, J. Energy Performance Certificate Classes Rating Methods Tested with Data: How Does the Application of Minimum Energy Performance Standards to Worst-Performing Buildings Affect Renovation Rates, Costs, Emissions, Energy Consumption? Energies 2022, 15, 7552. [Google Scholar] [CrossRef]
- Li, Y.; Kubicki, S.; Guerriero, A.; Rezgui, Y. Review of building energy performance certification schemes towards future improvement. Renew. Sustain. Energy Rev. 2019, 113, 109244. [Google Scholar] [CrossRef]
- Bragança, L.; Mateus, R. Life-Cycle Analysis of Buildings: Envirnonmental Impact of Building Elements; Associacao iiSBE Portugal: Guimaraes, Portugal, 2012. [Google Scholar]
- Berardi, U. Sustainability assessment in the construction sector: Rating systems and rated buildings. Sustain. Dev. 2012, 20, 411–424. [Google Scholar] [CrossRef]
- Chersan, I.C.; Dumitru, V.F.; Gorgan, C.; Gorgan, V. Green public procurement in the academic literature. Amfiteatru Econ. 2020, 22, 82–101. [Google Scholar] [CrossRef]
- Kubba, S. Handbook of Green Building Design and Construction: LEED, BREEAM, and Green Globes; Butterworth-Heinemann: Oxford, UK, 2012. [Google Scholar]
- Programme, U.N.E. Common Carbon Metric for Measuring Energy Use and Reporting Greenhouse Gas Emissions from Building Operations. 2009. Available online: https://wedocs.unep.org/20.500.11822/7922 (accessed on 27 September 2023).
- Fokaides, P.A.; Panteli, C.; Panayidou, A. How are the smart readiness indicators expected to affect the energy performance of buildings: First evidence and perspectives. Sustainability 2020, 12, 9496. [Google Scholar] [CrossRef]
- Ramezani, B.; da Silva, M.G.; Simões, N. Application of smart readiness indicator for Mediterranean buildings in retrofitting actions. Energy Build. 2021, 249, 111173. [Google Scholar] [CrossRef]
- Ożadowicz, A. A Hybrid Approach in Design of Building Energy Management System with Smart Readiness Indicator and Building as a Service Concept. Energies 2022, 15, 1432. [Google Scholar] [CrossRef]
- Varsami, V.; Burman, E. An Evaluation of the Smart Readiness Indicator proposed for Buildings. In Proceedings of the Building Simulation 2021 (BS2021), Proceedings of Building Simulation 2021 Conference, Bruges, Belgium, 1–3 September 2021. [Google Scholar]
- Apostolopoulos, V.; Giourka, P.; Martinopoulos, G.; Angelakoglou, K.; Kourtzanidis, K.; Nikolopoulos, N. Smart readiness indicator evaluation and cost estimation of smart retrofitting scenarios-A comparative case-study in European residential buildings. Sustain. Cities Soc. 2022, 82, 103921. [Google Scholar] [CrossRef]
- Vigna, I.; Pernetti, R.; Pernigotto, G.; Gasparella, A. Analysis of the building smart readiness indicator calculation: A comparative case-study with two panels of experts. Energies 2020, 13, 2796. [Google Scholar] [CrossRef]
- Märzinger, T.; Österreicher, D. Supporting the smart readiness indicator—A methodology to integrate a quantitative assessment of the load shifting potential of smart buildings. Energies 2019, 12, 1955. [Google Scholar] [CrossRef]
- EPBD. Directive (EU) 2018/844 of the European Parliament and of the Council of 30 May 2018 Amending Directive 2010/31/EU on the Energy Performance of Buildings and Directive 2012/27/EU on Energy Efficiency. Available online: https://eur-lex.europa.eu/legal-content/EN/TXT/?uri=uriserv (accessed on 26 September 2023).
- Fanger, P.O. Thermal Comfort. Analysis and Applications in Environmental Engineering; Danish Technical Press: Copenhagen, Denmark, 1970. [Google Scholar]
- ASHRAE Standard 55; Thermal Environmental Conditions for Human Occupancy. ASHRAE: Peachtree Corners, GA, USA, 2020. Available online: https://www.ashrae.org/technical-resources/bookstore/standard-55-thermal-environmental-conditions-for-human-occupancy (accessed on 27 September 2023).
- DIN EN 12464-1; Light and Lighting—Lighting of Work Places. European Standard: Plzen, Czech Republic, 2021. Available online: https://www.en-standard.eu/din-en-12464-1-light-and-lighting-lighting-of-work-places-part-1-indoor-work-places/ (accessed on 24 September 2023).
- ISO 7730:2005; Ergonomics of the Thermal Environment—Analytical Determination and Interpretation of Thermal Comfort Using Calculation of The Pmv and Ppd Indices and Local Thermal Comfort Criteria. ISO: Geneva, Switzerland, 2005. Available online: https://www.iso.org/standard/39155.html (accessed on 26 September 2023).
- Rea, M. Illumination Engineering Society of North America (IESNA) Lighting Handbook; Illuminating Engineering Society of North America: New York, NY, USA, 2000. [Google Scholar]
- CIE 117-1995; Discomfort Glare in Interior Lighting. CIE: Vienna, Austria, 1995. Available online: https://cie.co.at/publications/discomfort-glare-interior-lighting (accessed on 29 September 2023).
- ISO 3382-1:2009; Acoustics—Measurement of Room Acoustic Parameters. ISO: Geneva, Switzerland, 2009. Available online: https://www.iso.org/standard/40979.html (accessed on 26 September 2023).
- ANSI/ASA S12.60 (R2015). Available online: https://webstore.ansi.org/standards/asa/ansiasas12602010partr2015 (accessed on 28 September 2023).
- ASHRAE Standard 62.1-2019; Ventilation for Acceptable Indoor Air Quality. ASHRAE: Geneva, Switzerland, 2019. Available online: https://www.ashrae.org/news/hvacrindustry/updated-standard-62-1 (accessed on 28 September 2023).
- EPA. IAQ 402/F-08/008—Care for Your Air: A Guide to Indoor Air Quality. Available online: https://www.epa.gov/sites/default/files/2014-08/documents/careforyourair.pdf (accessed on 25 September 2023).
Disclaimer/Publisher’s Note: The statements, opinions and data contained in all publications are solely those of the individual author(s) and contributor(s) and not of MDPI and/or the editor(s). MDPI and/or the editor(s) disclaim responsibility for any injury to people or property resulting from any ideas, methods, instructions or products referred to in the content. |
© 2023 by the authors. Licensee MDPI, Basel, Switzerland. This article is an open access article distributed under the terms and conditions of the Creative Commons Attribution (CC BY) license (https://creativecommons.org/licenses/by/4.0/).