Article

Combustion Behaviors and Unregular Emission Characteristics in an Ammonia–Diesel Engine

1
School of Vehicle and Mobility, Tsinghua University, Beijing 100084, China
2
Department of Mechanical Engineering, Xi’an Jiaotong University City College, Xi’an 710018, China
*
Author to whom correspondence should be addressed.
Energies 2023, 16(19), 7004; https://doi.org/10.3390/en16197004
Submission received: 31 August 2023 / Revised: 28 September 2023 / Accepted: 1 October 2023 / Published: 9 October 2023
(This article belongs to the Section B: Energy and Environment)

Abstract

:
Ammonia is considered one of the attractive alternatives for fossil fuels to realize carbon neutralization. However, low chemical reactivity limits its use in compression ignition (CI) engines. This study investigated dual-fuel combustion, involving the use of ammonia for port fuel injection (PFI) and diesel for direct injection (DI) in a heavy-duty engine. Unregular emissions, specifically HCN, were studied for the first time in an ammonia–diesel engine. The combustion and emission performance of the engine with pure diesel mode was also studied to reveal the influence on ammonia addition. The engine was consistently operated at a fixed condition of 0.556 MPa IMEP and 800 r/min. The findings reveal the successful achievement of stable dual-fuel combustion in the tested engine. The addition of ammonia led to delayed ignition and an extended combustion duration. Implementing early pilot injection timing (SOI1) strategies significantly improved ammonia combustion efficiency, elevating it from 74% to 89%. This enhancement could be attributed to the diesel injected during pilot injection, which facilitated ammonia decomposition. However, early pilot injection had adverse effects on emissions, including CO, THC, NOx, N2O, and HCN. Advancing the main injection timing (SOI2) within the early SOI1 strategies accelerated the oxidation processes for CO, THC, N2O, and HCN. Nevertheless, this adjustment resulted in increased thermal NOx emissions. The highest HCN emission detected in this study was 9.2 ppm. Chemical kinetics analysis indicated that HCN production occurred within the temperature range of 1000 K to 1750 K under fuel-lean conditions. Furthermore, H2CN played a significant role in HCN formation as temperatures increased. More HCN was formed by H2CN as temperature rose. Strategies such as increasing pilot injection fuel quantity, raising premixed gas intake temperature, or advancing combustion phases close to TDC could potentially reduce HCN emissions.

1. Introduction

Over the past three decades, greenhouse gas (GHG) emissions have surged from 23 billion tons of carbon dioxide equivalent (CO2eq) to 37 billion tons CO2eq [1]. Ammonia is considered to be a carbon-free green fuel and alternative to fossil fuels [2,3]. Compared with hydrogen, which is also a zero-carbon fuel, liquid ammonia with the same volume contains more hydrogen than liquid hydrogen, making it an excellent hydrogen energy carrier [4]. Moreover, the lower heat value of ammonia under stoichiometric ratio conditions is comparable to that of hydrogen, only about 15% lower than that of fossil fuels, and the power density of the power system can still be guaranteed with a small boosting intake pressure. Furthermore, ammonia has a very high octane number, which provides excellent knock resistance even at high boosting ratios. More importantly, ammonia is very easily liquefied, which facilitates its transportation, storage, and refilling [4]. In addition, as an important raw material in agricultural and chemical industries, ammonia benefits from well-established production, transportation, and distribution technologies with cost-efficiency. These inherent advantages lay the foundation for the widespread adoption of ammonia as a fuel.
The earliest research on ammonia-fueled engines reported was during the Second World War [2]. In the 1960s, ammonia combustion studies were conducted by Rosenthal et al. on the T63 combustion test rig [5]. They proved that dissociated ammonia can be used to provide satisfactory performance over the engine operating range. However, ammonia was considered unsuitable on compression ignition engines due to its poor chemical reactivity and low flame speed [6]. Cornelius et al. observed that the ignition of ammonia under compression ignition could occur only when the compression ratio exceeded 35 [7]. This conclusion was also supported by [8,9].
Dual-fuel strategies emerged as a solution to expand the operable conditions for ammonia. Gray et al. found that using diesel as the second fuel could decrease the engine compression ratio to 15.2:1 [8]. Pearsall et al. compared fuels with different cetane number (CN) on an ammonia–diesel dual-fuel engine [10], showing that the fuel with low cetane number presented late ignition and loss of power. Bro et al. compared four fuels (ammonia, methanol, ethanol, and methane) ignited by diesel in engine operation [11]. Among these fuels, ammonia exhibited the longest ignition delay and lowest fuel efficiency. Reiter et al. investigated the combustion characteristics and emissions on a John Deere (Model 4045) diesel engine by taking a dual-fuel approach with ammonia and diesel [12], achieving an ammonia energy share of up to 95% and improved fuel economy when the ammonia energy share was between 40% and 80%. Notably, they also observed reduced nitrogen oxide (NOx) emissions when the ammonia energy share was lower than 60%. In subsequent research [13], they found that unburned ammonia was between 1000 to 3000 ppm. Gill et al. compared the effects of ammonia, H2, and dissociated ammonia (a mixture of H2, nitrogen with small percentages of ammonia) on a dual-fuel diesel engine [14]. They found that the use of NH3–diesel dual fuel resulted in a large formation of nitrous oxide (N2O).
N2O is a well-known greenhouse gas with a global warming potential (GWP) 273 times that of carbon dioxide (CO2) [15]. Niki et al. demonstrated that ammonia, water, and N2O increased and CO2 decreased proportionally to the ammonia gas injection quantity [16]. They further explored combustion strategies to reduce ammonia and N2O emissions [17,18,19] and concluded that advancing the diesel injection timing could reduce ammonia and N2O emissions, but this would lead to a lower brake thermal efficiency [19]. In addition, they observed that pilot injection or post injection could effectively reduce ammonia emissions [18]. Yousefi et al. investigated the effect of ammonia energy fraction and diesel injection timing on a compression ignition (CI) engine [20]. They found the same varying trend of N2O as in Niki’s findings. In subsequent work, they used a split diesel injection strategy to investigate the effects of diesel injection timing on the indicated thermal efficiency (ITE) and GHG emissions [21]. They identified an optimum point for GHG emissions reduction, achieving a 23.7% reduction while increasing the ITE by 2%. This achievement, however, came at the cost of a 10% increase in NOx emissions. Mi et al. suggested that high pilot injection energy ratios could reduce N2O emissions while maintaining an indicated thermal efficiency of 45% at medium load [22]. Jin et al. achieved a gross indicated thermal efficiency of 49.18% at an ammonia energy ratio of 50% with an optimized injection strategy [23]. Pei et al. conducted a study evaluating the adaptability of diesel injection strategy in the range of 900–1300 r/min and 0.2–1.8 MPa IMEP [24]. They identified that, at low loads, using a single injection could achieve higher indicated thermal efficiency. When the load exceeded 0.6 MPa IMEP, a second injection was required near the top dead center to adjust the combustion phase. Through optimization, the highest ITE for the ammonia–diesel engine reached 51.5%, equivalent to the diesel-only mode. Sun et al. observed the combustion in the cylinder under different ammonia energy ratios on an optical engine [25]. The results show that, when ammonia was introduced, the flame color changed from yellow–white to orange. The peak flame area percentage and flame natural luminosity both decreased. Hiraoka et al. and Imamori et al. studied the effect of equivalent ratio on combustion and emissions in ammonia–diesel engines [26,27]. They found that lower NOx, NH3, and N2O emissions were obtained at equivalence ratios close to stoichiometric, which is due to the increased combustion temperature.
Hydrogen cyanide (HCN) is a small gaseous molecule known for its strong toxicity [28]. It is usually produced via the direct reaction of alkanes with ammonia [29]. While HCN emissions in on-road gasoline and diesel vehicles usually remain below allowable concentration limits [30], Zengel et al. detected HCN emissions at the exit of an ammonia-selective catalytic reduction converter (SCR) in lean-burn natural gas engines [31]. Their research indicated that there exists a potential for HCN generation in ammonia–diesel dual-fuel engines.
As reviewed above, ammonia can reduce CO2 emissions significantly and is being considered as an alternative fuel for CI engines. However, it still faces challenges like low thermal efficiency, ammonia emissions, and N2O emissions. Additionally, research on HCN emissions from ammonia–diesel combustion modes have not received much attention yet. The present study aims to study the combustion and emission characteristics of an ammonia–diesel dual-fuel engine. A split injection strategy for diesel was used. To better understand the effect of diesel injection strategies on emissions, the engine was set to operate at a low indicated mean effective pressure (IMEP) of 0.556 MPa and an engine speed of 800 r/min, at which the engine could produce considerably high CO, THC, and N2O because of the low combustion temperature.

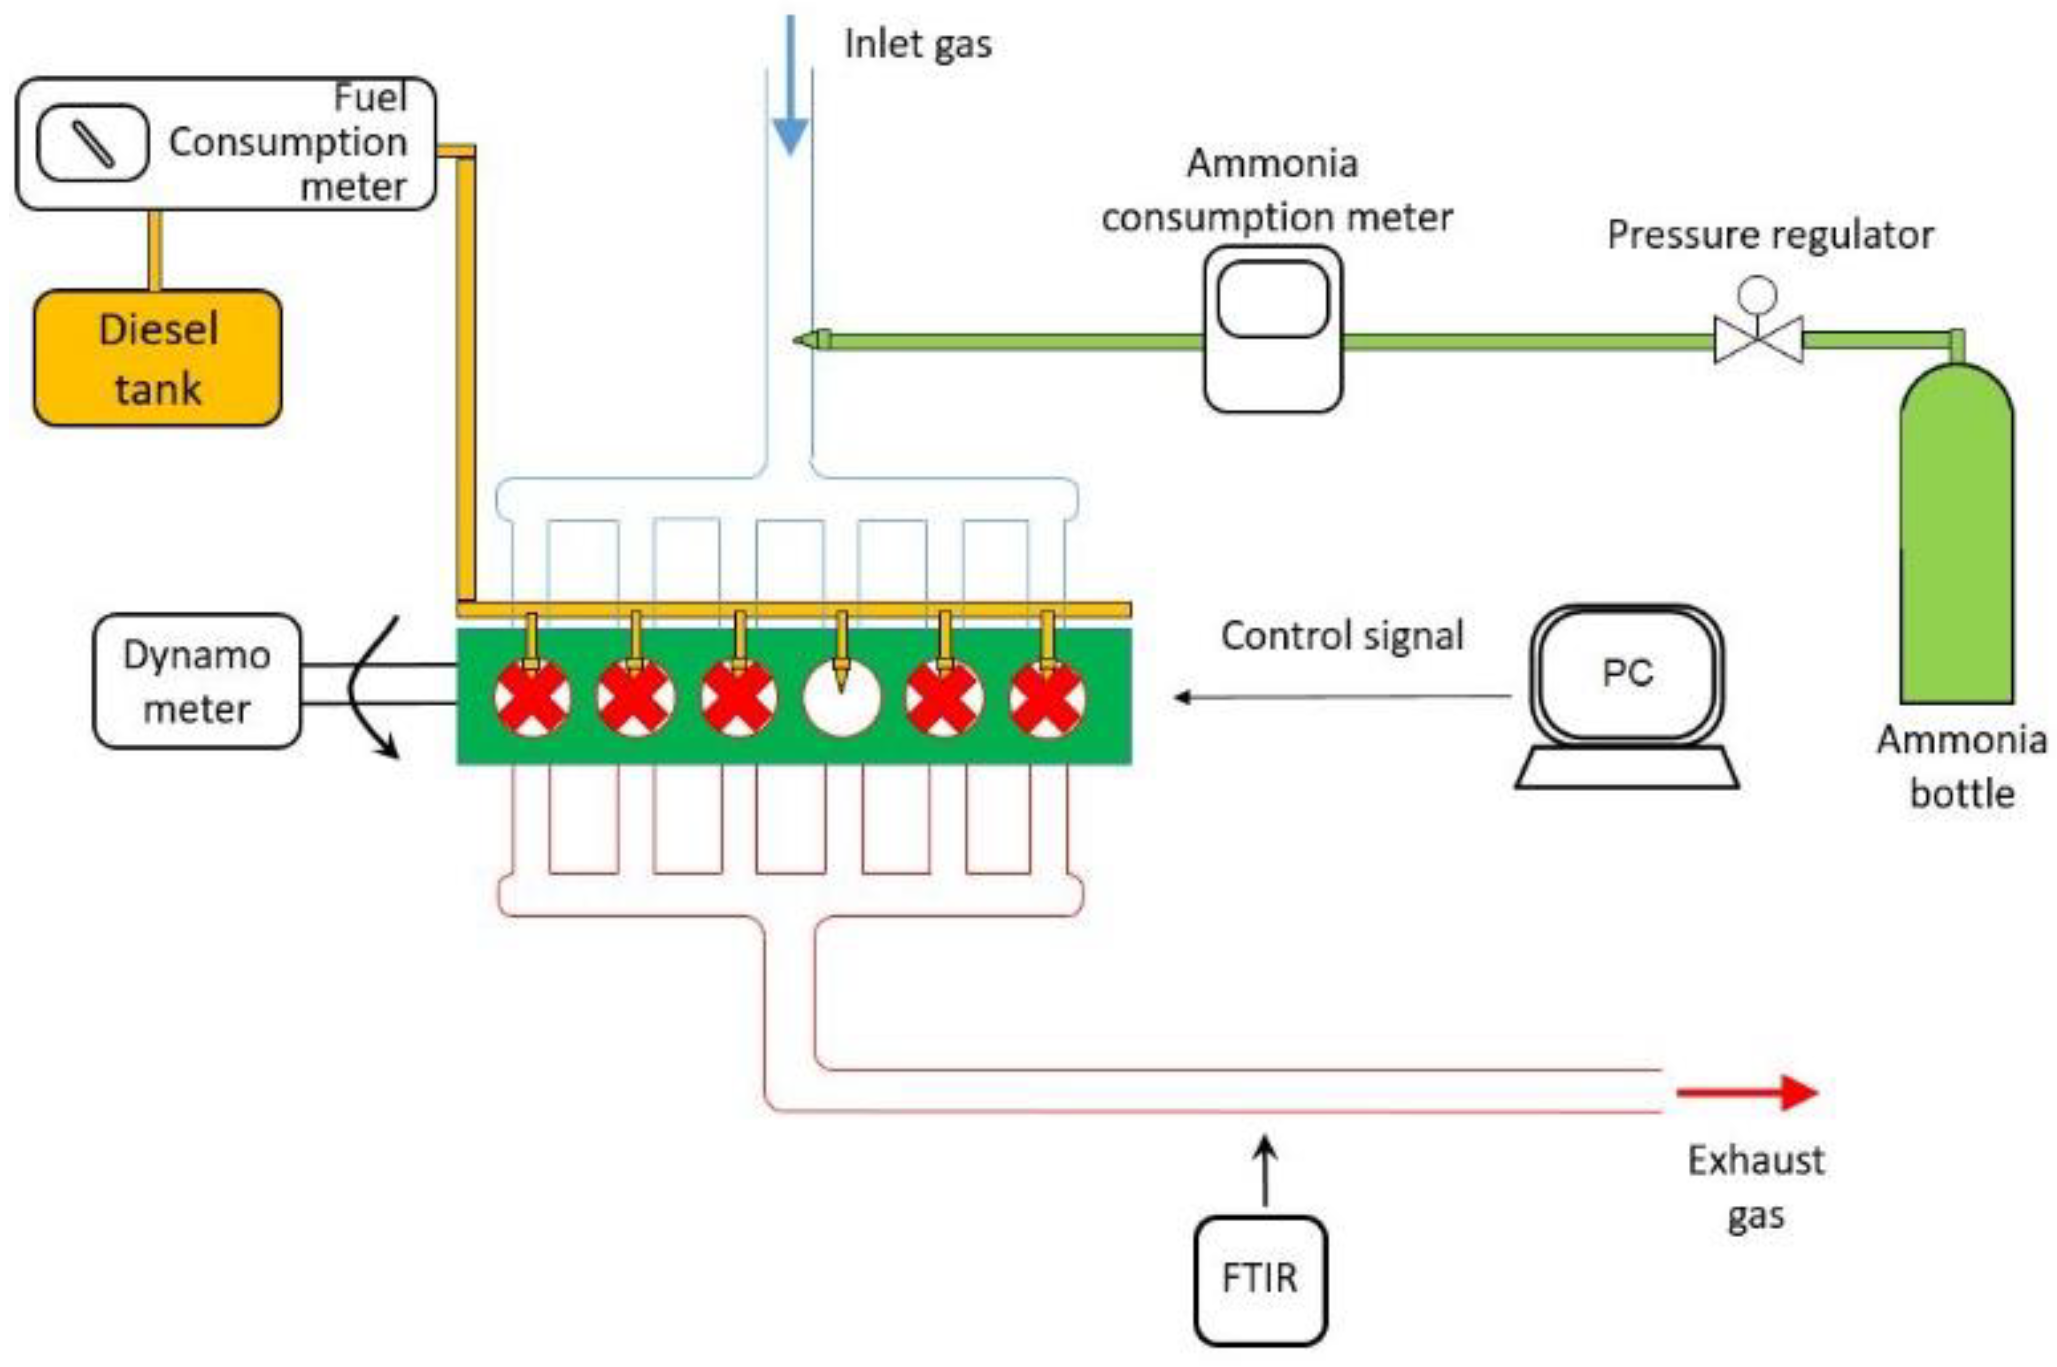
2. Experimental Setup

Experiments were conducted on a single-cylinder engine refitted from a heavy-duty diesel engine. Figure 1 shows the schematic of the engine test bench, which includes the engine, intake systems, exhaust systems, high-pressure common-rail diesel injection system, ammonia port-injection system, electrical dynamometer, and control system. The engine was connected to a Xiangyi CAC380 direct-current electrical dynamometer with an accuracy of 1 r/min for engine speed and 0.1% for torque measurement. The cylinder pressure was measured by an AVL GH14DK pressure sensor installed in the cylinder head, which featured an accuracy of 0.25%. A Bangman CA3002B combustion analyzer received the charge signal from the pressure transducer and converted it into pressure at a sample resolution of 0.1 °CA (Crank Angle). The cylinder pressure curve of each condition was gained from the average of 100 consecutive cycles. Diesel injection was controlled through an open ECU provided by the engine manufacturer, and the consumption was measured using a Powerlink FC2212L fuel consumption meter. Ammonia injection was controlled by another ECU developed by ECTEK Automotive Systems Co., Ltd. (Changzhou, China), and the consumption was measured by a TSK521ML mass flowmeter. In addition, an AVL SESAM FTIR (Fourier Transform Infrared Spectroscopy)-247 analyzer was used to measure the volume fractions of ammonia, CO, THC, NOx, N2O, and HCN in the exhaust gas, with an accuracy reaching 1 ppm or 0.5%. The measurement frequency is 1 Hz. Before recording experimental data, the engine was maintained under steady-state conditions for 5 min. Subsequently, the exhaust gas compositions were recorded using the FTIR analyzer for 1 min. The main engine parameters are shown in Table 1, and the properties of the basic fuels used in the study, diesel and ammonia, are presented in Table 2.
Six conditions were studied under the same engine speed and load, as detailed in Table 3. Specifically, each experiment was performed at a consistent engine speed of 800 r/min and an IMEP of 0.556 MPa. Additionally, a steady ammonia flow rate of roughly 0.6 kg/h was maintained, accounting for approximately 20% of the total energy share. Diesel was introduced through a split injection method. The pilot injection quantity remained constant at 5 mg/cycle, and its timing varied based on the specific test condition. The injection timing of the main injection was −1 °CA ATDC (Crank Angle After Top Dead Center). The quantity of the main injection was adjusted in accordance with the test conditions. The intake pressure was stabilized at 0.1013 MPa, while the intake temperature was held at around 20.0 °C. The intake air flow rate was around 61 kg/h.
The apparent heat release rate (AHRR) is a key parameter in combustion analysis, and it was calculated by the following formula:
A H R R = γ γ 1 P d P d V + 1 γ 1 V d P d θ
where γ, P, V, and θ stand for the ratio of specific heat, cylinder pressure, instantaneous volume of the combustion chamber, and crank angle, respectively.
The crank angles corresponding to 5%, 50%, and 90% of the total heat released are denoted as CA05, CA50, and CA90. The combustion duration was defined as the CA interval between CA05 and CA90.
The ammonia combustion efficiency was estimated by the following formulae:
η A = 1 m ˙ A e x m ˙ A × 100 %
m A e x = 0.5862 × G A × ( m ˙ a i r + m ˙ A + m ˙ D )
where η A , m ˙ A e x , m ˙ A , G A , m ˙ a i r , and m ˙ D stand for the ammonia combustion efficiency, exhaust ammonia flow rate, ammonia injection flow rate, ammonia concentration measured by FTIR, intake air flow rate, and diesel consumption rate, respectively.

3. Numerical Methods

To understand the HCN formation mechanism in ammonia–diesel combustion, calculations were performed using the closed homogeneous reactor model in Chemkin 17.0 software. In the calculations, the solution method was ‘constrain pressure and temperature’, with the end time set as 1 ms. The pressures were 2.0, 3.0, and 4.0 MPa, and the temperature ranged from 500 K to 3000 K, which covered the engine condition in this study. The reactant species were nitrogen (N2), oxygen (O2), n-heptane, and ammonia. In order to study the contribution of ammonia to NOx formation under different temperatures, N2 in air was replaced with argon (Ar) at the conditions of 3.0 MPa. A detailed kinetic model developed by Dong [32] was used to simulate the HCN mole fraction and the reaction pathways of HCN formation at different conditions. This model can predict the autoignition behavior and laminar burning velocities of ammonia/n-heptane blends well. The key reaction pathways for HCN formation were identified through the following steps: Initially, the top 20 reactions with the highest reaction rates for each species during the ammonia/n-heptane/air reaction were selected. Subsequently, the cumulative production of each species within 1 ms was integrated by these reactions. By assessing the proportion of the cumulative production facilitated by these reactions, the primary sources of each species were determined. Finally, the species relevant to HCN formation were identified, and the key reaction pathways for HCN formation were established. The simulation conditions studied are summarized in Table 4.

4. Results and Discussions

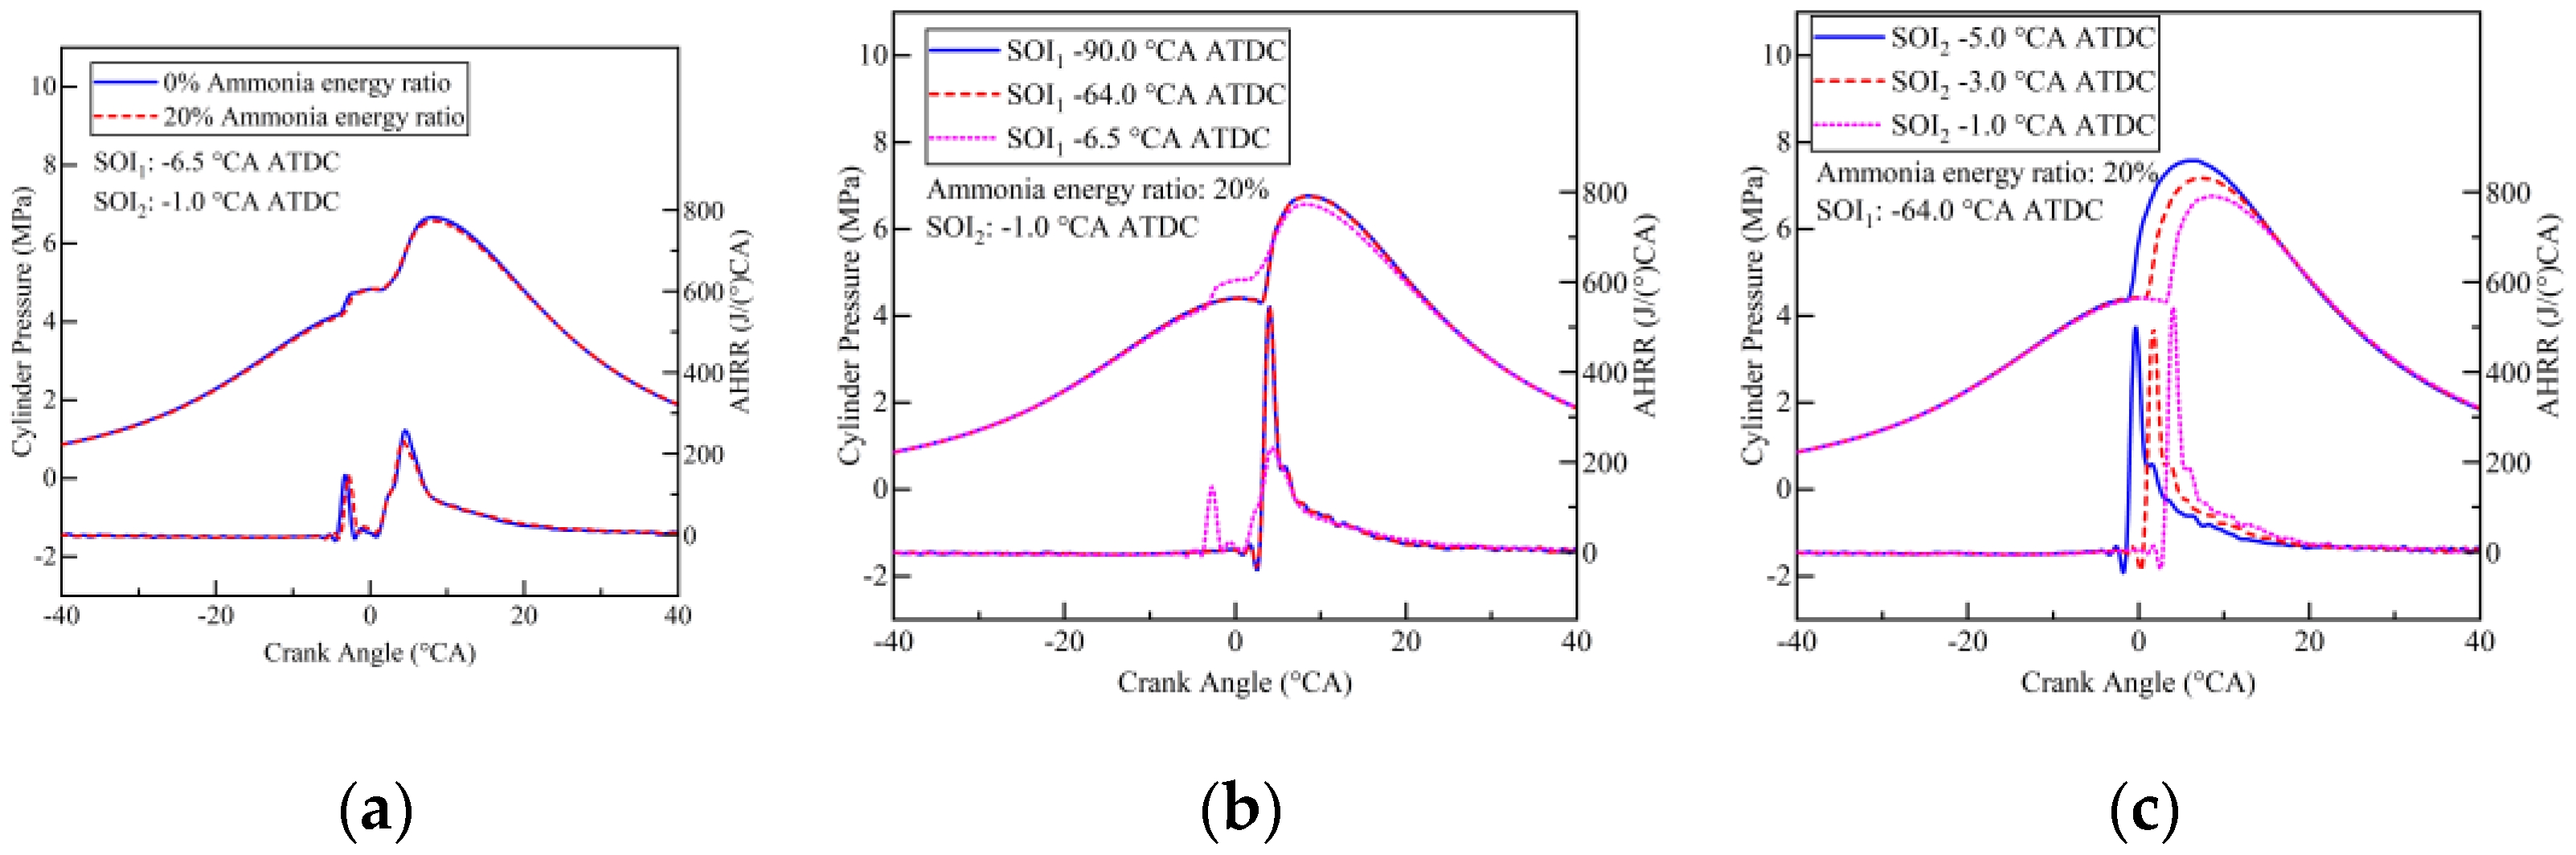
4.1. Combustion Characteristics

Figure 2 shows the cylinder pressure and the AHRR for various fuel injection strategies, including (a) different ammonia energy ratio, (b) different pilot injection timing (SOI1), and (c) different main injection timing (SOI2). It is noteworthy that the coefficient of variation (COV) of IMEP for all cases remained below 2%, indicating stable combustion.
As shown in Figure 2a, the heat release profile indicates a two-stage combustion process for pure diesel fuel. When ammonia was injected, the first stage combustion was retarded by 0.5 °CA. This is attributed to ammonia’s high resistance to autoignition (with an octane number more than 130 [4] and an autoignition temperature exceeding 651 °C [33]). The addition of ammonia had minimal influence on the ignition timing of the main injection fuels, primarily due to the localized temperature increase resulting from the combustion of pilot injection fuels, which effectively counteracted the impact of ammonia. It is noteworthy that the peak cylinder pressure in the ammonia–diesel mode was lower than that observed in the diesel-only mode. This reduction in pressure aligns with the smaller quantity of diesel injected during the main injection phase. Figure 2b shows that advancing SOI1 could obviously change the performance of combustion. In this case, the first combustion stage was missing, leading to a higher peak heat release rate. The diesel injected during the pilot injection underwent a prolonged vaporization period, forming a premixed fuel–air mixture. However, owing to the limited quantity of pilot injection fuels, the mixture’s chemical reactivity remained insufficient for autoignition. Subsequently, combustion initiated upon the start of main injection. The increased temperature and pressure accelerated the chemical reaction rate within the premixed gas containing the pilot diesel, resulting in a higher heat release rate. Notably, in Figure 2b, the combustion performance with an SOI1 of −64.0 °CA ATDC was nearly identical to that of −90.0 °CA ATDC. This implies that the pilot injection had minimal impact on combustion as long as it was sufficiently earlier than the top dead center (TDC). By adjusting SOI2 from −1.0 °CA ATDC to −5.0 °CA ATDC, the combustion’s ignition timing advanced by 4.3 °CA, indicating that SOI2 directly controlled the onset of combustion.
Figure 3 illustrates the combustion phases for different strategies. Upon introducing ammonia, CA05, CA50, and CA90 experienced delays of 0.5 °CA, 0.3 °CA, and 3.8 °CA, respectively. As shown in Figure 2a, the initial heat release rate in the ammonia–diesel mode is later than that in the diesel-only mode, resulting in shifts in CA05 and CA50. The slow flame speed of ammonia and the lean mixture led to a longer combustion period, hence noticeably delaying CA90. Advancing SOI1 to −64.0 °CA ATDC caused CA05 to be delayed by 6.0 °CA due to missing the first combustion stage. Conversely, CA50 and CA90 moved forward by 0.5 °CA and 3.8 °CA, respectively. This is because the diesel injected during the pilot injection accelerated the outward spread of flames. This accelerated combustion counteracted the effects of delayed combustion initiation. Upon advancing SOI2, all combustion phases occurred near TDC, with a more pronounced impact on CA05 and CA50 compared with CA90. This observation indicates that the early combustion stage was influenced by the main injection fuels, while the end of combustion was controlled by the pilot injection fuels and ammonia in this engine operation.
The ammonia combustion efficiency for different strategies is presented in Figure 4. When ammonia was introduced through the intake port without any changes in direct injection timing, the ammonia combustion efficiency reached 75% (resulting in exhaust ammonia emissions of 4376 ppm). Unburned ammonia mainly existed in piston crevices and areas where the flame could not propagate into [18]. Advancing SOI1 increased the ammonia combustion efficiency to 89%, attributed to enhanced local chemical reactivity due to better mixing of pilot diesel and ammonia with earlier injection. Further gains in ammonia combustion efficiency were achieved by advancing SOI2. This adjustment brought the combustion closer to TDC, resulting in higher temperatures and extended time for ammonia decomposition. The highest ammonia combustion efficiency observed in this study was 93% (with exhaust ammonia emissions at 1121 ppm). This achievement was attained with the −64.0 °CA ATDC strategy for SOI1 and the −5.0 °CA ATDC strategy for SOI2.

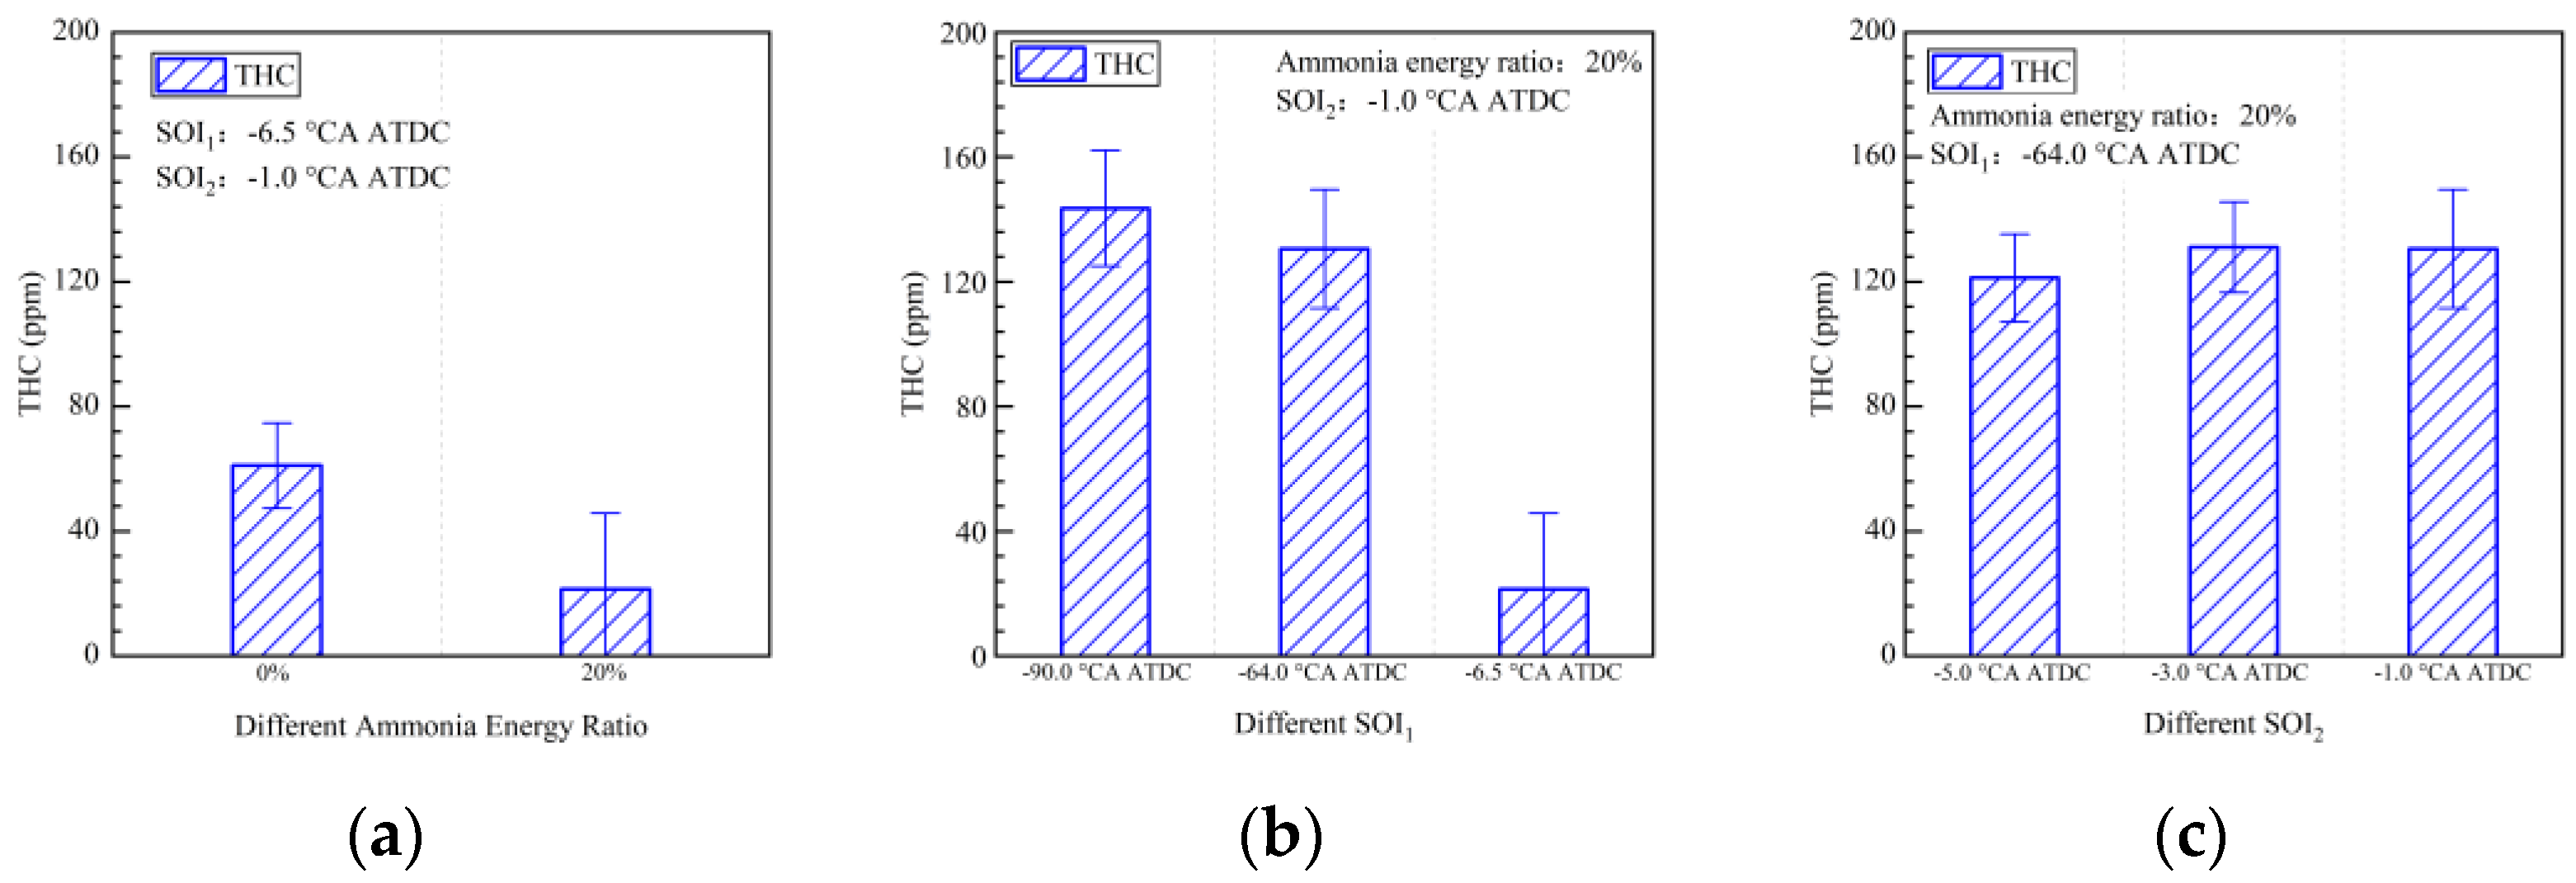
4.2. Emission Characteristics

Figure 5 illustrates the CO emission variation for different injection strategies. CO emissions mainly result from incomplete combustion of fuel characterized by low temperatures and oxygen scarcity [34]. Introducing ammonia led to a 10% increase in CO emission, indicating that the lean ammonia–air mixture had an impact on diesel’s chemical reaction process. This is because the presence of ammonia, which lowered the local combustion temperature, decelerated the oxidation rate of CO during the later stages of combustion. With an advancement of SOI1, CO emission worsened by a factor of 12. This could be attributed to lower cylinder temperature and pressure during pilot injection, potentially causing some pilot injection fuel to impact on the cylinder wall and create fuel-rich zones. In Figure 5c, when SOI1 was set at −64.0 °CA ATDC, the CO emissions from an early SOI2 were 33% lower than those from a late SOI2. Earlier combustion created a hotter environment that facilitated further CO oxidation.
Figure 6 presents the impact of different strategies on THC emissions. These emissions reflect the portion of unburned hydrocarbon fuels. As shown in Figure 6a, in the ammonia–diesel dual-fuel mode, THC was 67% lower than the diesel-only mode. This reduction was attributed to the decreased amount of diesel injected during the main injection due to ammonia addition. This change caused a decrease in fuel-rich areas in the combustion chamber. When SOI1 exceeded −64.0 °CA ATDC, there was a noticeable increase in THC emissions, reaching a peak of 144 ppm. The early SOI2 strategies, with SOI1 set at −64.0 °CA ATDC, managed to reduce THC emissions by 6%. This suggested that THC emissions were mainly influenced by the pilot injection fuels, which accumulated in the fuel-rich region near the cylinder wall due to the pilot injection.
NOx emissions of different strategies are shown in Figure 7. The combustion generated two types of NO through distinct mechanisms: thermal NO, formed by N2 reacting with O2 under high-temperature conditions, and fuel NO, an intermediate product of ammonia oxidation. Figure 7a indicates that introducing a small quantity of ammonia decreased NOx emissions by 20%. This finding was in line with previous research [12,20]. In this case, the added ammonia reduced thermal NO by lowering the combustion temperature. While the contribution of fuel NO to the overall NO production was minor, the NOx emissions nearly doubled as SOI1 advanced. Pilot injection fuels ignited the ammonia near the cylinder wall; however, it could not be totally oxidized because of the small quantity of pilot diesel and low temperature. Advancing SOI2 raised NOx emissions from 1400 ppm to 2000 ppm, as the combustion phases approached TDC, leading to increased production of thermal NO.
In Figure 8, the effects of temperature on NO formation of different background gas were examined. As the equivalence ratio increased, n-heptane consumed more O radicals, leading to the inhibition of NO formation. When the background gas was switched from N2 to Ar, a significant reduction in NO was observed under high-temperature conditions. This suggests that thermal NO is primarily generated at high temperatures, while fuel NO is formed within the temperature range of 1500 K to 2500 K.
Figure 9 displays the chemical reaction pathways of NO at temperatures of 2000 K and 3000 K. At 2000 K, NO reacts with NH/N radicals, resulting in the production of N2O/N2. However, as the temperature increases to 3000 K, N2 undergoes decomposition through interactions with O/OH/HO2 radicals, leading to the formation of thermal NO.
Figure 10 displays the N2O emissions across different strategies. In diesel-only mode, the N2O emissions were 1.5 ppm, and the N2O emissions increased to 89.5 ppm when ammonia was added, indicating that the ammonia pyrolysis played an important role in the formation of N2O. As depicted in Figure 10b, the N2O emissions with early SOI1 were 2.5 times higher than late SOI1. This stemmed from the incomplete combustion of ammonia near the cylinder wall, as discussed earlier. As SOI2 was advanced, N2O emissions dropped from 240 ppm to 200 ppm. The combustion being nearer to TDC resulted in higher temperatures that facilitated the decomposition of N2O.
Figure 11 illustrates the HCN emissions of different strategies. In diesel-only mode, minimal HCN emissions were detected. This implies that the combination of N2 with hydrocarbon radicals is difficult under typical engine conditions. However, upon the addition of ammonia, the HCN emissions surged to 1.7 ppm, marking an increase of more than five times compared with the diesel-only mode. Notably, the early advancement of SOI1, causing pilot fuels to spread beyond the ω regions of the piston led to a noticeable increase in HCN emissions. This suggests that HCN was predominantly generated near the cylinder wall, where diesel and ammonia were thoroughly premixed.
As depicted in Figure 12, the generation of HCN occurs within a temperature range of 1000 K to 1750 K. At lower temperatures, the decomposition of fuels was slow, resulting in minimal HCN formation. As the temperature rises, the formation of HCN becomes more active. Nevertheless, it is important to note that HCN acts as an intermediate product during combustion and is susceptible to oxidation by O2. It becomes instable as the temperature exceeds 1100 K [35,36], and the elevated temperature accelerates HCN oxidation, leading to reduced HCN emissions. With an increased proportion of fuel, more HCN was generated due to more contact between ammonia and hydrocarbon radicals.
As discussed earlier, the early pilot injection created a larger region of low-temperature combustion, which in turn facilitated the formation of HCN. To mitigate HCN emissions, it is crucial to ensure that the combustion temperature exceeds 1750 K. Strategies such as increasing the amount of pilot injection fuel, raising the temperature of the intake premixed gas, or advancing the combustion phases closer to TDC could potentially help in reducing HCN emissions.
The analysis of the HCN rate of production (ROP) is presented in Figure 13. The primary contributors to HCN production were HCNH, H2CN, and NO. HCN formation displayed an increasing trend with increasing pressure and temperature, indicative of rapid chemical reactions. Moreover, the oxidation became more active at 1750 K. All these combined factors contributed to the reduction in HCN emissions, as depicted in Figure 12b.
Figure 14 shows that HCN was mainly formed following the reaction path of NH3 → NH2 → CH2NH2 → CH2NH → HCNH → HCN. At elevated temperatures, this HCN formation pathway underwent alterations. Notably, the proportion of HCN generated through H2CN increased, and the reactions involving NH became more pronounced.

5. Conclusions

This study focused on the combustion and emissions of an ammonia–diesel engine. The engine was maintained at a fixed operation point of 800 r/min and 0.556 MPa IMEP. The conclusions drawn are as follows:
(1)
The introduction of ammonia resulted in delayed combustion and extended combustion duration. Advancing the pilot injection timing (SOI1) led to missing the first stage combustion.
(2)
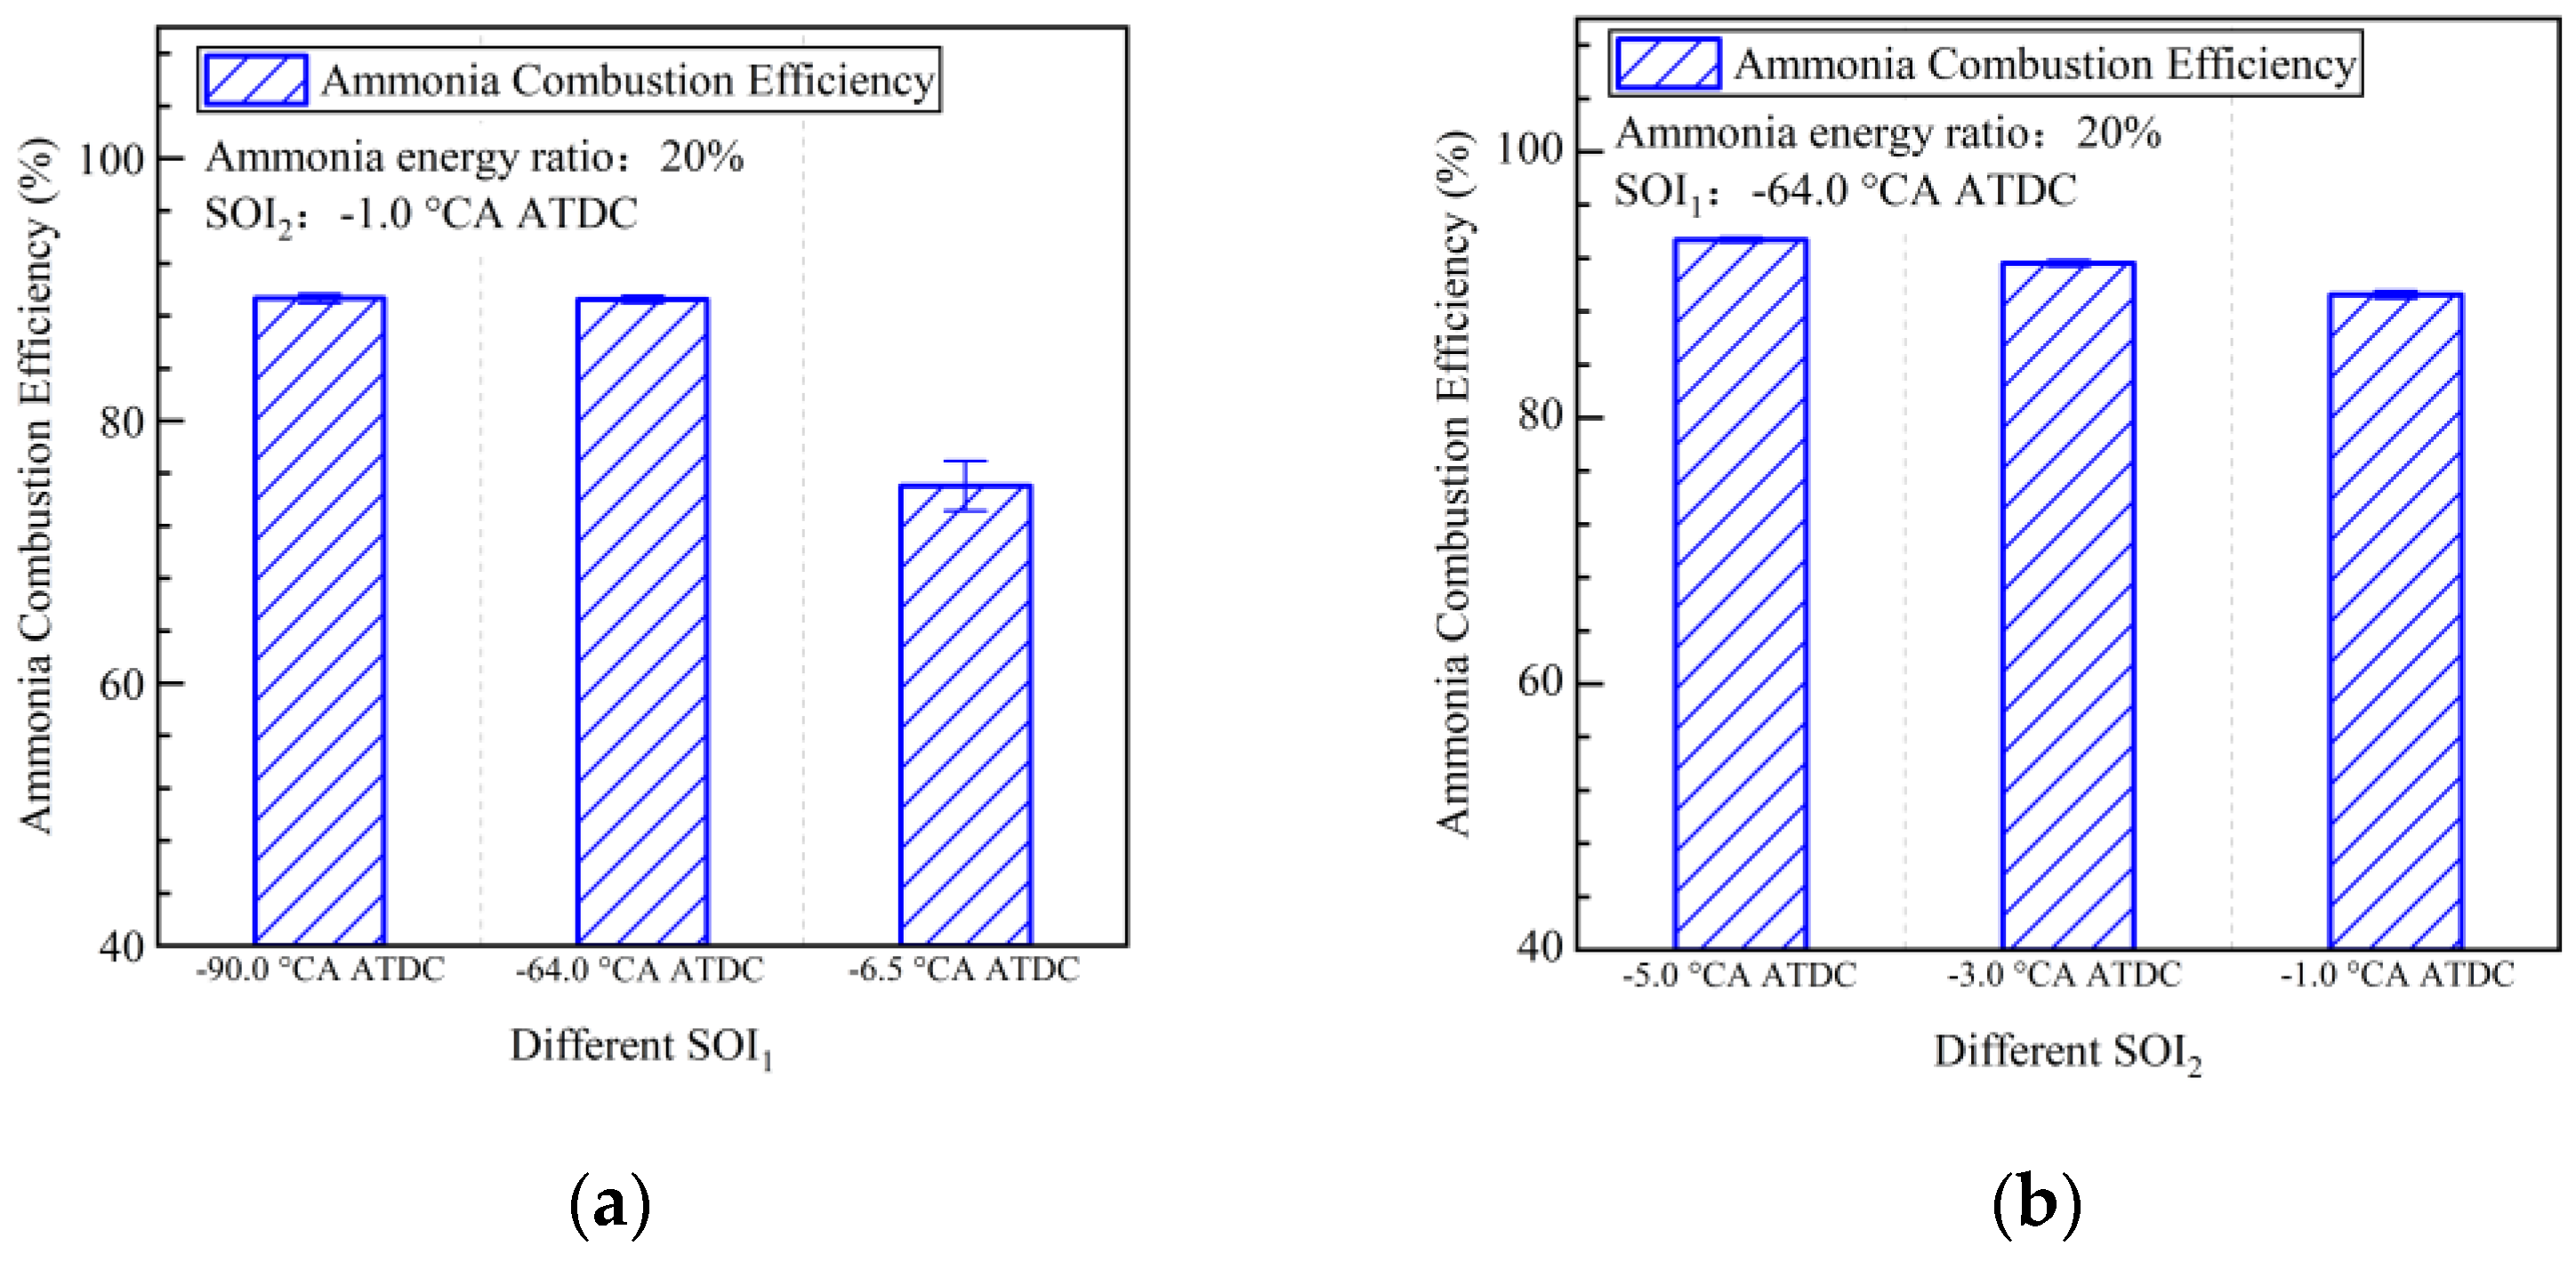
Strategies involving early pilot injection timing (SOI1) improved ammonia combustion efficiency from 74% to 89%. Diesel injected during pilot injection facilitated ammonia decomposition. The maximum ammonia combustion efficiency achieved in this study was 93%, attained with SOI1 set at −64.0 °CA ATDC and SOI2 at −5.0 °CA ATDC.
(3)
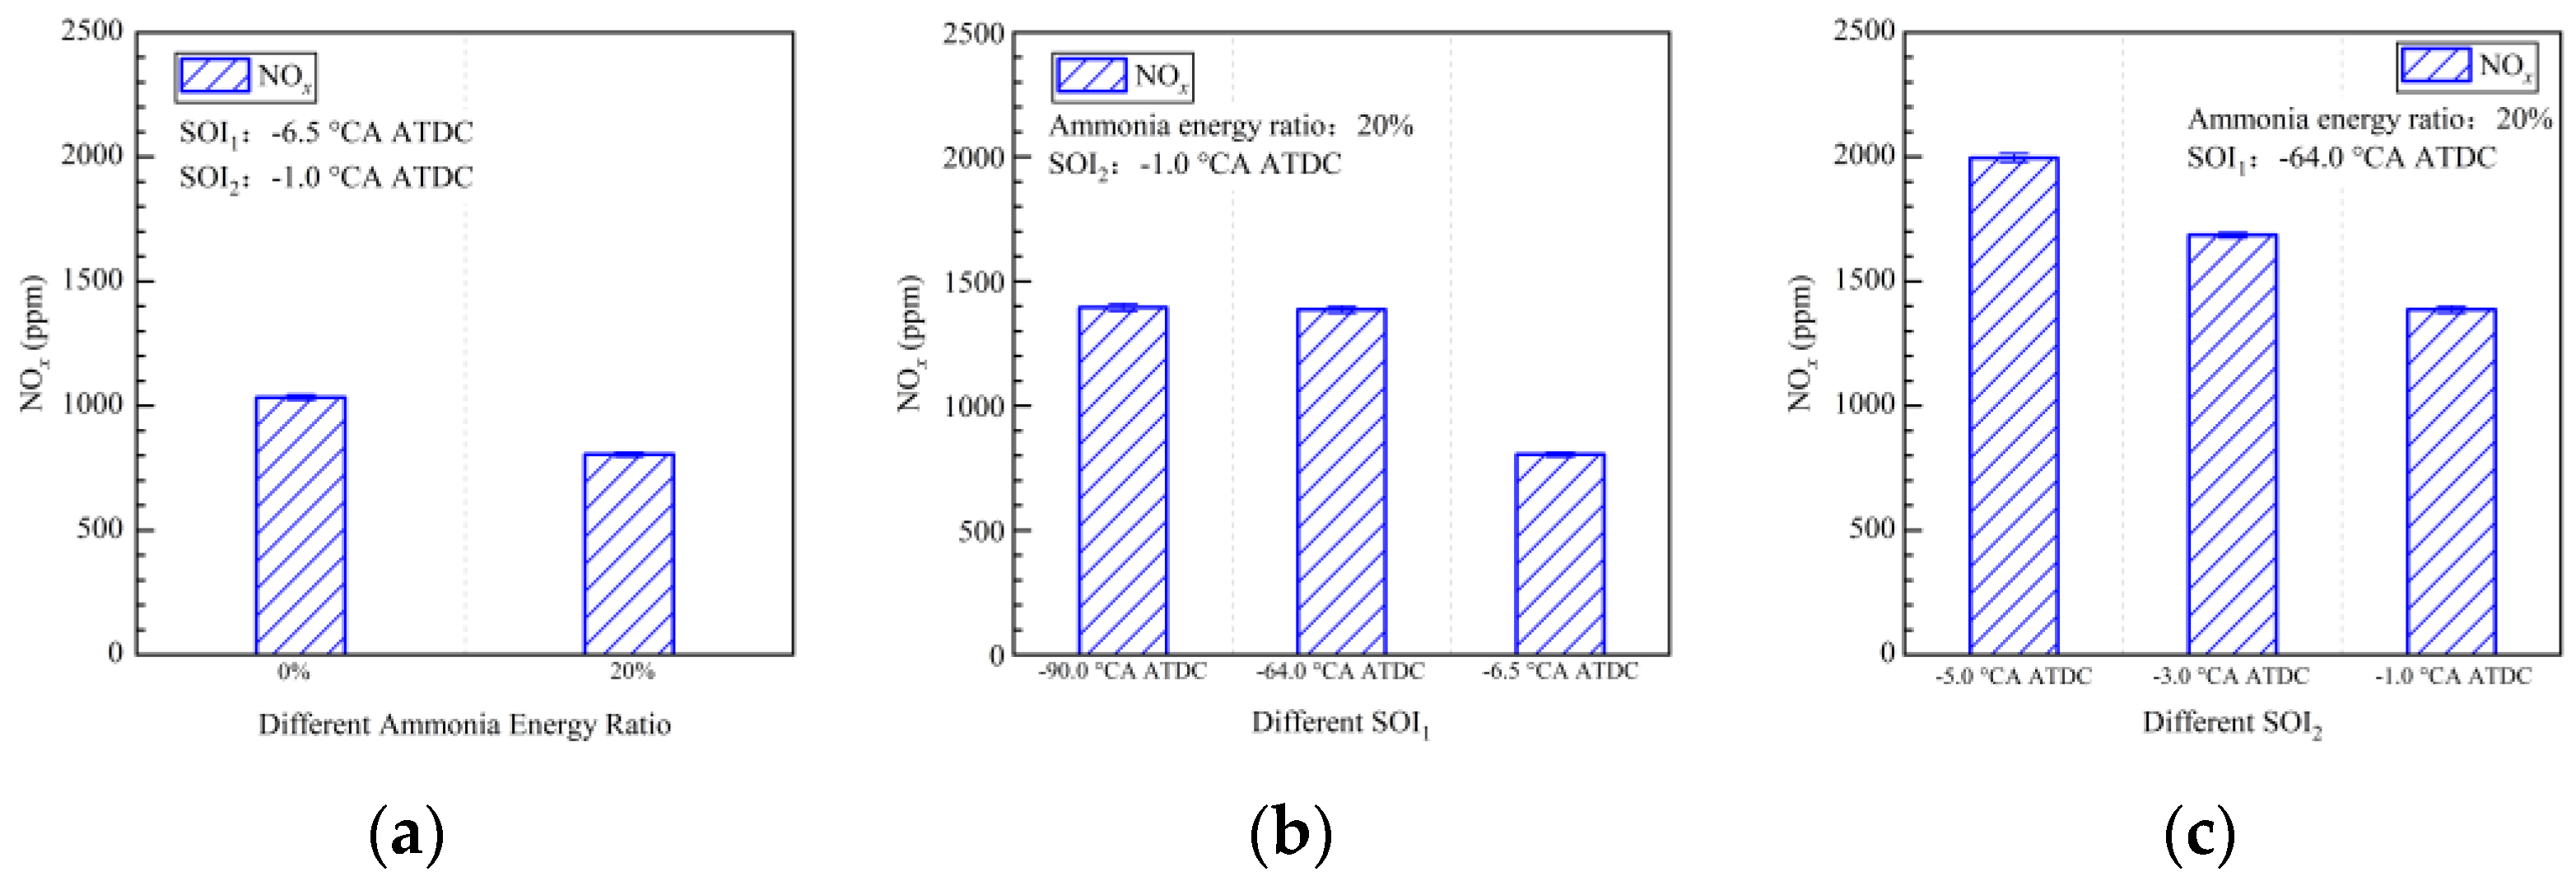
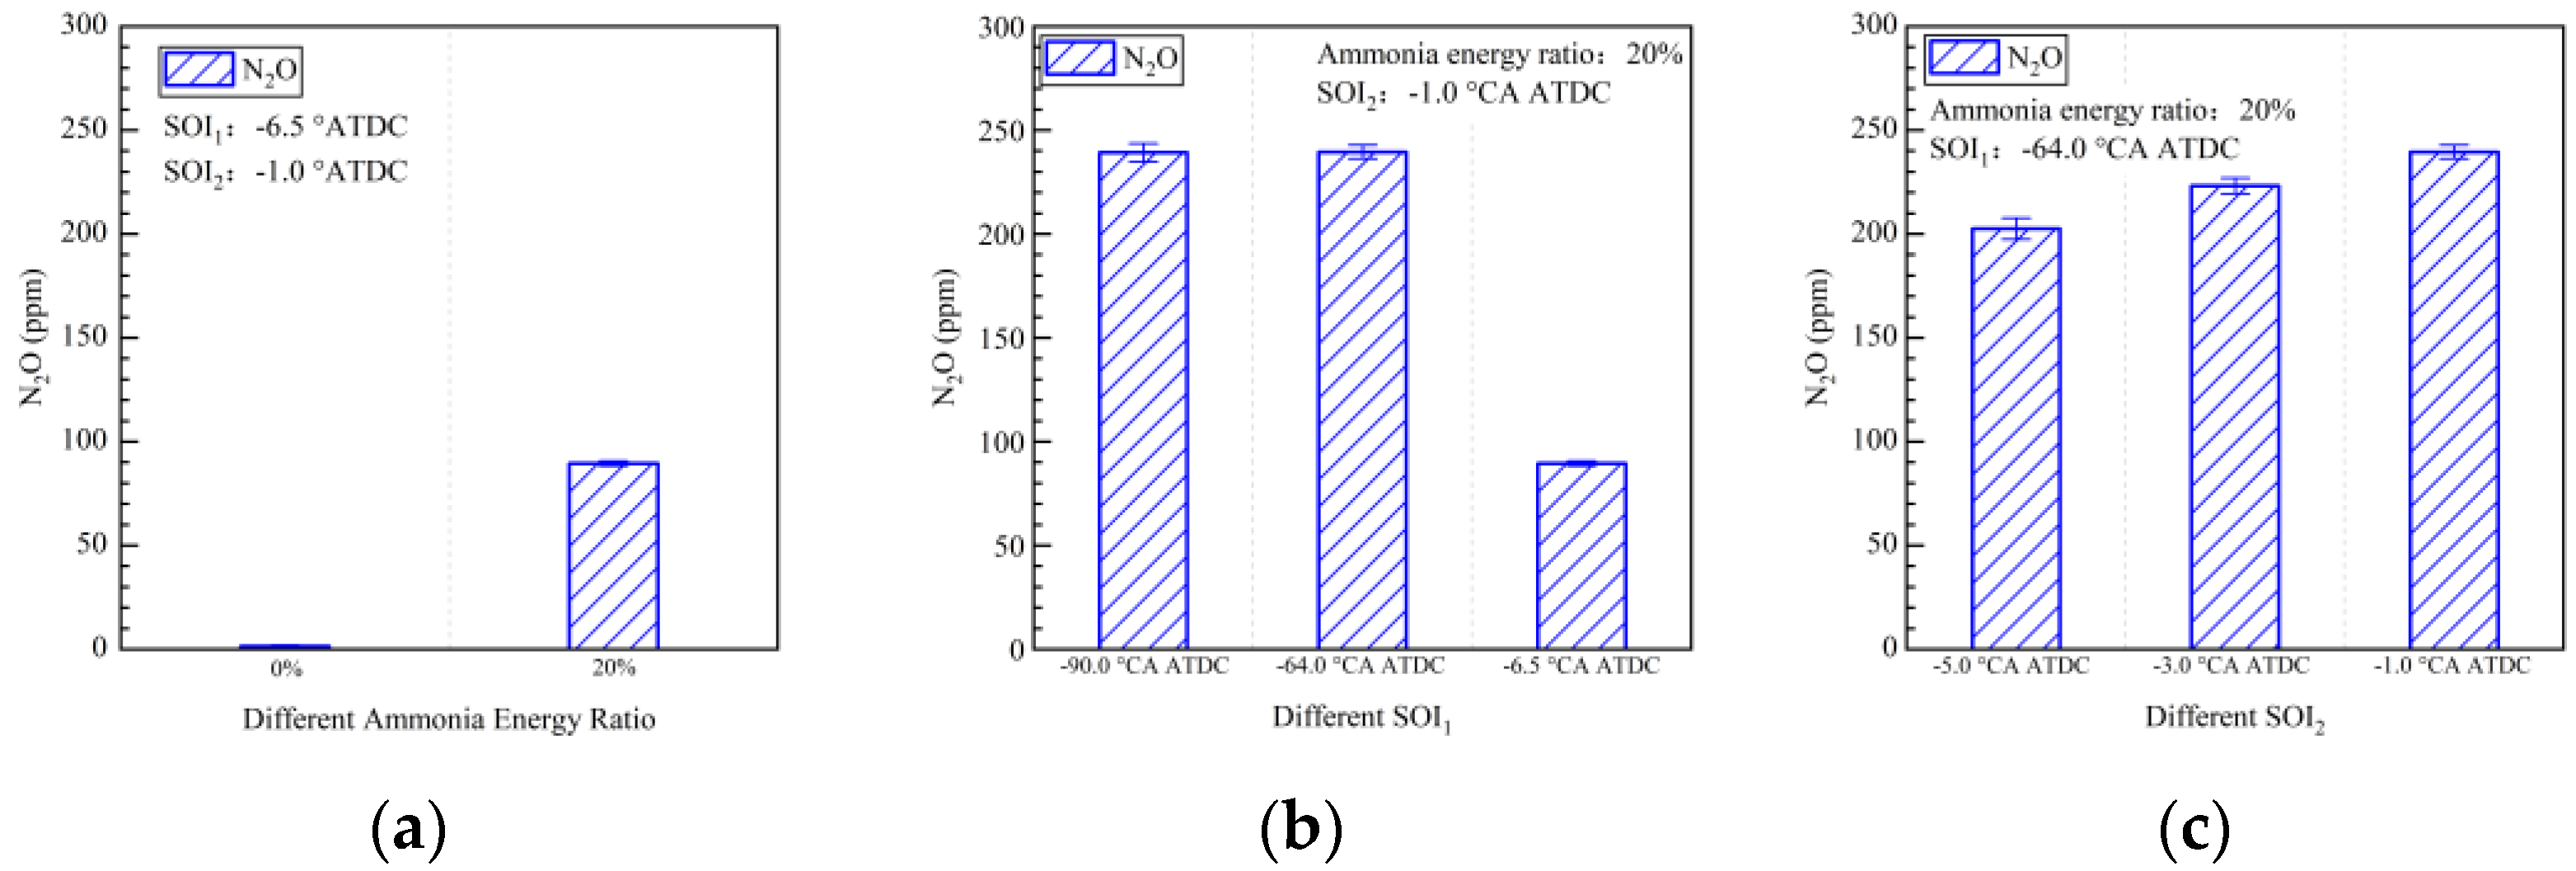
The early pilot injection strategy yielded poorer emission performance (CO, THC, NOx, N2O, and HCN). Advancing SOI2 accelerated the oxidation process of CO, THC, N2O, and HCN due to higher temperatures. However, thermal NOx emissions worsened.
(4)
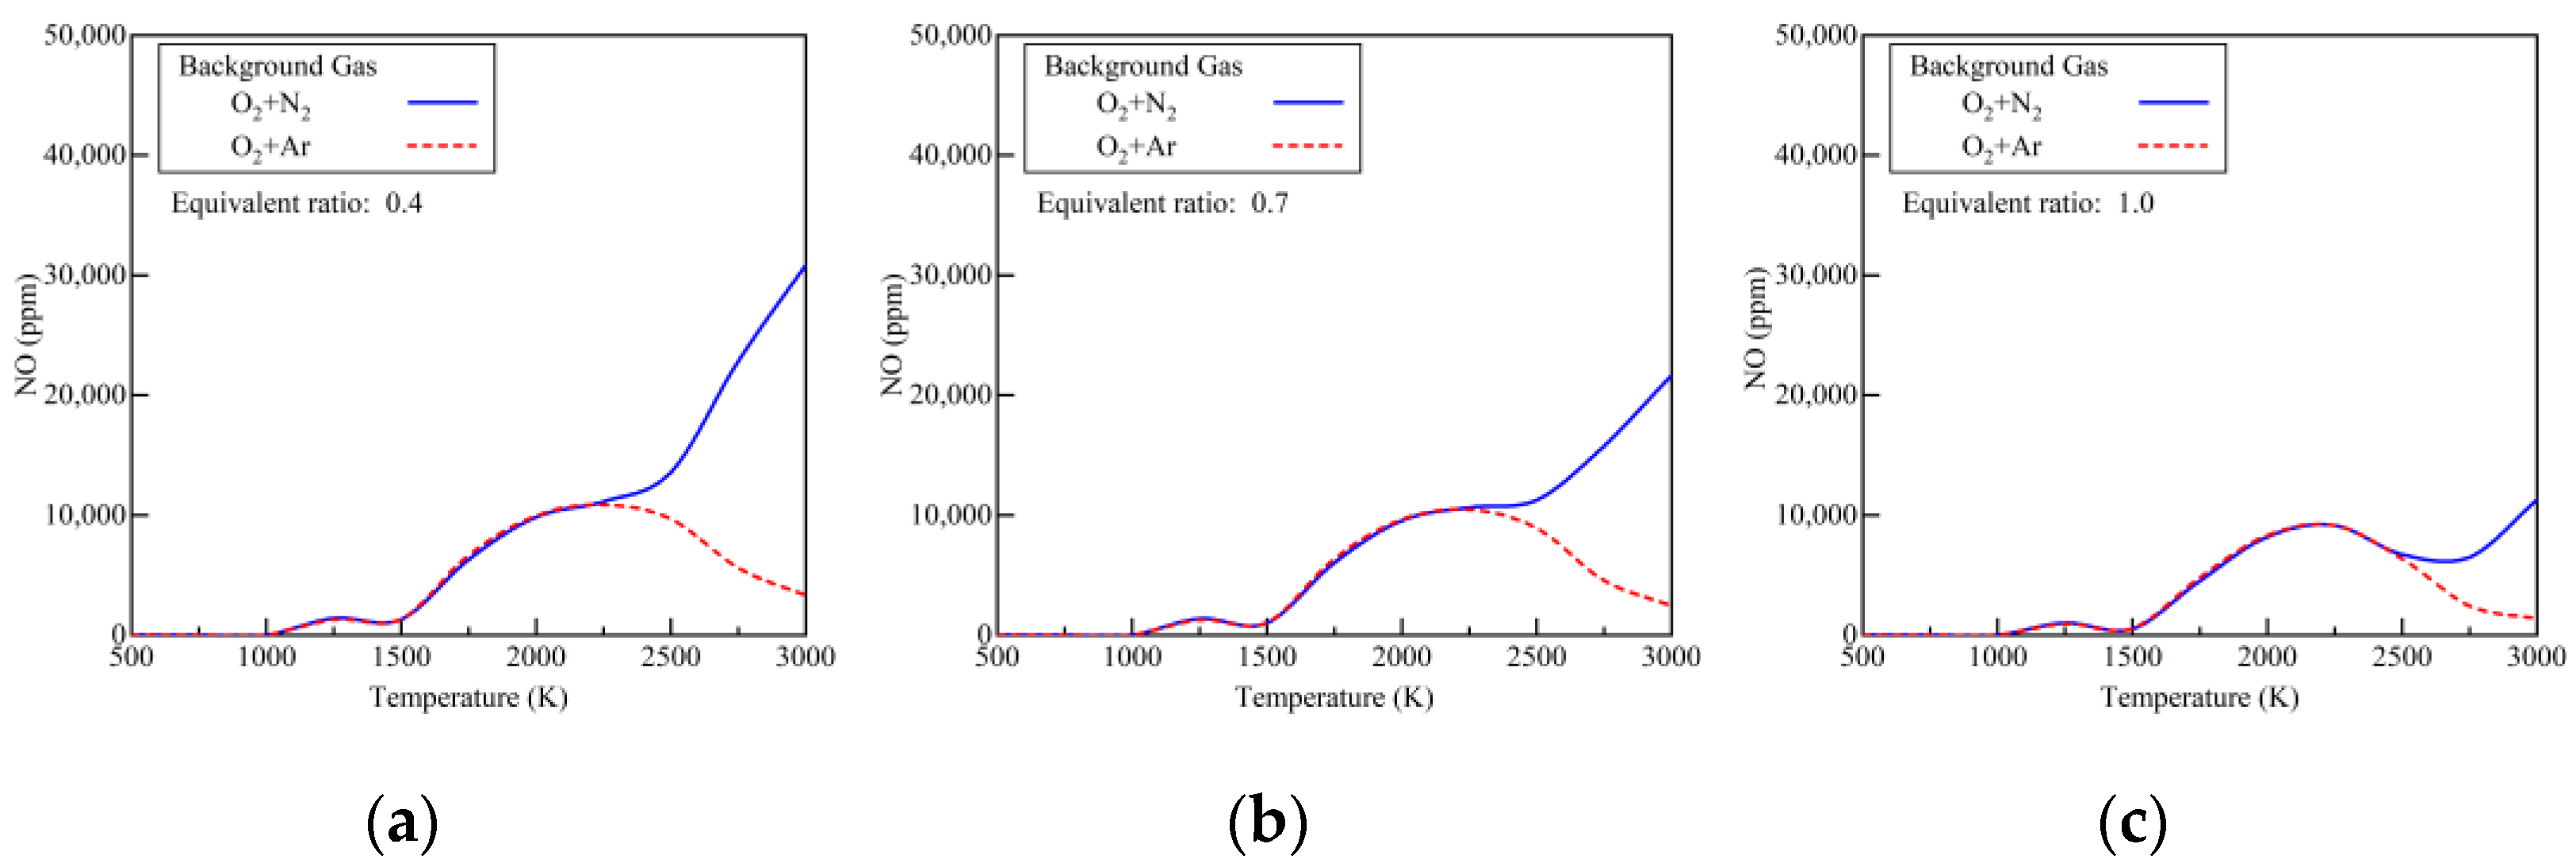
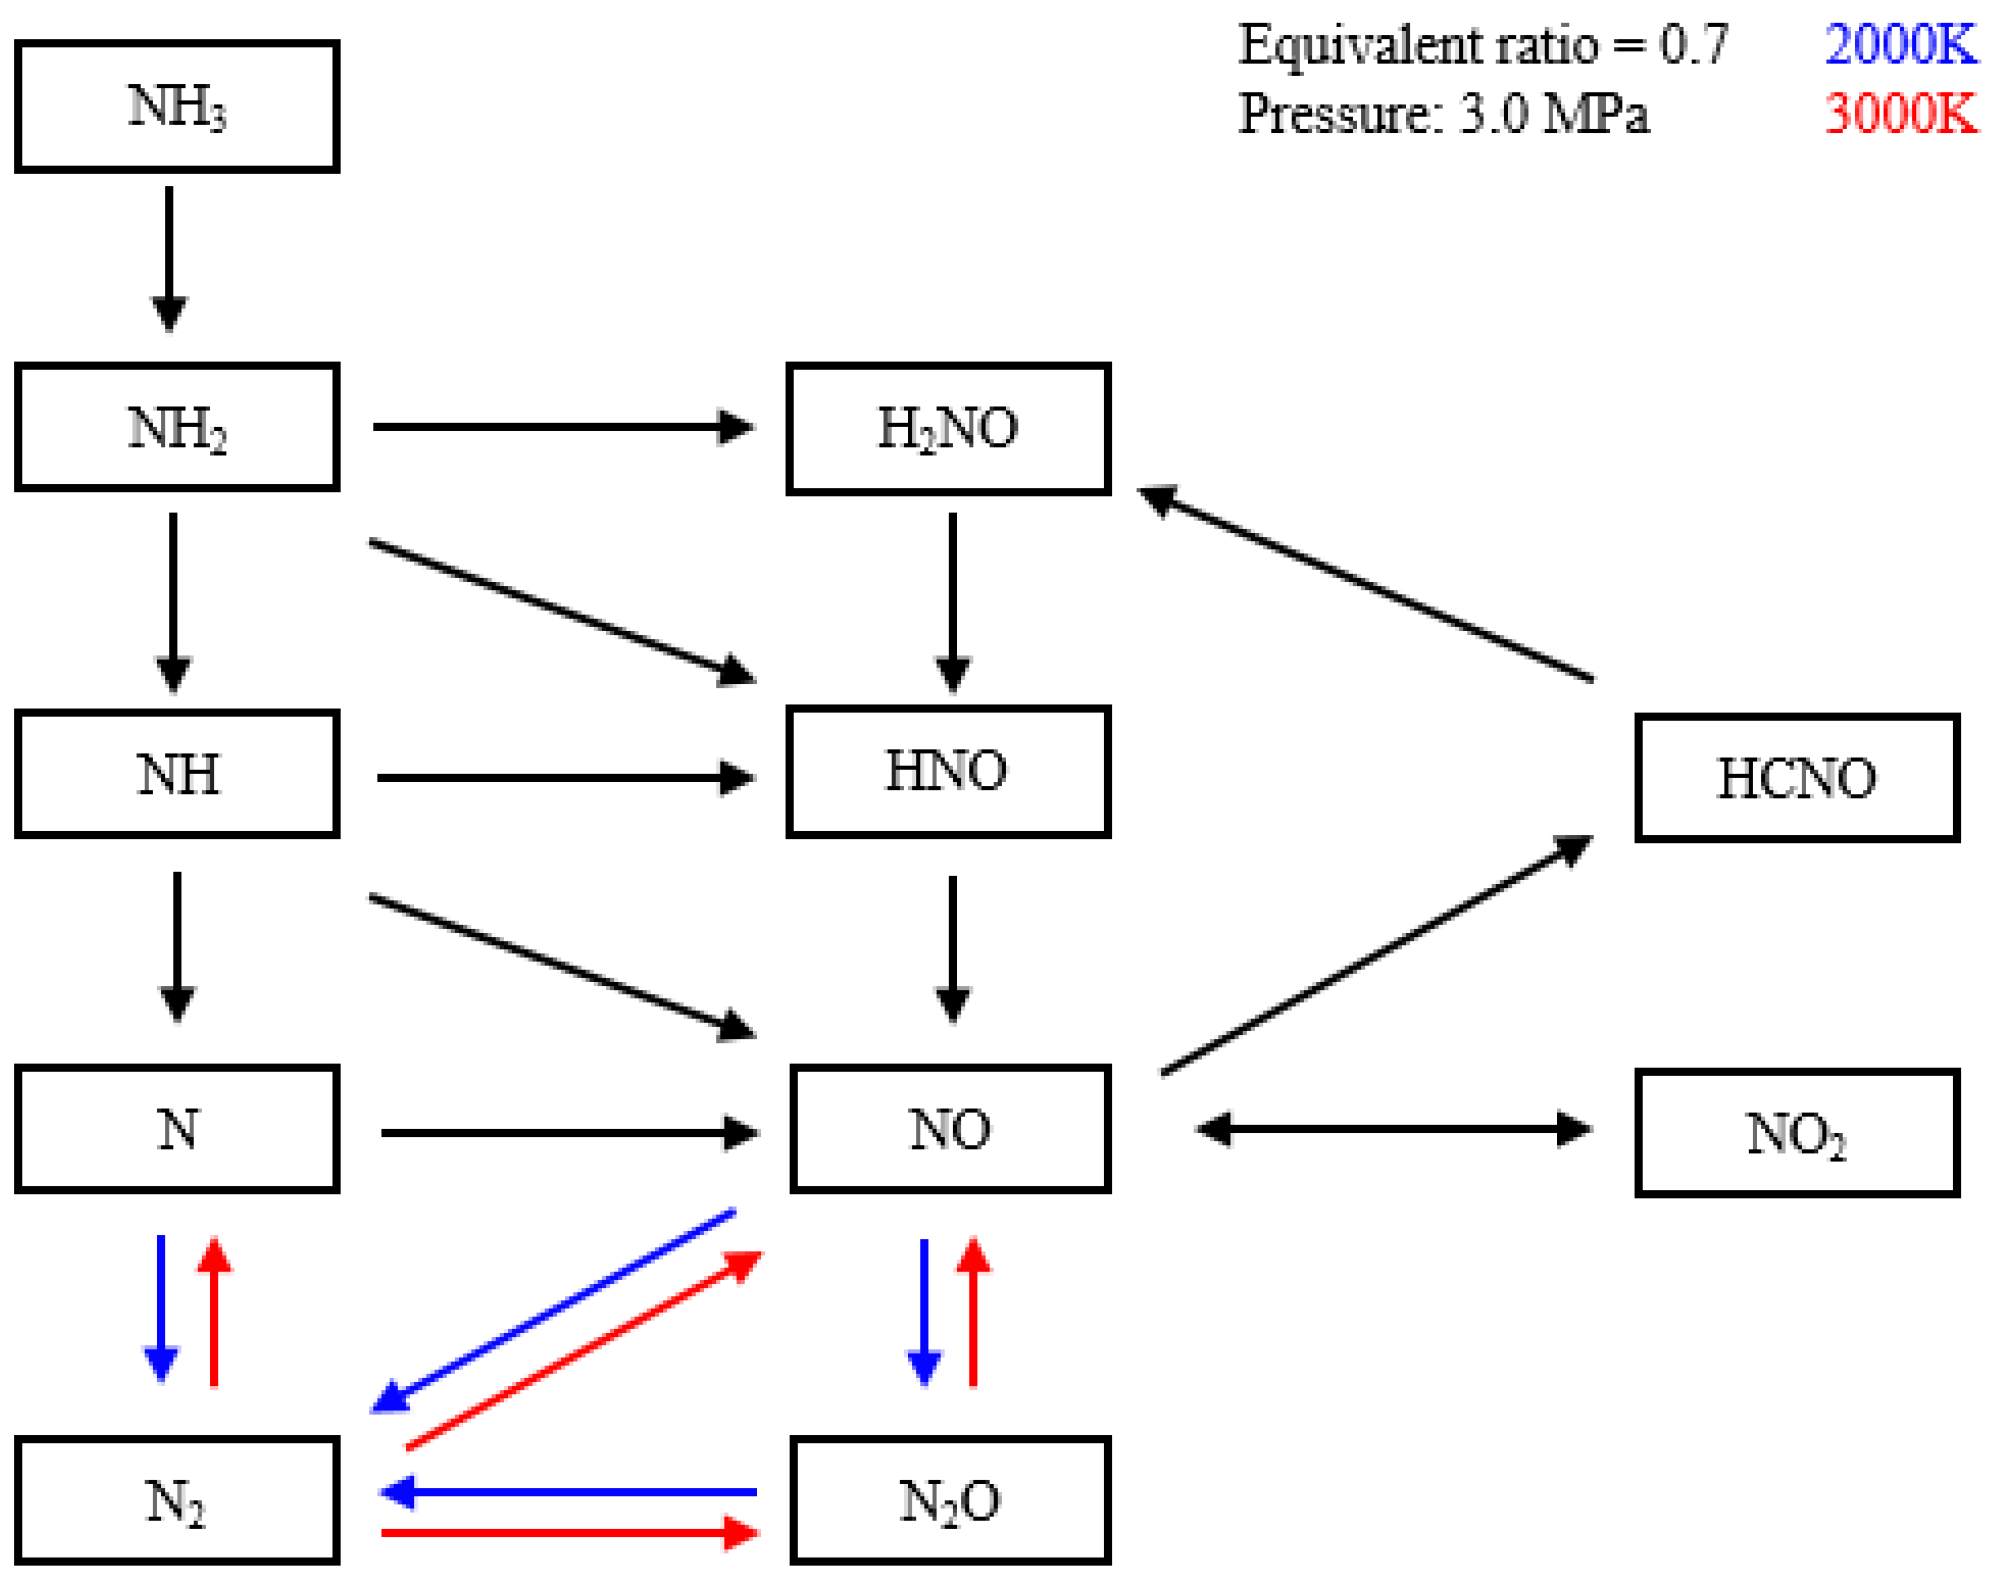
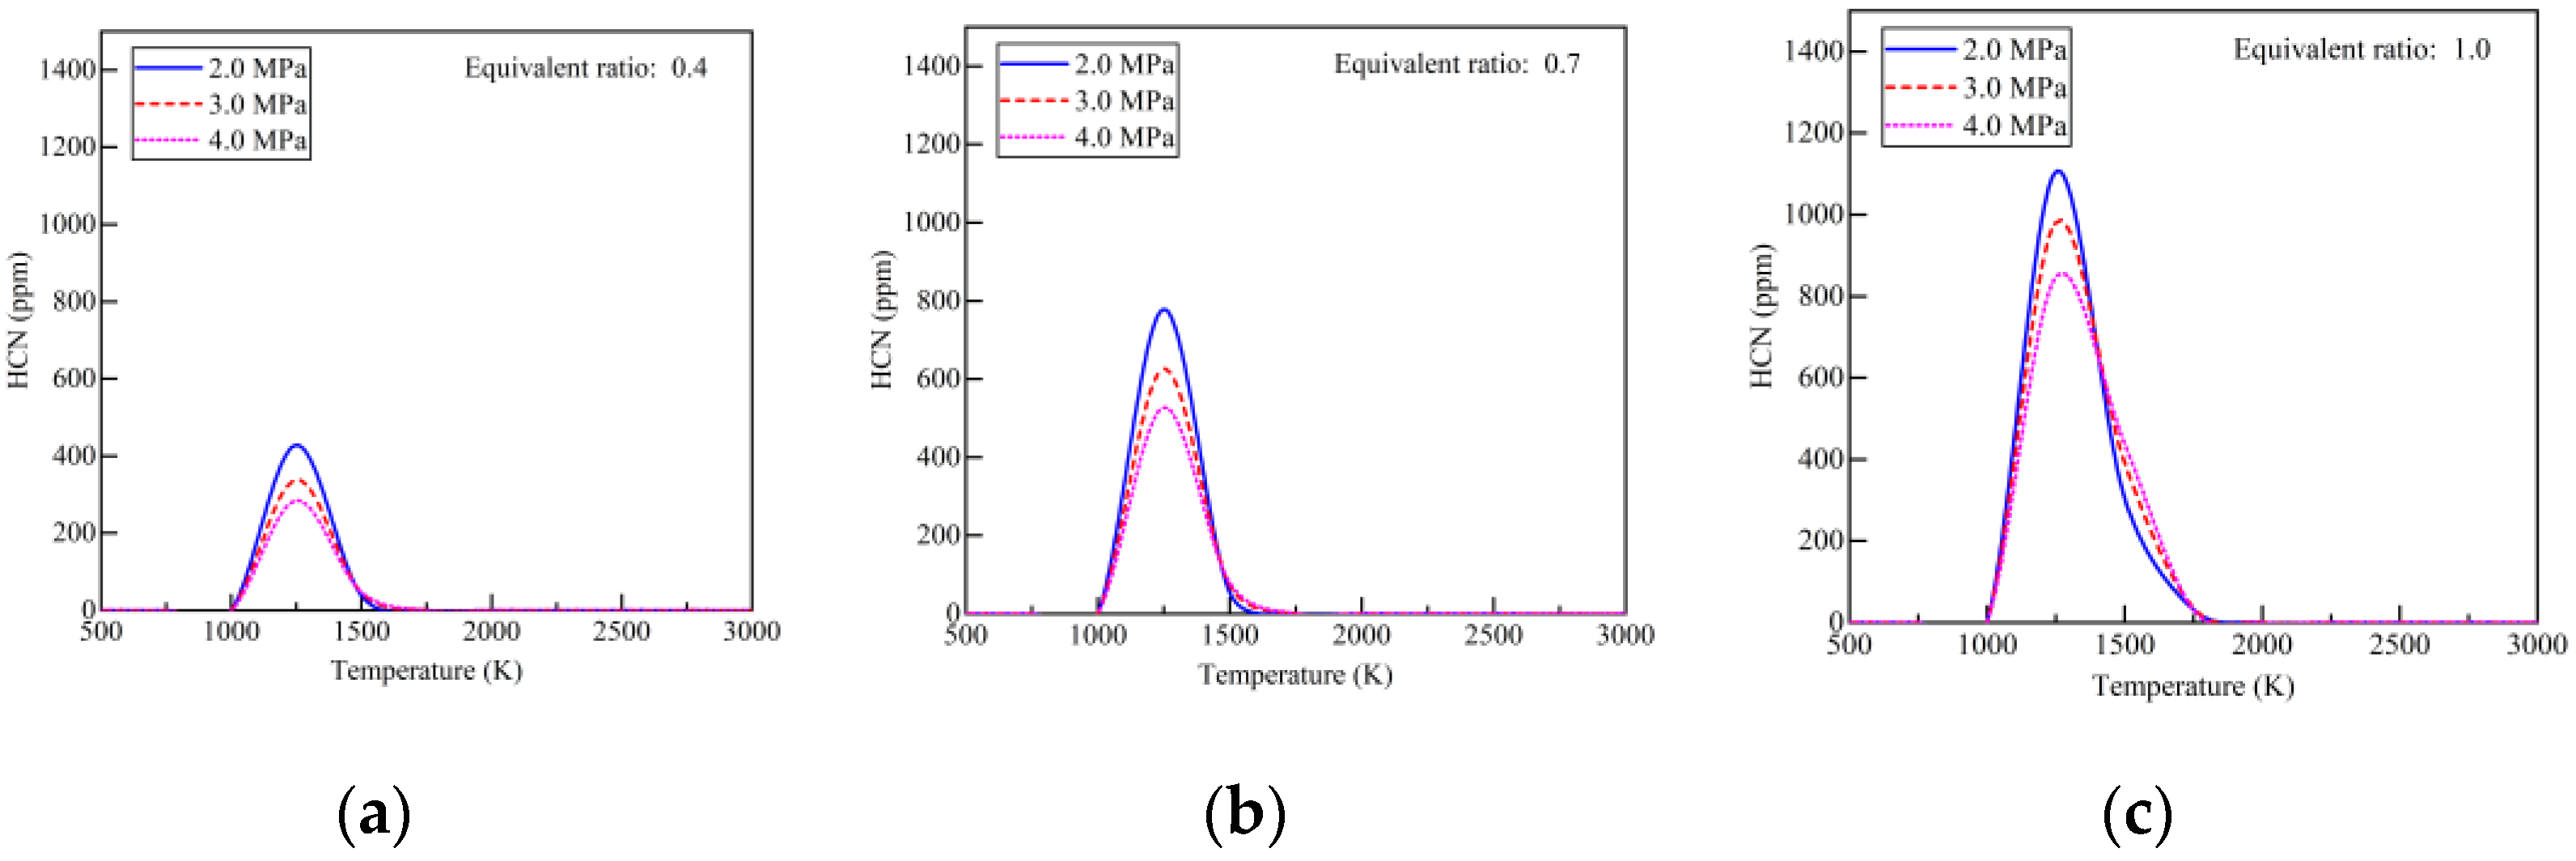
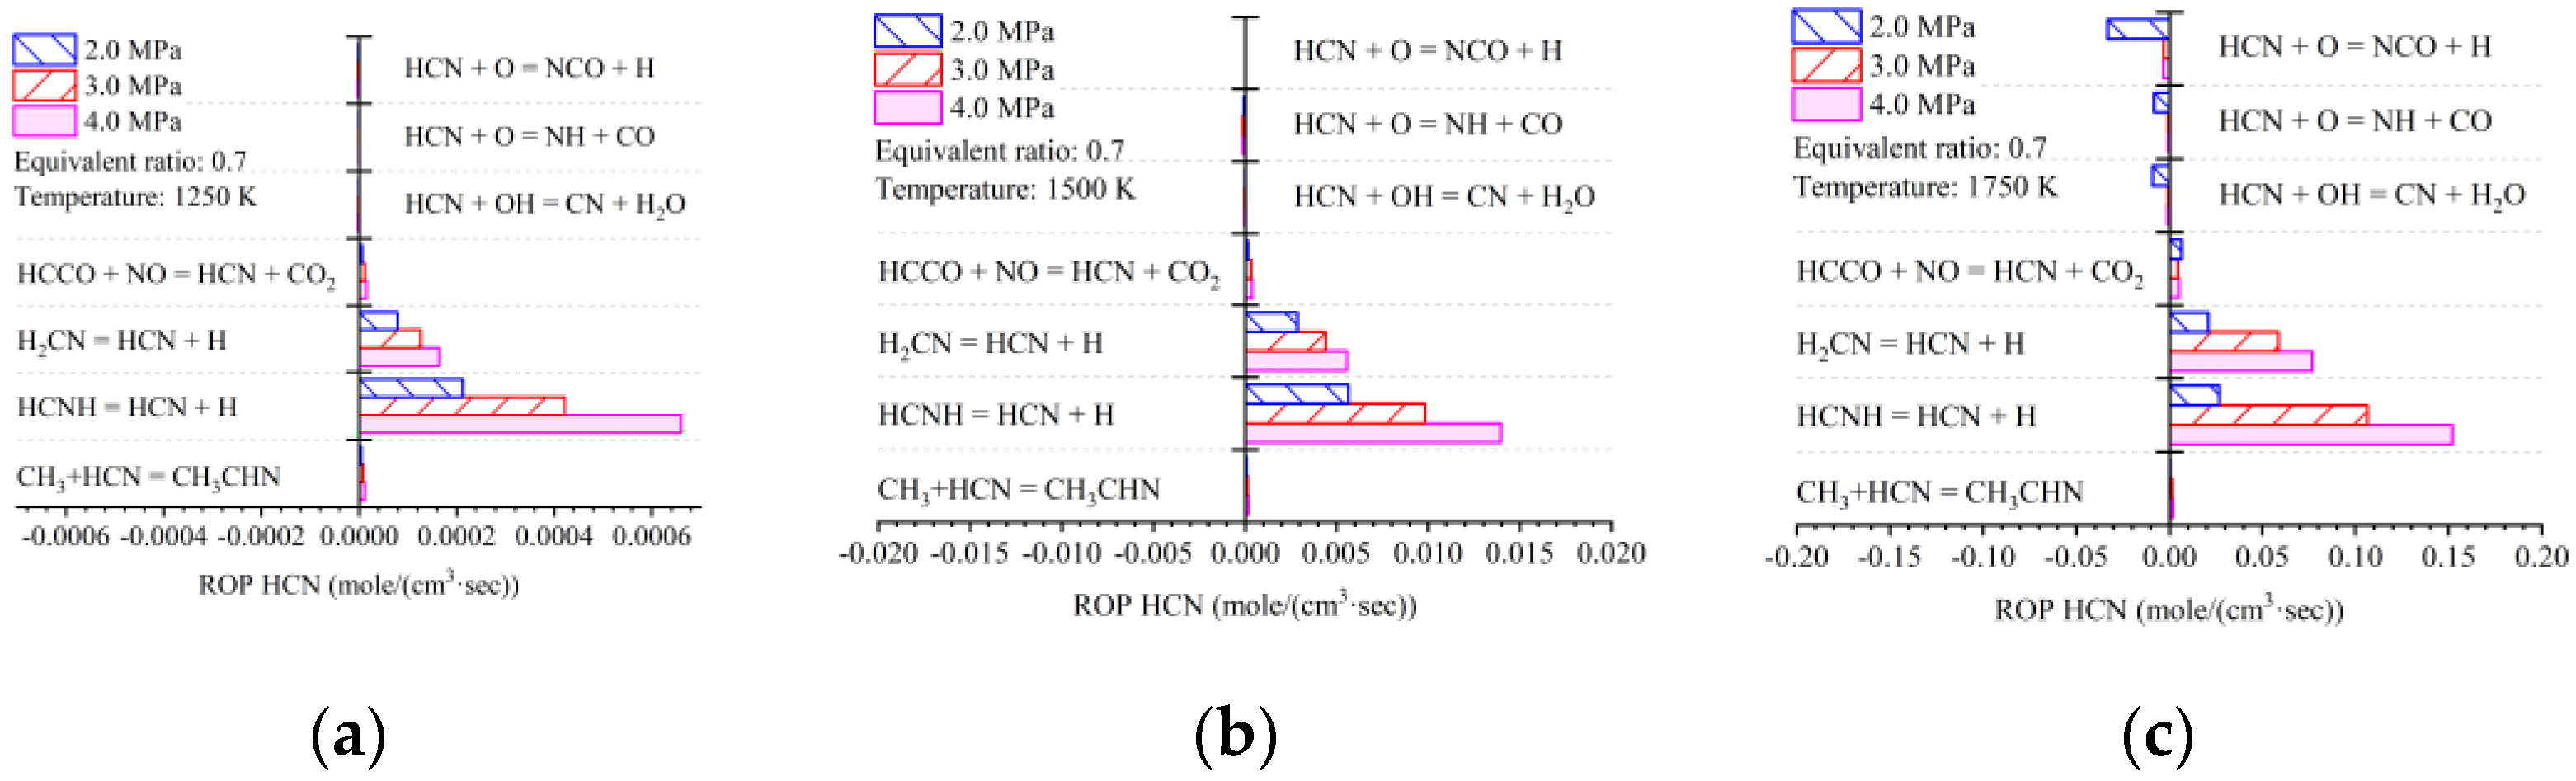
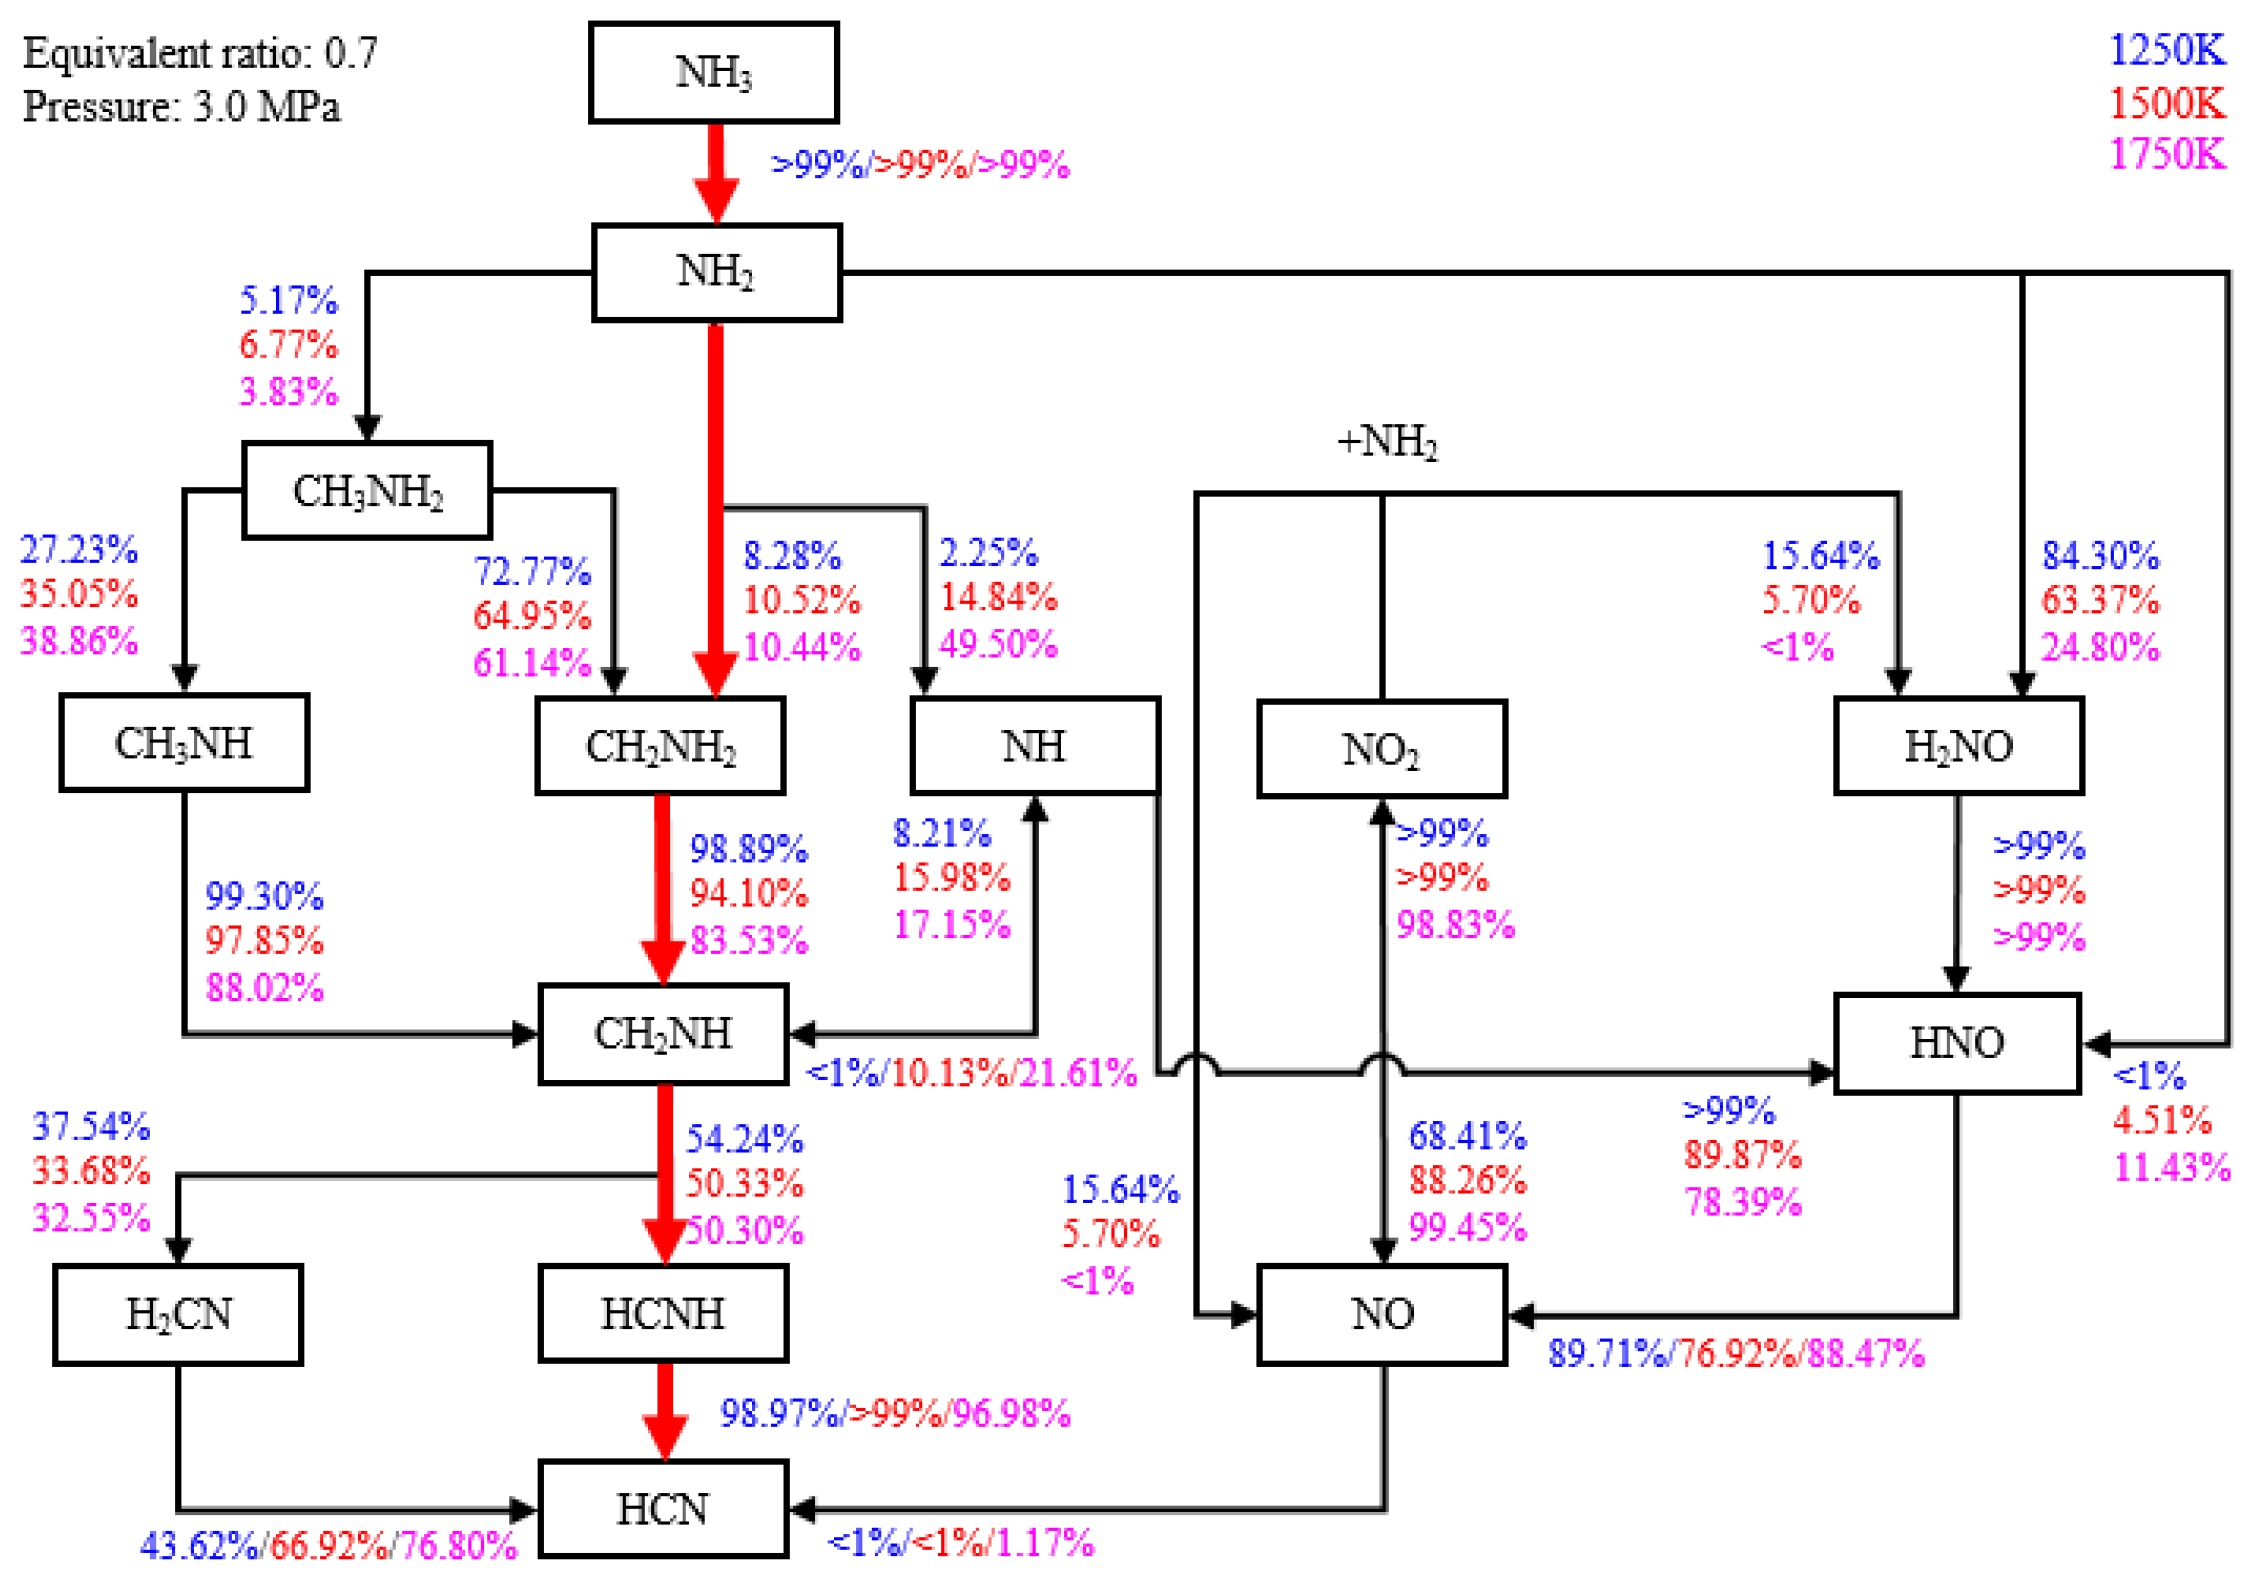
With the addition of ammonia, HCN emissions increased to 1.7 ppm, more than five times higher than those in diesel-only mode. The early pilot injection strategy stimulated HCN formation. The highest recorded HCN emission was 9.2 ppm. Simulation results indicate that HCN was produced when local temperatures ranged from 1000 K to 1750 K under fuel-lean conditions. Strategies for mitigating HCN emissions could involve increasing pilot injection fuel quantities, heating intake air, or advancing combustion phases closer to TDC.

Author Contributions

Conceptualization, Z.W.; methodology, K.C. and Y.Q.; software, K.C.; validation, K.C., Y.L. and Q.C.; formal analysis, Q.C. and L.L.; investigation, K.C. and Y.L.; resources, Z.W.; data curation, Q.C.; writing—original draft preparation, K.C.; writing—review and editing, Y.Q. and Z.W.; visualization, K.C.; supervision, Z.W.; project administration, Q.C.; funding acquisition, Z.W., Y.Q. and L.L. All authors have read and agreed to the published version of the manuscript.

Funding

This work was supported by the Ningbo Major Research and Development Plan Project (Grant No. 2022Z151) and the Natural Science Basic Research Program of Shaanxi (Program No. 2022JM-297).

Data Availability Statement

Data sharing not applicable.

Conflicts of Interest

The authors declare no conflict of interest.

References

  1. International Energy Agency, Beyond 20/20 WDS—Reports (iea.org). Available online: https://wds.iea.org/wds/ReportFolders/report-Folders.aspx (accessed on 30 August 2023).
  2. Dimitriou, P.; Javaid, R. A review of ammonia as a compression ignition engine fuel. Int. J. Hydrogen Energy 2020, 45, 7098–7118. [Google Scholar] [CrossRef]
  3. Berwal, P.; Kumar, S.; Khandelwal, B. A comprehensive review on synthesis, chemical kinetics, and practical application of ammonia as future fuel for combustion. J. Energy Inst. 2021, 99, 273–298. [Google Scholar] [CrossRef]
  4. Valera-Medina, A.; Xiao, H.; Owen-Jones, M.; David, W.I.F.; Bowen, P.J. Ammonia for power. Prog. Energy Combust. Sci. 2018, 69, 63–102. [Google Scholar] [CrossRef]
  5. Rosenthal, A.B. Energy depot—A concept for reducing the military supply burden. In SAE Technical Paper 1965; SAE: Warrendale, PA, USA, 1965; p. 650050. [Google Scholar] [CrossRef]
  6. Elbaz, A.M.; Wang, S.; Guiberti, T.F.; Roberts, W.L. Review on the recent advances on ammonia combustion from the fundamentals to the applications. Fuel Commun. 2022, 10, 100053. [Google Scholar] [CrossRef]
  7. Cornelius, W.; Huellmantel, W.L.; Mitchell, H.R. Ammonia as an engine fuel. In SAE Technical Paper 1965; SAE: Warrendale, PA, USA, 1965; p. 650052. [Google Scholar] [CrossRef]
  8. Gray, J.T.; Dimitroff, E.; Meckel, N.T.; Quillian, R.D. Ammonia fuel—Engine compatibility and combustion. In SAE Technical Paper 1966; SAE: Warrendale, PA, USA, 1966; p. 660156. [Google Scholar] [CrossRef]
  9. Blarigan, P.V. Advanced internal combustion engine research. In Proceedings of the 2000 DOE Hydrogen Program Review NREL/CP-570-28890 2000, San Ramon, CA, USA, 5 September–5 November 2000; pp. 1–19. [Google Scholar]
  10. Pearsall, T.J.; Garabedian, C.G. Combustion of anhydrous ammonia in diesel engines. In SAE Technical Paper 1967; SAE: Warrendale, PA, USA, 1967; p. 670947. [Google Scholar] [CrossRef]
  11. Bro, K.; Pedersen, P.S. Alternative diesel engine fuels: An experimental investigation of methanol, ethanol, methane and ammonia in a D.I. diesel engine with pilot injection. In SAE Technical Paper 1977; SAE: Warrendale, PA, USA, 1977; p. 770794. [Google Scholar] [CrossRef]
  12. Reiter, A.J.; Kong, S.-C. Demonstration of compression-ignition engine combustion using ammonia in reducing greenhouse gas emissions. Energy Fuels 2008, 22, 2963–2971. [Google Scholar] [CrossRef]
  13. Reiter, A.J.; Kong, S.-C. Combustion and emissions characteristics of compression-ignition engine using dual ammonia-diesel fuel. Fuel 2011, 90, 87–97. [Google Scholar] [CrossRef]
  14. Gill, S.S.; Chatha, G.S.; Tsolakis, A.; Golunski, S.E.; York, A.P.E. Assessing the effects of partially decarbonising a diesel engine by co-fuelling with dissociated ammonia. Int. J. Hydrogen Energy 2012, 37, 6074–6083. [Google Scholar] [CrossRef]
  15. U.S Evironmental Protection Agency. Understanding Global Warming Potentials. Available online: https://www.epa.gov/ghgemissions/understanding-global-warming-potentials (accessed on 30 August 2023).
  16. Niki, Y.; Yoo, D.-H.; Hirata, K.; Sekiguchi, H. Effects of ammonia gas mixed into intake air on combustion and emissions characteristics in diesel engine. In Proceedings of the ASME 2016 Internal Combustion Engine Fall Technical Conference, Greenville, SC, USA, 9–12 October 2016. [Google Scholar] [CrossRef]
  17. Niki, Y.; Nitta, Y.; Sekiguchi, H.; Hirata, K. Emission and combustion characteristics of diesel engine fumigated with ammonia. In Proceedings of the ASME 2018 Internal Combustion Engine Division Fall Technical Conference. Volume 1: Large Bore Engines; Fuels; Advanced Combustion, San Diego, CA, USA, 4–7 November 2018. [Google Scholar] [CrossRef]
  18. Niki, Y.; Nitta, Y.; Sekiguchi, H.; Hirata, K. Diesel fuel multiple injection effects on emission characteristics of diesel engine mixed ammonia gas into intake air. J. Eng. Gas Turbines Power 2019, 141, 061020. [Google Scholar] [CrossRef]
  19. Niki, Y. Reductions in unburned ammonia and nitrous oxide emissions from an ammonia-assisted diesel engine with early timing diesel pilot injection. J. Eng. Gas Turbines Power 2021, 143, 091014. [Google Scholar] [CrossRef]
  20. Yousefi, A.; Guo, H.; Dev, S.; Liko, B.; Lafrance, S. Effects of ammonia energy fraction and diesel injection timing on combustion and emissions of an ammonia/diesel dual-fuel engine. Fuel 2021, 314, 122723. [Google Scholar] [CrossRef]
  21. Yousefi, A.; Guo, H.; Dev, S.; Lafrance, S.; Liko, B. A study on split diesel injection on thermal efficiency and emissions of an ammonia/diesel dual-fuel engine. Fuel 2022, 316, 123412. [Google Scholar] [CrossRef]
  22. Mi, S.; Wu, H.; Pei, X.; Liu, C.; Zheng, L.; Zhao, W.; Qian, Y.; Lu, X. Potential of ammonia energy fraction and diesel pilot-injection strategy on improving combustion and emission performance in an ammonia-diesel dual fuel engine. Fuel 2023, 343, 127889. [Google Scholar] [CrossRef]
  23. Jin, S.; Wu, B.; Zi, Z.; Yang, P.; Shi, T.; Zhang, J. Effects of fuel injection strategy and ammonia energy ratio on combustion and emissions of ammonia-diesel dual-fuel engine. Fuel 2023, 314, 127668. [Google Scholar] [CrossRef]
  24. Pei, Y.Q.; Wang, D.C.; Jin, S.Y.; Gu, Y.C.; Wu, C.L.; Wu, B.Y. A quantitative study on the combustion and emission characteristics of an Ammonia-Diesel Dual-fuel (ADDF) engine. Fuel Process. Technol. 2023, 250, 107906. [Google Scholar] [CrossRef]
  25. Sun, W.C.; Zeng, W.P.; Guo, L.; Zhang, H.; Yan, Y.Y.; Lin, S.D.; Zhu, G.N.; Jiang, M.Q.; Yu, C.Y.; Wu, F. An optical study of the combustion and flame development of ammonia-diesel dual-fuel engine based on flame chemiluminescence. Fuel 2023, 349, 128507. [Google Scholar] [CrossRef]
  26. Hiraoka, K.; Matsunaga, D.; Kamino, T.; Honda, Y.; Toshinaga, K.; Murakami, Y.; Nakamura, H. Experimental and numerical analysis on combustion characteristics of ammonia and diesel dual fuel engine. In SAE Technical Paper 2023; 2023-32-0102; SAE: Warrendale, PA, USA, 2023. [Google Scholar]
  27. Imamori, Y.; Takahashi, T.; Ueda, H.; Yamada, S.; Tanaka, T.; Kogure, R. Experimental and Numerical Investigations of Emission Characteristics from Diesel-Ammonia-Fueled Industry Engines. In SAE Technical Paper 2023; 2023-32-0064; SAE: Warrendale, PA, USA, 2023. [Google Scholar]
  28. Siegień, I.; Bogatek, R. Cyanide action in plants—From toxic to regulatory. Acta Physiol. Plant. 2006, 28, 483–497. [Google Scholar] [CrossRef]
  29. Gail, E.; Gos, S.; Kulzer, R.; Lorösch, J.; Rubo, A.; Sauer, M.; Kellens, R.; Reddy, J.; Steier, N.; Hasenpusch, W. Cyano Compounds, Inorganic. Ullmann’s Encyclopedia of Industrial Chemistry; Wiley-VCH: Weinheim, Germany, 2012; pp. 673–678. [Google Scholar]
  30. Klüssmann, J.N.; Ekknud, L.R.; Ivarsson, A.; Schramm, J. Ammonia Application in IC Engines. In Special Report, a Report from the Advanced Motor Fuels Technology Collaboration Programme; IEA: Paris, France, 2020. [Google Scholar]
  31. Zengel, D.; Koch, P.; Torkashvand, B.; Grunwaldt, J.-D.; Casapu, M.; Deutschmann, O. Emission of toxic HCN during NOx removal by ammonia SCR in the exhaust of lean-burn natural gas engines. Angew. Chem. Int. Ed. 2020, 59, 14423–14428. [Google Scholar] [CrossRef]
  32. Dong, S.; Wang, B.; Jiang, Z.; Li, Y.; Gao, W.; Wang, Z. An experimental and kinetic modeling study of ammonia/n-heptane blends. Combust. Flame 2022, 246, 112428. [Google Scholar] [CrossRef]
  33. Mørch, C.S.; Bjerre, A.; Gøttrup, M.P.; Sorenson, S.C.; Schramm, J. Ammonia/hydrogen mixtures in an SI-engine: Engine performance and analysis of a proposed fuel system. Fuel 2011, 90, 854–864. [Google Scholar] [CrossRef]
  34. Shim, E.; Park, H.; Bae, C. Intake air strategy for low HC and CO emissions in dual-fuel (CNG-diesel) premixed charge compression ignition engine. Appl. Energy 2018, 225, 1068–1077. [Google Scholar] [CrossRef]
  35. Dagaut, P.; Glarborg, P.; Alzueta, M.U. The oxidation of hydrogen cyanide and related chemistry. Prog. Energy Combust. Sci. 2008, 34, 1–46. [Google Scholar] [CrossRef]
  36. Hong, D.; Guo, X.; Wang, C. A reactive molecular dynamics study of HCN oxidation during pressurized oxy-fuel combustion. Fuel Process. Technol. 2021, 224, 107020. [Google Scholar] [CrossRef]
Figure 1. Schematic of engine test bench.
Energies 16 07004 g001
Figure 2. Cylinder pressure and AHRR of various strategies: (a) different ammonia energy ratio, (b) different SOI1, and (c) different SOI2.
Energies 16 07004 g002
Figure 3. Combustion phases of various injection strategies: (a) different ammonia energy ratio, (b) different SOI1, and (c) different SOI2.
Energies 16 07004 g003
Figure 4. Ammonia combustion efficiency of various strategies: (a) different SOI1 and (b) different SOI2.
Energies 16 07004 g004
Figure 5. CO emissions of various strategies: (a) different ammonia energy ratio, (b) different SOI1, and (c) different SOI2.
Energies 16 07004 g005
Figure 6. THC emissions of various strategies: (a) different ammonia energy ratio, (b) different SOI1, and (c) different SOI2.
Energies 16 07004 g006
Figure 7. NOx emissions of various strategies: (a) different ammonia energy ratio, (b) different SOI1, and (c) different SOI2.
Energies 16 07004 g007
Figure 8. Effects of temperature on NO formation of various background gas under (a) φ = 0.4, (b) φ = 0.7, and (c) φ = 1.0.
Energies 16 07004 g008
Figure 9. Chemical reaction path of NO under different temperatures (Blue: 2000 K Red: 3000 K).
Energies 16 07004 g009
Figure 10. N2O emissions of various strategies: (a) different ammonia energy ratio, (b) different SOI1, and (c) different SOI2.
Energies 16 07004 g010
Figure 11. HCN emissions of various strategies: (a) different ammonia energy ratio, (b) different SOI1, and (c) different SOI2.
Energies 16 07004 g011
Figure 12. Effects of temperature on HCN formation at different pressures under (a) φ = 0.4, (b) φ = 0.7, and (c) φ = 1.0.
Energies 16 07004 g012
Figure 13. ROP of HCN at the maximum heat release rate under different pressures at (a) 1250 K, (b) 1500 K, and (c) 1750 K.
Energies 16 07004 g013
Figure 14. Key reaction pathways of HCN formation and the contribution of the pathways for each species under different temperatures (Blue: 1250 K; red: 1500 K; Purple: 1750 K).
Energies 16 07004 g014
Table 1. Engine parameters.
Description (Units)Value
Bore (mm)131
Stroke (mm)160
Connecting rod (mm)257
Geometric compression ratio (-)18.0
Combustion chamber geometry (-)ω, re-entrant
DI nozzle number (-)7
Table 2. Properties of the diesel and ammonia [4].
Description (Units)DieselAmmonia
CN (-)56.5--
Octane number (-)--130
Carbon contents (%(m/m))86.450.00
Hydrogen contents (%(m/m))13.4917.65
Oxygen contents (%(m/m))0.050.00
LHV (MJ/kg)42.6818.8
Table 3. Engine operating conditions.
Condition123456
Engine speed (r/min)800800800800800800
IMEP (MPa)0.5560.5590.5540.5570.5570.557
Ammonia injection pressure (MPa)--0.40.40.40.40.4
Ammonia flow rate (kg/h)--0.6460.6300.6340.6320.624
DI pilot injection timing (°CA ATDC)−6.5−6.5−64.0−90.0−64.0−64.0
DI pilot injection rate (mg/cycle)5.05.05.05.05.05.0
DI main injection timing (°CA ATDC)−1.0−1.0−1.0−1.0−3.0−5.0
DI main injection rate (mg/cycle)VaryingVaryingVaryingVaryingVaryingVarying
Common rail pressure (MPa)110.0110.0110.0110.0110.0110.0
Table 4. Simulation conditions.
Condition1234
Fuel equivalent ratio (-)0.40.71.00.4–1.0
Mole fraction of ammonia (%)1.681.671.661.68–1.66
Mole fraction of n-heptane (%)0.631.181.730.63–1.73
Mole fraction of O2 (%)20.520.420.320.5–20.3
Mole fraction of N2 (%)77.276.776.30
Mole fraction of Ar (%)00077.2–76.3
Temperature (K)500–3000500–3000500–3000500–3000
Pressure (MPa)2.0–4.02.0–4.02.0–4.03.0
End time (ms)1.01.01.01.0
Disclaimer/Publisher’s Note: The statements, opinions and data contained in all publications are solely those of the individual author(s) and contributor(s) and not of MDPI and/or the editor(s). MDPI and/or the editor(s) disclaim responsibility for any injury to people or property resulting from any ideas, methods, instructions or products referred to in the content.

