Article

Effect of Nano-MgO Doping in XLPE on Charge Transport and Electric Field Distribution in Composite Insulation of HVDC Cable Joint

1
College of Electrical Engineering, Shanghai University of Electric Power, Shanghai 200090, China
2
State Grid Fuyang City Suburban Power Supply Company, Fuyang 236000, China
*
Author to whom correspondence should be addressed.
Energies 2022, 15(19), 6948; https://doi.org/10.3390/en15196948
Submission received: 22 August 2022 / Revised: 12 September 2022 / Accepted: 16 September 2022 / Published: 22 September 2022

Abstract

:
The space charge characteristics of cross-linked polyethylene (XLPE) can be improved to some extent by doping the appropriate amount of nano-MgO. In this study, in order to explore the influence of nano-MgO on the space charge and electric field distributions of the composite insulation of high voltage direct current (HVDC) cable joints, the effect of nano-MgO concentration on the depth and density of the deep traps in MgO/XLPE was first analyzed. On this basis, the charge transport simulation model of a 320 kV HVDC cable joint was established with MgO/XLPE as the cable insulation, and the space charge and electric field distributions of the cable joint under different temperature conditions were simulated. It was found that the radial charge distribution in the joint shows different trends with the change of nano-MgO concentration. There is a significant difference in the charge density on both sides of the (MgO/XLPE)/EPDM interface, and the difference first decreased and then increased with the increase of concentration. When the nano-MgO concentration was 0.5 wt%, the number of charges in the radial direction is the fewest, and the maximum value is only 0.42 C/m−3. The radial electric field changed abruptly at the (MgO/XLPE)/EPDM interface, and it was homogenized to a certain extent with time. It was found that the highest electric field of the interface is at the root of the stress cone, which is the weakest point of the joint insulation. When the nano-MgO concentration was 0.5 wt%, the electric field at the root of the stress cone was found to be the lowest, with a value of 13.38 kV/mm. A comprehensive comparison shows that the joint can maintain better insulation when the concentration is 0.5 wt% compared to other concentrations. The results can provide a basis for further improving the insulation properties of HVDC cable joints through nano doping technology.

1. Introduction

High voltage direct current (HVDC) cross-linked polyethylene (XLPE) cables are widely used in long-distance and large-capacity power transmission due to their excellent electrical, thermal, and mechanical properties [1,2]. Cable joints are the key connection components in cable systems. However, at the joint installation part, due to the mismatch between the dielectric parameters of the cable insulation XLPE and the joint insulation Ethylene-propylene-diene monomer (EPDM), space charges are easily accumulated at the interface of XLPE/EPDM, which leads to electrical field distortion, accelerates the insulation aging, and even causes breakdown [3,4,5,6,7]. Therefore, the cable joint has become the weakest link of the HVDC cable system, the reliability of which directly affects the stability of the entire cable line [8,9,10].
With the development of nanotechnology, it has been found that the uniform dispersion of a low number of nanoparticles in polymers can significantly improve the electrical properties of the material [11,12], which is believed to be related to the interfacial region formed between the nanoparticles and the polymer matrix [13,14]. The interfacial region changes the distribution, relaxation, and free volume of the polymer molecular chains, which have significant effects on the charge injection barrier, charge trap depth, and trap density [15,16], and in turn changes the space charge characteristics of the material. Some scholars have proposed different models to describe the properties of nanocomposites based on experiments and theoretical analysis and one of the most representative is the multi-core model proposed by T. Tanaka [16]. As shown in Figure 1, according to the multi-core model, the interfacial region between nanoparticles and the polymer matrix consists of three layers: the innermost layer is the bonded layer, the middle layer is the bound layer, and the outermost layer is the loose layer. The ability of each layer to trap charges is different, and the depth of the charge trap gradually decreases from the inner layer to the outer layer. Studies have shown that adding an appropriate amount of nano-MgO to XLPE can improve the space charge characteristics of the material to a certain extent [14,15,16,17,18]; however, its effects on the space charge characteristics—especially the interfacial charge characteristics of the composite insulation composed of XLPE and EPDM at the actual HVDC cable joint—are not clear.
In this work, in order to clarify the influence of nano-MgO doping for XLPE cable body insulation on the space charge characteristics of the composite insulation at the cable joint, the depths and densities of the deep traps in MgO/XLPE with different nano-MgO concentrations were calculated based on theoretical analysis. Then, combined with the operating characteristics and the structure of 320 kV HVDC cable joint, the charge transport simulation model of the HVDC cable joint was established using multi-physics coupling finite element software. Finally, based on the simulation model and the trap parameters obtained from theoretical analysis, the effects of nano-MgO concentration and temperature distribution of the cable joint on the space charge accumulation (especially the interfacial charge accumulation) and electrical field distribution in the composite insulation composed of MgO/XLPE and EPDM are discussed here in detail. This study provides a certain support for revealing the charge transport mechanism of the composite insulation at the cable joint after the cable body insulation (XLPE) is modified by adding nano-MgO.

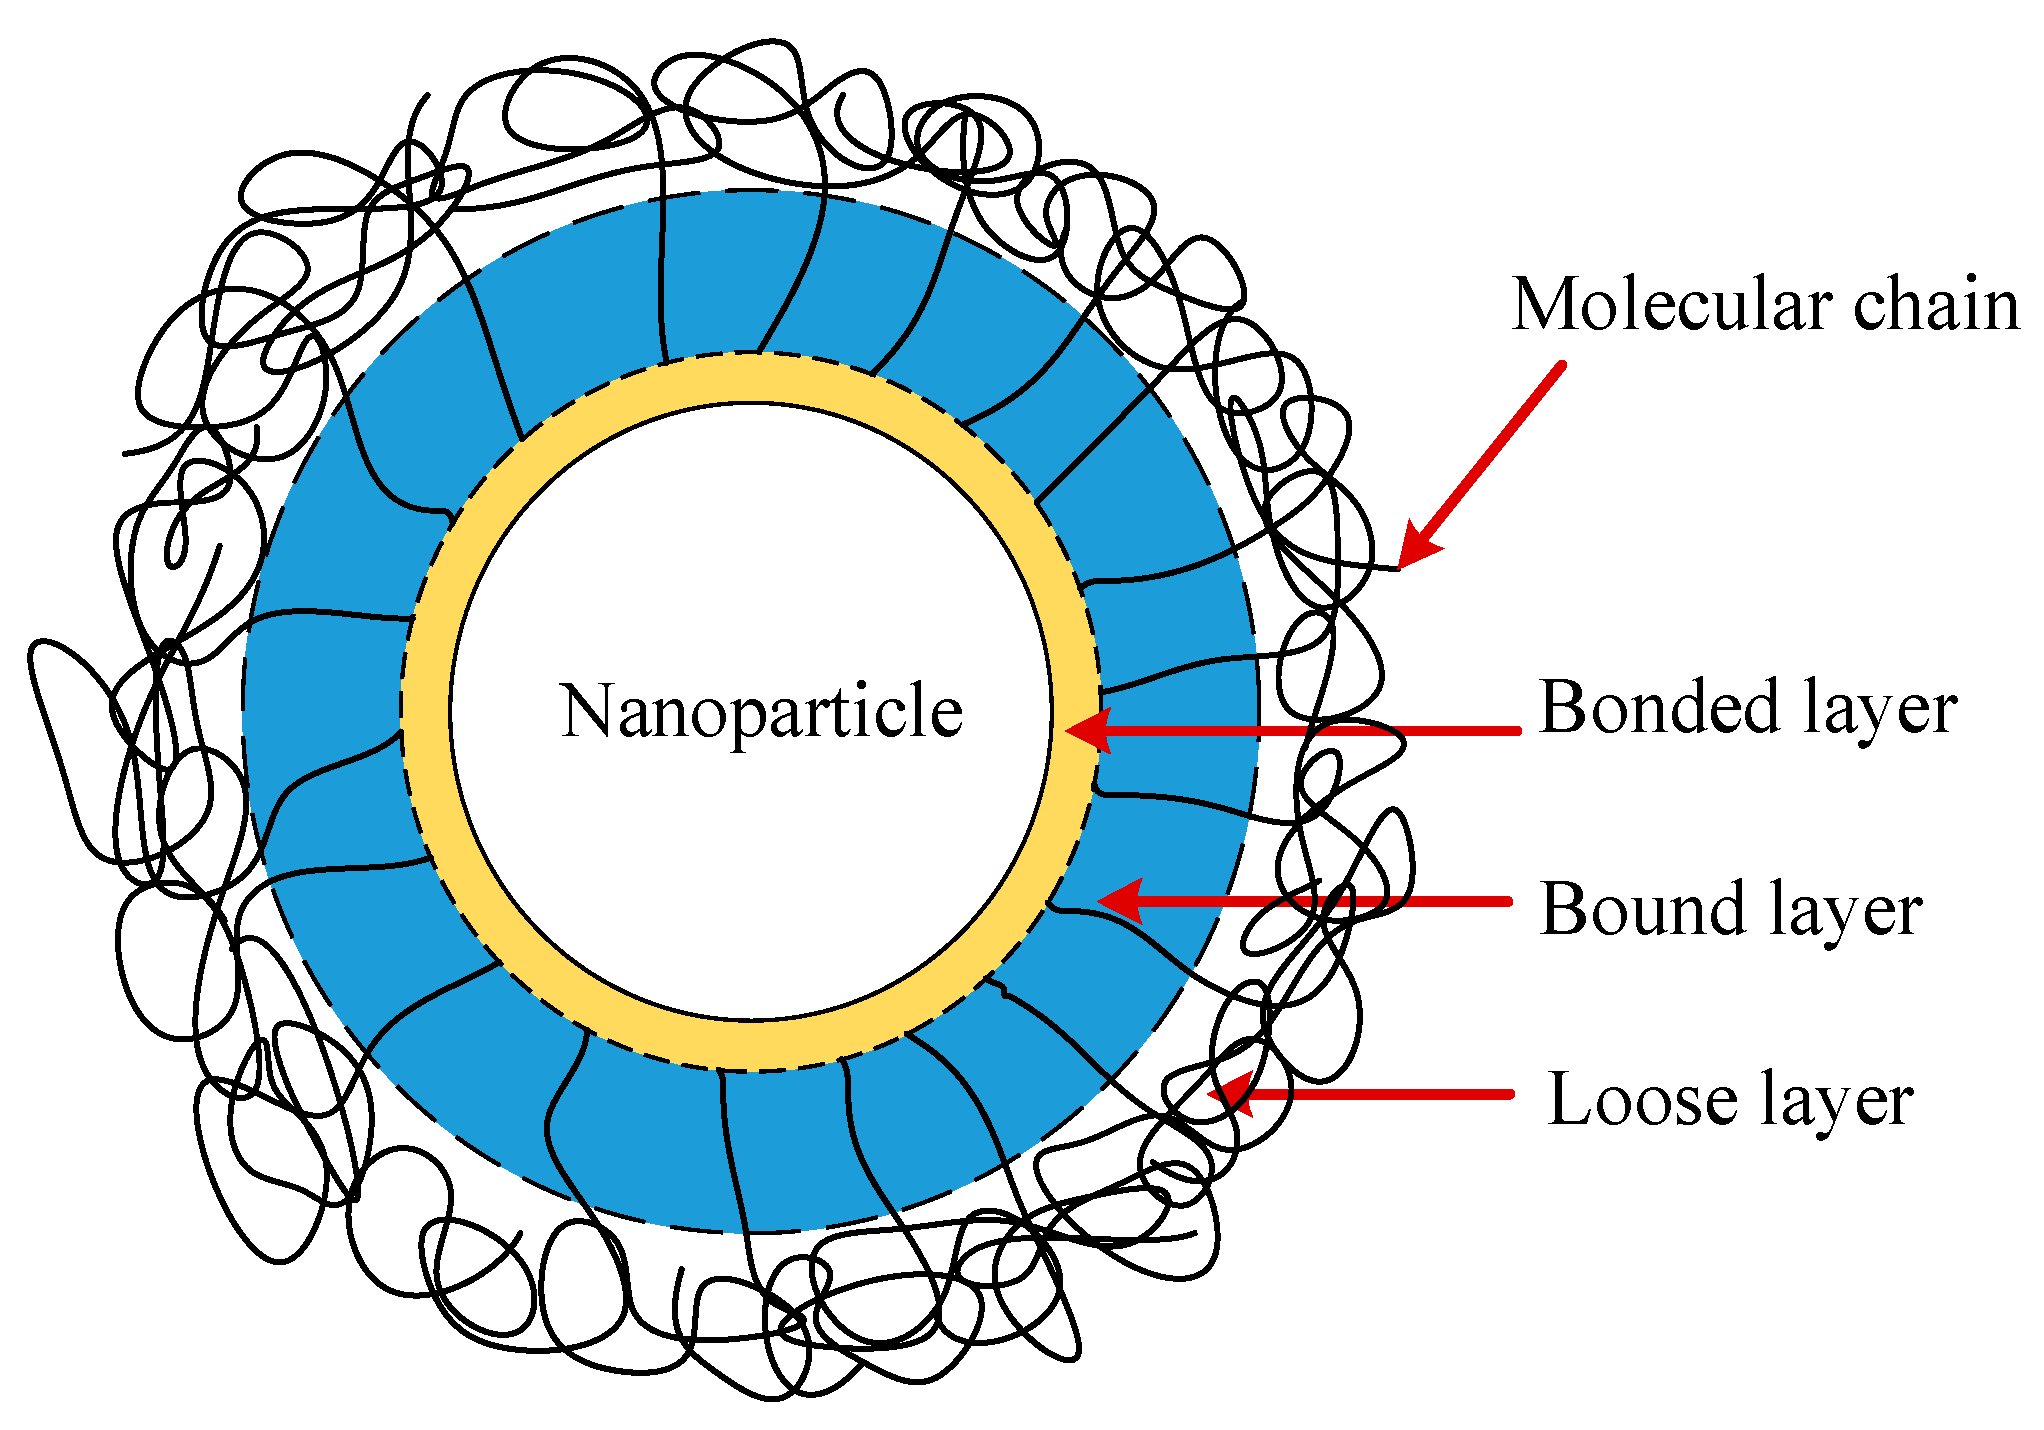
2. Trap Parameters Evaluation of MgO/XLPE

2.1. Trap Depth Evaluation

The trap depths of MgO/XLPE with different nano-MgO concentrations are calculated by theoretical analysis on the basis of the space charge measurement results of MgO/LDPE plate samples previously conducted by the current authors. The ultra-clean LDPE pellets and nano-MgO particles with a diameter of 20 nm were used to prepare the MgO/LDPE plate samples and the nano-MgO concentrations were 0 (pure XLPE), 0.1, 0.5, 1.0, and 2.0 wt%, respectively. The space charge measurements were carried out at room temperature and the specific measurement procedure as well as the results can be found in [14]. Based on the apparent trap-controlled mobilities of MgO/LDPE with different nano-MgO concentrations during the depolarization obtained in [19], here we further calculate the trap depth. The apparent trap-controlled mobility decay curves are segmented and each segment can be fitted according to the following equation [20]:
Δ U i = k T ln ( μ a k T v e R 2 )
where ΔUi is the calculated trap depth, µa is the apparent trap-controlled mobility, v is the escape frequency, k is the Boltzmann constant, T is the temperature, and R is the distance between local states. In this work, the apparent trap-controlled mobility curve segment from 100 s to 200 s was selected to calculate the trap depths of pure XLPE and MgO/XLPE, and the calculated results are shown in Table 1, which are used in the charge transport simulation of HVDC cable joints.

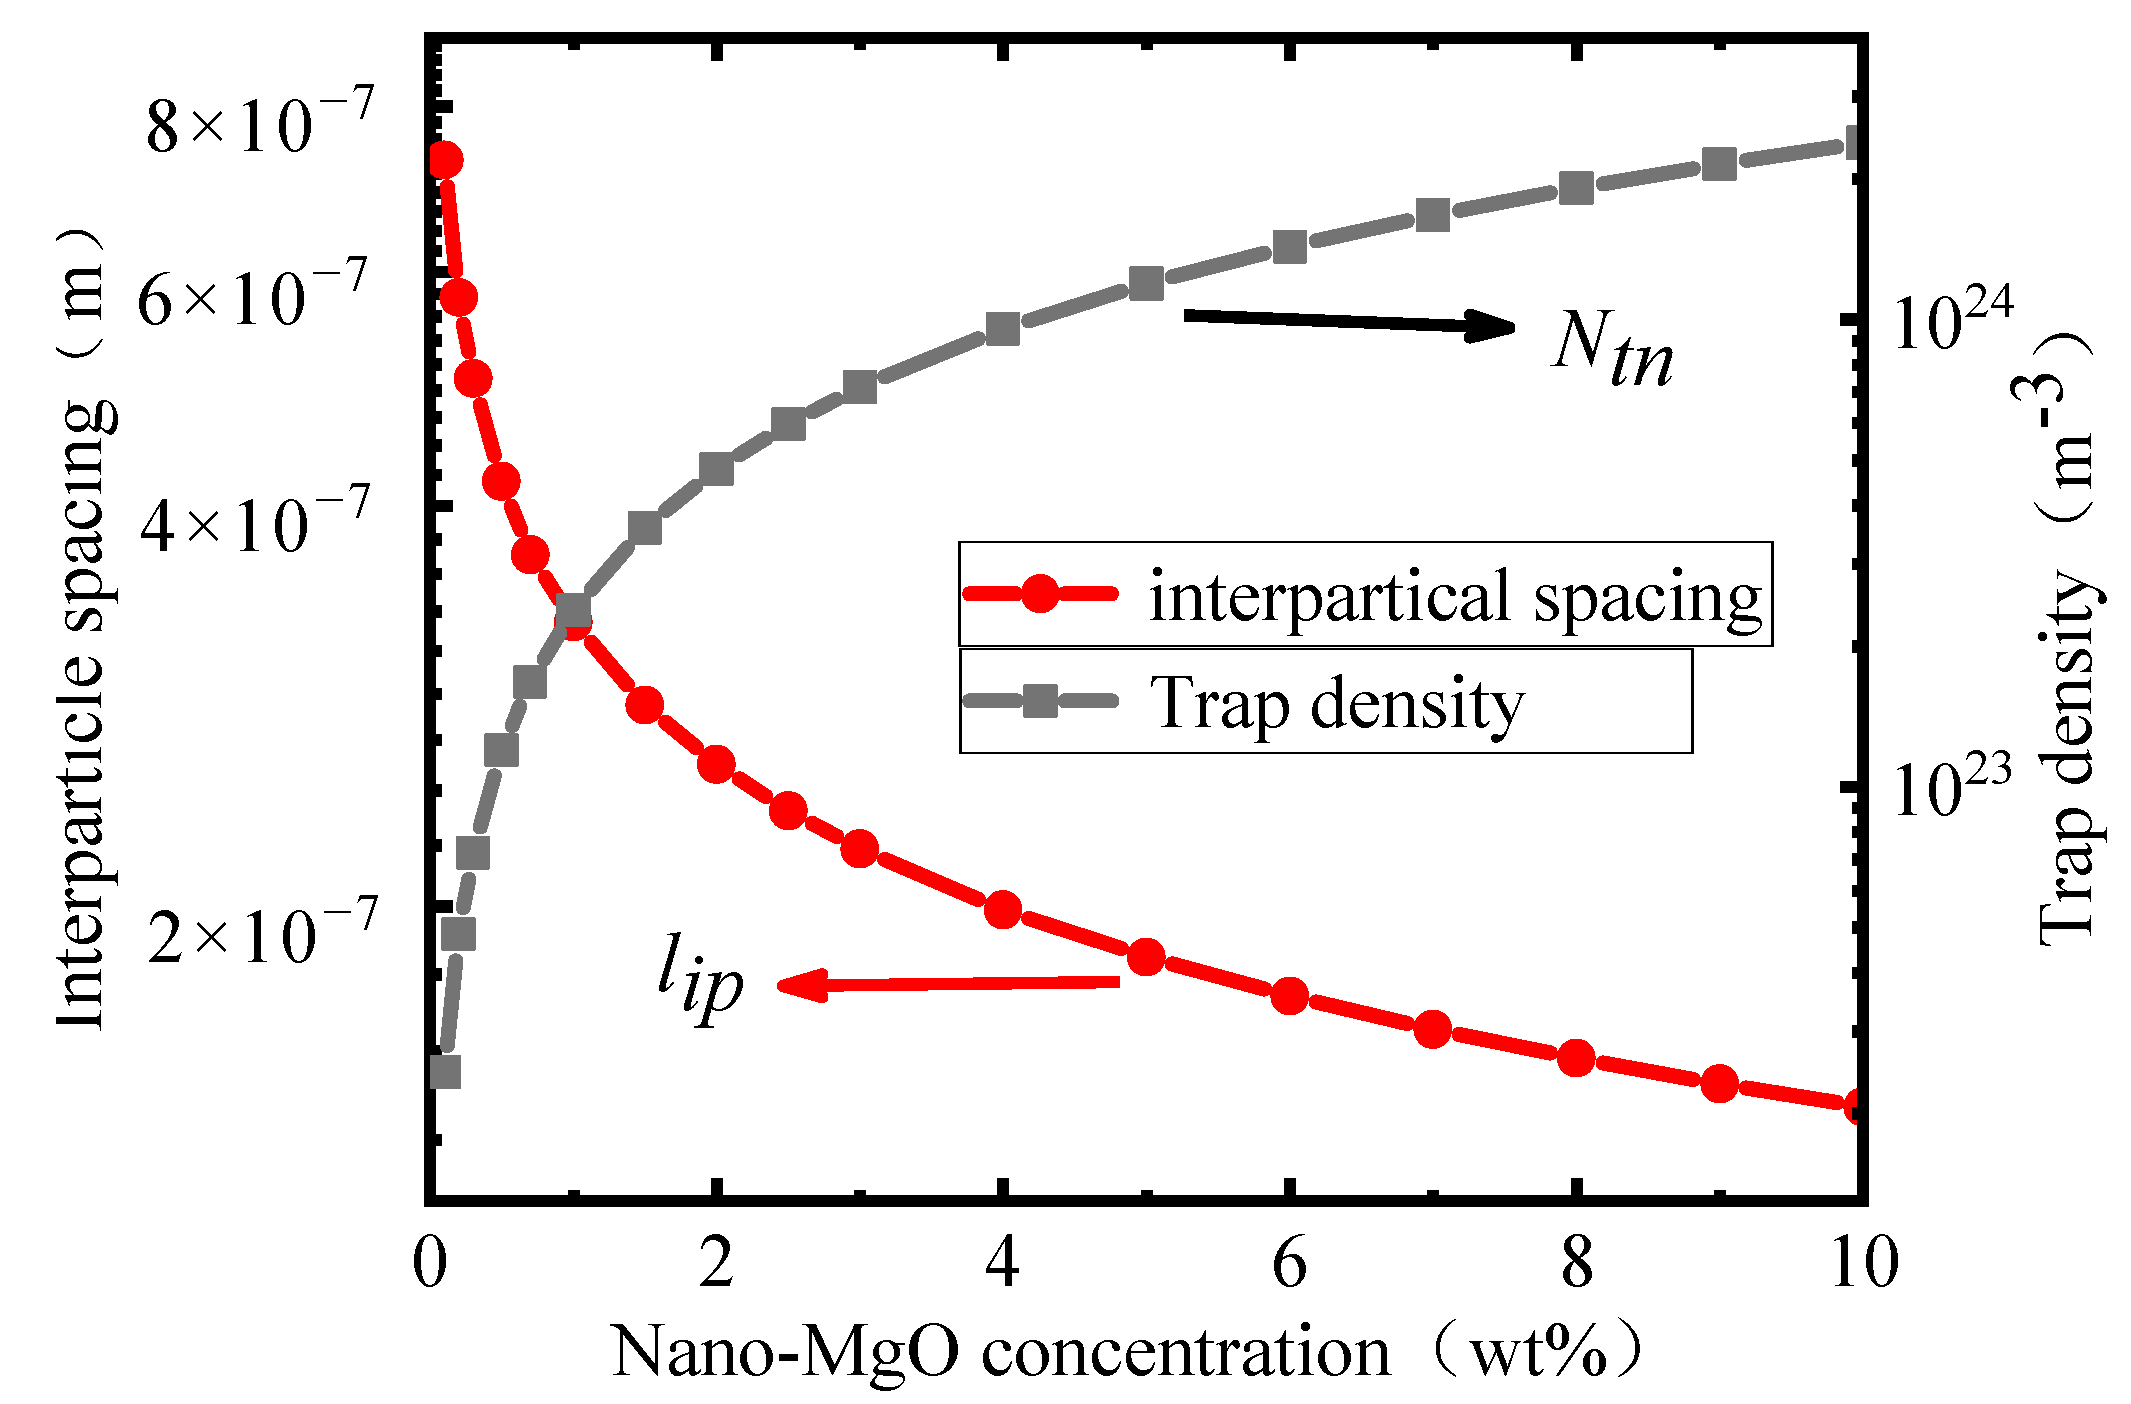
2.2. Trap Density Evaluation

Assuming that the spherical nanoparticles are uniformly distributed in the polymer matrix, the volume fraction of nanoparticles can be expressed as [21,22]:
f v = π 6 ( l n l n + l ip ) 3
where ln is the diameter of the nanoparticle, and lip is the spacing between two nanoparticles. The volume fraction of nanoparticles can also be described as [16]:
1 f v = 1 f m ρ n ρ p [ 1 f m ( 1 ρ n ρ p ) ]
where ρ n and ρ p are the densities of nanoparticles and polymer matrix, respectively; fm is the mass fraction of nanoparticles, which can be calculated as fm = mn/(mn + mp); and mn and mp are the masses of nanoparticles and polymer matrix, respectively. From Equations (2) and (3), the relationship between the spacing, the volume fraction, and the diameter of nanoparticles can be obtained [21]:
l ip = l n [ ( π 6 1 f v ) 1 3 1 ]
According to the multi-core model, deep traps may be formed around each nanoparticle, so the density of deep traps is proportional to (ln + lip)1/3; then, with the doping of nanoparticles, the additional deep trap density introduced into the composite due to the increase in the interfacial region can be expressed as [11]:
N Tn = ζ / ( l n + l ip ) 3
where ζ is the parameter characterizing the formation of deep traps in the interfacial region around the nanoparticle and its value is 10,000 [16]. After adding nanoparticles, the deep trap density in the nanocomposite can be expressed as:
N T = N Tp + N Tn
where NTp is the original deep trap density in the polymer matrix without nanoparticles (NTp of XLPE and EPDM are set to be 100 C/m3 in this simulation, that is, 6.24 × 10²⁰ m−3).
It can be seen from Equations (4)–(6) that with the increase of the nano-MgO concentration, the spacing between nanoparticles decreases significantly, leading to the increase of the deep trap density, and the specific calculation results are shown in Figure 2.
The increase of the deep trap density leads to an increase in the charge trapping coefficient, which further causes more free charges to be converted into trapped charges. The above process in the material after the addition of nano-MgO is shown in Figure 3.
Table 2 shows the calculated deep trap densities for 0, 0.1, 0.5, 1.0, and 2.0 wt% MgO/XLPE, which are used in the charge transport simulation of HVDC cable joints.

3. Charge Transport Simulation of HVDC Cable Joint

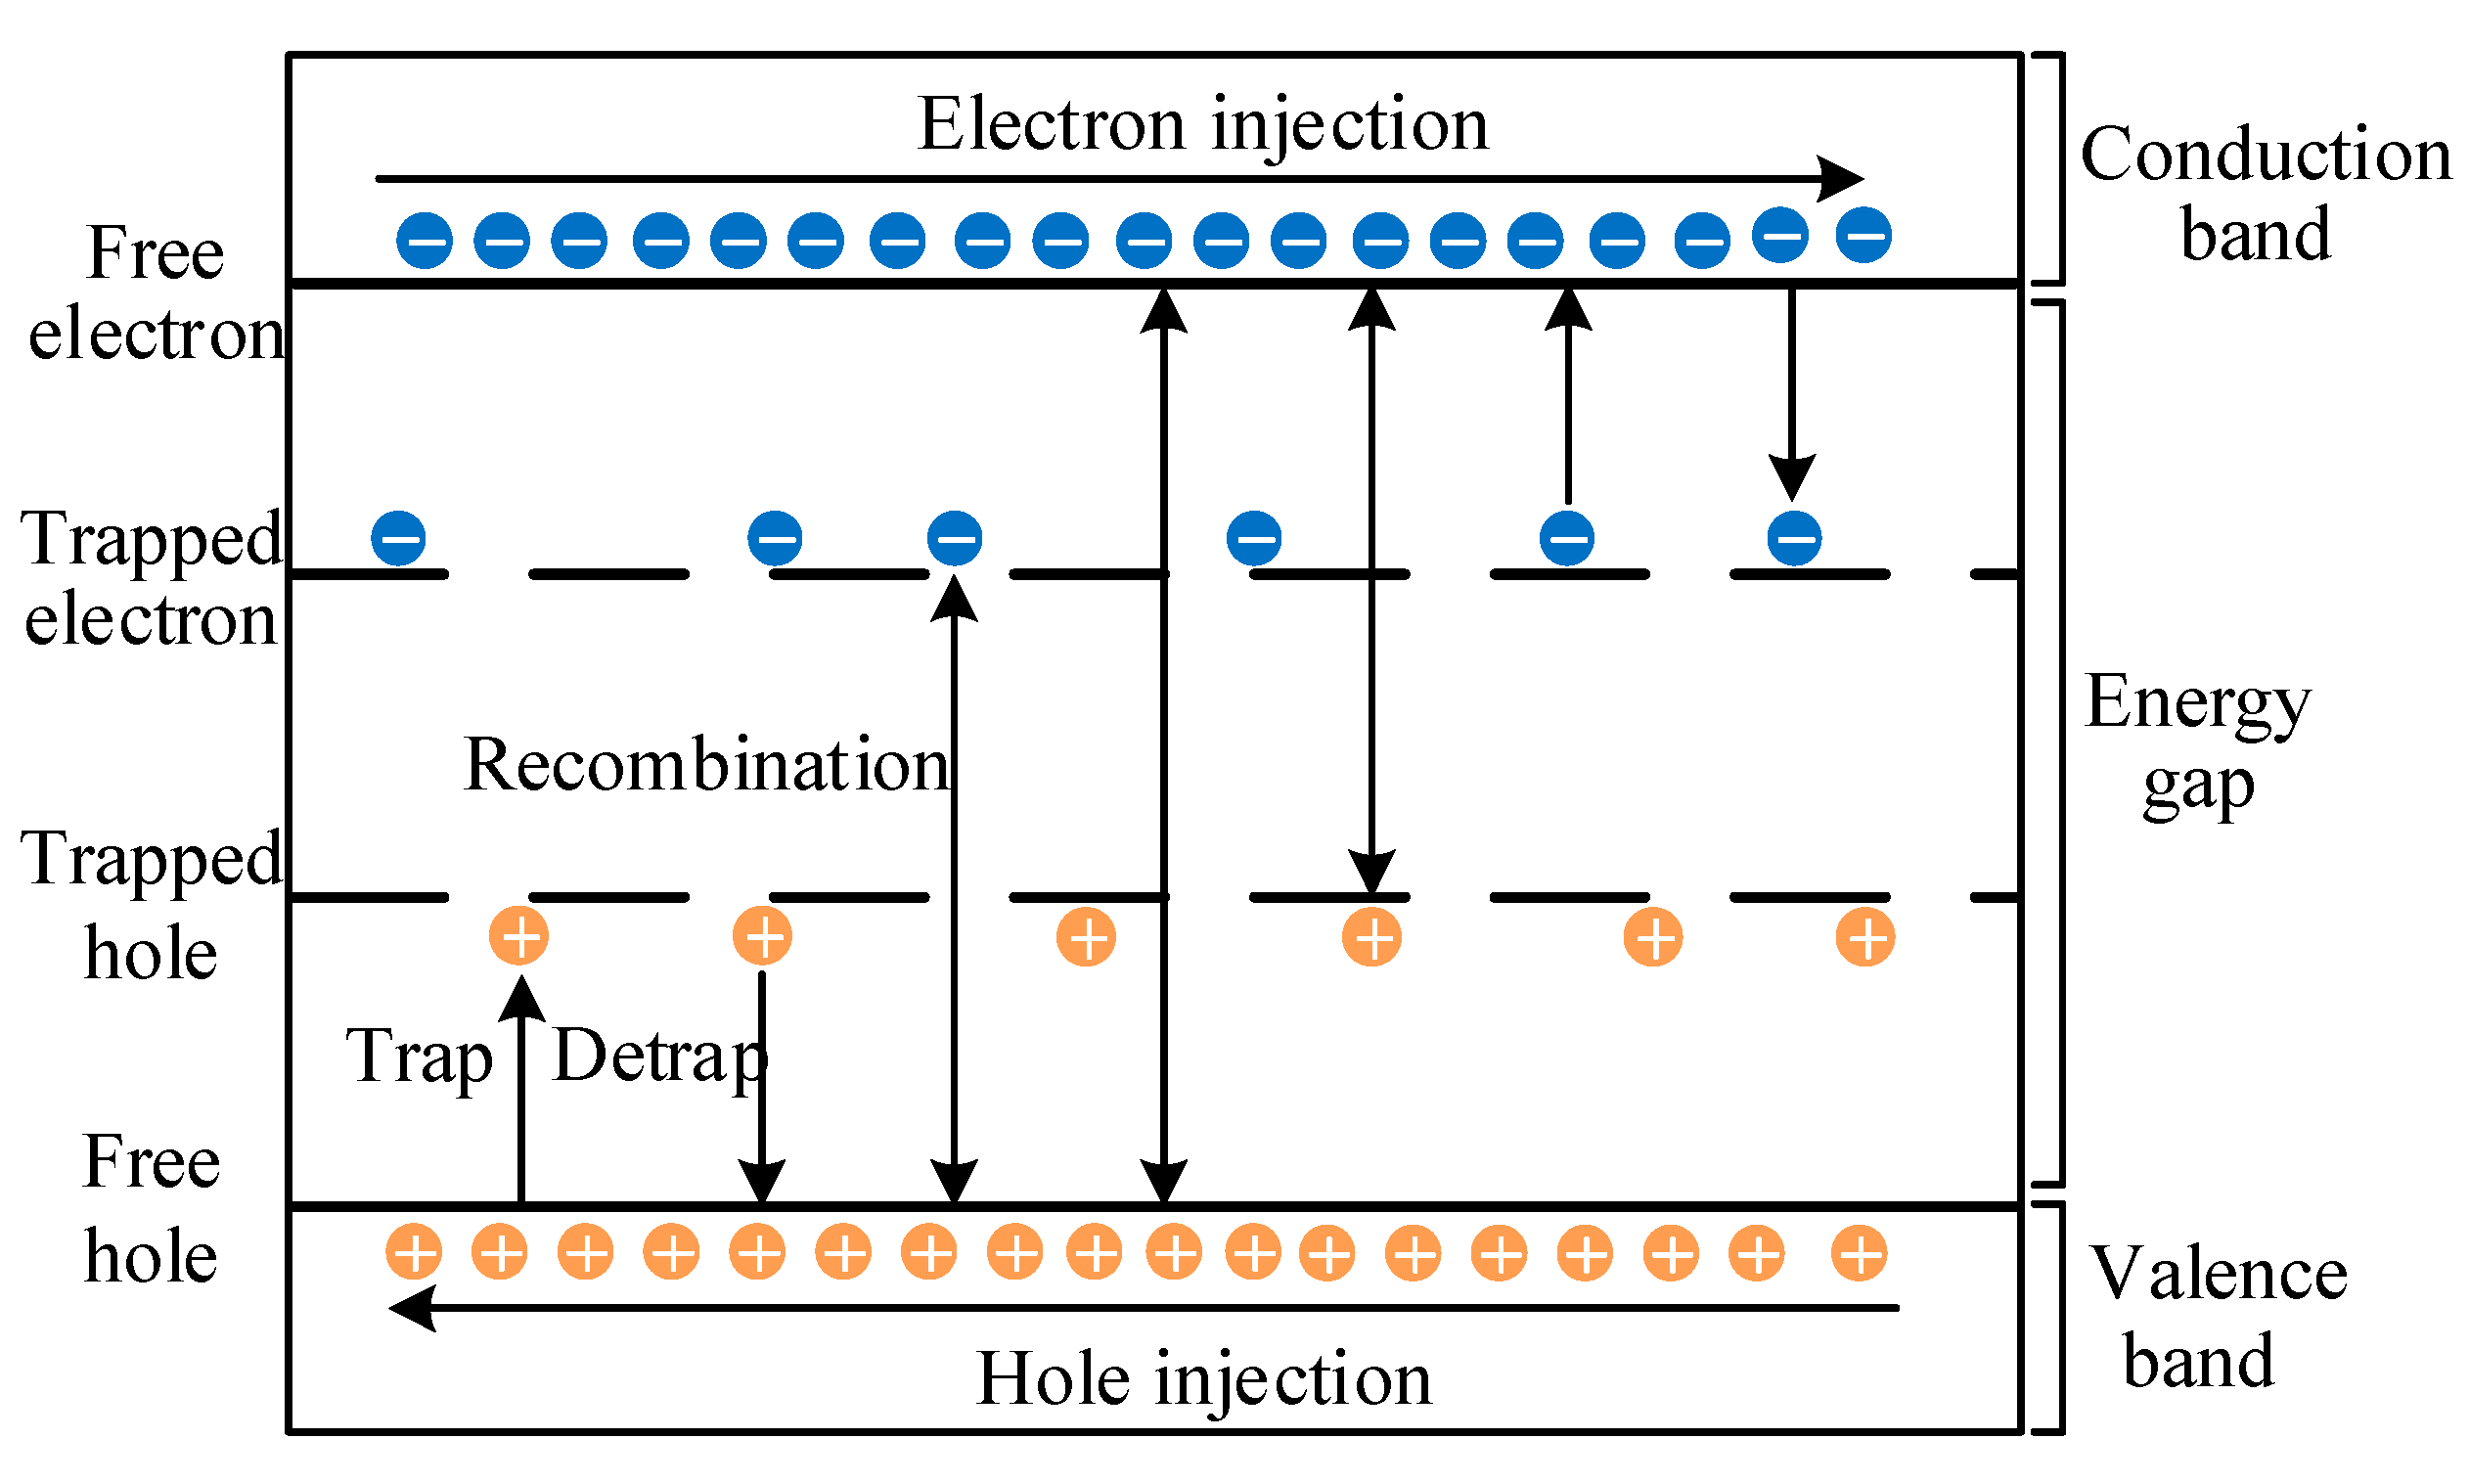
3.1. Bipolar Charge Transport Model

In this study, the charge transport of the HVDC cable joint was simulated based on the bipolar charge transport model, which is shown in Figure 4 [4]. The charge transport in the material mainly includes injection, migration, trapping, detrapping, recombination, and extraction of electrons and holes. Under the applied electric field, electrons and holes gain enough energy to overcome the injection barrier and are injected from the cathode and anode into the material. The injected electrons and holes gradually migrate to the opposite electrode; during this process, part of them are trapped and detrapped under the influence of traps. When the charges with opposite polarity meet in the material, recombination occurs, leading to the charge annihilation. When electrons or holes reach the opposite electrode, part of them are extracted, resulting in a decrease in the number of charges in the material [23].
The charge injection at the electrode can be described by Schottky’s equation when the electric field is below 100 kV/mm [24]. The charge transport inside the material can be described by the continuity, Poisson, and conduction equations [23]. The trapping, detrapping, and recombination of charges cause the density of the charge transport to change and this process can be described by the charge source term [25]. Due to the space limitation, the specific equations are not presented here.

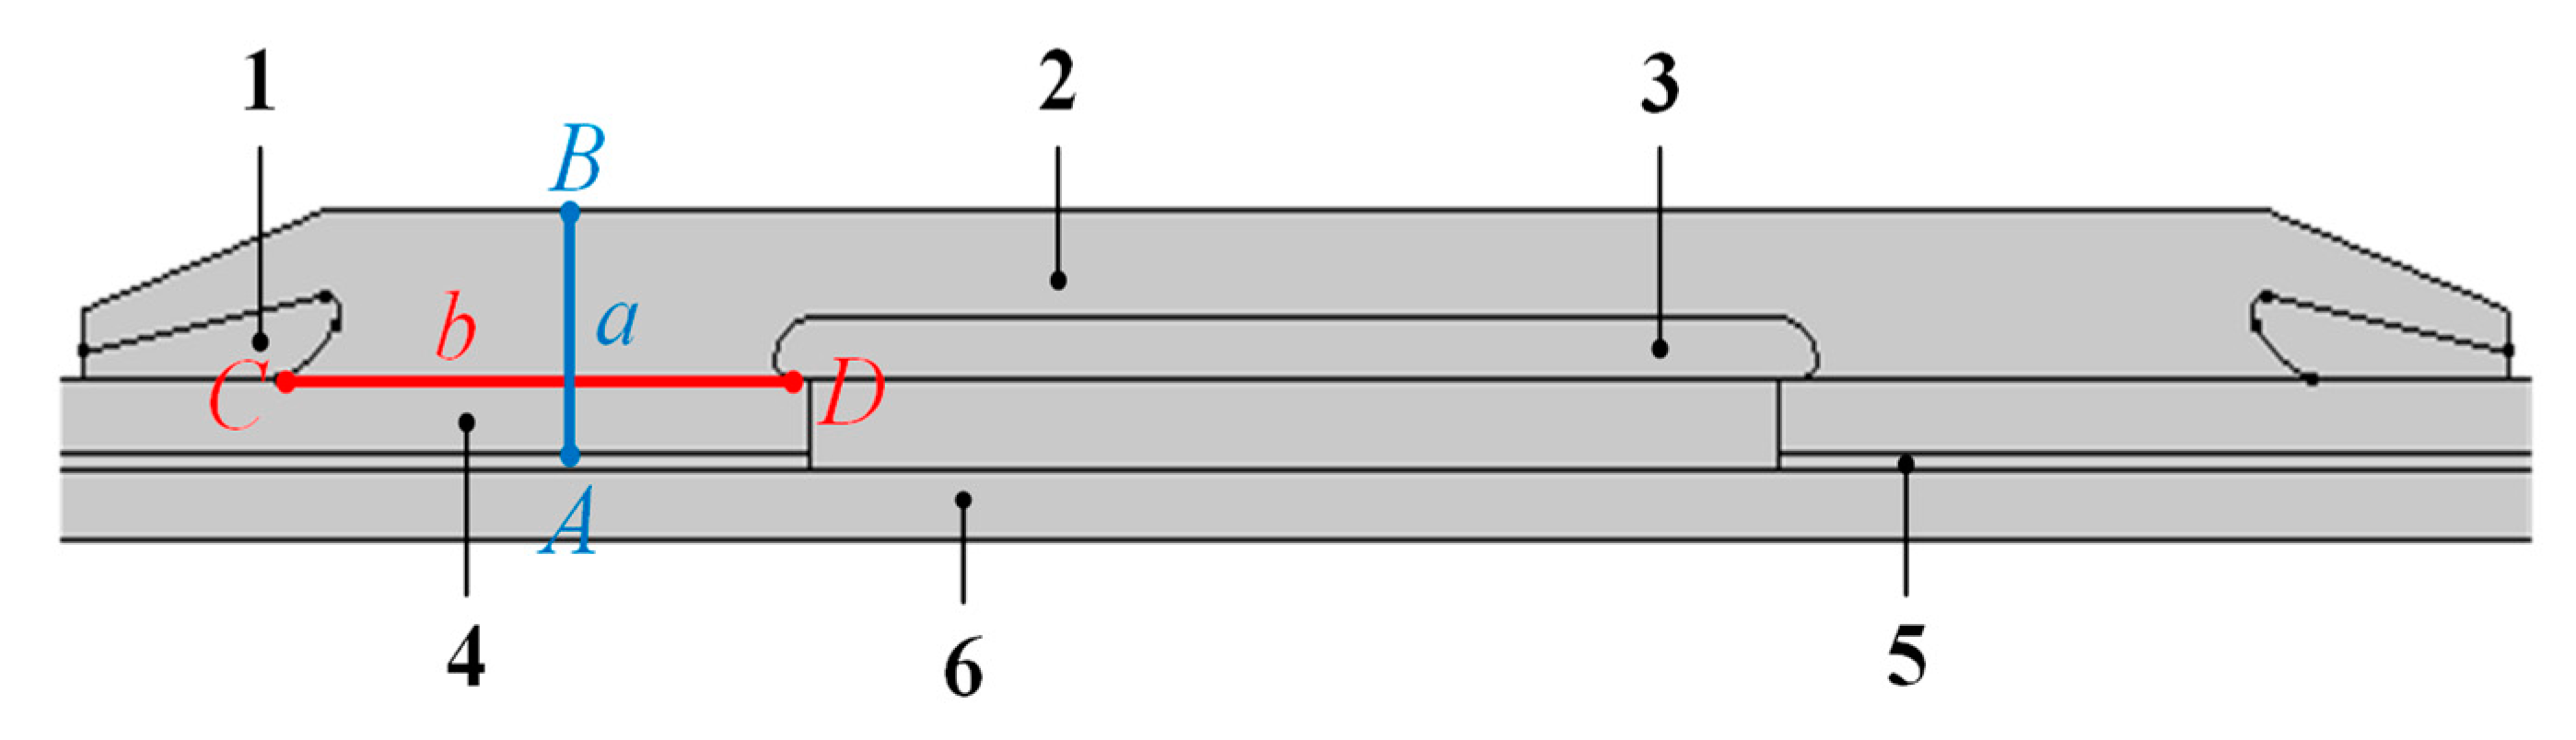
3.2. Geometric Model Building and Parameter Setting

The simulation was carried out using a HVDC cable joint model scaled down to 1:1000. Figure 5 shows the schematic diagram of a 1/2 cable joint scaled down to 1:1000 with reference to the actual 320 kV HVDC cable and joint. The line a (marked in blue) represents the radial cross-section of XLPE/EPDM, and line b (marked in red) represents the actual interface between XLPE and EPDM. Points A and B are the endpoints on both sides of the radial cross-section, point C represents the root of the stress cone, and point D is the root of the high voltage shield tube. The lines and points mentioned above are key parts of the model and are discussed in detail in the next section.
The main parameters used in the simulation of the charge transport are shown in Table 3 [23,24]. UtrE is the deep trap depth of EPDM; wie is the injection barrier of electrons on the EPDM side; Be and Bh are the trapping cross-sectional coefficients for electrons and holes, respectively; Net and Nht are the deep trap densities for electrons and holes, respectively; µe and µh are the mobilities of electrons and holes, respectively; S0, S1, S2, and S3 are the recombination coefficients between trapped electrons and trapped holes, trapped electrons and free holes, free electrons and trapped holes, and free electrons and free holes, respectively; and De is the charge detrapping coefficient. According to the authors of [25], it is known that the higher the nano doping concentration, the higher the charge injection barrier. Therefore, it is assumed that the hole injection barriers of 0, 0.1, 0.5, 1.0, and 2.0 wt% MgO/XLPE are 1.27 eV, 1.28 eV, 1.285 eV, 1.29 eV, and 1.295 eV, respectively.
In this paper, the charge trapping cross-section coefficient is expressed as [26]:
B ( e , h ) = e N T ( e , h ) μ ( e , h ) / ( ε 0 ε r )
where e is the elementary charge, µ(e,h) is the mobility of the free charge, ε 0 and ε r are the vacuum permittivity and the relative permittivity, respectively. The detrapping coefficient of the trapped charge is [27]:
D ( e , h ) = v A T E exp ( U t r ( e , h ) / ( k B T ) )
where vATE is the escape frequency, Utr is the trap depth, and T is the temperature. From Equations (7) and (8), it can be seen that the charge trapping cross-sectional coefficients B(e,h) and the detrapping coefficients D(e,h) of MgO/XLPE vary with the nano-MgO concentration since NT(e,h) and Utr(e,h) are different with different nano-MgO concentrations.

4. Simulation Results and Analysis

The current authors previously conducted a simulation on the steady-state temperature distribution of a 320 kV cable joint and found that, at a rated current of 1400 A, the temperature at the inner shield of the cable was 334.5 K and that at the outer layer of the joint was 325.7 K. The overall temperature was distributed in a gradient, with a temperature difference of 8.8 K between the inside and outside [4]. In this study, the space charge and electric field distributions of the cable joint were simulated at this temperature condition. A voltage of 320 V with positive polarity is applied to the cable (the geometric model was scaled down by 1:1000 so the applied voltage was also scaled down 1000 times).

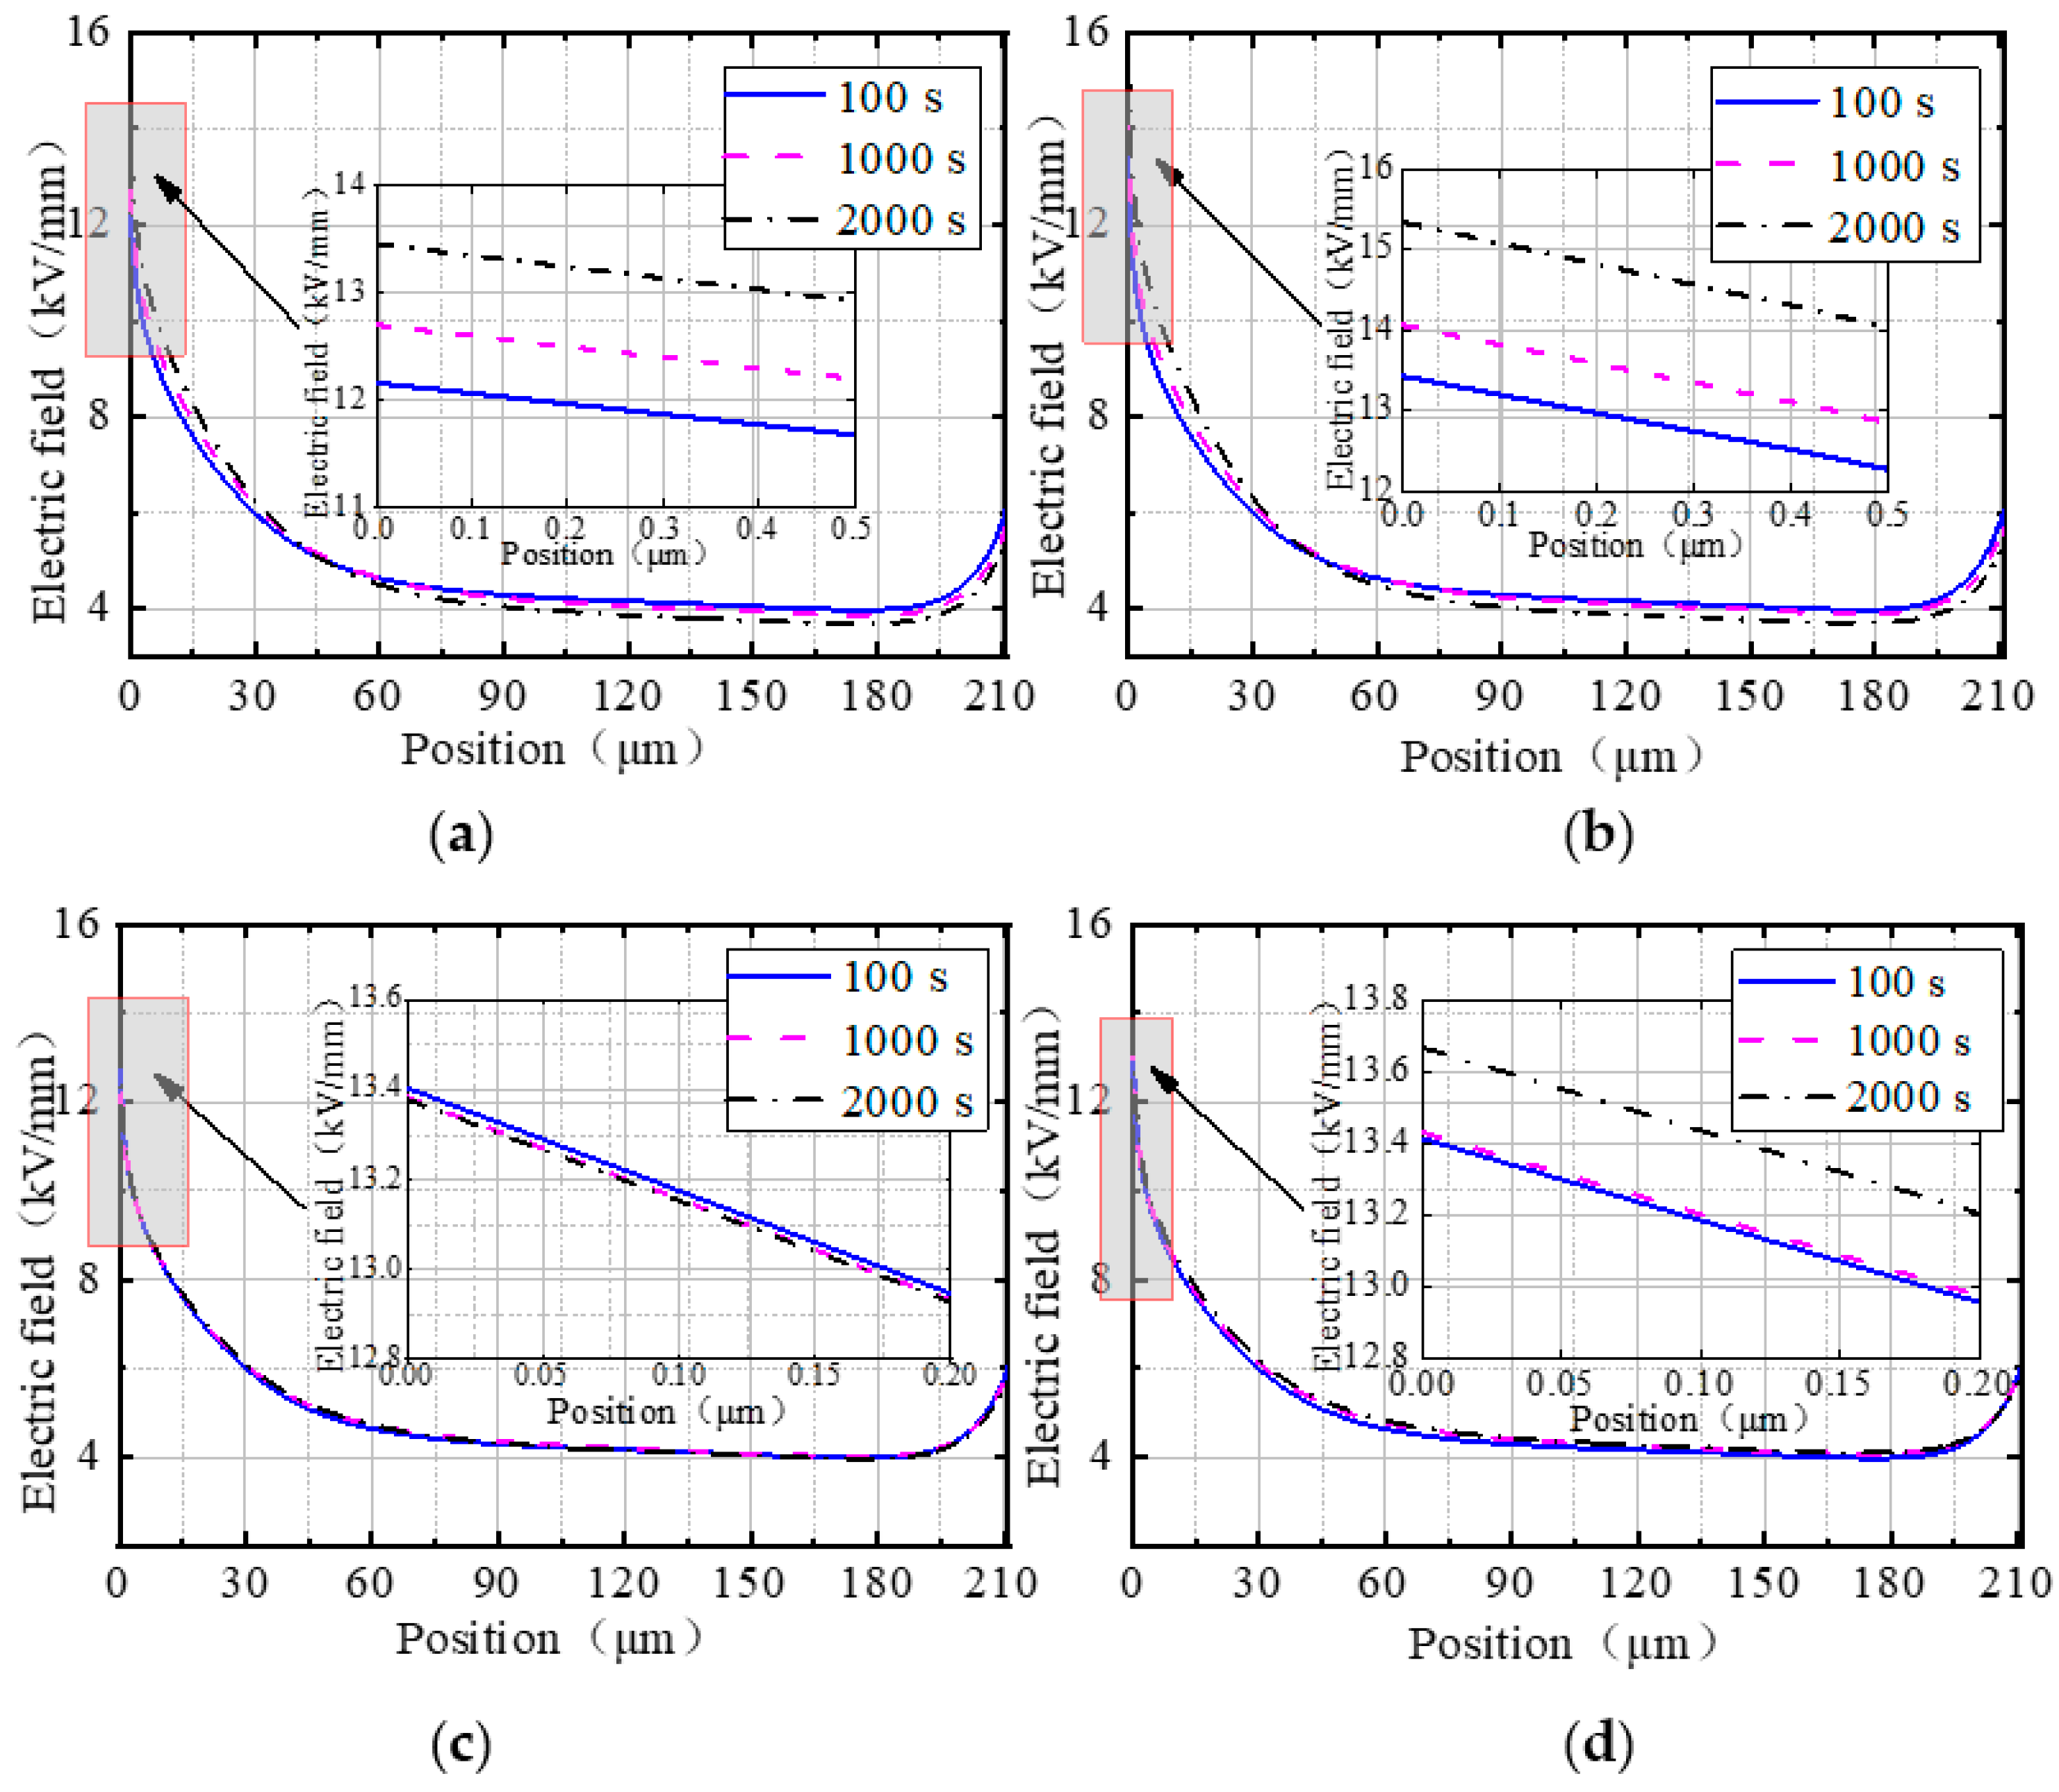
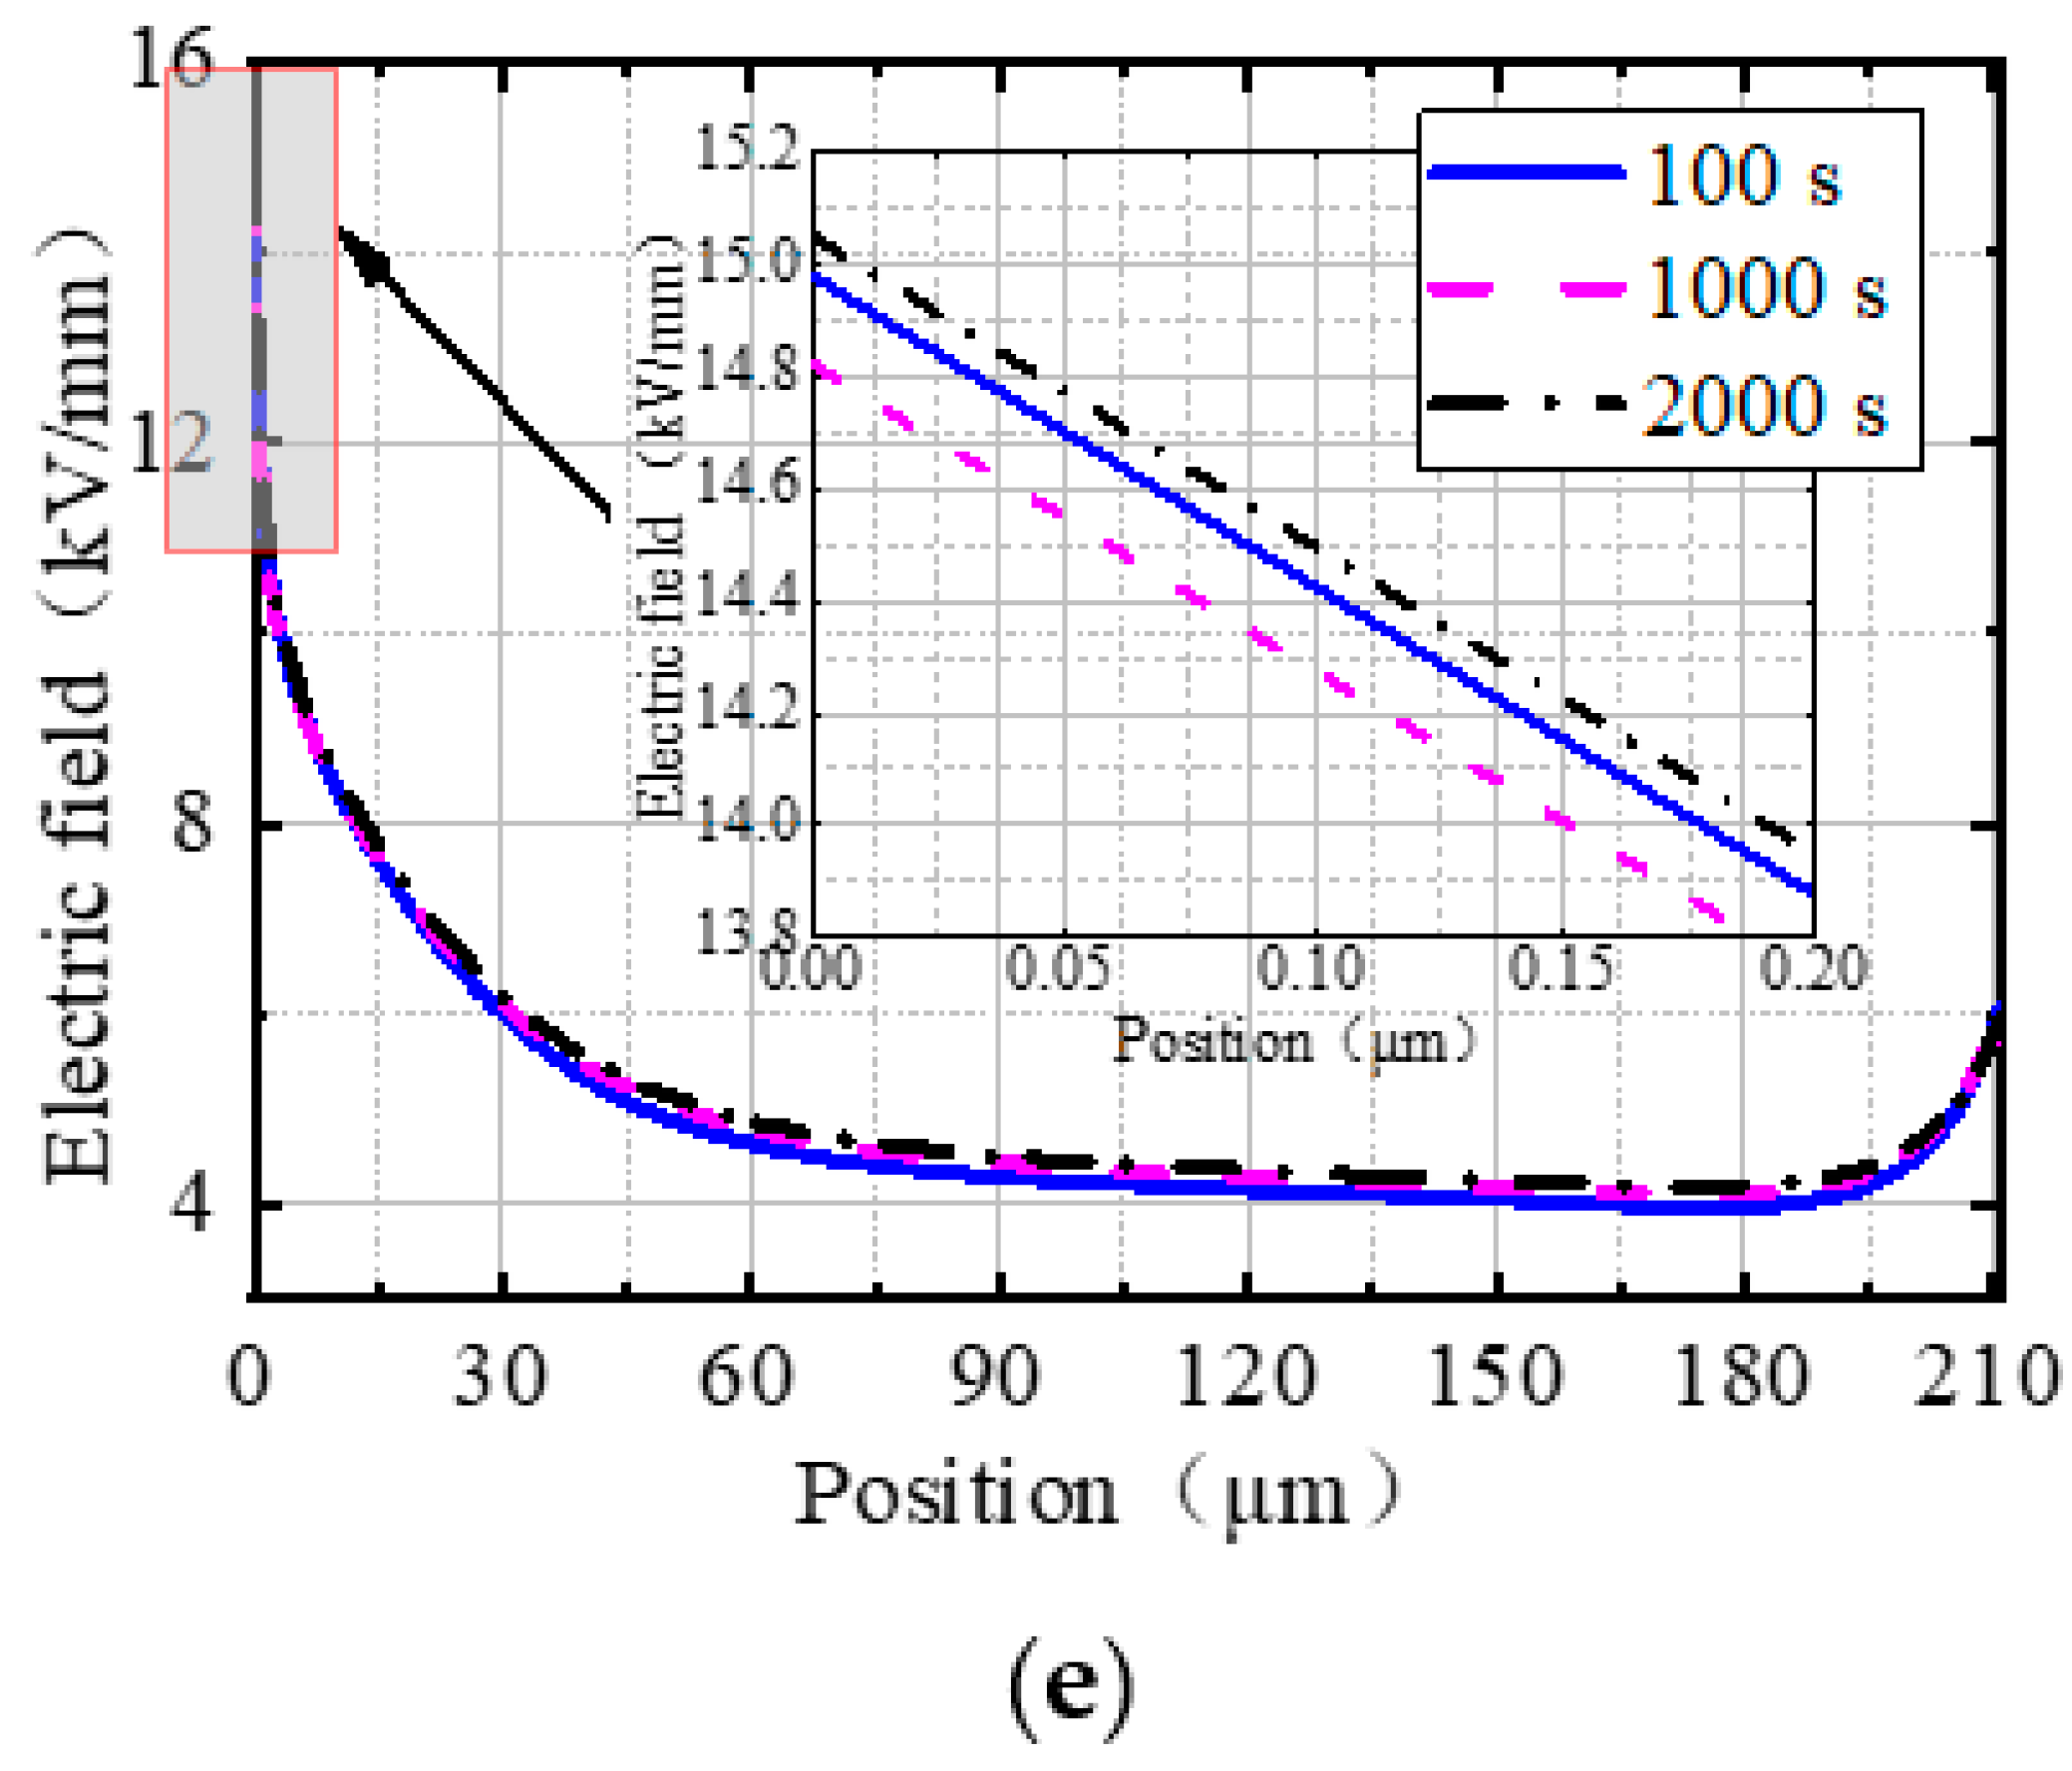
4.1. Charge and Electric Field Distributions in the Radial Direction of the Cable Joint

Figure 6 shows the space charge density distribution in the radial direction of the cable joint at different times of polarization with different nano-MgO concentrations (the horizontal axis represents line a in Figure 5, and 0 μm and 91 μm represent the endpoints A and B on both sides of line a, respectively). It can be seen that the space charges accumulated in the composite insulation of the cable joint increased gradually with the operation time, and the maximum charge density always appeared in the cable insulation (i.e., MgO/XLPE) near the inner shield side.
The mean values and variances of the charge density at 2000 s in the cable insulation MgO/XLPE, in the joint insulation EPDM, and in the overall joint were further calculated, and the results are shown in Table 4. According to the mean values of the charge density, it can be seen that when the nano-MgO concentrations were relatively low (0 and 0.1 wt%) and the numbers of charges accumulated in MgO/XLPE and EPDM do not obviously change with the increase of nano-MgO concentration. When the nano-MgO concentrations were higher (0.5, 1.0 and 2.0 wt%), the number of charges accumulated in EPDM decreased rapidly with the increase of concentration, while the number of charges in XLPE first decreased and then increased. Furthermore, when the nano-MgO concentration was 0.5 wt%, the number of charges accumulated in the (MgO/XLPE)/EPDM composite insulation was the minimum. According to the variances of the charge density, it is clear that when the nano-MgO concentrations were 0, 0.1 and 0.5 wt%, the charges accumulated in MgO/XLPE were more uniformly distributed compared to those in EPDM. When the concentrations were 1.0 and 2.0 wt%, the results are reversed. In addition, when the nano-MgO concentration was 1.0 wt%, the space charge distribution within the (MgO/XLPE)/EPDM composite insulation was the most uniform.
When the nano-MgO concentrations were low (0 and 0.1 wt%), the deep trap depth of pure XLPE was higher than that of 0.1 wt% MgO/XLPE but, as shown in Figure 2, the deep trap density of 0.1 wt% MgO/XLPE was higher than that of pure XLPE, resulting in no obvious change in the number of charges accumulated in the joint insulation when the concentration increased from 0 to 0.1 wt%. When the nano-MgO concentrations were higher (0.5, 1 and 2 wt%), it can be seen in Table 1 and Figure 2 that the deep trap depth and deep trap density of MgO/XLPE both gradually increased with the increase of concentration. Additionally, according to Equations (7) and (8), it can be seen that the charge trapping cross-section coefficient gradually increased and the detrapping coefficient gradually decreased. All of these factors together cause more charges to be trapped and to be difficult to get out of the traps. As a result, the holes injected from the inner shield massively accumulate in MgO/XLPE while those that can migrate into EPDM reduce. Therefore, when the nano-MgO concentrations are relatively high, with the increase of concentration, the number of charges accumulated in EPDM gradually decreases, while that in MgO/XLPE gradually increases.
In addition, it can be seen in Figure 6 that with the increase of nano-MgO concentration, the charge density difference between both sides of the (MgO/XLPE)/EPDM interface first decreased and then increased. When the concentrations were low (0 and 0.1 wt%), the charge density on the MgO/XLPE side of the (MgO/XLPE)/EPDM interface was higher than that on the EPDM side. When the concentrations were high (0.5, 1.0, 2.0 wt%), the results are reversed.
As can be seen in Table 1, when the nano-MgO concentrations were 0 and 0.1 wt%, the deep trap depth of MgO/XLPE gradually decreased with the increase of nano-MgO concentration and was always lower than that of EPDM, so the holes can cross the (MgO/XLPE)/EPDM interface and can migrate deeper into EPDM, resulting in a higher charge density on the MgO/XLPE side than on the EPDM side of the interface, and the charge density difference can gradually decrease. When the nano-MgO concentrations were 1.0 and 2.0 wt%, the deep trap depth of MgO/XLPE gradually increased with the increase of concentration and was higher than that of EPDM. As can be seen in Figure 2, the deep trap density also gradually increased under this condition, so a high number of holes accumulated in MgO/XLPE, causing the charge density on the MgO/XLPE side of the (MgO/XLPE)/EPDM interface to be higher than that on the EPDM side. At the same time, the migration range of holes in EPDM reduced, leading to a gradual increase in the charge density difference between the two sides of the interface. For the case where the nano-MgO concentration was 0.5 wt%, the deep trap depth was lower than when the concentrations were 0 and 0.1 wt%; however, the deep trap density was much higher in the former. As a result, the charge density on the MgO/XLPE side of the (MgO/XLPE)/EPDM interface is slightly higher than that on the EPDM side when the concentration is 0.5 wt%.
Figure 7 shows the electric field distributions in the radial direction in the cable joint at different polarization times with different nano-MgO concentrations (the horizontal axis in the figure represents line a in Figure 5, and 0 μm and 91 μm represent the endpoints A and B on both sides of line a, respectively). In the figure, it can be seen that the electric field distribution in the cable joint shows an overall downward trend. The electric field in the cable insulation MgO/XLPE is higher, while that in the joint insulation EPDM is lower, and the electric field variation in EPDM is smoother than that in MgO/XLPE. Due to the space charge accumulation, the electric field changed abruptly at the intermediate interface.
With the extension of time, the electric field in MgO/XLPE gradually decreased while that in EPDM gradually increased. It is obvious that the decrease of the electric field in MgO/XLPE is more significant than the increase in EPDM; however, the electric field in MgO/XLPE is always higher than that in EPDM. Under the simulation conditions used in this study, there is no electric field inversion in the cable joint. Due to the decrease of the electric field in MgO/XLPE and the increase of the electric field in EPDM, the overall distribution of electric field in the cable joint was homogenized to a certain extent.
In addition, compared to other concentrations, when the nano-MgO concentration was 0.1 wt%, the maximum electric field in MgO/XLPE (that is, the electric field near the inner shield) was lower, with a value of 6.62 kV/mm, while the minimum electric field in EPDM (that is, the electric field near the outside of the joint insulation) was higher, with a value of 2.42 kV/mm. The difference between the two is the smallest, which is 2.40 kV/mm. Therefore, when the concentration of nano-MgO is 0.1 wt%, the electric field distribution in the cable joint is the most uniform.

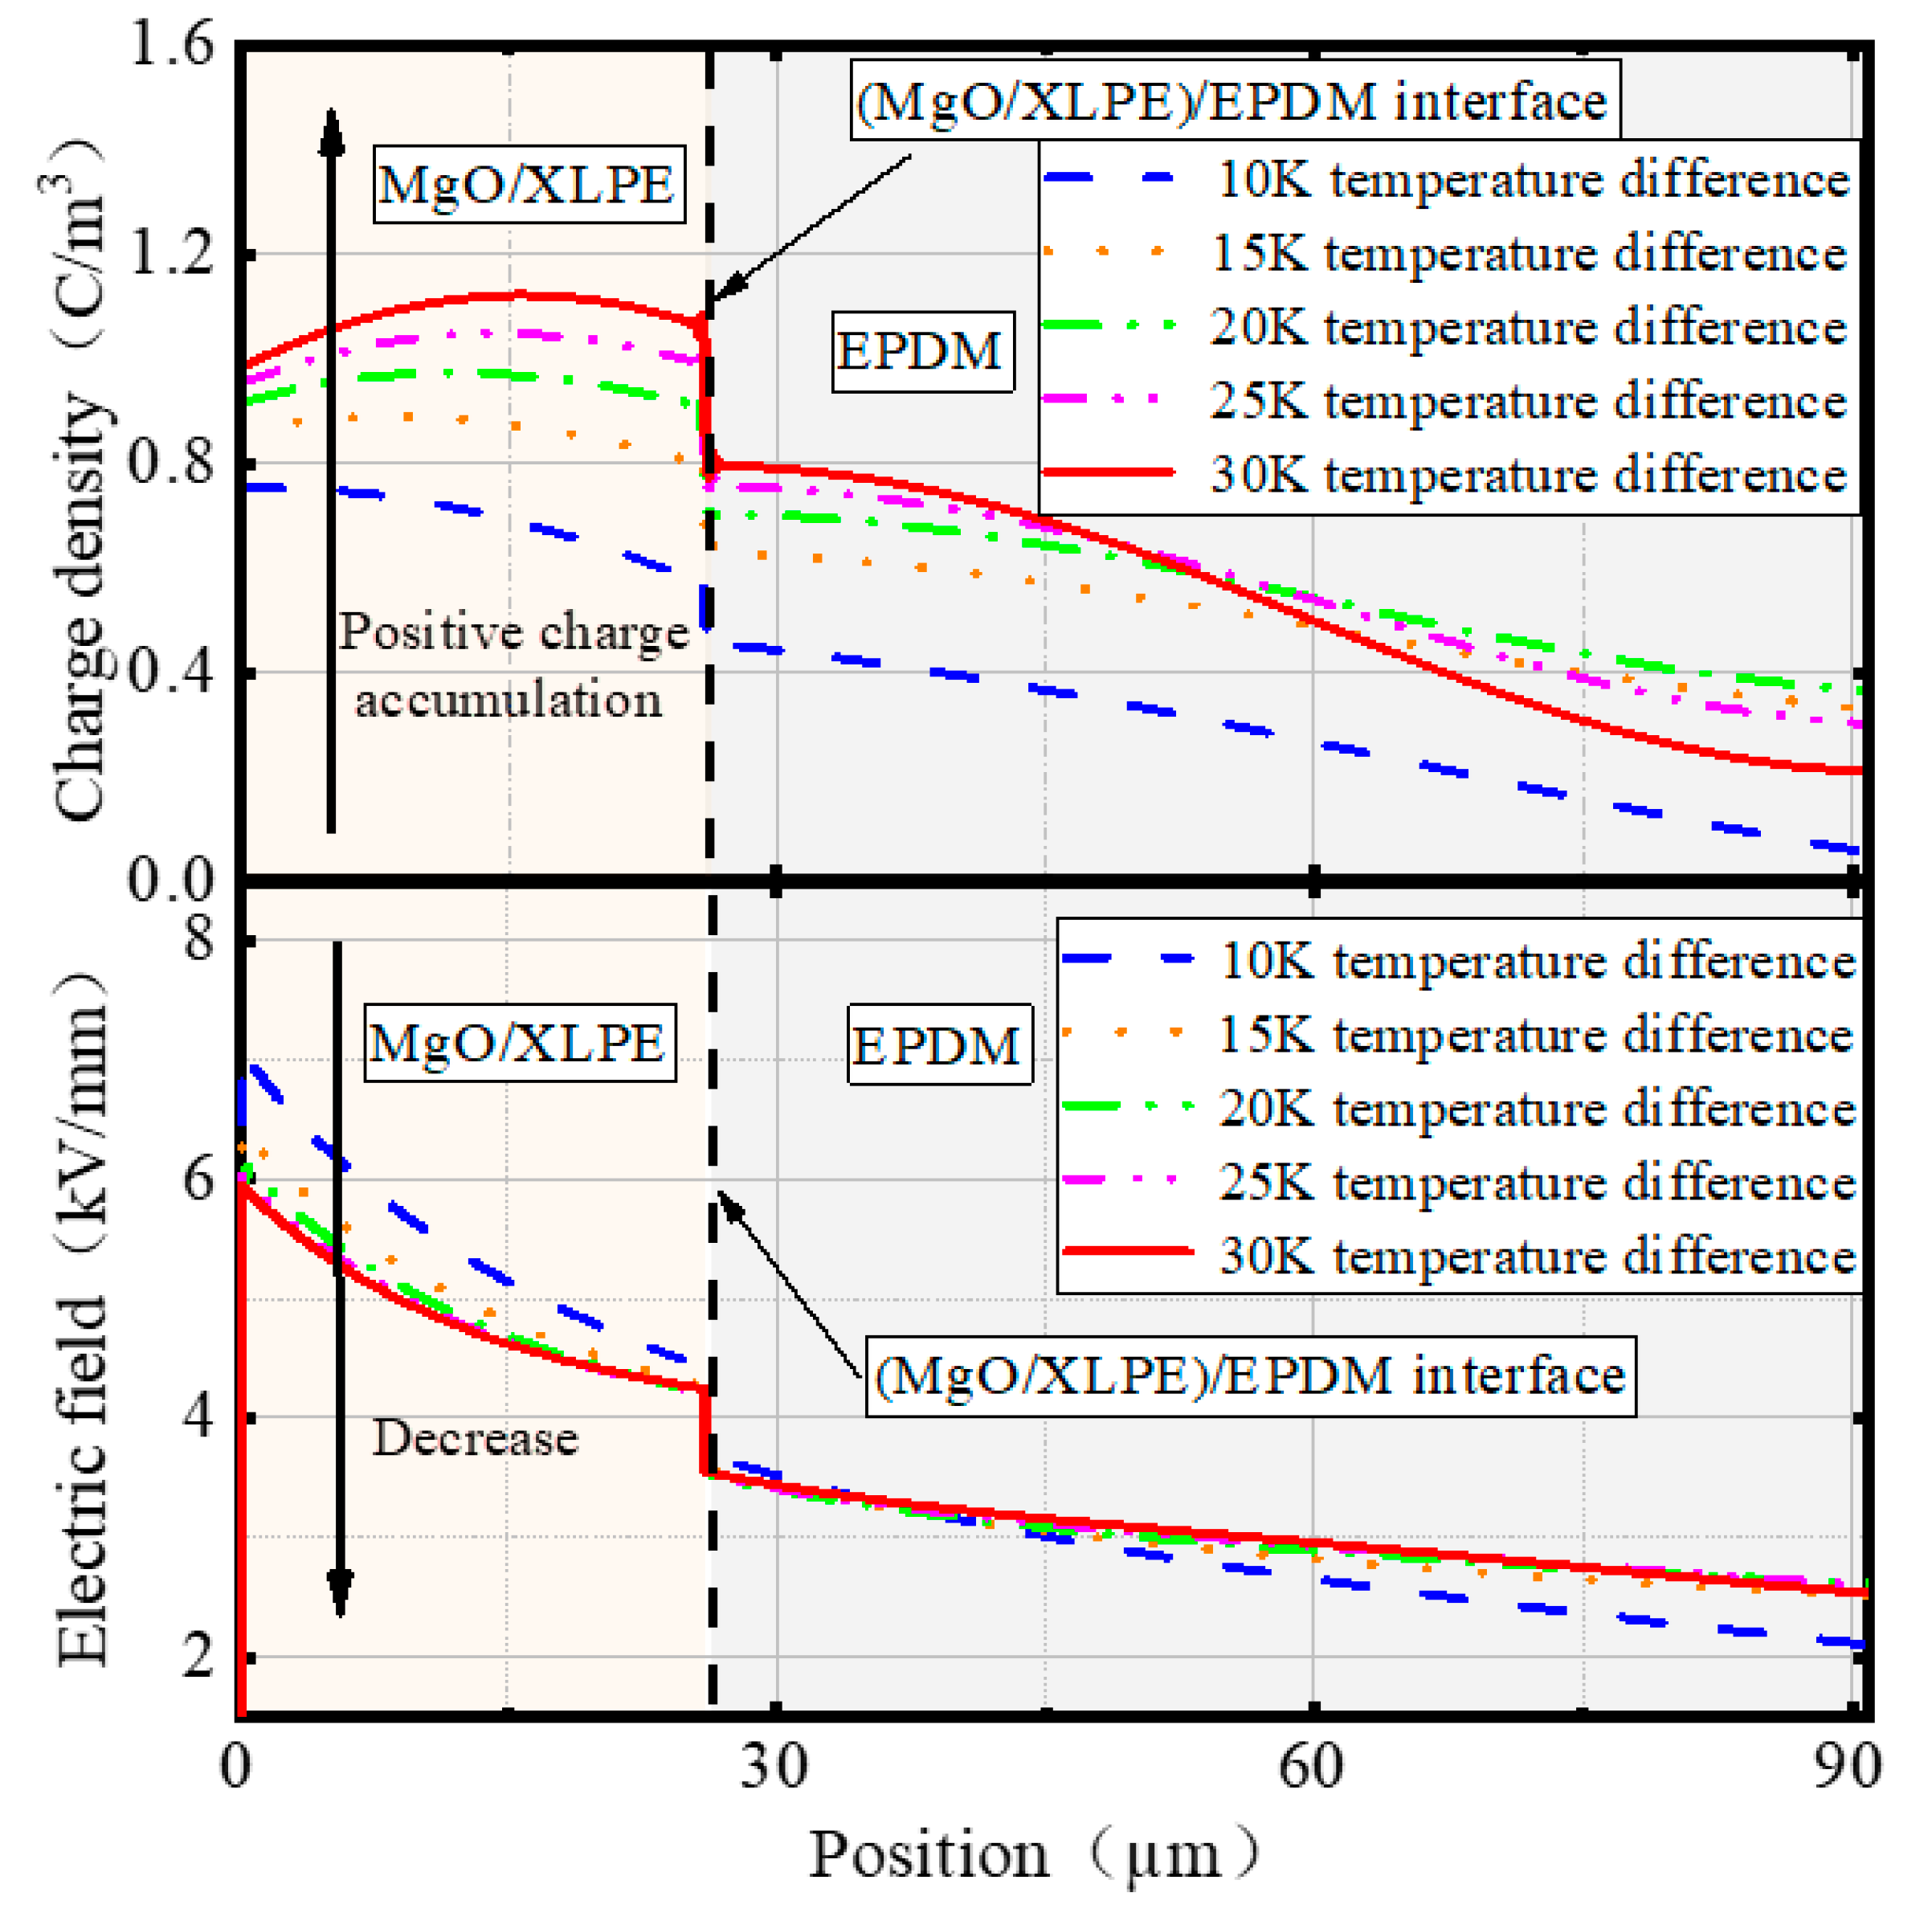
4.2. Charge and Electric Field Distributions at the Interface of the Cable Joint

Figure 8 shows the space charge density distribution at the (MgO/XLPE)/EPDM interface of the cable joint at different polarization times with different nano-MgO concentrations (the horizontal axis in the figure represents line b in Figure 5, and 0 μm and 211 μm represent the endpoints C and D on both sides of line b, respectively).
As can be seen, the charge density at the (MgO/XLPE)/EPDM interface in the cable joint shows an increasing trend with the extension of time. When the concentrations are 0 and 0.1 wt%, a low number of negative charges initially accumulate near point C at the root of the stress cone, the charges turn positive, and the number increases gradually with time. In the vicinity of point D, positive charges always accumulate and gradually increase with time. The number of charges accumulated near point C is significantly more than that near point D. At concentrations of 0.5, 1.0, and 2.0 wt%, the number of charges near point C increases first and then decreases, and the polarity is always negative. The charge accumulation near point D is similar to that at the concentration of 0 and 0.1 wt%, but the positive charges accumulated near point D are significantly more than the negative charges near point C at this time.
Since the stress cone is grounded, a low number of negative charges are initially accumulated near point C at the root of the stress cone. With the extension of time, the number of holes injected from the inner shield gradually increased. When the nano-MgO concentrations were 0 and 0.1 wt%, the depth and density of deep traps in MgO/XLPE were relatively low, so the injected holes were more likely to migrate to the (MgO/XLPE)/EPDM interface, resulting in the charges accumulated near point C changing from negative to positive, and the amount gradually increased with time. When the nano-MgO concentration increased to 0.5 wt%, the trap depth of MgO/XLPE was still low, but the trap density and the charge injection barrier increased, which leads to a decrease in the number of holes injected from the inner shield, and an increase in the time required for holes to migrate to the (MgO/XLPE)/EPDM interface, causing a slight increase and then decrease in the number of negative charges near point C. When the concentrations were 1.0 and 2.0 wt%, the depth and density of the deep traps in MgO/XLPE were higher, leading to a high number of holes accumulated near the inner shield, and the time required for holes to migrate to the (MgO/XLPE)/EPDM interface was further prolonged, resulting in a significant increase and then decrease in the number of negative charges at the interface near point C.
Figure 9 shows the electric field distributions at the (MgO/XLPE)/EPDM interface (the horizontal axis in the figure represents line b in Figure 5, and 0 μm and 211 μm represent the endpoints C and D on both sides of line b, respectively). As can be seen, the electric field at the interface is high at both ends and low in the middle, and is the highest at the root of the stress cone, indicating that the root of the stress cone is the insulation weak point, so the electric field at this position is mainly analyzed here.
With the extension of time, the electric field near point C gradually increased when the concentrations of nano-MgO were 0, 0.1, and 1.0 wt%; decreased when the concentration was 0.5 wt%; and first decreased then increased when the concentration was 2.0 wt%. The change of electric field near point C at different nano-MgO concentrations is related to the variation of the charges accumulated there. At the last moment of polarization (2000 s), the electric field at the root of the stress cone was relatively low when the nano-MgO concentrations were 0, 0.5, and 1.0 wt%, and the lowest electric field was found at a concentration of 0.5 wt%, with a value of 13.38 kV/mm. When the concentrations were 0.1 and 2.0 wt%, the electric fields at the root of the stress cone were higher, with values exceeding 15 kV/mm. Therefore, under the simulation conditions taken in this work, the electric field at the root of the stress cone is the lowest when the concentration of nano-MgO is 0.5 wt%, which may be related to the fact that, at that time, the charges accumulated near the stress cone are fewer and the polarity is negative (consistent with the polarity of the stress cone).
According to the above discussion, when the nano-MgO concentration is 0.5 wt%, the interfacial electric field near the point C at the stress cone root is low at the final moment of polarization. At the same time, as can be seen in Figure 6, the number of charges accumulated within the double-layer composite insulation is also low at that time. Therefore, it can be considered that when the concentration of nano-MgO is 0.5 wt%, the joint can maintain better electrical insulation and operational state compared to other concentrations.

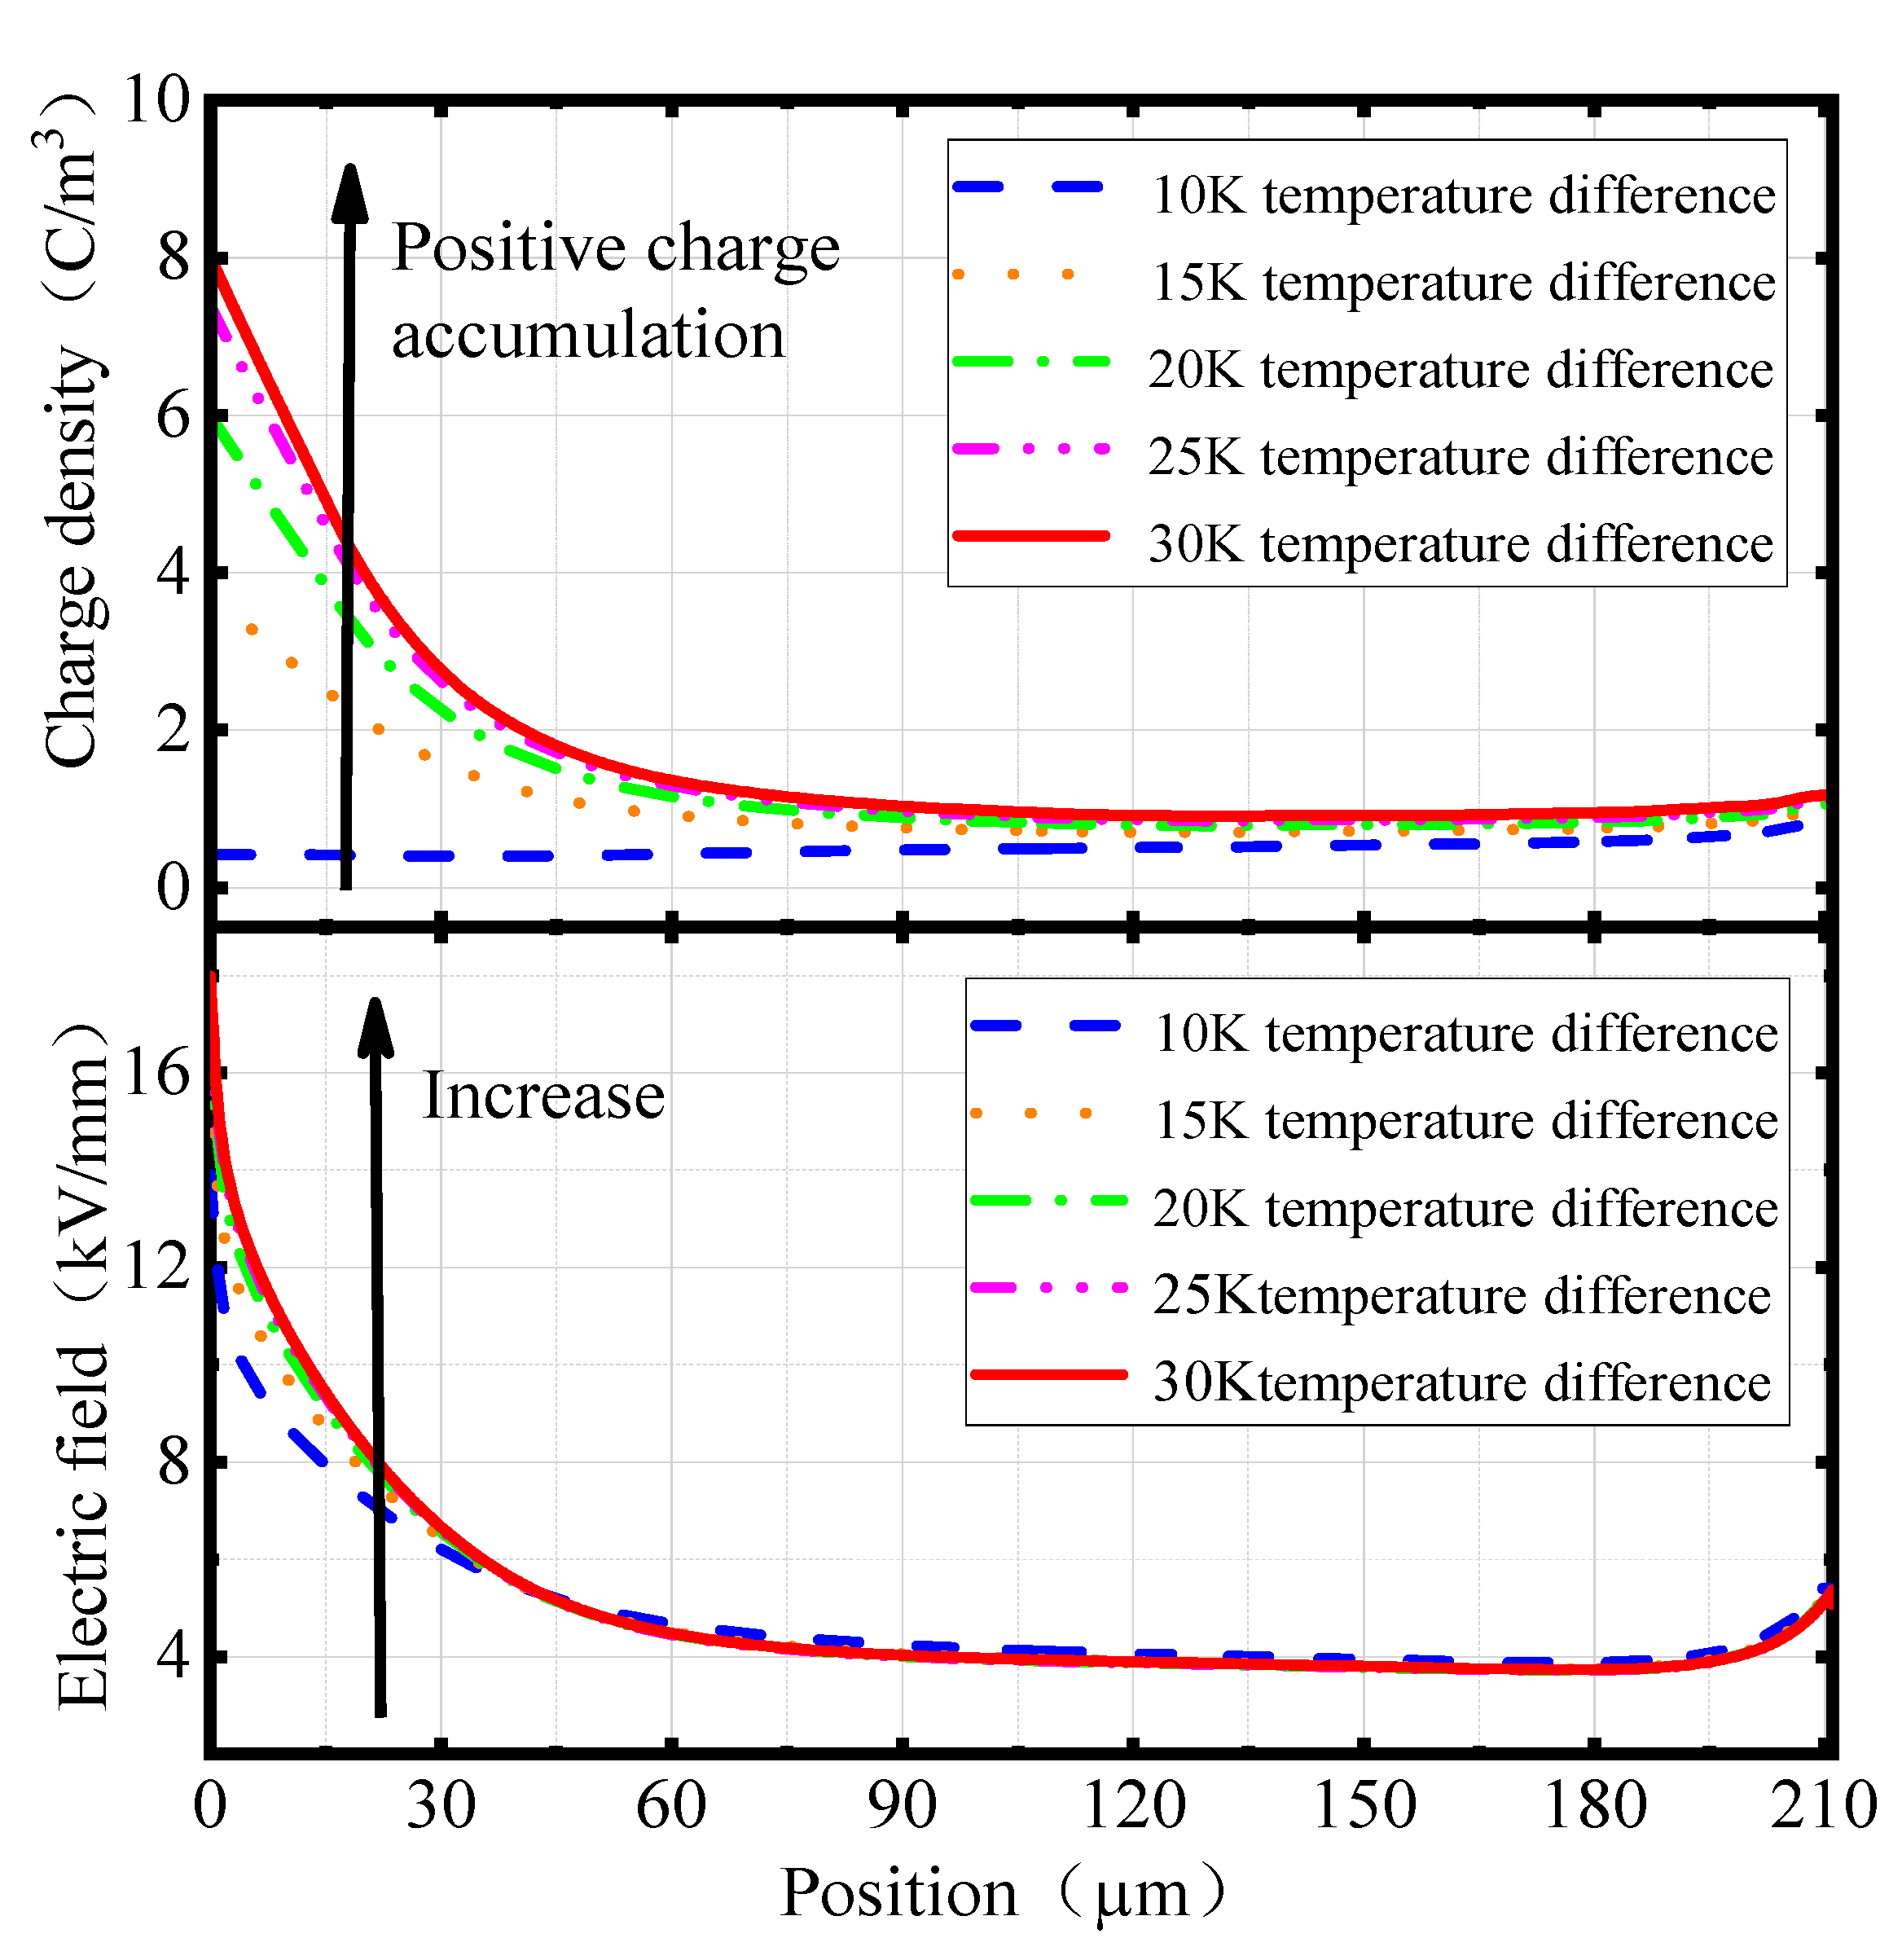
4.3. Effect of Temperature Difference on Charge and Electric Field Distributions

In order to more comprehensively reflect the space charge and electric field distribution characteristics inside the cable joint when the nano-MgO concentration is 0.5 wt%, a simulation of the space charge and electric field distribution under different temperature differences between the inner and outer sides of the joint was carried out. The temperature differences were set at 10, 15, 20, 25, and 30 K. The high voltage shield tube side is the high-temperature side with a constant temperature of 334.5 K and the outer side of EPDM is the low-temperature side with temperatures of 324.5, 319.5, 314.5, 309.5, and 304.5 K, respectively.
Figure 10 shows the distributions of the charge density and electric field of the (MgO/XLPE)/EPDM interface at 2500 s under different temperature differences with a nano-MgO concentration of 0.5 wt% (the horizontal axis in the figure represents line b in Figure 5, 0 μm and 211 μm represent endpoints C and D on both sides of line b, respectively). As shown in the figure, the charges accumulated at the (MgO/XLPE)/EPDM interface are all positive; the greater the temperature difference, the closer to the root of the stress cone, and more positive charges are accumulated. With the increase of the temperature difference, the increase of the interfacial charges gradually slows down, the number of charges tends to be saturated, and the electric field distribution also has a similar trend.
In this simulation, the inner shield side is the high-temperature side with a constant temperature, while the outer side of the joint insulation is the low-temperature side and the temperature varies with the temperature difference. The high temperature on the inner shield side could promote the hole injection and diffusion as well as the migration within the MgO/XLPE; thus, a high number of holes could migrate to the (MgO/XLPE)/EPDM interface. As the temperature difference increases, the outer temperature of the joint insulation EPDM gradually decreases, leading to the decrease of the number of electrons injected into EPDM, the decrease of electron mobility, and a greater difficulty for trapped electrons to get detrapped. As a result, the number of electrons that actually migrate to the interface and recombine with the holes decreases, so the polarity of the charges accumulated at the interface is positive and the number gradually increases with the increase of temperature difference.
Furthermore, in the current authors’ previous work, it was found that the closer to the root of the stress cone, the higher the temperature at the interface [4]. Similarly, the higher the temperature, the greater the charge mobility. Moreover, combined with Equations (7) and (8), it can be seen that the charge trapping cross-section coefficient and the detrapping coefficient both increase with the increase of temperature. As shown in Figure 10, the closer to the root of the stress cone, the higher the number of charges accumulated, which indicates that the promotion of charge trapping at the root of the stress cone is greater than that of charge detrapping at a high temperature.
Figure 11 shows the charge density and electric field distributions in the radial direction of the cable joint at 2500 s under different temperature differences with a nano-MgO concentration of 0.5 wt% (the horizontal axis in the figure represents line a in Figure 5, 0 μm and 91 μm represent the endpoints A and B on both sides of line a, respectively). As shown in the figure, with the increase of the temperature difference, the positive charges accumulated in the cable insulation MgO/XLPE gradually increases. The position where the maximum electric field appears gradually changes from the inner shield side to the middle of MgO/XLPE. The electric field in MgO/XLPE gradually decreases, and the farther the distance from the interface, the smaller the temperature difference, and the faster the electric field decreases.
It is also noted that with the increase of the temperature difference, the charge density curves in EPDM crossed over. The charge density near the (MgO/XLPE)/EPDM interface monotonically increased with the increase of the temperature difference, while the charge density near the outside of the joint insulation first increased and then decreased. The electric field distribution in EPDM has a similar trend.
This is due to the fact that, with the increase in the temperature difference, the overall temperature inside the joint decreases, which inhibits the charge migration and detrapping to a certain extent. For MgO/XLPE, the migration and detrapping of the injected holes are inhibited and the accumulation of holes near the inner shield weakens the electric field there to some extent, so that further hole injection is inhibited, leading to a gradual increase in the positive charges accumulated in MgO/XLPE as the temperature difference increases. Additionally, the location where the charge density maximum appears gradually changes from the inner shield side to the middle of MgO/XLPE.
For EPDM, the increase in the temperature difference was not beneficial to the migration of holes to the outside of the joint insulation, and made the injection and migration of electrons from the outside of the joint insulation more difficult. Moreover, since the number of holes injected was much higher than the number of electrons injected, the temperature difference had a more obvious effect on holes, which made the charge curves intersect.

5. Conclusions

In order to clarify the influence of nano-MgO doping for XLPE cable insulation on the space charge characteristics of the composite insulation at the cable joint, the depths and densities of the deep traps in MgO/XLPE under different nano-MgO concentrations were calculated, based on which a charge transport simulation model of a 320 kV HVDC cable joint with nano-MgO/XLPE as the cable insulation was established. Then, the space charge and electric field distributions in the cable joint were simulated and are discussed here in detail. The main conclusions are as follows:
(1)
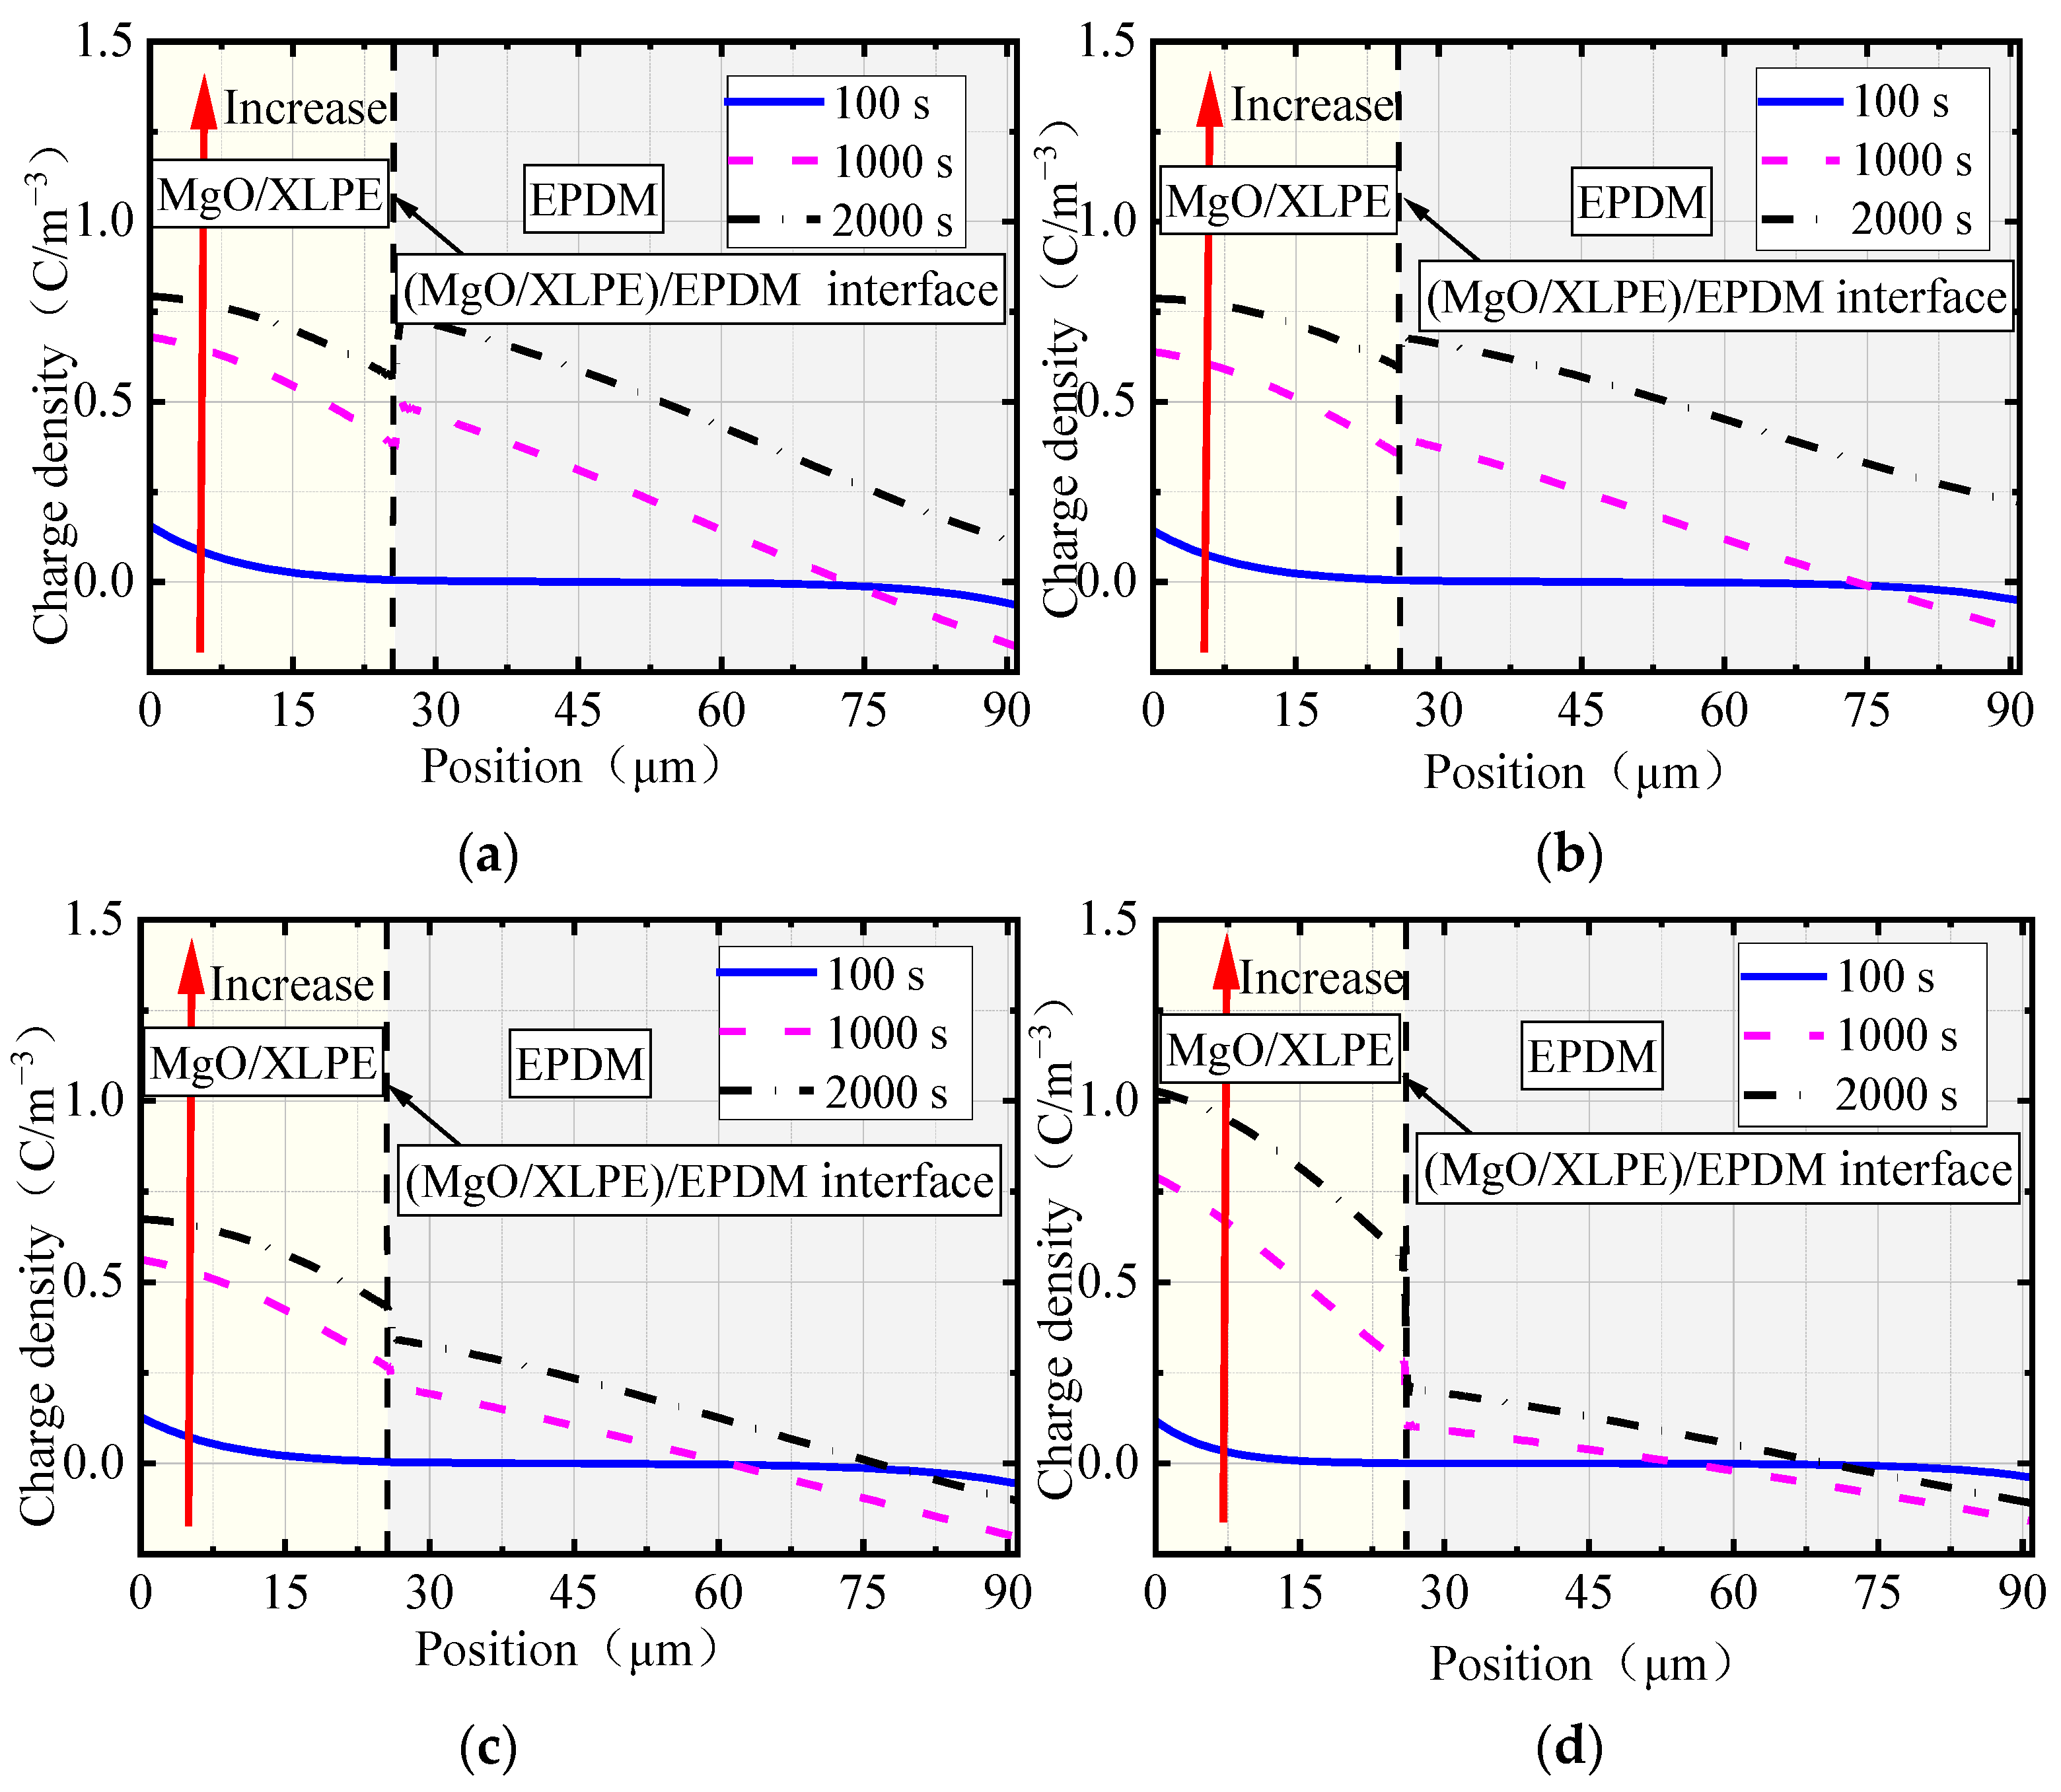
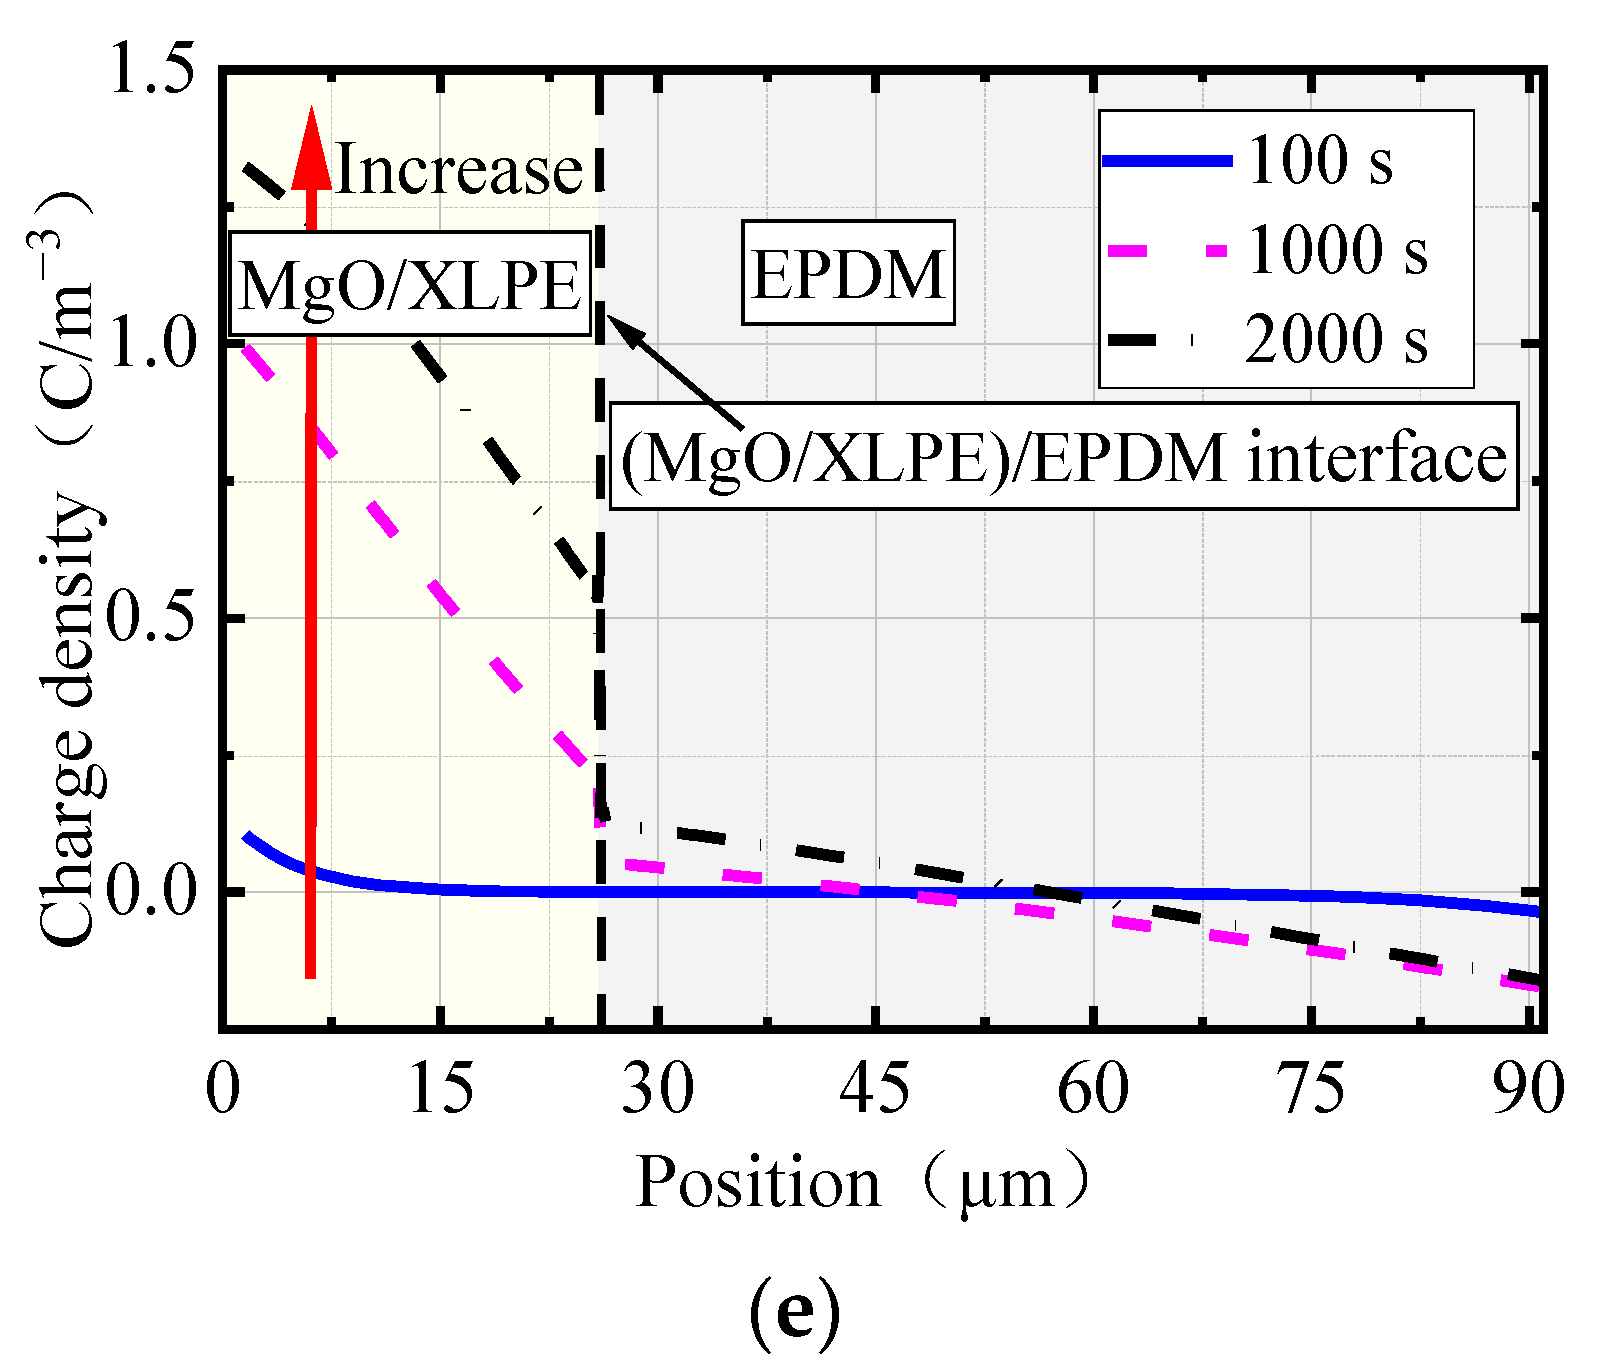
The radial charge distribution of the cable joint does not significantly change when the nano-MgO concentrations are 0 and 0.1 wt%. With a further increase in the concentration, the accumulated charges in MgO/XLPE first increased and then decreased, while the charges in EPDM monotonically decreased. There is a difference in charge density between the two sides of the (MgO/XLPE)/EPDM interface, and the difference first decreased and then increased with the increase of nano-MgO concentration. When the concentration was 0.5 wt%, the radial charges in the joint were the fewest. This conclusion provides support for revealing the charge transport mechanism of the cable joint after the cable insulation (XLPE) is modified by adding nano-MgO.
(2)
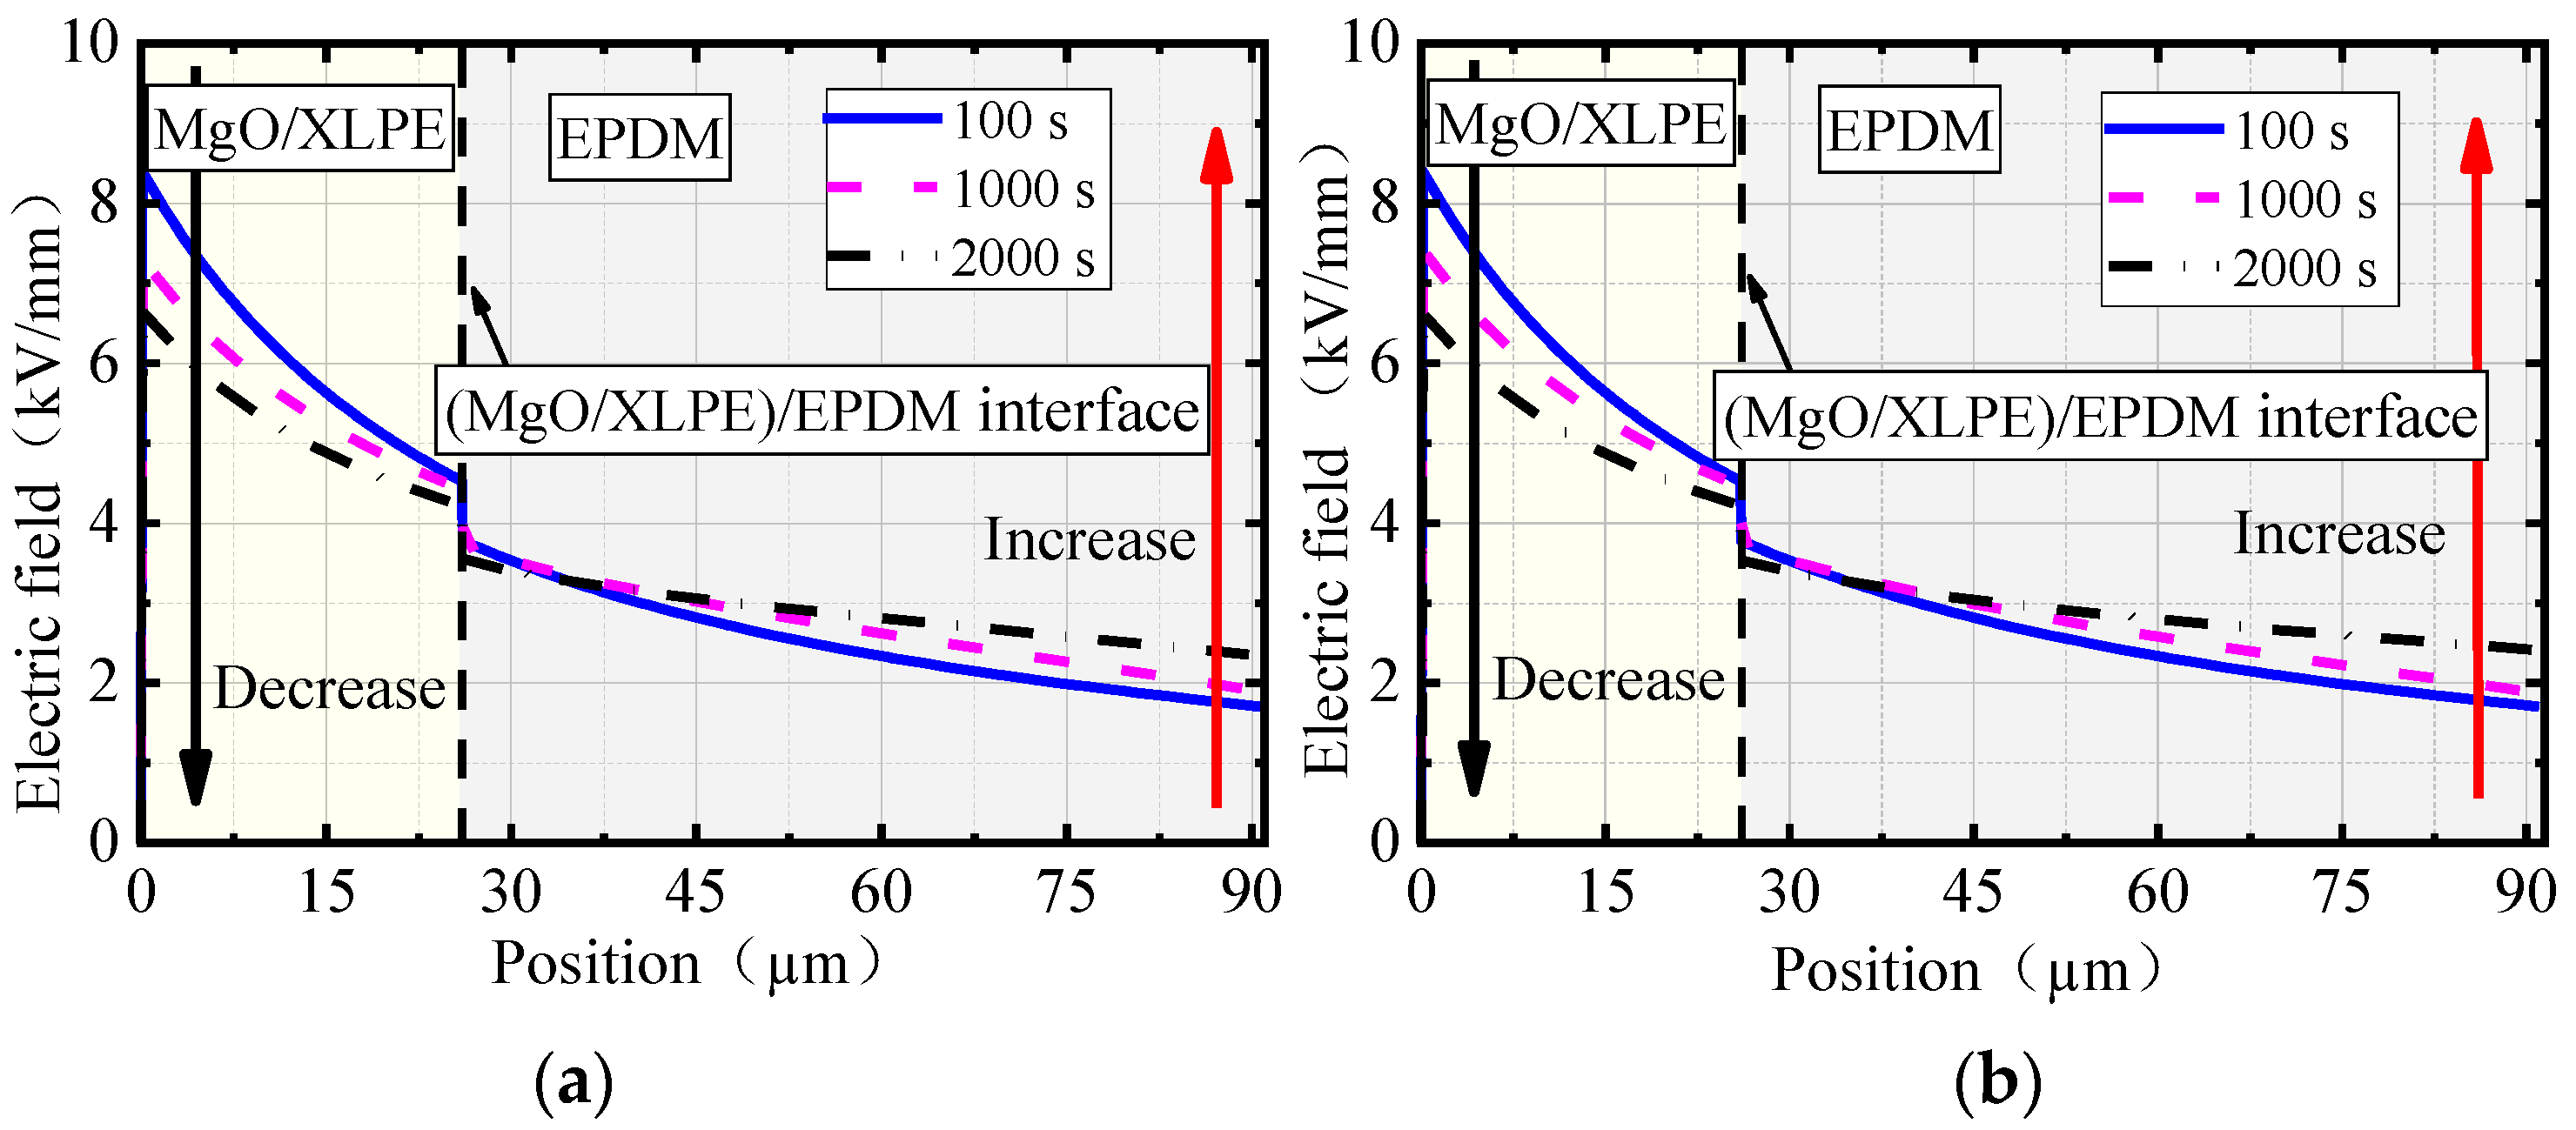
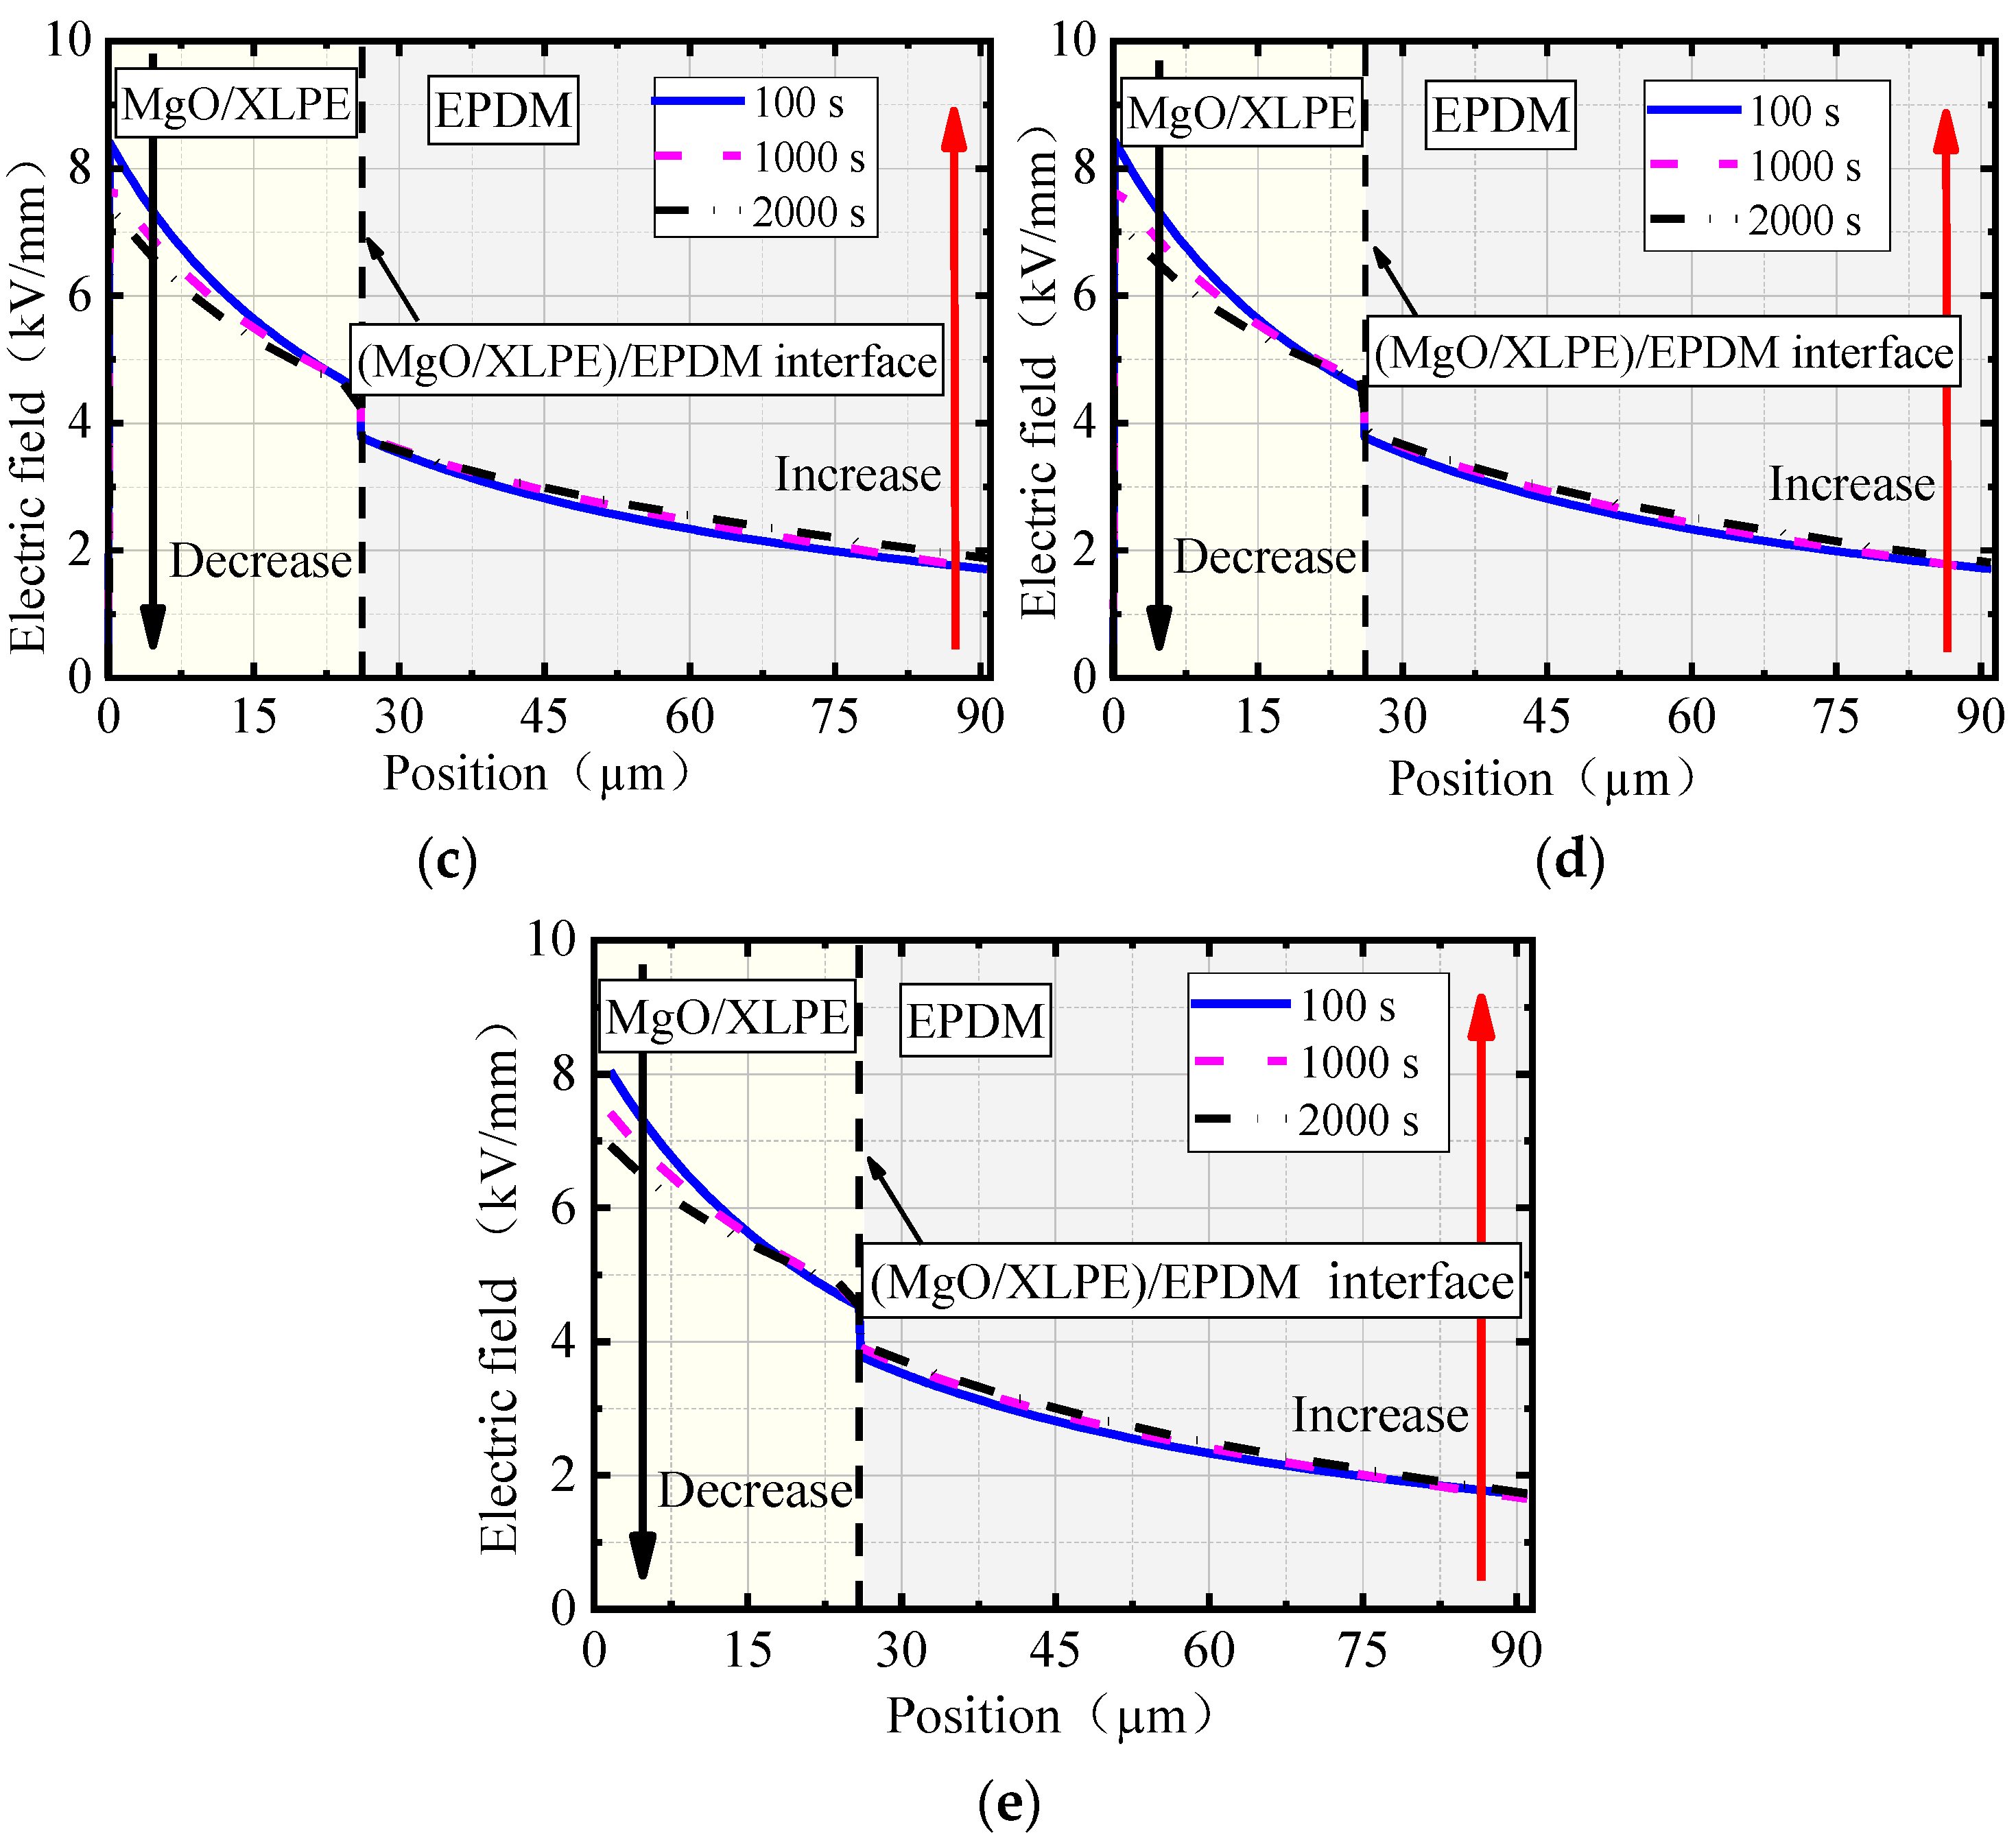
Due to the difference in charge density between both sides of the (MgO/XLPE)/EPDM interface, the radial electric field in the joint with different nano-MgO concentrations abruptly change at the interface. With the extension of time, the electric field decreased in MgO/XLPE while it increased in EPDM, and the radial electric field of the joint was homogenized to some extent. This conclusion provides support for clarifying the electric field distribution of the cable joint after the cable insulation (XLPE) is modified by adding nano-MgO.
(3)
When the nano-MgO concentration is 0.5 wt%, the number of charges accumulated in the radial direction of the joint was the fewest, and the electric field at the root of the stress cone was the lowest. Therefore, it can be considered that the joint can maintain better performance when the concentration is 0.5 wt% compared with other concentrations. This conclusion provides a reference for improving the insulation performance of the cable joint by nano-MgO addition.
(4)
When the nano-MgO concentration was 0.5 wt%, with the increase of the temperature difference of the cable joint, the number of charges accumulated at the (MgO/XLPE)/EPDM interface gradually increased and had a tendency to be saturated. The charges in MgO/XLPE gradually increased, and the position of the maximum value gradually appeared from the inner shield side to the middle of MgO/XLPE, while the charge density curves in EPDM intersected.

Author Contributions

Conceptualization, Y.W. and X.Y.; investigation, Y.W., S.Z. and C.L.; simulation, Y.W. and Y.S.; writing—original draft preparation, S.Z. and Y.S.; writing—review and editing, X.Y. All authors have read and agreed to the published version of the manuscript.

Funding

This work was supported the National Natural Science Foundation of China, grant number 52207025, and the Shanghai Sailing Program, grant number 20YF1414700.

Data Availability Statement

Not applicable.

Conflicts of Interest

The authors declare no conflict of interest.

References

  1. Chen, X.; Dai, C.; Yu, L.; Jiang, C.; Zhou, H.; Tanaka, Y. Effect of thermal ageing on charge dynamics and material properties of 320 kV HVDC XLPE. IEEE Trans. Dielectr. Electr. Insul. 2019, 26, 1797–1804. [Google Scholar] [CrossRef]
  2. Du, B.; Zhao, G.; Li, Z.; Han, C. Effects of Harmonic Component on Electrical Tree in EPDM for HVDC Cable Accessories Insulation. IEEE Trans. Dielectr. Electr. Insul. 2021, 28, 578–585. [Google Scholar] [CrossRef]
  3. Morshuis, P.; Cavallini, A.; Fabiani, D.; Montanari, G.C.; Azcarraga, C. Stress conditions in HVDC equipment and routes to in service failure. IEEE Trans. Dielectr. Electr. Insul. 2015, 22, 81–91. [Google Scholar] [CrossRef]
  4. Wang, Y.; Sun, Y.; Zhang, S.; Ren, P.; Yang, X.; Wang, Y.; Yin, Y. Study on interface region space charge distribution of HVDC cable joints based on molecular chain dynamics. Proc. CSEE 2022, 42, 3854–3864. (In Chinese) [Google Scholar]
  5. Chen, J.; Gao, Y.; Zhu, M.; Li, J.; Yu, Q. Space charge dynamics in double-layered insulation cable under polarity reversal voltage. IEEE Trans. Dielectr. Electr. Insul. 2020, 27, 622–630. [Google Scholar] [CrossRef]
  6. Meng, F.; Wang, X.; He, D.; Li, Q. Study on the Relation between Space Charge Accumulation at Cable Stress Cone and Semiconducting Materials. In Proceedings of the 2019 2nd International Conference on Electrical Materials and Power Equipment (ICEMPE), Guangzhou, China, 7–10 April 2019; pp. 65–68. [Google Scholar]
  7. Yu, J.; Chen, X.; Zhou, H. Electric field calculation and optimization for stress cone of DC cable joint based on the coaxial double-layer insulation model. IEEE Trans. Dielectr. Electr. Insul. 2020, 27, 33–41. [Google Scholar] [CrossRef]
  8. Ye, H.; Fechner, T.; Lei, X.; Luo, Y.; Zhou, M.; Han, Z.; Wang, H.; Zhuang, Q.; Xu, R.; Li, D. Review on HVDC cable terminations. High Volt. 2018, 3, 79–89. [Google Scholar] [CrossRef]
  9. Suh, K.S.; Nam, J.H.; Kim, J.H.; Ko, K.C.; Han, S.O. Interfacial Properties of XLPE/EPDM Laminates. IEEE Trans. Dielectr. Electr. Insul. 2000, 7, 216–221. [Google Scholar] [CrossRef]
  10. Vu, T.T.N.; Teyssedre, G.; Le, R.S. Electric Field Distribution in HVDC Cable Joint in Non-Stationary Conditions. Energies 2021, 14, 5401. [Google Scholar] [CrossRef]
  11. Du, B.; Li, J.; Sekii, Y. Effects of ZnO particles on space charge of EVA copolymer for HVDC cable accessory insulation. IEEE Trans. Dielectr. Electr. Insul. 2017, 24, 1503–1510. [Google Scholar] [CrossRef]
  12. Li, Z.; Fan, M.; Zhou, S.; Du, B. BNNS Encapsulated TiO2 Nanofillers Endow Polypropylene Cable Insulation with Enhanced Dielectric Performance. IEEE Trans. Dielectr. Electr. Insul. 2021, 28, 1238–1246. [Google Scholar] [CrossRef]
  13. Roy, M.; Nelson, J.K.; MacCrone, R.K.; Schadler, L.S.; Reed, C.W.; Keefe, R. Polymer nanocomposite dielectrics-the role of the interface. IEEE Trans. Dielectr. Electr. Insul. 2005, 12, 629–643. [Google Scholar] [CrossRef]
  14. Cao, W.; Li, Z.; Sheng, G.; Jiang, X. Insulating property of polypropylene nanocomposites filled with nano-MgO of different concentration. IEEE Trans. Dielectr. Electr. Insul. 2017, 24, 1430–1437. [Google Scholar] [CrossRef]
  15. Li, S.; Yin, G.; Chen, G.; Li, J.; Bai, S.; Zhong, L.; Zhang, Y.; Lei, Q. Short-term breakdown and long-term failure in nanodielectrics: A review. IEEE Trans. Dielectr. Electr. Insul. 2010, 17, 1523–1535. [Google Scholar] [CrossRef]
  16. Li, S.; Min, D.; Wang, W.; Chen, G. Modelling of dielectric breakdown through charge dynamics for polymer nanocomposites. IEEE Trans. Dielectr. Electr. Insul. 2016, 23, 3476–3485. [Google Scholar] [CrossRef]
  17. Zhu, X.; Wu, J.; Wang, Y.; Yin, Y. Characteristics of partial discharge and AC electrical tree in XLPE and MgO/XLPE nanocomposites. IEEE Trans. Dielectr. Electr. Insul. 2020, 27, 450–458. [Google Scholar] [CrossRef]
  18. Peng, S.; He, J.; Hu, J.; Huang, X.; Jiang, P. Influence of functionalized MgO nanoparticles on electrical properties of polyethylene nanocomposites. IEEE Trans. Dielectr. Electr. Insul. 2015, 22, 1512–1519. [Google Scholar] [CrossRef]
  19. Wang, Y.; Wu, J.; Yin, Y. Nanostructures and Space Charge Characteristics of MgO/LDPE Nanocomposites. IEEE Trans. Dielectr. Electr. Insul. 2017, 24, 2390–2399. [Google Scholar] [CrossRef]
  20. Wu, J. Experimental Study and Numerical Simulation of Charge Transport in Low-Density Polyethylene Nanocomposite Media. Ph.D. Thesis, Shanghai Jiaotong University, Shanghai, China, 2012. [Google Scholar]
  21. Tanaka, T.; Kozako, M.; Fuse, N.; Ohki, Y. Proposal of a mulit-core model for polymer nanocomposite dielectric. IEEE Trans. Dielectr. Electr. Insul. 2005, 12, 669–681. [Google Scholar] [CrossRef]
  22. Henk, P.O.; Kortesn, T.W.; Kvarts, T. Increasing the electrical discharge endurance of acid anhydride cured DGEBA epoxy resin by dispersion of nanoparticle silica. High Perform Polym. 1999, 11, 281–296. [Google Scholar] [CrossRef]
  23. Lan, L. The Effect of Temperature on Space Charge Behavior in Polymer Insulation. Ph.D. Thesis, Shanghai Jiaotong University, Shanghai, China, 2015. [Google Scholar]
  24. Wang, Y. Characteristics of Periodic Geounded DC Tree in High Voltage Direct Current Cable Insulation. Ph.D. Thesis, Shanghai Jiaotong University, Shanghai, China, 2018. [Google Scholar]
  25. Pourrahimi, A.M.; Olsson, R.T.; Hedenqvist, M.S. The role of interfaces in polyethylene/metal-oxide nanocomposites for ultrahigh-voltage insulating materials. Adv Mater. 2018, 30, 1703624. [Google Scholar] [CrossRef] [PubMed]
  26. Min, D.; Li, S.; Ohki, Y. Numerical simulation on molecular displacement and DC breakdown of LDPE. IEEE Trans. Dielectr. Electr. Insul. 2016, 23, 507–516. [Google Scholar] [CrossRef]
  27. Bhutta, M.S.; Yang, L.; Ma, Z.; Nazir, M.T.; Akram, S.; Mehmood, M.A.; Faiz, N. Simulation of thickness controlled DC breakdown of XLPE regulated by space charge & molecular chain movement. IEEE Trans. Dielectr. Electr. Insul. 2020, 27, 1143–1151. [Google Scholar]
Figure 1. Schematic diagram of multi-core model.
Energies 15 06948 g001
Figure 2. The relation between the nano-MgO concentration and the interparticle spacing and deep trap density.
Energies 15 06948 g002
Figure 3. The trap and charge distribution in the material before and after nano-MgO addition: (a) pure XLPE; (b) MgO/XLPE.
Energies 15 06948 g003
Figure 4. Schematic diagram of the charge transport process in the bipolar charge transport model.
Energies 15 06948 g004
Figure 5. Schematic diagram of the cable joint: 1—stress cone; 2—EPDM (joint insulation); 3—high voltage shield tube; 4—XLPE (cable insulation); 5—conductor shield; 6—cable core.
Energies 15 06948 g005
Figure 6. The radial space charge density distributions in the cable joint with different nano-MgO concentrations: (a) 0 wt% nano-MgO; (b) 0.1 wt% nano-MgO; (c) 0.5 wt% nano-MgO; (d) 1.0 wt% nano-MgO; (e) 2.0 wt% nano-MgO.
Energies 15 06948 g006aEnergies 15 06948 g006b
Figure 7. The radial electric field distributions in the cable joint with different nano-MgO concentrations: (a) 0 wt% nano-MgO; (b) 0.1 wt% nano-MgO; (c) 0.5 wt% nano-MgO; (d) 1.0 wt% nano-MgO; (e) 2.0 wt% nano-MgO.
Energies 15 06948 g007aEnergies 15 06948 g007b
Figure 8. Space charge density distributions at the (MgO/XLPE)/EPDM interface with different nano-MgO concentrations: (a) 0 wt% nano-MgO; (b) 0.1 wt% nano-MgO; (c) 0.5 wt% nano-MgO; (d) 1.0 wt% nano-MgO; (e) 2.0 wt% nano-MgO.
Energies 15 06948 g008
Figure 9. Electric field distributions at the (MgO/XLPE)/EPDM interface with different nano-MgO concentrations: (a) 0 wt% nano-MgO; (b) 0.1 wt% nano-MgO; (c) 0.5 wt% nano-MgO; (d) 1.0 wt% nano-MgO; (e) 2.0 wt% nano-MgO.
Energies 15 06948 g009aEnergies 15 06948 g009b
Figure 10. The charge density and electric field distributions at the (MgO/XLPE)/EPDM interface under different temperature differences with nano-MgO concentration of 0.5 wt%.
Energies 15 06948 g010
Figure 11. The charge density and electric field distributions in the radial direction of cable joint under different temperatures with nano-MgO concentration of 0.5 wt%.
Energies 15 06948 g011
Table 1. Trap depths of the MgO/XLPE with different nano-MgO concentrations.
Nano-MgO Concentration/wt%00.10.51.02.0
UtrX/eV0.9460.9410.9390.9630.966
Table 2. Deep trap densities of MgO/XLPE with different nano-MgO concentrations.
Nanocomposites/wt%00.10.512
NT/m−36.24 × 10202.40 × 10221.20 × 10232.39 × 10234.78 × 1023
Table 3. Parameters for the charge transport simulation of the cable joint.
ParametersMgO/XLPEEPDM
UtrE/eV/0.948
wie/eV/1.26
DevATEexp(−Utrx/(kBT))vATEexp(−Utr/(kBT))
Be/s−1 e N T µ e / ( ε 0 ε r ) e N T µ e / ( ε 0 ε m )
Bh/s−1 e N T µ h / ( ε 0 ε r ) e N T µ h / ( ε 0 ε m )
Net/C·m−3100 + NTn100
Nht/C·m−3100 + NTn100
µe/m2·V−1·s−12.6 × 10−6 exp(−0.54/kT)2 × 10−5 exp(−0.54/kT)
µh/m2·V−1·s−11 × 10−6 exp(−0.6/kT)2 × 10−5 exp(−0.6/kT)
S1, S2, S3/m3·V−1·s−10.050.05
S0/m3·V−1·s−100
Table 4. The mean values and variances of the space charge density in different parts of the cable joint at 2000 s.
Nanocomposites/wt%00.10.512
MgO/XLPE/(C/m−3)mean values0.67350.67500.52690.73390.7802
variances0.00580.00430.00720.02500.0718
EPDM/(C/m−3)mean values0.54740.55850.22720.12470.0578
variances0.03990.20700.01900.00950.0077
(MgO/XLPE)/EPDM/MAXIAOYU(C/m−3)mean values0.60240.61110.41130.39970.1933
variances0.02880.01660.03510.10880.0756
Publisher’s Note: MDPI stays neutral with regard to jurisdictional claims in published maps and institutional affiliations.

