Abstract
The shift toward electric mobility in Germany is a major component of the German climate protection program. In this context, public charging is growing in importance, especially in high-density urban areas, which causes an additional load on the distribution grid. In order to evaluate this impact and prevent possible overloads, realistic models are required. Methods for implementing such models and their application in the context of grid load are research topics that are only minorly addressed in the literature. This paper aims to demonstrate the entire process chain from the selection of a modelling method to the implementation and application of the model within a case study. Applying a stochastic approach, charging points are modelled via probabilities to determine the start of charging, plug-in duration, and charged energy. Subsequently, load profiles are calculated, integrated into an energy system model and applied in order to analyze the effects of a high density of public charging points on the urban distribution grid. The case study highlights a possible application of the implemented probabilistic load profile model, but also reveals its limitations. The primary results of this paper are the identification and evaluation of relevant criteria for modelling the load profiles of public charging points as well as the demonstration of the model and its comparison to real charging processes. By publishing the determined probabilities and the model for calculating the charging load profiles, a comprehensive tool is provided.
1. Introduction
Electric mobility plays a major role in the German government’s 2030 climate protection program. Emissions from transport must be reduced by up to 42% by 2030 compared with 1990 (Climate Protection Program 2030) [1]. This objective is to be achieved particularly through the establishment of electric mobility and an associated expansion of necessary charging infrastructure. There are currently around 600,000 battery electric vehicles (BEVs) registered in Germany (over 1,135,000 electric vehicles (EVs) including plug-in-hybrids). This represents tremendous growth over the past several years (about 2000 BEVs in 2011), with numbers nearly doubling in the year of 2021 (about 280,000 new BEVs registrations, 545,000 including plug-in-hybrids) [2,3]. The described development in EV registrations also requires corresponding development of the charging infrastructure in Germany. This expansion is associated with challenges. Particularly in high-density conurbations, the conditions for the installation of charging points (CPs) at private sites or at the workplace are not available for everyone due to space constraints. One solution to this problem is to install charging infrastructure in available public places, which would allow entire streets to be completely electrified and thus could serve as an enabler for electric mobility. As of December 2021, about 41,993 normal CPs (≤ 22 kW charging power) and 7214 fast CPs (>22 kW charging power) are publicly accessible in Germany [4], with an expected growth between at least 440,000 and 843,000 public CPs by 2030 [5]. However, this development is confronted with various difficulties. Public charging infrastructure can currently only be operated economically to a limited extent. High utilization of CPs is desirable to enable economic viability [6]. A challenging problem which arises in this domain is the integration of these CPs and consequently processes in the distribution grids’ operation. In order to ensure the reliability and stability of the future energy system, continuous investigation of the grid load caused by charging operations at public CPs is essential. Modeling and simulation of public charging infrastructure can function as important predictors to address these challenges.
The content of the paper is structured as follows: In Section 1, the research context is revealed, an insight into the literature is provided and the contribution of this publication to the state of the art is described. Section 2 provides a comprehensive description of the applied methods to structure the model. This includes individual subchapters describing preparation of the input data set, generation of probability distributions and subsequently calculating load profiles. Section 3 evaluates the resulting load profiles compared to the input data set and exemplified by data for Munich. Further on, it demonstrates application of the implemented model as part of a higher-level energy system model. Section 4 provides a brief excursion into an evaluation of the COVID-19 pandemic’s influence on charging characteristics. Section 5 includes a conclusion and a critical review in which limitations of the chosen modelling approach are elaborated. Section 6 concludes by referring to the data and model provided by the publication.
1.1. Research Context
In order to determine future load caused by charging infrastructure on the distribution grid, the entire building stock of Munich, including various components in the distribution grid, was modeled. To provide a reference, the status quo of the grid load was simulated for characteristic grid topologies, whereby the number of charging processes by BEVs was negligible [7]. With the objective of realistically presenting effects on the future grid load, various scenarios were modelled. This includes, for example, the ramp-up of heat pumps as well as EVs [8]. Subsequently, the potential grid loads in different scenarios and areas in the city of Munich were investigated for the projection year 2030, assuming a completely uncontrolled charging of all EVs in distribution grids [9]. The distribution grid and load modeling methodology used underwent extensive evaluation. Modeling, initialization and simulation were performed with the power grid and energy system model for distribution grids “GridSim” [10]. Depending on their main application, EVs are integrated into the energy system in three different ways:
- Privately used EVs are modeled in the “integrated model for load and mobility profiles of private households”. In this agent-based model, vehicles are explicitly connected to the activities and mobility behavior of unique agents who primarily charge at their own private CPs [11].
- Commercially used EVs are not connected to the activities of individual agents, but to individual commercial units, enabling entire fleets of vehicles to be assigned to them [12]. The basis for the mobility profiles of commercially used BEVs is provided by the study “Motor Vehicle Traffic in Germany” from 2010 [13]. This was followed by linking the weekly and annual driving profiles of these EVs [14], enabling modeling of charging load profiles.
- Public charging and the methods employed for the modelling are further described in this publication.
Within these research activities, investigations focus, in particular, on high-density, urban areas and the impact of charging processes on distribution grids. A particular focal point is the analysis of a high concentration of public CPs in the distribution grid. Thus, equipping an entire street with charging points, a so-called “electric avenue”, is a relevant research environment. A real “electric avenue” consisting of public CPs does not yet exist, but several projects consisting of private CPs are already being piloted [15,16]. In order to evaluate the distribution grids perspective, the following research questions are addressed in the context of this publication:
- What concepts are available to model the resulting grid load of public charging points in distribution grids, and how do they differ?
- Which approach is suitable for modelling the resulting load profiles in a generally applicable way, and what are the limitations?
- What is the additional load of an “electric avenue” consisting of public charging points?
1.2. Literature Review—Modeling of Public Charging Load Profiles
Considering the planned expansion of the public charging infrastructure and the increasing number of fast charging stations, the modelling of public charging is becoming increasingly important. In particular, the resulting grid load in the case of local concentration effects and the interaction of charging at different locations (private, workplace and public) are topics explicitly exhibited in the literature as a demand for research [17].
As a first step, approaches for modeling charging load profiles and their differences are evaluated. When modeling public charging infrastructure, modeling of high-power charging systems is often the focus of investigation. The corresponding literature on fast charging stations is only marginally considered, as their characteristics differ substantially, e.g., the connection in a higher grid level. The primary approaches used to model charging can be divided into agent-based and stochastic models, which are discussed further below.
1.2.1. Agent-Based Modeling
Agent-based models consider each agent or vehicle individually and create individual activity profiles. This approach is applied at the FfE for modeling private mobility and charging processes [11]. An agent is usually represented by a household resident, which can be assigned to a specific agent group according to its characteristics. On the basis of individual attributes, synthetic activity profiles are generated which simulate daily routines and results in corresponding mobility profiles.
An example of agent-based modeling is presented in [18], in which the model includes a fixed number of households that are composed of agents as well as EVs. Socio-economic parameters determine the distances covered by respective EVs, and depending on the technical charging equipment of the destination (private, public and workplace) as well as consumption, it is determined whether a charging process takes place. In [19], an agent-based model is used to investigate how policy measures affect charging behavior. In contrast to simulation models that focus on technical and financial factors, additional theoretical approaches from environmental psychology are used in this model. Regarding their mobility pattern the modelled agents use one-day transport diaries, and depending on the destination of the individual trips, different charging locations are selected.
An advantage of agent-based mobility models is the possibility of combined analysis of charging in different areas, since agents usually define a destination depending on the reason for the trip. Also, the behavior of the agents can be defined by individual criteria, allowing a wide variety of focal points to be analyzed. On the other hand, necessary knowledge about a large number of factors affecting the behavior of the agents as well as the technical characteristics of individual vehicles is a disadvantage due to the resulting complexity of the simulation. In the case of an analysis of individual distribution grids, e.g., in a city like Munich, a large number of agents would have to be simulated due to commuter flows, which would further increase complexity.
1.2.2. Stochastic Load Profile Modeling
Stochastic methods do not require knowledge about the individual behavior of vehicle drivers. Based on empirical data from charging infrastructure, algorithms generate representative charging load profiles. Stochastic modeling approaches in the context of EV charging are particularly often applied to charging at private CPs, for example in [20,21]. Stochastic methods are difficult to apply for modeling the grid load caused by public charging, due to an often very-limited data basis.
In [22], the probability distribution functions for arrival time and required energy of plug-in hybrid vehicles are extracted based on 40,000 vehicle trips from a national travel behavior survey in the USA. Probabilistic and deterministic charging profiles are constructed and compared. No distinction is made between charging locations; instead, the end of a trip is utilized as an indicator to calculate the start time of a charging. A comparable method is used within [23], in which arrival times were statistically evaluated from over 130,000 individual trips in the Netherlands. Daily travel distances of vehicles were used to identify charging demand, and aggregated charging profiles are generated taking into account various charging strategies. Paper [24] focuses explicitly on public charging, in which data on the charging infrastructure in Graz are evaluated and probabilities for start of charging and charged energy quantities at public charging stations are generated. Probabilities differentiate depending on the location of the considered charging infrastructure. Charging profiles at charging stations are generated from a defined amount of EV charging daily. Time of charging start and charged energy for each EV are determined by generated random numbers and calculated probabilities. Charging time is subsequently calculated from the energy and the charging power of the station.
Compared to an agent-based approach, stochastic mobility modelling often offers the advantage of lower modelling effort, as no modelling of individual agents is required. Input data can also be filtered according to various criteria in order to generate load profiles for specific use cases. At the same time, this reveals the biggest problem with stochastic approaches: a sufficiently large database is required, and filtering criteria have to be selected carefully. Otherwise, the influence of individual data may compromise representativeness.
1.3. Improvements of This Paper in the Context of the Literature
Although there are many studies regarding public charging, the research in modelling load profiles remains limited. Most studies have relied on data collected by BEVs and not by CPs. This paper applies parts of the methods of previous works [23,24] and thus verifies the practicability of these methods. An important contribution and thus progress compared to the current state of the art is that this paper analyzes the process for calculating probabilities in great detail. Resulting difficulties and their consequences are identified. The literature is advanced by demonstrating the process holistically from a basic data set, to processing it into probabilities, to the calculation of load curves of public charging infrastructure, to the use of load curves as part of a simulation of an energy system. This paper also exemplifies the application of load profiles by analyzing the effects of a high number of public CPs in one string of a distribution grid and provides indicators for dimensioning an “electric avenue”. Thus, the paper encompasses the entire process chain from data analysis to application of the model. Further, by publishing the calculated probabilities as well as the model for the calculation of charging load profiles, a comprehensive tool is provided which closes a gap in the publicly available model landscape. This paper and the published data will further assist in research regarding the topics of public charging infrastructure and the charging operations performed at it.
2. Methodology
Following the analysis of modelling methods in Section 1.2 and Section 1.3, the basic structure is implemented using the stochastic approach. This selection is primarily supported by an available data set of public charging data from all over Germany, which serves as input data [25]. Due to framework conditions and in order to continuously and accurately represent the reality of public charging, requirements emerge for the conceptual design of the model. Modularity to use the model in stand-alone mode as well as a submodule of the GridSim model [10] is a key factor. With increasing market coverage of EVs and further charging infrastructure expansion, expected new input data in coming years should be incorporated with little effort. These requirements lead to the structural modelling setup shown in Figure 1. The model is divided into two connected modules which calculate the load profiles of public CPs. The core of this model is the “module for modeling the probabilities”, from which output corresponding load profiles are generated in the superordinate “module for modelling electric load profiles”. The structure of the two modules is discussed in the following sections.
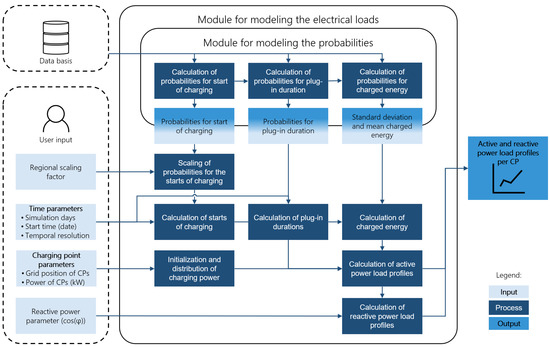
Figure 1.
Schematic representation of the structural setup of the implemented model.
2.1. Module for Modeling the Probabilities
Within the “module for modeling the probabilities”, empirical data is used to characterize charging behavior at different CPs via probabilities. Each charging process is characterized by the timestamp for the start of charging, a corresponding plug-in duration and charged energy. This process only needs to be performed once if the input data base remains the same and can be easily expanded if the data base is updated. The following subsections describe the data basis, applied methods to calculate probabilities for public charging infrastructure as well as its restrictions.
2.1.1. Data Basis
The data basis for the calculation of probabilities is an anonymized data set of the Central Data Monitoring (ZDM) of NOW GmbH. ZDM collected operating and charging data from EVs and charging stations with data loggers. Over a period from 2013 to 2020, more than 400,000 charging processes were recorded at 630 different charging stations in Germany [26]. Recorded data includes information about the used charging station, as well as the timestamps at which the BEVs and CPs’ connection starts and stops. The end of charging is defined by the timestamp at which a charging plug is disconnected from the CP. In addition, the charged energy as well as the location (city level) are available [25].
In order to ensure a high degree of representativeness, the raw data set is firstly processed and filtered according to various criteria. Initially, measurement errors, duplicate readings and implausible charging processes are excluded from the anonymized raw data set. This process removes charging operations that last less than 2.5 min or more than 24 h. Also, charging operations with zero charged energy are excluded. Since the focus of the model is public charging infrastructure, all charging processes measured at CPs located at private sites or at the workplace are removed. Recorded data are further divided into alternating and direct-current CPs. Since the availability of data for fast chargers (nominal power > 50 kW) is negligible, these CPs and the charging processes conducted at them are also excluded. Applying this procedure, 107,404 charging operations from 527 CPs remain after filtering according to these criteria. Table 1 lists the main characteristics of the processed and further considered data set.

Table 1.
Overview of the processed data set.
The processed data corresponds well to the expected pattern for public charging described in related studies. Three quarters of plug-in durations are within the range of a few hours (<4.90 h), which corresponds to the typical interim charging pattern at public CPs [6]. Statistical analysis of charged energy clarifies this pattern, according to which three-quarters of the charging operations charge less than 12.40 kWh. Assuming standard charging powers of 11 or 22 kW, the majority of plug-in durations are less than five hours (cf. Figure 2).
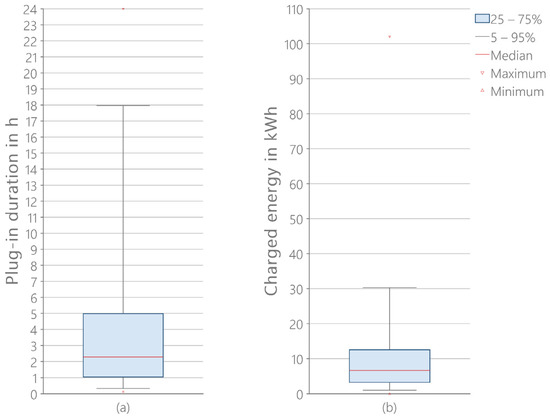
Figure 2.
Statistical evaluation of processed data on plug-in duration (a) and charged energy (b).
2.1.2. Calculation of Start of Charging Probabilities
Starting from the processed data set, the calculation of probabilities follows, which is necessary for modelling charging curves considering the stochastic approach. For each charging process the parameters start, plug-in duration and charged energy are extracted from the data set. These attributes are analyzed in a preliminary analysis with regard to different characteristics. Analysis on start-of-charging probabilities includes an examination of the influence of the day of the week, the recording period, the region as well as the season. Within the model no distinction is made between public (91.49% of CPs) and semi-public (8.51% of CPs) accessibility, since restrictions regarding accessibility are impacted by regional and individual circumstances. The probabilities for the start of a charging process are thus calculated from all CPs, taking into account various criteria. Subsequently, an overall average probability is calculated using weighting coefficients corresponding to different recording periods of the individual CPs.
In the first evaluation, the probability for the start of charging is determined as a function of the day of the week. Weekdays (Monday to Thursday) are combined in one probability and are referenced as weekdays below. This assumption is based on [27], which shows that the mobility profiles, according to the analysis of a German time-use survey, have very similar characteristics on these days. The characteristic days—weekdays, Friday, Saturday and Sunday—are hereafter referred to as type-days. No differentiations are applied with regard to public holidays and resulting changes to charging behavior. In theory, charging operations on these days could be combined with Sunday profiles, since very similar conditions apply regarding public life on public holidays. Since the CPs of the data set are distributed over the whole of Germany with various regional holidays, this differentiation is neglected due to a disproportionately high required effort. An evaluation requested in the review containing the recalculation of probabilities with the inclusion of nationwide public holidays as Sundays is provided in Appendix A. Table 2 shows significant differences in average characteristics for different days of the week. On weekdays and Fridays, the utilization of CPs is considerably higher than at weekends, with the opposite case occurring in terms of charged energy. This is also reflected in the probabilities of a start of charging calculated for these days (cf. Figure 3).
Table 2.
Characteristics of the processed data classified by type-days.
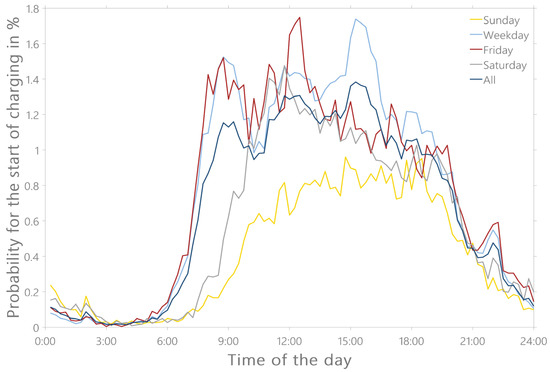
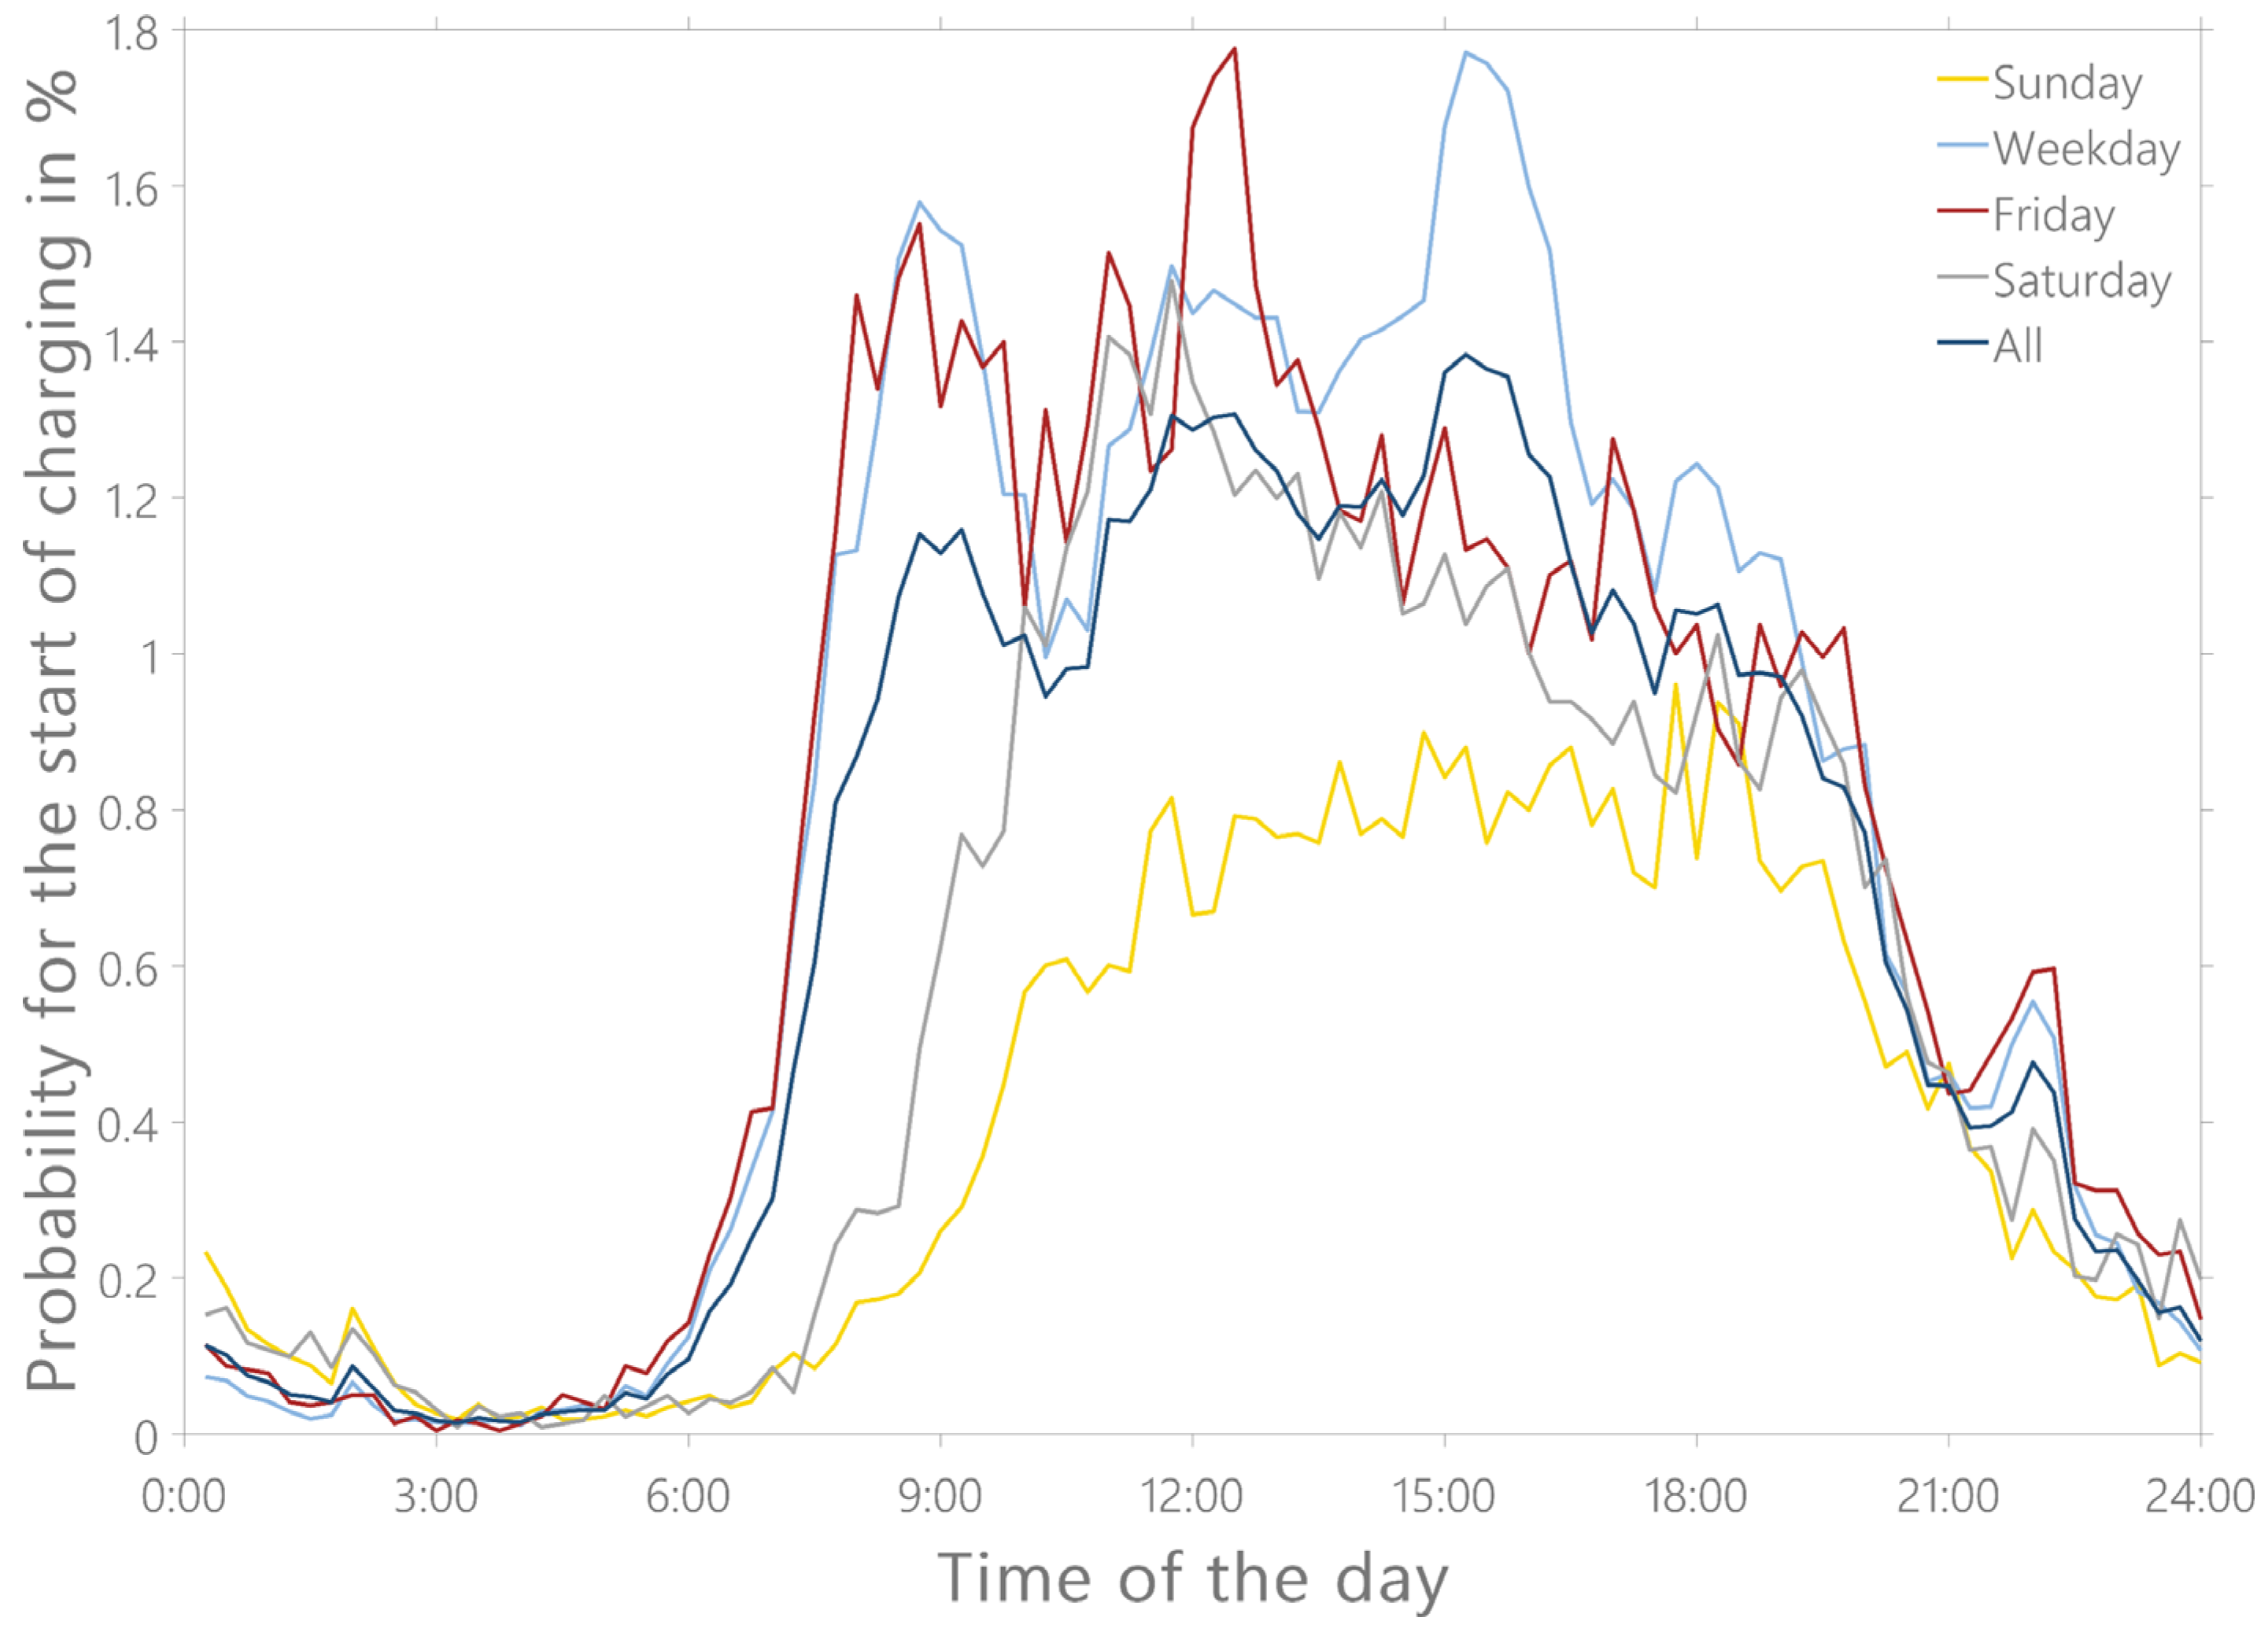
Figure 3.
Probabilities for the start of a charging process classified by type-days in 15 min resolution.
Figure 3 shows the interpolated discrete start of charging probability distributions classified by type-day at a temporal resolution of 15 min. On weekdays and Fridays, charging processes start slightly earlier in relation to the weekend, which is also reflected in the probabilities. This can be attributed to commuting traffic, which is predictably higher on these days. This also accounts for increased utilization and thus probability of start of charging in the evening on weekdays. This clear distinction highlights the significance of differentiation according to the type-day criterion.
In the second evaluation, the start of charging probability is determined as a function of the recording period. Figure 4 clarifies a clear difference when considering specific time periods in the calculation of the probability distributions. In Figure 4a, all of the charging processes from the start of the recording period to the respective year were taken into account for calculation. It is evident that in relation to the recording period, only a small number of charging processes occurred in the first years. The probability for charging processes increases due to higher utilization of CPs recorded in later years. In Figure 4b, only charging processes within the explicit time intervals were included in calculation. The closer the selected time interval is to the present, the higher probabilities increase. Also, there is a noticeable saturation when comparing the latest time intervals “2017 to 2019” (39,952 charging processes at 201 recorded CPs) and “2019 to end” (58,862 charging processes at 416 recorded CPs). Comparison of the curves “All” from Figure 4a and “2019 to end” from Figure 4b clarifies that inclusion of all loading processes over the entire recording period certainly leads to a reduction in the probability. However, due to comparatively small deviations as well as the significant reductions in the resulting charging events (only 58,862 out of 107,404 in the “2019 to end” period), it was decided to include all measured values.
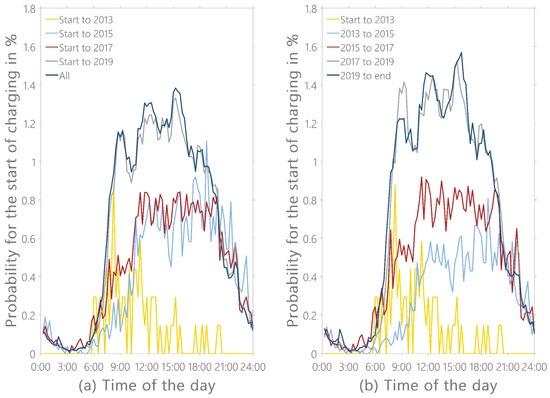
Figure 4.
Probabilities for the start of a charging process classified by different recording periods in 15 min resolution: start to the respective year (a) and specific time periods (b).
In the third evaluation, the start of charging probability is determined as a function of the region. CPs and associated charging processes are categorized and aggregated with reference to their installation region. Population statistics of respective regions serve as an indicator for categorization. Categories are defined and assigned according to classification of city and municipality types in Germany by the Federal Institute for Research on Building, Urban Affairs and Spatial Development. CPs are subdivided into the categories large, medium, small cities and rural municipalities:
- Large city: Municipality of an association of municipalities or unitary municipality with at least 100,000 inhabitants.
- Medium city: Municipality of an association of municipalities or unitary municipality with 20,000 to less than 100,000 inhabitants.
- Small city: Municipality of an association of municipalities or unitary municipality with 5000 to less than 20,000 inhabitants.
- Municipality: Rural municipality with up to less than 5000 inhabitants [28].
An evaluation in Figure 5 illustrates the first differences with regard to regional characteristics over the monitoring period. Figure 5a presents the progression of the number of CPs measured each week, while Figure 5b part shows the weekly average charging operations performed at them. Progression over time shows that there is a considerable increase in the number of CPs measured weekly until the end of the recording period (approx. at beginning of 2020).
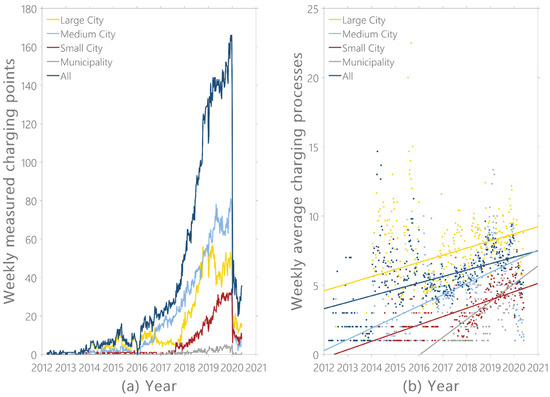
Figure 5.
Weekly measured CPs (a) and average weekly charging processes performed there including least squares trend line (b) over the measurement recording period.
Analysis of the average weekly charging processes of measured CPs, in Figure 5b, highlights an increase in charging processes across all regional categories through linear trend lines (least squares of error). A precise explanation of this development is not possible with the available information. Analyzed CPs and processes in corresponding categories, as well as average values for plug-in duration and charged energy, are listed in Table 3, which shows an uneven distribution of CPs and processes for different categories. The primary share of CPs is located in large- and medium-sized cities. In theory, this represents the situation of the expansion of public charging infrastructure in Germany very well. Public CPs are predominantly set up in larger cities, as they can only be operated economically if they are heavily utilized [29].
Table 3.
Characteristics of the processed data classified by region.
A further notable observation is a significantly higher average plug-in duration in large cities relative to smaller regions. Analysis shows, that this can be attributed to EVs being plugged in at public CPs overnight more often, which is considered to be due to the limited private parking capacity in dense residential areas. In contrast, mean charged energy in large cities is significantly lower in relation to smaller regions, which can be attributed to short utilization of CPs in large cities during the day. Figure 6 shows the interpolated discrete start of charging probability distributions classified by region at a temporal resolution of 15 min.
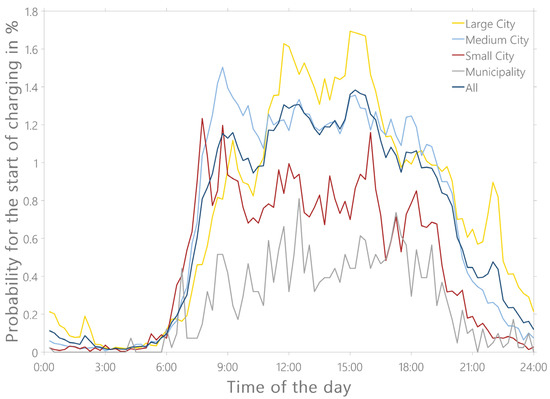
Figure 6.
Probabilities for the start of a charging process classified by region in 15 min resolution.
Significantly higher utilization of urban CPs from Table 3 is also evident in the regionally classified probabilities of charging starts (cf. Figure 6). Despite significant differences and clear tendencies, it cannot be excluded that the presented curves are massively distorted by the input data set, since only a small share of total public charging infrastructure in Germany is analyzed. A comparison of the amount of public CPs in the analyzed data set with the amount in Germany described in [4] results in a minor share of 1.25% of all public German CPs. Also, the probabilities of the different categories are distorted due to the small number of CPs and charging processes in small municipalities. The theoretically necessary combination with subdivision into type-days, which is considered relevant, would further distort the data. Due to these uncertainties, this categorization is not taken into consideration for modelling the general probabilities, despite more severe differences in amplitude than in the subdivision into type-days.
In the fourth evaluation, the probability of start of charging is determined as a function of the season. Evaluated charging processes, as well as the average values for plug-in duration and the resulting charged energy, are listed in Table 4. The values do not indicate any significant seasonal differences in average plug-in duration and charged energy. Figure 7 shows the associated discrete start of charging probability function classified by season at a temporal resolution of 15 min.
Table 4.
Characteristics of the processed data classified by season.
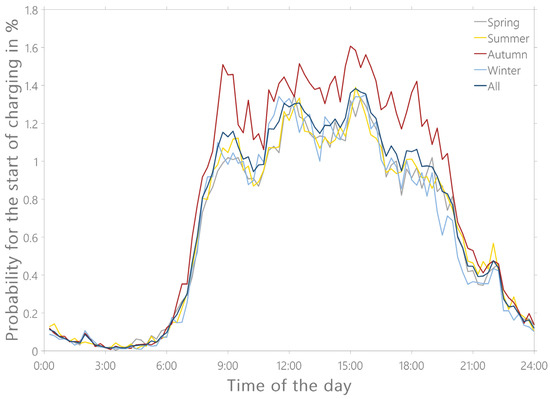
Figure 7.
Probabilities for the start of a charging process classified by season in 15 min resolution.
A slightly higher probability in autumn is notable. Therefore, the absolute number of recorded seasons per CPs is evaluated and aggregated to exclude any imbalance due to the recording (cf. Table 4). No significant differences in the number of recorded seasons are apparent. An explanation is provided by the development of the recording period (cf. Figure 5), according to which the peak of measured CPs, with a tendency towards increasing charging frequency over the years, occurred in autumn 2019. Since the effects of this disaggregation only affect the amplitude and are minor in relation to the overall probability of starting a charging process, it is neglected, and only classification by type-days is considered further and probabilities in different temporal resolutions are calculated.
2.1.3. Calculation of Plug-In Duration Probabilities
The probability for the plug-in durations is also calculated as discrete distribution. Equivalent to the procedure for calculating start of charging probabilities, a dependence of plug-in duration on the type-day and as a function of the timestamp for start of charging is examined (cf. Figure 8). No significant deviations to the mean value over all recorded plug-in durations are evident. However, significant fluctuations appear, especially at night, which can be attributed to the limited amount of charging processes starting at these times (cf. Figure 4, Figure 5 and Figure 6). This limited sample and the associated fluctuation is a reason to not classify plug-in duration by type-days. However, the figure clarifies the dependency of plug-in duration on the time of day, which is evaluated further.
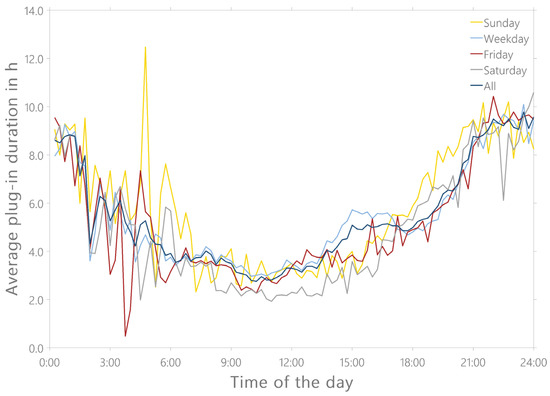
Figure 8.
Average plug-in duration classified by type-days in 15 min resolution.
In order to decrease fluctuation due to the influence of a limited number of sample points during the night, it is reasonable to define a suitable time interval for the calculation of the plug-in duration probabilities and aggregate all available values within these periods. It is important to avoid choosing a disproportionately large time interval in order to adequately reproduce the time dependency shown in Figure 8. For this purpose, different temporal resolutions are evaluated (5 min, 15 min, 30 min, and 1 to 4 h), and the minimum number of plug-in durations per time step are calculated. The conducted analyses and comparison show that the time interval of two hours represents a reasonably good trade-off between the number of sample points (minimum 340 in the time interval between 2:00 a.m. to 3:55 a.m.) and an appropriate representation of temporal dependence. Figure 9 illustrates the resulting plug-in duration probabilities for different time periods in which charging processes can start. Again, it is evident that the impact of the small number of sample points at night cannot be completely suppressed even by selecting two-hour time periods. Two trends are identified within time periods during the day that support this subdivision. First, the probability of a short plug-in duration increases from morning to midday and decreases again into the evening hours, which can presumably be attributed to short intermediate charging. Second, a trend to higher probabilities for a long plug-in duration (about 19 h to 15 h at 12 a.m. to 8 p.m.) is apparent from midday onwards, with the duration decreasing at later time periods (about 12 h to 8 h at 8 p.m. to 12 p.m.). This is presumably due to EVs being charged overnight on public CPs. Therefore, the probability of a higher plug-in duration in the afternoon is recognizably lower than the plug-in duration overnight in the evening. For the calculation of the plug-in duration within the implemented model, the calculated, time-dependent probabilities shown in Figure 9 are further considered.
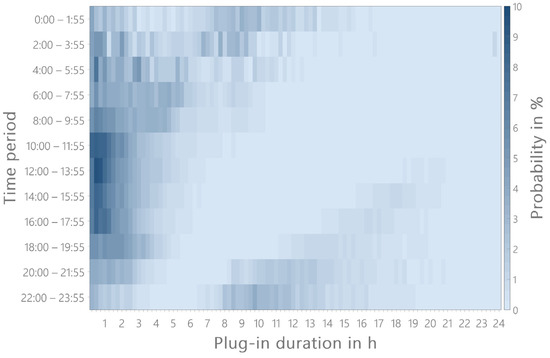
Figure 9.
Heatmap of probabilities for specific plug-in duration in different time periods of the day.
2.1.4. Calculation of Charged Energy
A decisive factor influencing charging duration and thus also plug-in duration is the nominal power of the CPs. During the raw-data processing, all charging processes with charging power greater than 22 kW are discarded, which only permits the subdivision into 3.7 kW, 11 kW and 22 kW. Since the structure of the input data set does not allow for a unique assignment of charging power across all entries, plug-in duration and charged energy cannot be filtered by this criterion. Also, this characterization would have to take into account a vehicle-side power constraint, since many EVs only support single-phase charging, which prevents them from accessing the theoretically available nominal power of the CPs [5]. Since the plug-in duration together with the maximum transferable charging power limit the possible charged energy per charging process, an alternative approach is selected when calculating these probabilities.
The charged energy probability is not calculated as a function of the time of charging start, but as a function of the plug-in duration. Instead of determining the probabilities of a different charged energy regarding each plug-in duration, this approach approximates the probability of the charged energy as a continuous probability density function. Conducted analyses show that logarithmic normal distribution most accurately describes charged energy distribution. Therefore, for each plug-in duration and temporal resolution, the logarithmic mean and logarithmic standard deviation of charged energy quantities are determined. Individual application of the logarithmic normal distribution particularly limits overestimation of charged energy quantities at high plug-in durations. The choice of a continuous distribution also offers the advantage of interpolating data gaps within the discrete distribution. Figure 10 shows an example of how the charged energy distribution is modeled by the logarithmic normal distribution compared to its discrete distribution. The graph shows charged energy probabilities for a plug-in duration of two hours calculated at a time resolution of five minutes.
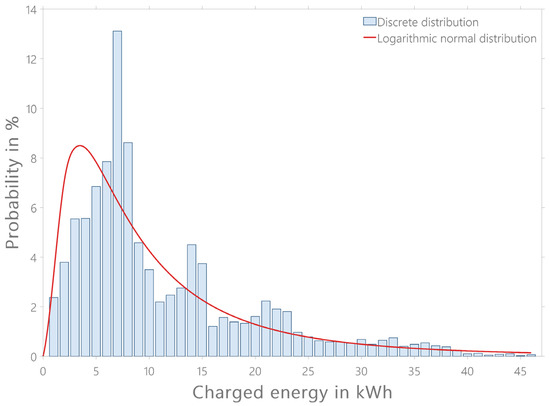
Figure 10.
Discrete and logarithmic normal distribution of charged energy probability for a plug-in duration of two hours at a temporal resolution of five minutes.
The deviations between values from the discrete probability distributions and the calculated logarithmic normal distributions are evident and vary considerably depending on the plug-in duration and temporal resolution. In order to evaluate the resulting deviation by choosing the logarithmic normal distribution over a discrete distribution, these are calculated and compared for all evaluated, temporal resolutions (cf. Figure 11).
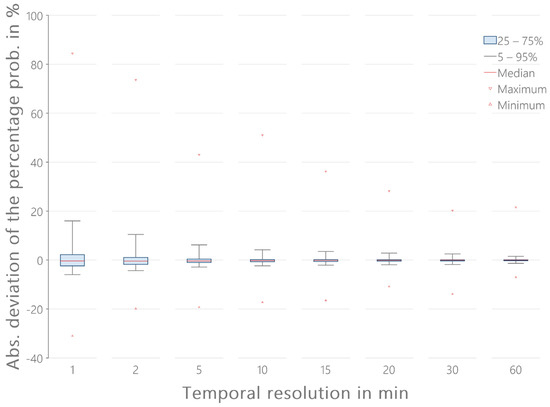
Figure 11.
Absolute deviation of the percent probability from discrete and logarithmic normal distribution for different temporal resolutions.
The differences of the values selected from the discrete probability distribution compared with the continuous value of the charged energy is determined for each possible plug-in duration. Figure 11 clarifies this deviation of distributions statistically. Each boxplot includes deviations of all discrete data points from the respective continuous values for all plug-in durations. As expected, especially small temporal resolutions reveal significant differences concerning extreme values. Overall deviation decreases over larger temporal resolutions, which can be attributed to sample size becoming more comprehensive in each step. Starting with an averaging of data in a temporal resolution of five minutes, 90% of absolute deviation is located in a positive and negative single-digit interval.
2.1.5. Scaling of Start of Charging Probabilities
The chosen method for modeling the probability of charging events represents a very comprehensive approach. In its application, the model still confronts certain restrictions. First, the dispersion of the start of charging probability for different regions shown in Section 2.1.2 represents a limitation. Since the module for modeling the probabilities does not distinguish between different regions due to the input data, these spreads are not reproduced by the model. Second, the calculated probabilities are based on historical data and therefore can only reflect historical charging behavior. However, the number of EVs will increase significantly in the upcoming years, which will also increase the utilization of public CPs. Continuous updates of input data would be required to maintain the modeled charging behavior up to date, which limits the current model to the simulation of the status quo charging behavior.
To exceed these limitations, a simple method is applied as an example to adjust the start of charge probability in order to achieve a prescribed value for the average charges per day. Assuming that plug-in durations and charged energy remain constant, this enables us to model future scenarios or regions with different public charging characteristics while still taking into account the original framework conditions. In order to achieve this, a factor is varied from 0 to 5 and multiplied with the start of charging probabilities. For each factor 3000 annual charging profiles are calculated in order to avoid a random scattering of values. Subsequently, the average number of charging processes per day and CPs are calculated. In this example the range of the factor is chosen to achieve a number of about two charges per day. Figure 12 shows the resulting datapoints of this analysis.
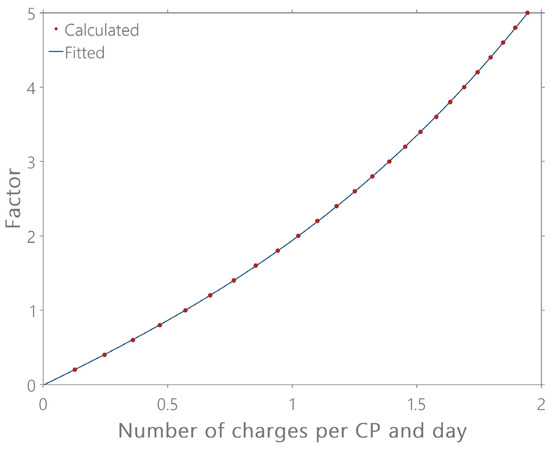
Figure 12.
Determination of the factor for manipulating the start of charging probability.
It turns out that the adjustment does not follow a linear behavior. This is explained by the circumstance that only time steps with no ongoing charging processes are examined to determine whether a charging process is about to begin. With increasing plug-in probability at a higher chosen factor, the CPs are charging more frequently and the assessment of whether a charging process is starting occurs less frequently. In order to model this behavior, a polynomial of the third degree is fitted into the resulting sample points. Equation (1) contains the resulting polynomial function, where represents the average number of charges per day and CPs, and represents the calculated factor. The resulting curve described by the polynomial is also shown in Figure 12.
This polynomial fitting function allows the model to calculate a target value for the number of charging processes per day and CPs. Within the model, the factor is calculated by using Equation (1), and the resulting factor is multiplied with the start of charging probability. Provided that a sufficiently large number of CPs is simulated, the target value is reached with neglectable deviation. It applies to consider that the manipulation via this exact polynomial is only be conducted up to two charging processes per day, as this number can only be scaled up to a limited extent. Since the function is based on the probabilities evaluated from the data set described in Section 2.1, the calculated coefficients are only valid for these. With different input data, the polynomial would have to be recalculated.
2.2. Module for Modeling the Electric Loads
Within the comprising module, the probabilities are used to calculate load curves coupled to user inputs. This can be used in stand-alone applications for corresponding end-use applications, such as the calculation of CP utilization, as well as embedded within the GridSim model. In this model the generated load profiles are analyzed as part of a comprehensive energy system, e.g., to evaluate the resulting grid load in different scenarios. The workflow and restrictions of the module according to the setup in Figure 1 are discussed further.
The simulation to generate load profiles is initialized by different user inputs, which include metadata such as time period and time step size, the number of CPs as well as their nominal power. Load profiles are calculated on the basis of the characteristic probabilities and possible adjustments. To create these profiles, the time of start of charging, plug-in duration and charging duration are determined using random numbers and the calculated probabilities. This basic process is described in the following flowchart (cf. Figure 13).
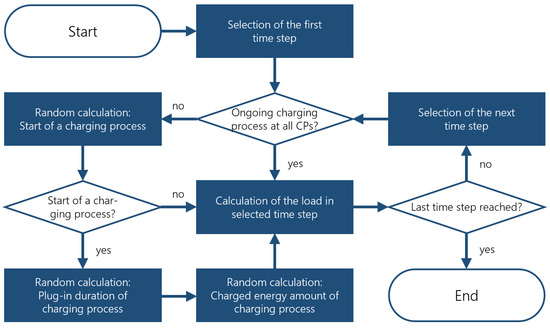
Figure 13.
Flowchart of the basic process for generating load profiles.
After initialization, the module follows the sequence and calculates the load profile for each CP and time step. The calculation distinguishes between plug-in time and charging time, since vehicles can be fully charged before plug-in time has elapsed. Maintenance charges within the plugged-in period after full charge is reached are neglected. After successful initialization, values for uniformly distributed random numbers are calculated depending on the defined time step width as well as on the idle status of the CPs (cf. box “Random calculation: Start of a charging process” in Figure 13). These values are compared with the calculated probability for this time step, according to the type-day criteria specified in Section 2.1.2. For all idle CPs whose resulting random value is less than the probability, a charging process starts at this time step. If this initiates at least one charging process, values for two further random numbers are calculated regarding the associated CPs. These also uniformly distributed random values are applied to define plug-in duration and charged energy.
The process of determining the plug-in duration is almost analogous to the process of determining time of the start of charging. Random numbers are generated and compared with a stacked probability consisting of proportions of the overall probability for the plug-in duration in the respective time window. Figure 14 exemplifies this random selection process for a plug-in duration in the time period from 8:00 a.m. to 9:55 a.m. calculated in hourly resolution. In the example, the random numbers calculate with the value of 0.25, which then translates to a charging time of two hours from the aggregated probability. On statistical average, this method ensures the representation of plug-in duration according to proportions of the input data.
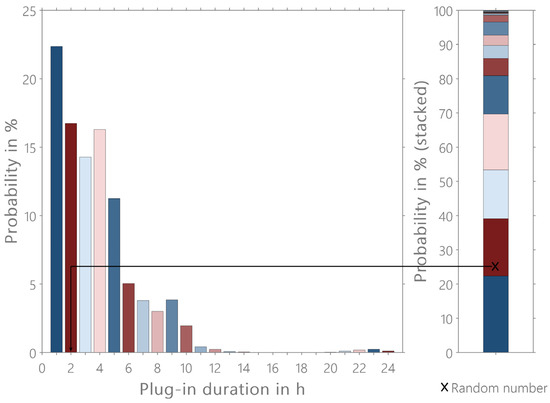
Figure 14.
Exemplary representation of the process for selecting the plug-in duration in hourly resolution for the time period from 8:00 to 9:55 a.m.
The selection of a plug-in duration is followed by the determination of the charged energy for each charging process, which is obtained via a corresponding random number as a function of the determined plug-in duration. A logarithmic normal distribution is formed for this purpose. The parameters used for calculation are the logarithmic mean and the logarithmic standard deviation. The charged energy corresponds to the value at which the random number exactly matches the value of the logarithmic normal distributed probability (cf. example in Figure 15). Based on the nominal power of the CPs and temporal resolution, the charged energy is afterwards converted into a unique charging duration. If the charging time exceeds the plug-in or simulation period, the charging process is cut off at the end of the period. In the shown example, the random numbers calculate with the value of about 0.72, which then results in a charged energy of about 14 kWh. The figure further highlights the significant differences in the probability of different amounts of charged energy as a function of plug-in duration.
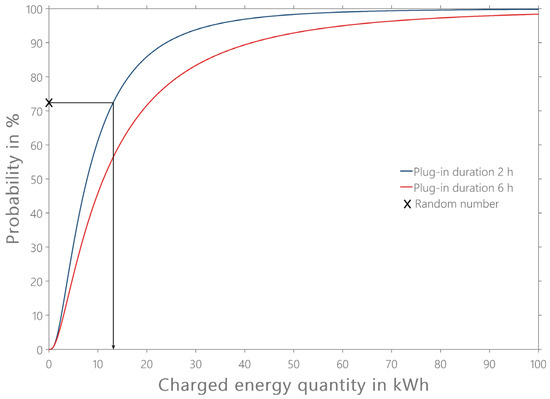
Figure 15.
Exemplary representation of the process for selecting the charged energy for plug-in durations of two and six hours.
3. Results and Discussion
The following section evaluates results generated by the model. For this reason, load profiles of public CPs generated with the model are compared with the characteristics of the input data to validate the models’ representativeness. Furthermore, the model is applied within a case study, whereby its results are evaluated and assessed.
3.1. Evaluation of Resulting Charging Profiles
To evaluate the model and validate the results, several assessments are performed. In order to calculate a negligible variance regarding characteristics like the number of charging processes per day, charging load profiles are calculated for different numbers of CPs. Afterwards the variation of the characteristics depending on the number of CPs is examined. A calculated number of 500 CPs shows a negligible variance regarding the characteristic values. Therefore, annual charging profile for this number of CPs with a power of 11 kW is calculated for evaluation. These profiles are first compared with the input data and second with the characteristic values for Munich [30]. Figure 16 shows the relative frequency of the consumed energy per charge for the conducted validation (simulation) and for the input data (reference). Distributions show that both curves fit very well, with the biggest deviations occurring in the range between 1 and 9 kWh. These deviations are explained by the fact that no distinction is made between different charging powers when determining probabilities for plug-in duration and charged energy. Thus, for a given charging duration, an amount of charged energy that does not match the selected charging power could also be determined. In such a case, the CPs cannot deliver the total energy in the specified time. If necessary, this amount of energy is limited to the maximum possible value.

Figure 16.
Relative frequency of energy consumption per charging process.
As in the previous evaluation, the relative frequencies are also calculated for the plug-in and plug-out time. These are illustrated over the course of the day in hourly resolution in Figure 17. Once again, results of the simulation are compared with an analysis of the input data (reference). However, unlike Figure 16, this evaluation does not distinguish between different type-days. The results of the simulation and reference also fit very well. As the graph shows, the relative frequency, a manipulation of the start of charging behavior by the factor (cf. Section 2.1.5), does not impact the comparability.
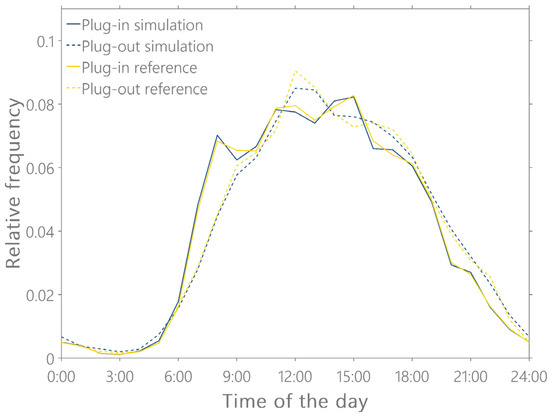
Figure 17.
Relative frequency for plug-in and plug-off during a day.
In Table 5, key parameters from the simulation are evaluated. Additionally, to calculated statistic values regarding the input data, values for Munich are included [30]. As described in Section 2.1.5, the average number of charges per day can be specified by the user in order to scale probabilities for the start of charging. In this example, the value is set to 0.72 charges per day to fit the value of Munich. In comparison, the value from the input data set of 0.20 only represents about a quarter of the daily public charges in Munich. Without an adjustment factor, the average calculated number of charges per day would be 0.57. The difference between these numbers clearly shows a large range of possible deviations between the start of charging frequency, which justifies the adjustment of its probability for this purpose. This table also contains the average plug-in duration with the simulation results exactly matching the input data. In contrast, the value for the average plug-in duration in Munich is almost twice as great. The deviation could hypothetically be explained by the fact that users leave their vehicles plugged in for much longer in urban areas like Munich because of overnight charging at public CPs. However, this behavior is not reflected by the model, since it does not distinguish between rural and urban areas (cf. evaluation in Section 2.1.2). A similar pattern is noticed for the average energy consumption per charge. Model and input data show similar characteristics. At approximately 1.5 times the energy of the input data set, the average transmitted energy per charge in Munich is again significantly higher. Possible explanations for this are the model’s neglection of CPs with higher charging power or the possible deviation between input data and the overall increase of battery capacities over the past years, which also results in a higher average charged energy. Scaling plug-in duration and charged energy would be a possible solution to resolve the differences. However, the optimal solution would be a region-specific data set to calculate the characteristics.
Table 5.
Modeled results compared with input data and data for Munich.
As the literature review in Section 1.2 already illustrates, various methods of modelling load profiles exist, but only a fraction of them address the modelling of public charging profiles. Comparison with literature sources highlights the strengths and weaknesses of the implemented approach. In relation to [24], which represents a valid benchmark due to its comparable methods, the approach applied in the paper represents a significant advance, as it achieves a higher resolution and a greater level of detail with regard to various parameters. Specifically, calculations of plug-in duration and charged energy can be referred to in this context. In [24], plug-in duration is defined by the necessary charging time of individual BEVs, whereby possible idle times after the end of charging processes are neglected. This leads to a disproportionately high availability of CPs, which is more realistically modelled by the stochastic approach from the perspective of CPs in this manuscript. Also, in terms of charged energy, the method used in this study advances the reference source due to a considerably higher temporal resolution. A disadvantage compared to this source is the distinction made regarding charging power, which was not considered in this work and the significance of which is also evident in [6]. Paper [6]’s main focus was not on modelling charging load profiles, but rather on representing real conditions in Germany by analyzing a multitude of charging processes. It clarifies the significance of the CPs’ location for their charging characteristics, although the necessary subdivision is missing in the application of both [24] and this paper, apart from the evaluation in Section 2.1.2. Compared to [6], the method applied in this paper for calculating the charged energy represents a step forward. Analyzing the probabilities for starting a charging process, the data recorded in [6] shows a lower overall amplitude. This indicates that the values calculated in this paper show a too high probability for the start of charging processes on a national average due to the significantly smaller data basis compared to the 26,951 observed connectors in [6]. In summary, the model developed in this paper contributes to the state of the art, especially due to its analyses of the input data according to various criteria with a focus on public charging. The applied methods for calculating the plug-in durations and the associated charged energy also contribute to this.
3.2. Case Study—“Electric Avenue”
In the following section, the model is applied exemplarily in a case study to evaluate the resulting grid load of an “electric avenue” consisting of public CPs. The application of the model is demonstrated and discussed.
3.2.1. Configuration of the “Electric Avenue” Simulation
In the following simulation, load profiles resulting from the modeling process are analyzed within GridSim to evaluate the impact of the load profiles of public charging infrastructure. The investigated grid within this survey is an average distribution grid of the city of Munich which has already been analyzed in previous simulations regarding the status quo [7] and potential impacts due to uncontrolled charging processes of private and commercial EVs [8]. The selected average distribution grid is calculated from all distribution grids in a postcode area. The characteristics of the CPs and charging processes are absolutely independent of the grid and the other connected components. The objective of the simulation is to determine effects of an “electric avenue” on today’s grid operations and to approximate a reasonable number of CPs for dimensioning an “electric avenue” according to simulated utilization.
Based on the status quo configuration, the longest string of the distribution grid topology is equipped with the theoretical maximum number of public CPs. The limiting factor is the length of the string, which in this case is anticipated to run parallel to the road. For the road, it is assumed that it is not interrupted by a cross-street along the parallel section of the string and that parking is also possible on both sides of the road in this section. According to this length, the maximum numbers of parallel (6.5 m width each) or perpendicular (2.5 m width each) parking spaces on both sides of the road without interruption are calculated. Each parking lot is provided with an individual 11 kW CP, all of which are equally distributed to grid interconnection points along the string. This results in a total number of 48 CPs in the parallel arrangement (PAA) and 128 CPs in the perpendicular arrangement (PEA) (cf. Table 6). In these configurations, the CPs are each connected via individual connection lines.
Table 6.
Scenario configuration.
A Monte Carlo simulation is performed over one simulation year at a temporal resolution of five minutes. For public CPs, the probabilities described in Section 2.1 are selected for a corresponding temporal resolution. Probabilities for the start of a charging process are scaled by the method described in Section 2.1.5. The fundamental method of modeling and the basic procedure of simulation with GridSim are described in detail in [10]. Evaluation includes the analysis of various grid characteristics of the averaged distribution from the Monte Carlo simulation. Characteristic values are compared with status quo simulations (excluding an “electric avenue”) according to [7]. The distributions are further aggregated to identify the total load of the charging system. This serves as an indicator for a reasonable number of CPs within an “electric avenue”.
3.2.2. Resulting Grid Load from an “Electric Avenue”
In this section, results of the case study for public charging in Munich are discussed. In Figure 18 the arrangement’s maximum charging powers are plotted over the time of one week. They vary significantly in the comparison of the arrangements due to the increased number of CPs. This is due to the fact that the PEA corresponds to 1408 kW of installed power compared to the installed power of 528 kW in the PAA.
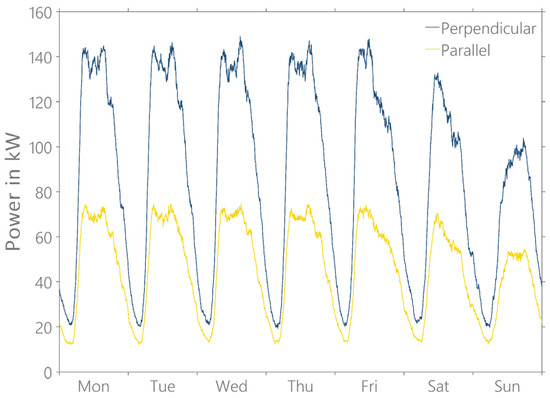
Figure 18.
Maximum power of public CPs over the course of a week with an “electric avenue” in perpendicular and parallel arrangement.
The characteristics of the type-days (cf. Section 2.1.2) also emerge in this evaluation, e.g., the very similar characteristics of working days (Mon.–Thu.), as the model applies the same probabilities for starts of charging at these days. Considering the maximum charging power of 74.58 kW in the PAA, it appears that with an installed capacity of 48 CPs operating at 11 kW, a maximum of 6.78 CPs are used simultaneously. With 148.90 kW maximum power in the PEA, a maximum of 13.53 CPs in simultaneous use results. This clarifies that an “electric avenue” on this scale would be significantly oversized considering the current charging demand.
From the perspective of the distribution grid, an “electric avenue” has significant effects in terms of the resulting load. Figure 19 shows the annual load duration curve at the low voltage side of transformer in the examined grid.
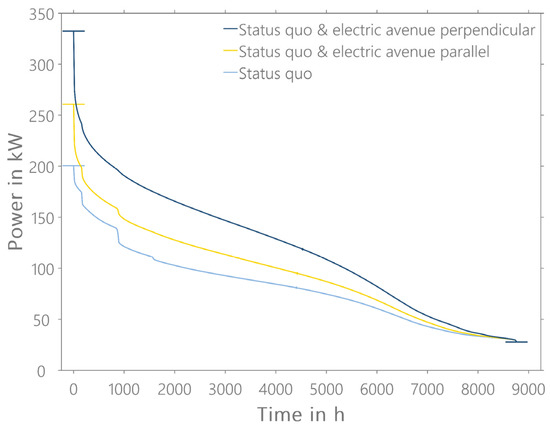
Figure 19.
Annual load duration curve at the transformer.
The duration lines rapidly become much steeper, which indicates that the maximum power is only required within a few hours per year. The status quo curve represents the present load in this grid. The load is mainly dominated by private households, commercial units and electric storage heaters [7]. With an annual power peak of 200 kW and a utilization of under 30%, no overloads occur at the 630 kVA transformer. The addition of CPs significantly increases the maximum utilization to 260.7 kW (PAA) and 332.5 kW (PEA). An overload at the transformer is therefore not to be expected in the examined setup. In addition to the load on the transformer, the minimum voltages of the households’ grid connection points and the maximum line utilization are also examined. The maximum line utilization is approximately at an uncritical 45% in the status quo. Through the addition of charging points, this value increases to 80% (PAA) and 130% (PEA), which exceeds the critical limit. However, 100% line utilization is only exceeded at approximately 6 m line length in the PEA. The minimum voltage at the grid connection points is 98% of the nominal voltage in the status quo and drops to 97% (PAA) and 94% (PEA), which can be classified as non-critical.
Overall, the simulation embedded in the GridSim model demonstrates a basic application of the developed model. With regard to possible overloads in the grid, the results clarify that a high number of public CPs in an average urban distribution grid in Munich tends to cause congestion in the lines. The simulation shows that the theoretically maximum configuration of the arrangement of public CPs corresponds to a distinctly overrepresented system considering charging processes’ characterization by the model. Furthermore, it is important to consider that a generally assumed charging characteristic can be affected by significant deviations in the case of an “electric avenue” application due to possible rebound effects. The calculation with the theoretical configurations should only be utilized as an indicator for a possible configuration if the real charging characteristics of the region are sufficiently known. In this specific case, a realistic “electric avenue” setup could be approximated with the maximum load of the two configurations and could thus range between 6.78 and 13.53 CPs. Considering this objective, the model and the methods applied within it can certainly contribute in a pertinent manner.
4. Excursus on the Influence of the COVID-19 Pandemic
Since the recorded data set contains both a period before the COVID-19 pandemic and a period at the start of the COVID-19 pandemic, this excursus provides a brief insight into the impact of the pandemic on the charging behavior at CPs recorded within this period. The reference date for this assessment is 22 March 2020, the date the first lockdown was imposed in Germany [31]. After this date, 85 CPs at various locations in Germany were still recorded. In order to keep the influence of other factors, such as seasonality, as low as possible, the analysis period was selected symmetrically around this reference date. For each CP, the period from the reference date to the individual end of recording as well as the identical time interval before the reference date were determined and evaluated. Table 7 highlights the resulting charging characteristics of the analyzed CPs. It shows a significant decrease in absolute and average daily charging processes at recorded CPs. Due to the symmetrical analysis period for each individual CP as well as the clearly different locations of these, it is unlikely that the upcoming end of the measurement is responsible for this decrease. However, its influence cannot be completely dismissed, nor can seasonal effects, which, according to the analysis in Section 2.1.2, tend to play a subordinate role. It is thus plausible that the imposed lockdown is responsible for the decline in public charging, although a sample of 85 CPs and 4771 charging processes is of limited significance, so this result should be handled cautiously.
Table 7.
Characteristics of the CPs within the time period around the reference day.
5. Conclusions and Critical Review
In this final substantive section, key aspects of this publication, applied methods, and analyses are summarized. Through a critical review, weaknesses of the publication in terms of method, assessment, and results as well as potential improvements are concluded.
5.1. Conclusions
This publication encompasses the entire process chain from the fundamental analysis of different modelling types for the generation of load profiles of public charging infrastructure, to the conception and implementation of a stochastic model, to its piloting within the context of a case study. One key element is the conception of the probability module based on various analyses of a comprehensive data set with over 100,000 public charging processes.
From the literature, two basic modelling approaches can be classified for models to generate load profiles of public charging infrastructure: agent-based and stochastic models. Agent-based models are often coupled with comprehensive traffic simulations and offer the advantage of representing charging at different destinations. Stochastic approaches offer the advantage of a lower simulation effort but require a sufficiently comprehensive database. Due to availability of an extensive data set, the model is conceptualized and implemented according to a stochastic approach. Therefore, the model is divided into two core modules and comprises, on the one hand, the calculation of probabilities and, on the other hand, the subsequent generation of charging load profiles of public CPs.
At first, probabilities were derived for three parameters: the start of charging, the plug-in duration, and the energy charged. Calculated probabilities were then analyzed and checked for plausibility with regard to various criteria. When calculating the probabilities for the start of charging, the day of the week, recording period, regionality of CPs, and seasons were examined. In order to minimize errors and to depict probabilities that are as universally valid as possible, the final calculation only differentiates between individual days. When calculating probabilities for the plug-in duration, dependence on individual days is also examined, but only dependence on the time of day is considered in the finally calculated probabilities. For the charged energy an alternative approach is applied, whereby values are calculated by logarithmically normally distributed curves depending on the plug-in duration. The evaluation of the calculated probabilities reveals some weaknesses of the approach. In order to enable the model to approximate these results, a simple method is applied to derive a scaling factor on the basis of the number of charging processes per day as a target value, which adjusts the calculation of the start of charging probabilities.
Based on the module for generating the probabilities, load profiles were subsequently determined in the superordinate module. This enabled us to individually generate charging load profiles for different time resolutions and a defined number of charging points. The logic is based on the application of equally distributed random numbers which are compared with stacked probabilities for corresponding time steps whereby charging events are triggered. This model can operate as a stand-alone configuration as well as an embedded module in the context of the GridSim model. In the embedded configuration, charging stations are assigned to specific nodes in the distribution grid, whereby the effects on the distribution grid can be calculated and evaluated.
This configuration is exemplified within the case study conducted in this publication to assess the impact of integrating an “electric avenue” into distribution grids. The case study demonstrates a potential application of the implemented model. In an average distribution grid in Munich, a string of the grid is fully equipped with the theoretically maximum number of public CPs, and the impact on the distribution grid resulting from the charging load profiles is analyzed. The case study illustrates that public CPs in this configuration have significant effects on the local grid load and can especially lead to line congestions. Since the modelled configuration is only hypothetical and of limited practical value, the maximum simultaneous load should only be considered as indicator for a feasible configuration.
The brief excursus on the impact of the COVID-19 pandemic in Section 4 reveals that charging behavior can change significantly within a very short time. Since it cannot be ruled out that the decline in charging processes at the CPs results from other contributing factors, this can only be attributed to the pandemic with reservations. This change is not reflected in the chosen stochastic approach and calculated probabilities. Potentially abnormal situations, such as the change caused by the COVID-19 pandemic, can only be represented to a limited extent via the selected stochastic approach. The changes in the characteristics of charging behavior indicate the dynamics of this system and emphasize the importance of a solid input data base as well as its analysis.
The implemented model represents a solid basic framework for the modelling of the charging load profiles through public CPs, but still exhibits weaknesses in terms of the application. Although the data set forming the basis of the probabilities is already sufficiently large to derive and test general criteria, only a limited number of filtered probabilities are calculated in order to ensure representativeness. Evaluation demonstrates that the methods applied in the publication provide useful solutions and that their application with an even more comprehensive data base could result in the calculation of more precise load profiles with fewer constraints. In summary, analyses of the data set and the model described in this paper provide a blueprint for the analysis public CPs’ charging data. The detailed structure of the implemented model is especially directed towards the modelling community and aims to create awareness for the modelling of public charging load profiles. Analysis of charging data is relevant to this community as well, but the addressed target group encompasses a larger audience. Within the FfE, the model will primarily serve in the area of distribution grid analysis, as exemplified in the case study. However, this model offers a much greater range of possibilities for energy system analysis, to which external stakeholders should be enabled through the publication of the model and data.
5.2. Critical Review
Different assumptions and simplifications are applied in the methodical context of data preparation in order to generate generally valid load profiles. Regionality, which is investigated and further neglected in Section 2.1.2, is a significant factor with regard to the utilization of public CPs and severely influences the probabilities for the start of charging. Thus, generated probabilities are only partially suitable for the representation of real charging systems. Applying methods to a more comprehensive data set that allows this classification with a sufficient amount of remaining charging profiles could overcome this limitation. As analysis in Section 3.1 indicates, regionality could also impact plug-in duration, which is the reason why a categorization should also be conducted with regard to its probability.
Another criteria that is neglected in calculating probabilities is the categorization according to different power categories. Subdivision into common installed power classes, e.g., 3.7 kW, 11 kW, 22 kW and superchargers’ > 22 kW, as well as the actual charging power accessed, which may be limited by the vehicle’s power electronics, are neglected. Separation and categorization of the charging processes according to actual accessed power is reasonable. The application of these probabilities in their initial specification for CPs in power classes differing from 11 kW is biased.
A further critical assumption is the combination of all recorded charging processes over the entire recording period from 2012 to 2020. Even though the majority of CPs were measured in the most recent years of recording (cf. left graph in Figure 5), identified acceleration of electromobility (cf. Figure 5b) is changing the utilization of public CPs (cf. Figure 4b). Calculation of probabilities from past charging processes does not enable precise conclusions about future utilization, which disregards the ramp-up of electromobility.
Continuing, the employment of the scaling factor according to Section 2.1.5 to adjust the probabilities for the start of charging is another critical aspect. Even though the basic objective of readjustment and thus the possibility of adapting to a required utilization of CPs is achieved, the application is not sufficiently evaluated to quantify the error of this approach. A change in the basic charging characteristics due to specific influences such as regionality cannot be excluded, whereby simple scaling would cause a significant error compared to the real conditions. This method might be suitable to a certain extent for scaling to a future load in an average configuration, whereby it is also assumed here that the charging behavior only changes slightly. Potential future influencing factors such as an increase in battery capacities, parking time models for public charging infrastructure, or external interventions such as regulation by the distribution grid operator, would significantly change charging characteristics and thus invalidate the scaling method. In addition to a different probability for the start of charging, this would also impact plug-in durations and charged energy quantities, which are also not scaled within this publication.
Application of the model in the set-up of the case study confirms already discussed issues that the usage of probabilities without further differentiation for such specific purposes is only conditionally reasonable. In an “electric avenue”, various influences could result in a significant change in charging characteristics. On the one hand, CPs in this set-up are probably less utilized on average due to the high availability; on the other hand, the potential rebound effects of an “electric avenue”, such as a higher utilization due to a high probability of finding an unoccupied CP at the street location, cannot be excluded. Configuration of the theoretical maximum of CPs only exemplifies the possibility of applying the implemented model and serves as an indicator that line congestion tends to occur first in the analyzed distribution grid at high CP density. Provided that the charging characteristics of the model correspond approximately to reality, a realistically reasonable number of CPs can be estimated from the theoretical configurations.
6. Data Preparation and Availability
The anonymized base data set provided by the ZDM for calculation purposes is not publicly available. The calculated probability distributions for the start of the charging processes, the plug-in duration and the charged energy are published on http://opendata.ffe.de/ (accessed on 2 June 2022). In addition, the module for generating load profiles (MATLAB) is available on https://gitlab.com/ffe-munich (accessed on 2 June 2022) to transparently present the methods for calculation in the case study and to make this kind of tool available to the public in order to close the gap for modelling public load profiles. The model for generating the load profiles is implemented in a modular way in order to enable other users to easily import and generate load profiles using their individual input database. All process steps of the analysis, processing and preparation of the data were carried out with the software MATLAB (version 2019b) and can be reproduced on a computer system that meets the requirements of this software. The case study was conducted with the non-publicly available power grid and energy system model for distribution grids “GridSim” (further information in [10]).
Author Contributions
Conceptualization, A.W. and M.M.; methodology, A.W. and M.M.; software, A.W. and F.B.; validation, F.B. and A.W.; formal analysis, A.W.; investigation, A.W. and F.B.; resources, A.W.; data curation, A.W.; writing—original draft preparation, A.W. and F.B.; writing—review and editing, A.W., F.B. and M.M.; visualization, A.W. and F.B.; supervision, A.W.; project administration, A.W.; funding acquisition, A.W. and M.M. All authors have read and agreed to the published version of the manuscript.
Funding
This research was conducted as part of the activities of the Forschungsstelle für Energiewirtschaft e. V. (FfE) in the project “Munich electrifies” (orig. “München elektrisiert”) as part of the “Clean Air Emergency Program 2017–2020”. The project is funded by the Federal Ministry of Economic Affairs and Climate Action (BMWK) (funding code: 01MZ18010B).
Data Availability Statement
At the time of the review, these data are not yet published. The described data and the model will be uploaded to the corresponding platforms upon 31 August 2022. If you have any questions or remarks, please do not hesitate to contact the corresponding author.
Acknowledgments
Special thanks goes to Anya Xie, who made this paper possible through her work on input data and model implementations, and the Central Data Monitoring of NOW GmbH for providing the basic data from [26] and approving the publication of the calculated probabilities. Further thanks go to Johanna Gebhard, on whose bachelor thesis the set-up of the case study is based [32], as well as Christoph Pellinger for the paper review from a general perspective.
Conflicts of Interest
The authors do not have any conflict of interest that could have impacted the content presented in this paper. In addition, no actions were performed that could be considered ethically problematic since the analyzed data is non-personalized.
Appendix A
According to the comments in the review, the calculation of the start of charging probability distributions was carried out again, and charging operations on nationwide public holidays in the period were assigned to the calculated probability distribution for Sundays. This results in the reclassification of 1413 charging operations on 87 public holidays during the assessment period. Only public holidays that were relevant for all 16 federal states were taken into account in the calculation. Table A1 and Figure A1 present the recalculated parameters and probability distributions. Compared to the originally calculated parameters (cf. Table 2 and Figure 3), there are only minor deviations, which is why it was decided not to conduct the case study again.
Table A1.
Characteristics of the processed data classified by type-days including the calculation of public holidays as Sundays.
Table A1.
Characteristics of the processed data classified by type-days including the calculation of public holidays as Sundays.
| Day of the Week | Charging Processes | Average Charging Processes per Day | Average Plug-In Duration in h | Average Charged Energy in kWh |
|---|---|---|---|---|
| All | 107,404 | 0.65 | 4.58 | 9.93 |
| Sunday and public holidays | 10.653 | 0.40 | 5.12 | 12.52 |
| Weekday | 67.405 | 0.71 | 4.68 | 9.46 |
| Friday | 16.372 | 0.69 | 4.27 | 9.87 |
| Saturday | 12.974 | 0.55 | 3.99 | 10.34 |
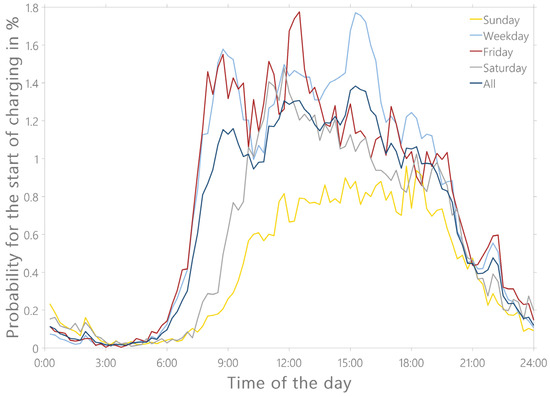
Figure A1.
Probabilities for the start of a charging process classified by type-days in 15 min resolution including the calculation of public holidays as Sundays.
Figure A1.
Probabilities for the start of a charging process classified by type-days in 15 min resolution including the calculation of public holidays as Sundays.
References
- Eckpunkte für das Klimaschutzprogramm 2030 (Fassung Nach Beschluss des Bundeskabinetts Sep. 2019). Available online: https://www.bundesregierung.de/breg-de/themen/klimaschutz/klimaschutzprogramm-2030-1673578 (accessed on 4 November 2021).
- Fahrzeugzulassungen—Bestand an Kraftfahrzeugen Nach Umwelt-Merkmalen, 1. Oktober 2021. Available online: https://www.kba.de/DE/Statistik/Fahrzeuge/Bestand/Umwelt/umwelt_node.html (accessed on 4 November 2021).
- Fahrzeugzulassungen—Bestand an Kraftfahrzeugen Nach Umwelt-Merkmalen, Ergebnisse Oktober 2021. Available online: https://www.kba.de/DE/Statistik/Fahrzeuge/Bestand/Umwelt/umwelt_node.html (accessed on 4 November 2021).
- Elektromobilität: Öffentliche Ladeinfrastruktur—Liste der Ladesäulen in Deutschland der Bundesnetzagentur (Überarbeitet: 2021). Available online: https://www.bundesnetzagentur.de/DE/Fachthemen/ElektrizitaetundGas/E-Mobilitaet/start.html (accessed on 11 November 2021).
- Windt, A.; Arnhold, O. Ladeinfrastruktur nach 2025/2030: Szenarien für den Markthochlauf; Study Commissioned by Federal Ministry of Transport and Digital Infrastructure; Nationale Leitstelle Ladeinfrastruktur: Berlin, Germany, 2020; p. 5. [Google Scholar]
- Hecht, C.; Das, S.; Bussar, C.; Sauer, D.U. Representative, empirical, real-world charging station usage characteristics and data in Germany. ETransportation 2020, 6, 100079. [Google Scholar] [CrossRef]
- Weiß, A.; Ostermann, A.; Müller, M. Simulative Analyse der aktuellen und zukünftigen Netzbelastung urbaner Versorgungsgebiete. In Proceedings of the Tagung Zukünftige Stromnetze 2020, Berlin, Germany, 29–30 January 2020. [Google Scholar]
- Weiß, A.; Ostermann, A.; Ziemsky, V. Simulative Analyse der zukünftigen Netzbelastung—Interaktion von PV und Elektromobilität im urbanen Verteilnetz. In Proceedings of the Tagung Zukünftige Stromnetze 2021, Berlin, Germany, 27–28 January 2021. [Google Scholar]
- Weiß, A.; Biedenbach, F.; Müller, M. Simulation and analysis of future electric mobility load effects in urban distribution grids. In Proceedings of the ETG Congress, Online, 18–19 March 2021; Volume 1, pp. 1–6. [Google Scholar]
- Weiß, A.; Reinhard, J.; Müller, M. Analyse methodischer Modellierungsansätze im Kontext von Verteilnetzsimulationen. In Proceedings of the IEWT 2021—12. Internationale Energiewirtschaftstagung, Vienna, Austria, 8–10 September 2021. [Google Scholar]
- Müller, M.; Biedenbach, F.; Reinhard, J. Development of an integrated simulation model for load and mobility profiles of private households. Energies 2020, 13, 3843. [Google Scholar] [CrossRef]
- Weiß, A.; Müller, M.; Franz, S. Spitzenlastkappung durch uni- und bidirektionales Laden von Elektrofahrzeugen und Analyse der resultierenden Netzbelastung in Verteilnetzen. Forsch. Ing. 2021, 85, 469–476. [Google Scholar] [CrossRef]
- Wermuth, M.; Verkehrsforschung, W.; Infrastrukturplanung GmbH. Kraftfahrzeugverkehr in Deutschland 2010 (KiD 2010)—Schlussbericht; Study Commissioned by Federal Ministry of Transport, Building and Urban Development; WVI Prof. Dr. Wermuth Verkehrsforschung und Infrastrukturplanung GmbH: Braunschweig, Germany, 2012; pp. 91–207.
- Fattler, S.; Pichlmaier, S.; Schulz, M. Charge optimization of privately and commercially used electric vehicles and its influence on operational emissions. In Proceedings of the 41st International Conference, Groningen, The Netherlands, 10 June 2018. [Google Scholar]
- Die E-Mobility-Allee—Das Stromnetz-Reallabor zur Erforschung des Zukünftigen E-Mobility-Alltags. Available online: https://www.netze-bw.de/e-mobility-allee (accessed on 4 January 2022).
- Cross, J.D.; Hartshorn, R. My electric avenue: Integrating electric vehicles into the electrical networks. In Proceedings of the 6th Hybrid and Electric Vehicles Conference, London, UK, 2–3 November 2016. [Google Scholar] [CrossRef]
- Vennegeerts, H.; Tran, J.; Rudolph, F.; Pfeifer, P. Metastudie Forschungsüberblick Netzintegration Elektromobilität; Study Commissioned by Forum Network Technology/Network Operation in the VDE and the German Association of Energy and Water Industries; Forschungsgemeinschaft für Elektrische Anlagen und Stromwirtschaft: Mannheim, Germany, 2018; pp. 17–21. [Google Scholar]
- Fischer, D.; Harbrecht, A.; Surmann, A.; McKenna, R. Electric vehicles’ impact on residential electric local profiles—A stochastic modelling approach considering socio-economic, behavioural and spatial factors. Appl. Energy 2019, 233–234, 644–658. [Google Scholar] [CrossRef]
- Van der Kam, M.; Peters, A.; Van Sark, W.; Alkemade, F. Agent-based modelling of charging behaviour of electric vehicle drivers. J. Artif. Soc. Soc. Simul. 2019, 22, 1–26. [Google Scholar] [CrossRef]
- Probst, A.; Braun, M.; Tenbohlen, S. Erstellung und Simulation probabilistischer Lastmodelle von Haushalten und Elektrofahrzeugen zur Spannungsbandanalyse. In Proceedings of the Tagungsband: Internationaler ETG-Kongress, Würzburg, Germany, 8–9 November 2011; pp. 1–5. [Google Scholar]
- Shun, T.; Kunyu, L.; Xiangning, X.; Jianfeng, W.; Yang, Y.; Jian, Z. Charging demand for EV based on stochastic analysis of trip chain. IET Gener. Transm. Distrib. 2016, 10, 2689–2698. [Google Scholar] [CrossRef]
- Darabi, Z.; Ferdowsi, M. Extracting probability distribution functions applicable for PHEVs charging load profile. In Proceedings of the PES T&D 2012, Orlando, FL, USA, 7–10 May 2012; pp. 1–6. [Google Scholar] [CrossRef]
- Verzijlbergh, R.A.; Lukszo, Z.; Veldman, E.; Slootweg, J.G.; Ilic, M. Deriving electric vehicle charge profiles from driving statistics. In Proceedings of the 2011 IEEE Power and Energy Society General Meeting, Detroit, MI, USA, 24–28 July 2011; pp. 1–6. [Google Scholar] [CrossRef]
- Wieland, T.; Reiter, M.; Schamutzer, E.; Fickert, L.; Fabian, J.; Schmied, R. Probabilistische Methode zur Modellierung des Ladeverhaltens von Elektroautos anhand gemessener Daten elektrischer Ladestationen. Elektrotech. Informationstech. 2015, 132, 160–167. [Google Scholar] [CrossRef]
- Zentrales Datenmonitoring des Förderprogramms Elektromobilität vor Ort. Available online: www.now-gmbh.de/aktuelles/pressemitteilungen/zentrales-datenmonitoring-legt-ergebnisse-vor/ (accessed on 4 January 2022).
- Krug, S.; Krey, O.; Ohm, B.; Weider, M.; Ziem-Milojevic, S.; Braune, O. Elektromobilität in der Praxis—Zweiter Ergebnisbericht des Zentralen Datenmonitorings des Förderprogramms Elektromobilität vor Ort; Study Commissioned by Federal Ministry of Transport and Digital Infrastructure; NOW GmbH—Nationale Organisation Wasserstoff- und Brennstoffzellentechnologie: Berlin, Germany, 2020. [Google Scholar]
- Kandler, C. Modellierung von Zeitnutzungs-, Mobilitäts- und Energieprofilen zur Bestimmung der Potentiale von Energiemanagementsystemen in Haushalten—Time-Use, Mobility and Energy Modeling as Part of an Overall Framework for Evaluating the Potential of Home Energy Management Systems for Households. Ph.D. Thesis, Department of Electrical and Computer Engineering at Technical University of Munich, Munich, Germany, 15 May 2017. [Google Scholar]
- Laufende Stadtbeobachtung—Raumabgrenzungen—Stadt- und Gemeindetypen in Deutschland. Available online: http://www.bbsr.bund.de/BBSR/DE/Raumbeobachtung/Raumabgrenzungen/StadtGemeindetyp/StadtGemeindetyp_node.html (accessed on 14 November 2021).
- Auf der Maur, A.; Brüggeshemke, N.; Kutschera, M. Lade-Report—Entwicklung der Öffentlich Zugänglichen Ladeinfrastruktur für die Elektromobilität sowie Vergleich der Ladetarife in Deutschland; (Study Commissioned by EnBW Energie Baden-Württemberg AG); Prognos AG: Basel, Switzerland, 2020. [Google Scholar]
- Fischer, M.; Hardt, C.; Michalk, W.; Bogenberger, K. Charging or idling: Method for quantifying the charging and the idle time of public charging stations. In Proceedings of the TRB 101st Annual Meeting, Washington, DC, USA, 9–13 January 2022. [Google Scholar]
- Beschluss der Bundeskanzlerin und der Regierungschefinnen und Regierungschefs der Länder vom 22. März 2020. Available online: www.bundesregierung.de/breg-de/themen/coronavirus/besprechung-der-bundeskanzlerin-mit-den-regierungschefinnen-und-regierungschefs-der-laender-vom-22-03-2020-1733248 (accessed on 16 June 2022).
- Gebhard, J. Evaluation of the Grid Load of an “Electric Avenue” in Munich Distribution Grids—Analyse der Netzbelastung bei Integration einer “Electric Avenue” in das Münchner Verteilnetz. Bachelor’s Thesis, Technical University of Munich, Munich, Germany, 2020. [Google Scholar]
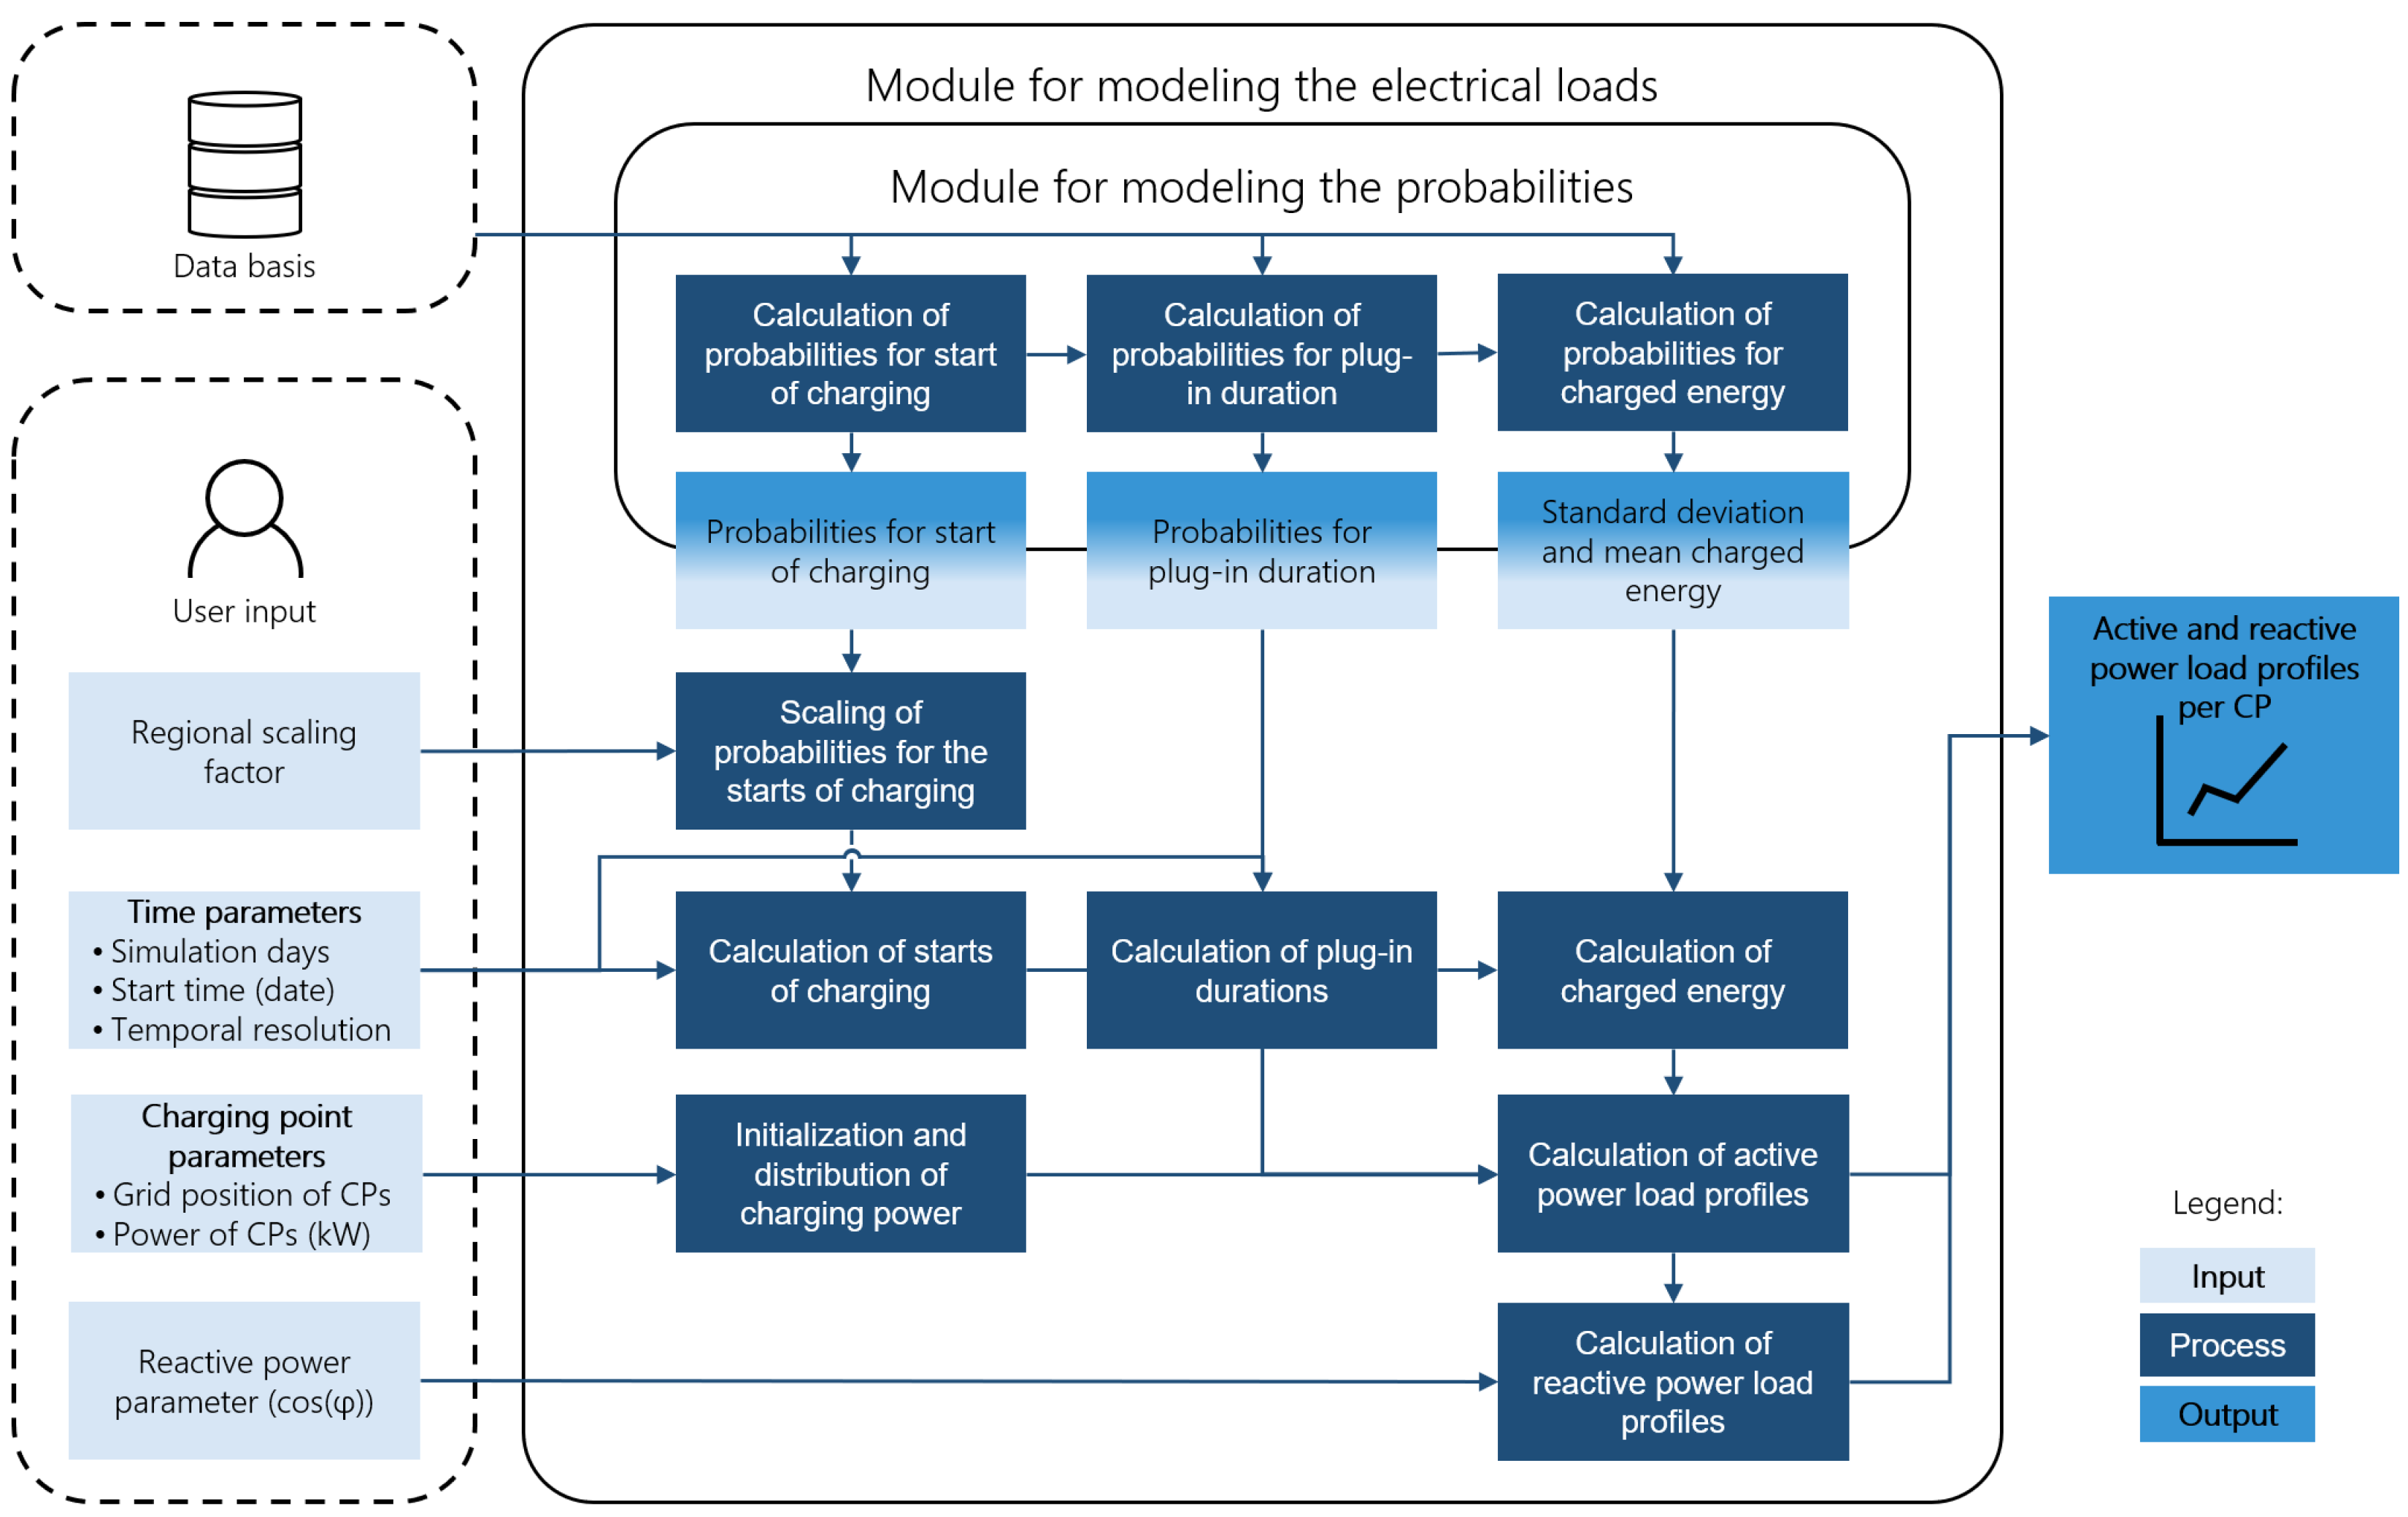

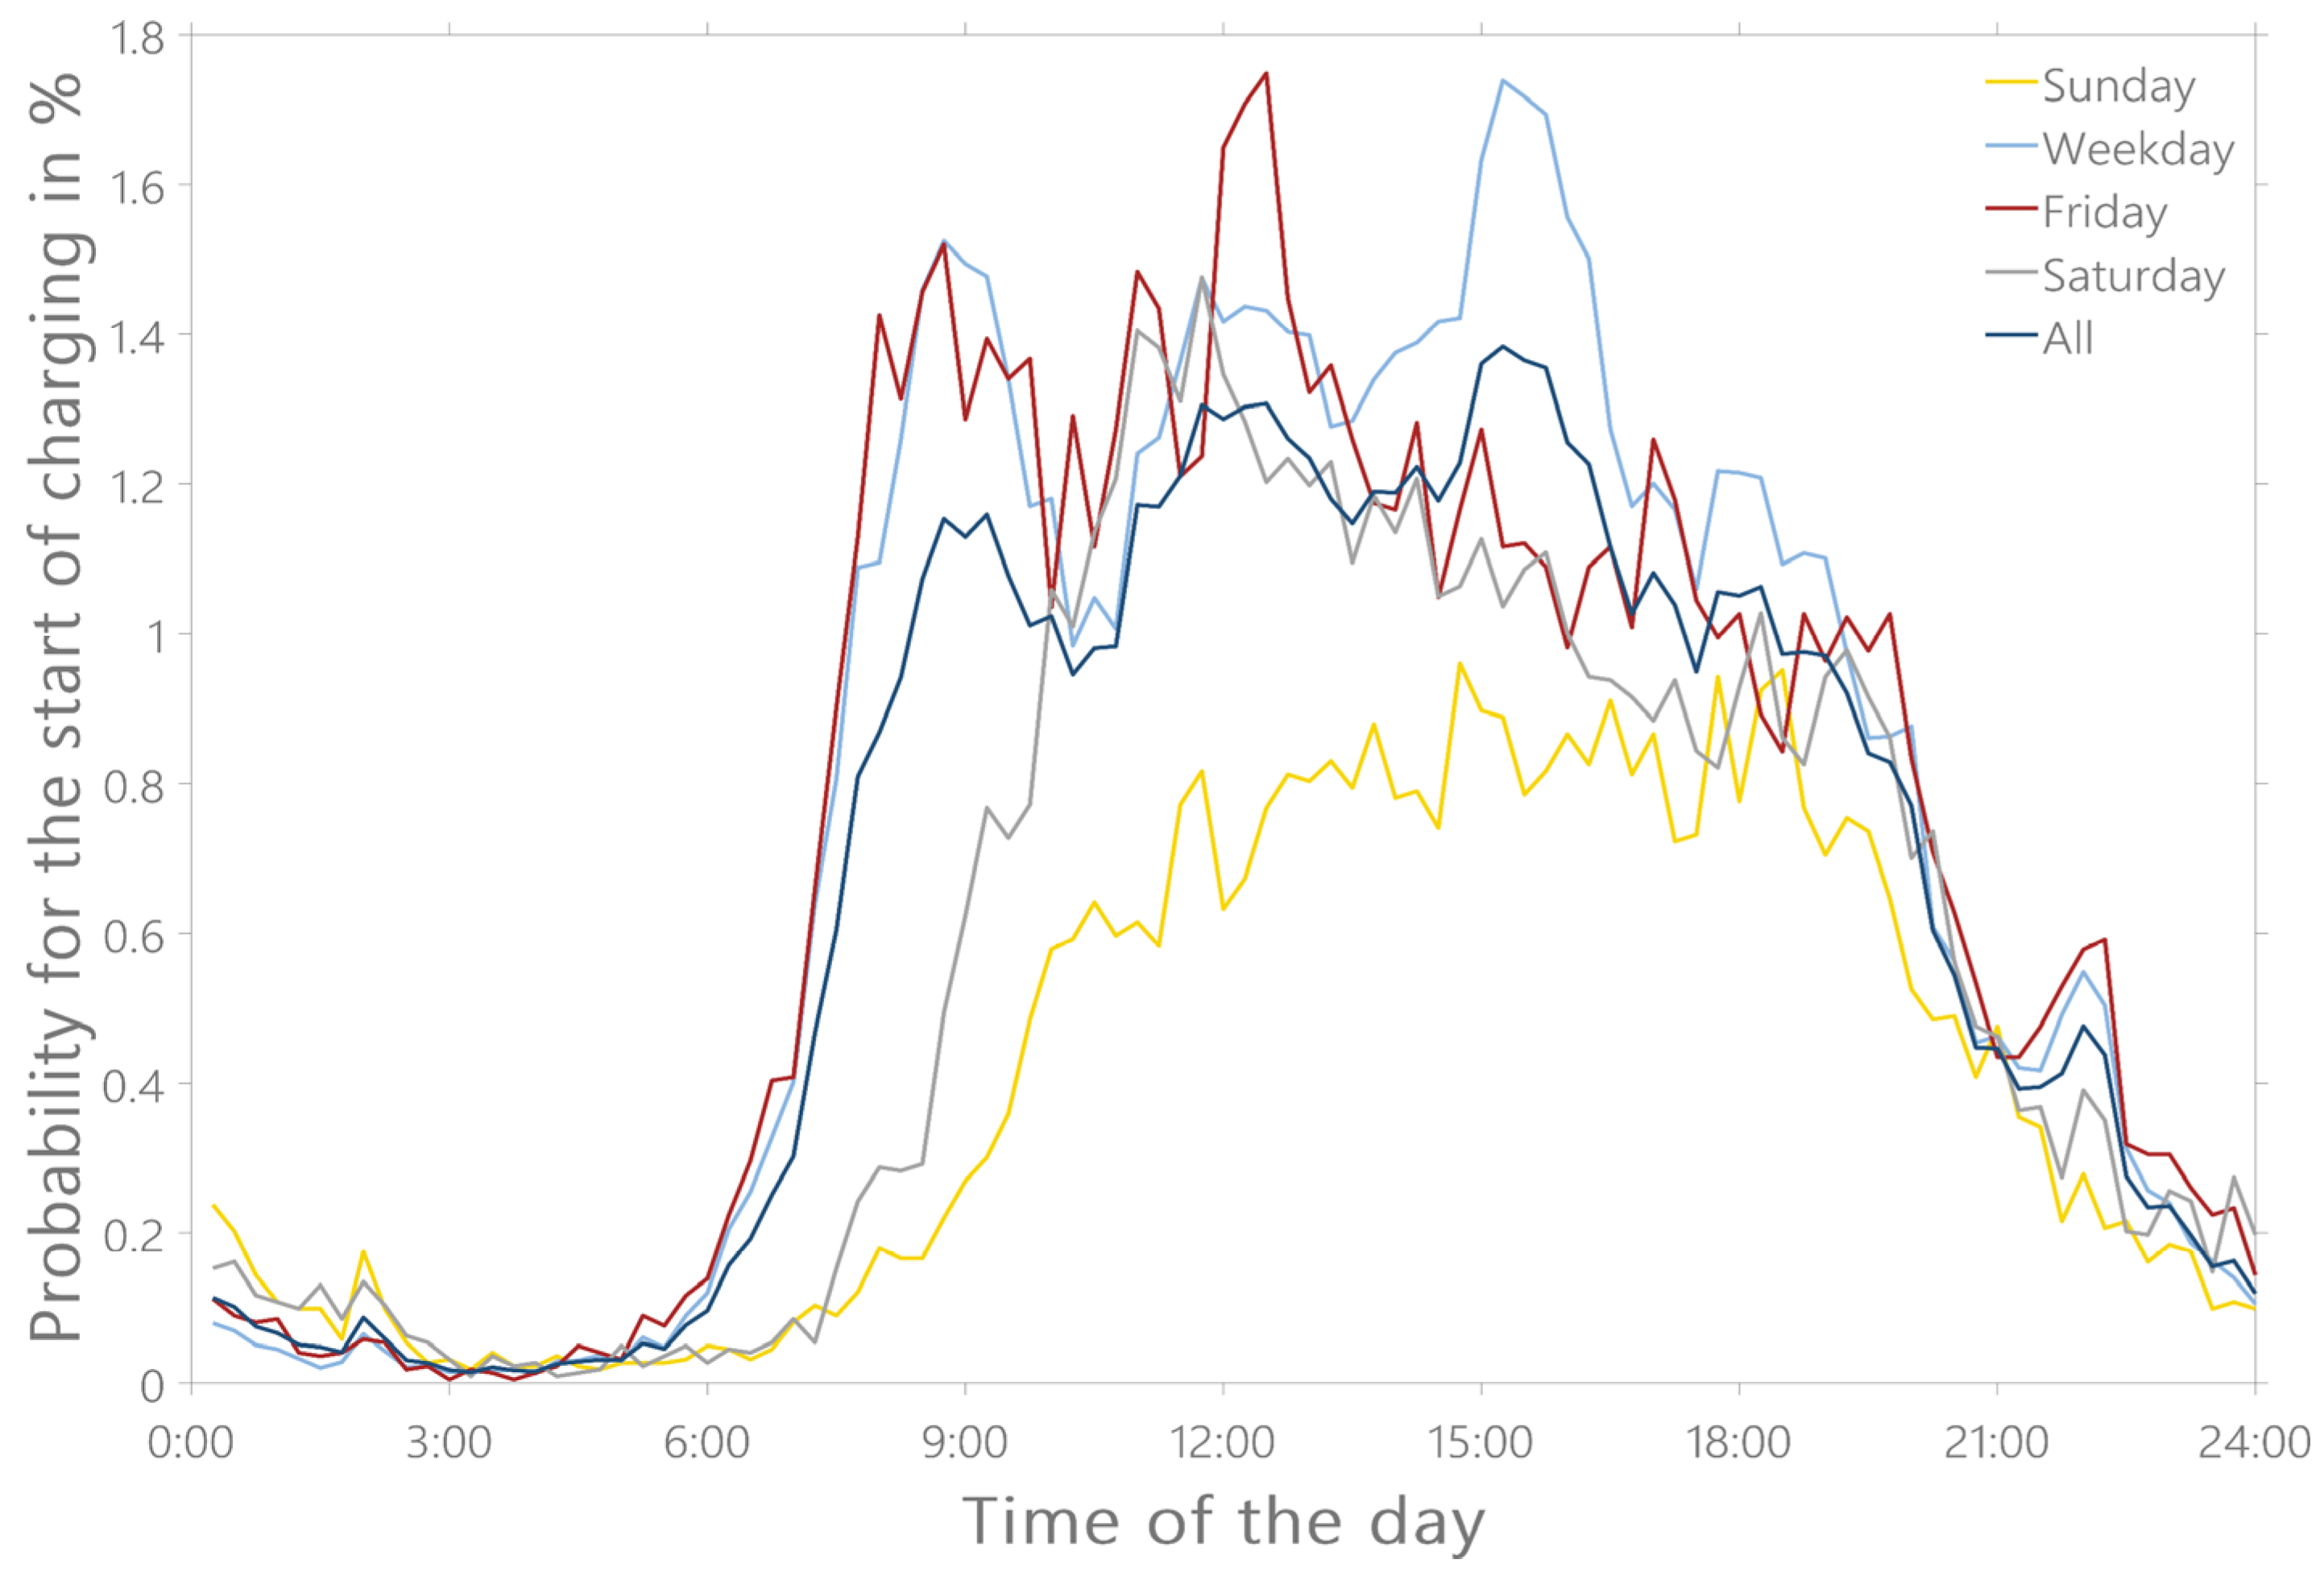
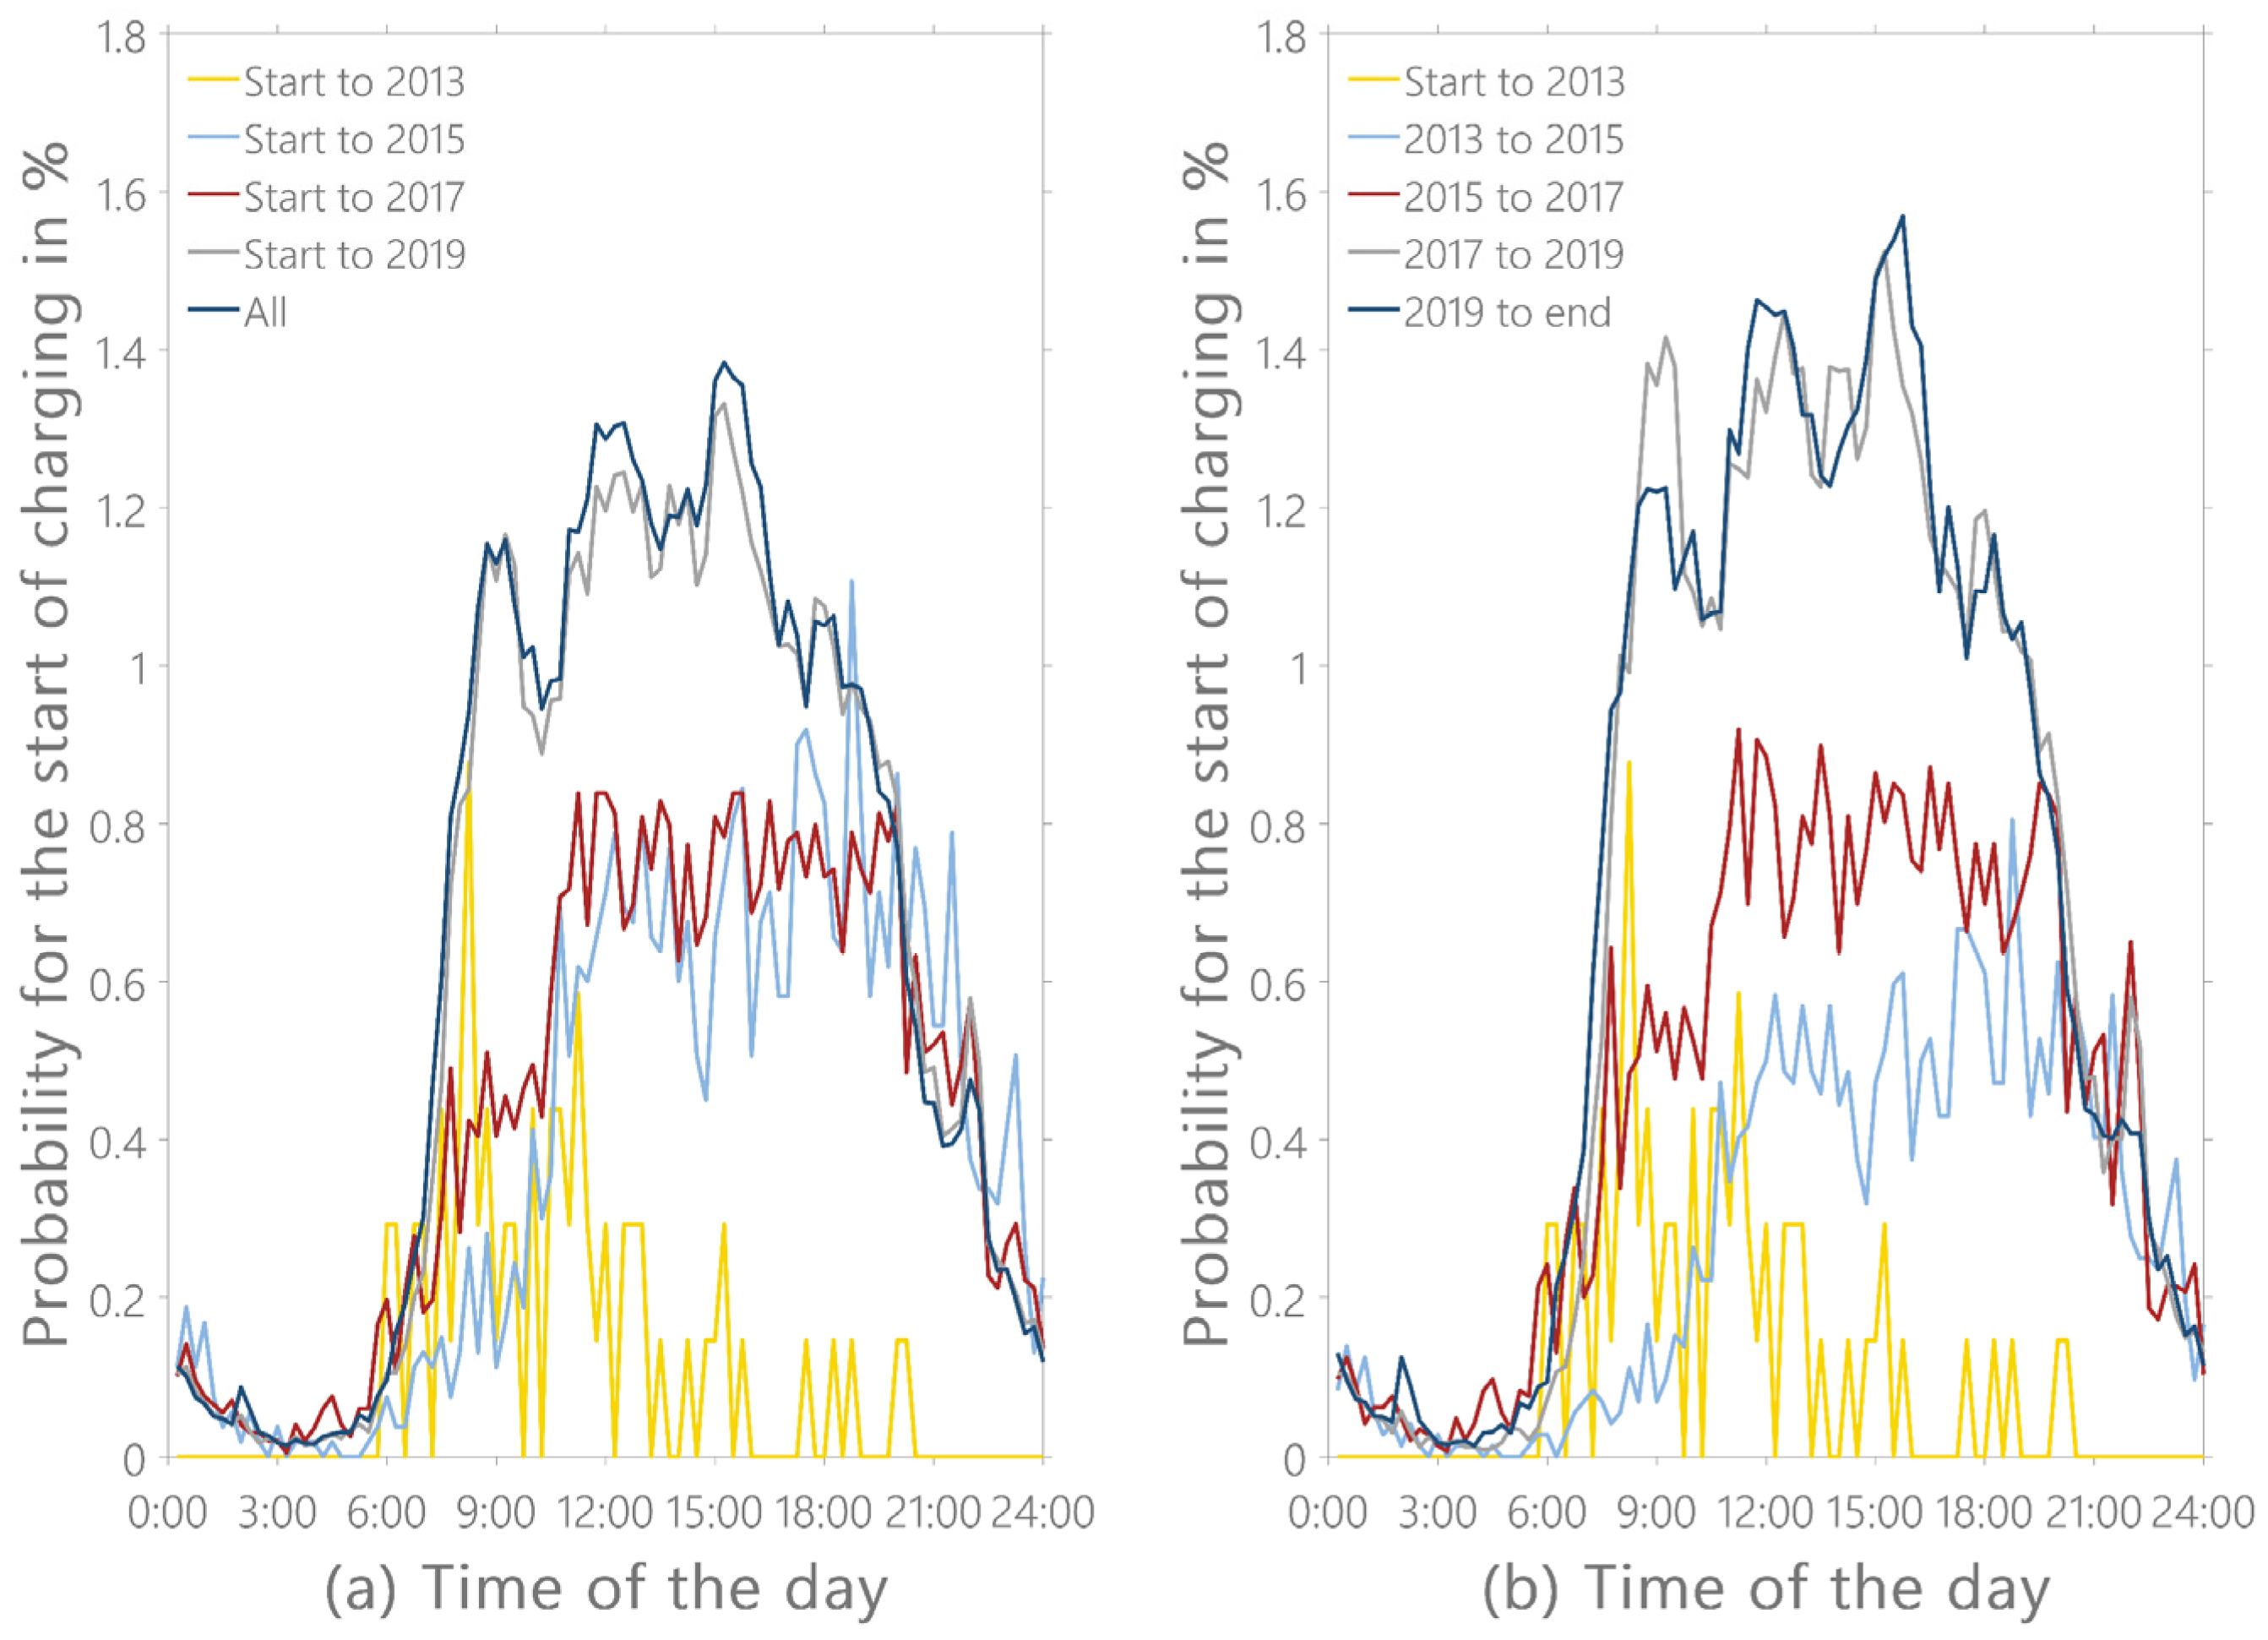
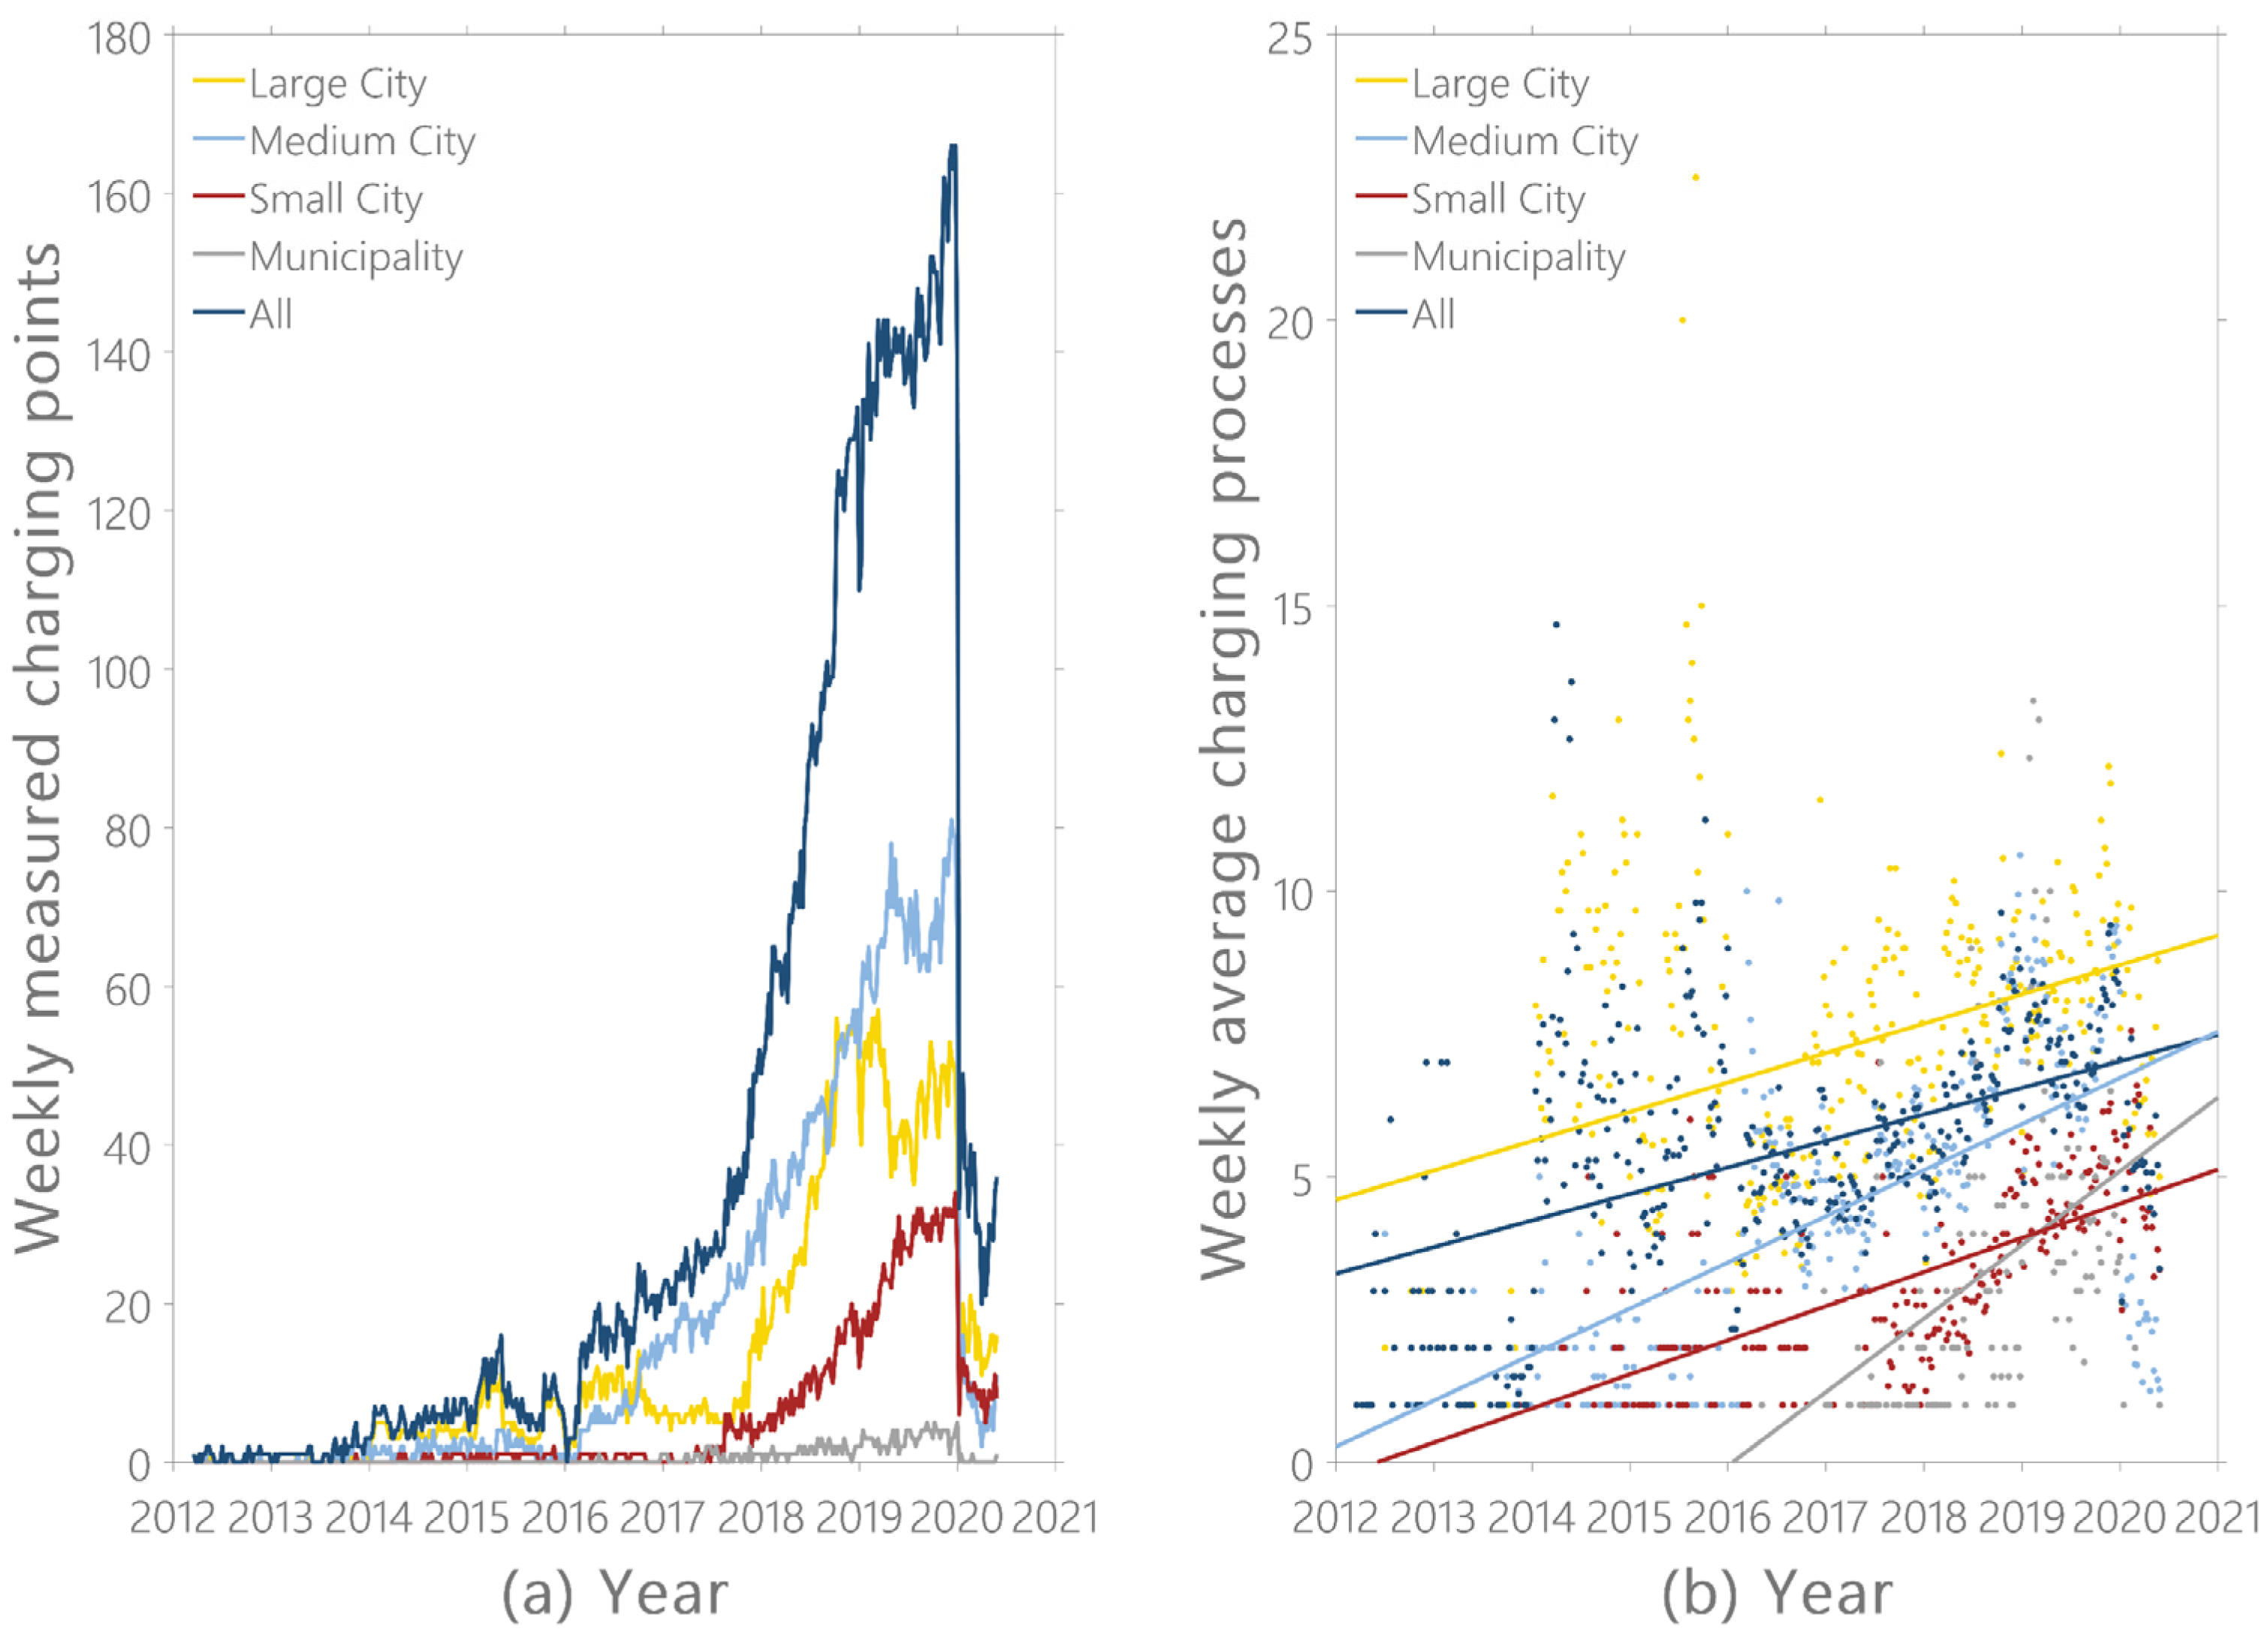
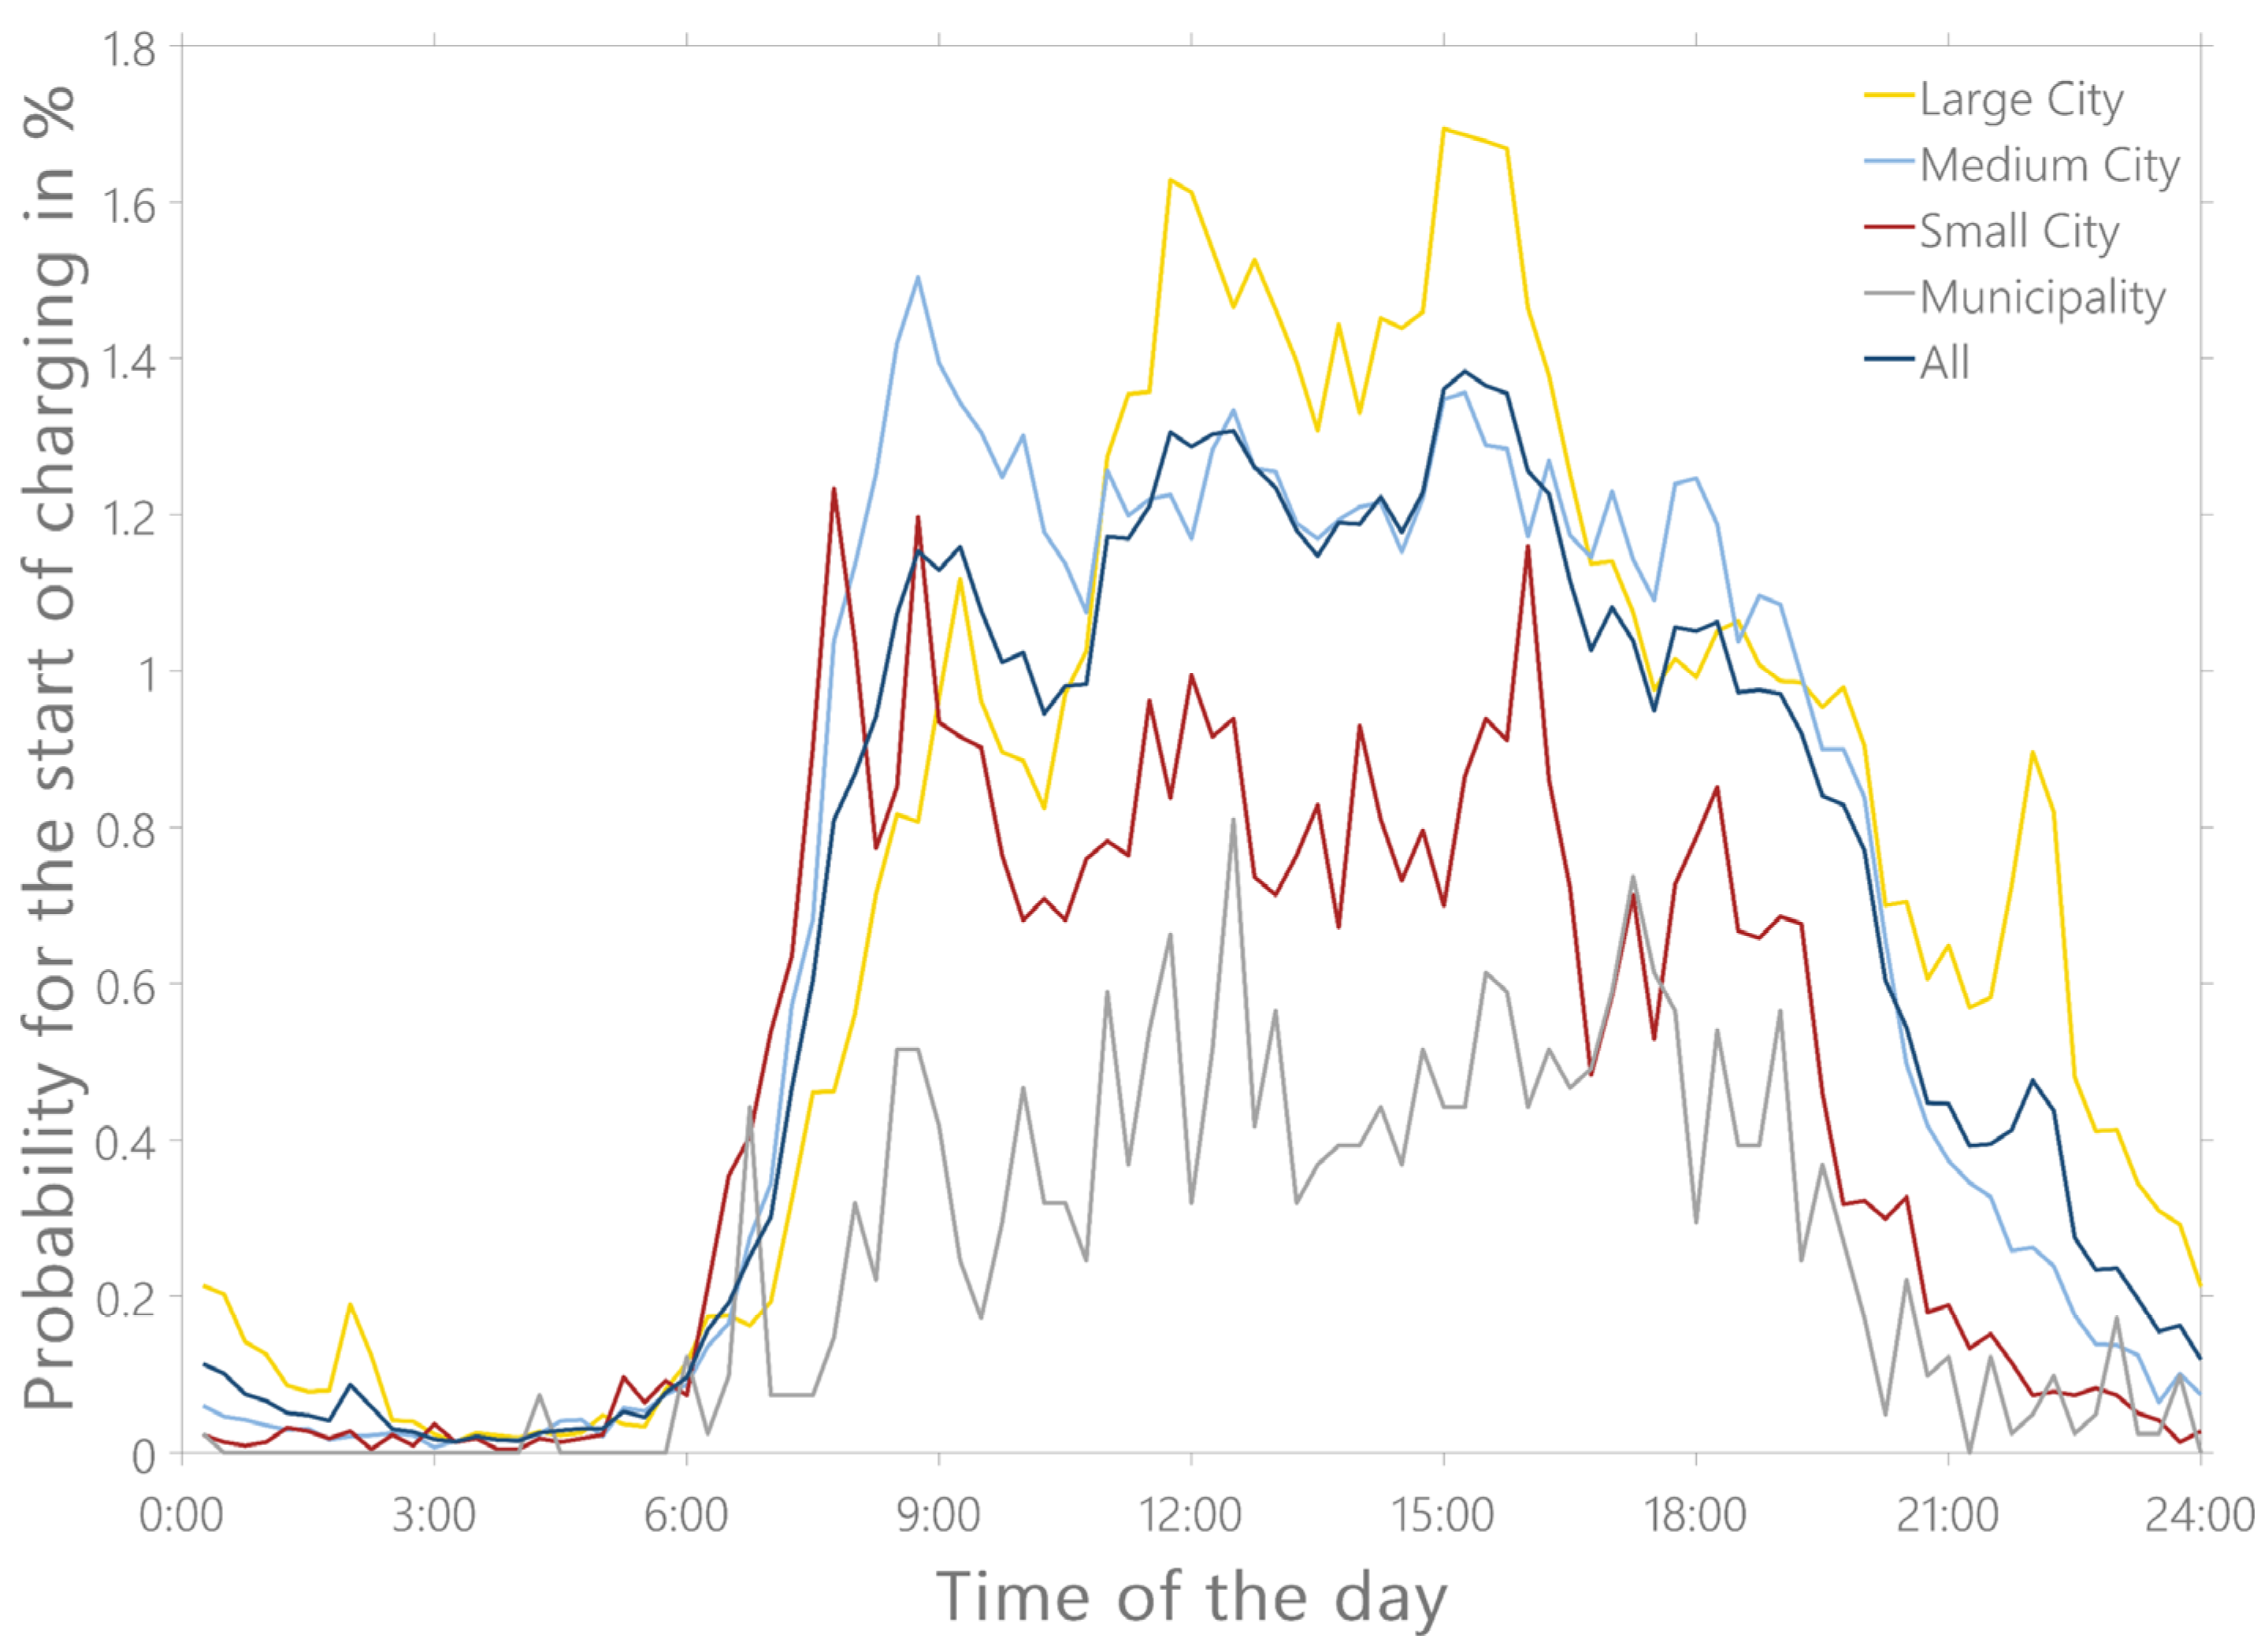

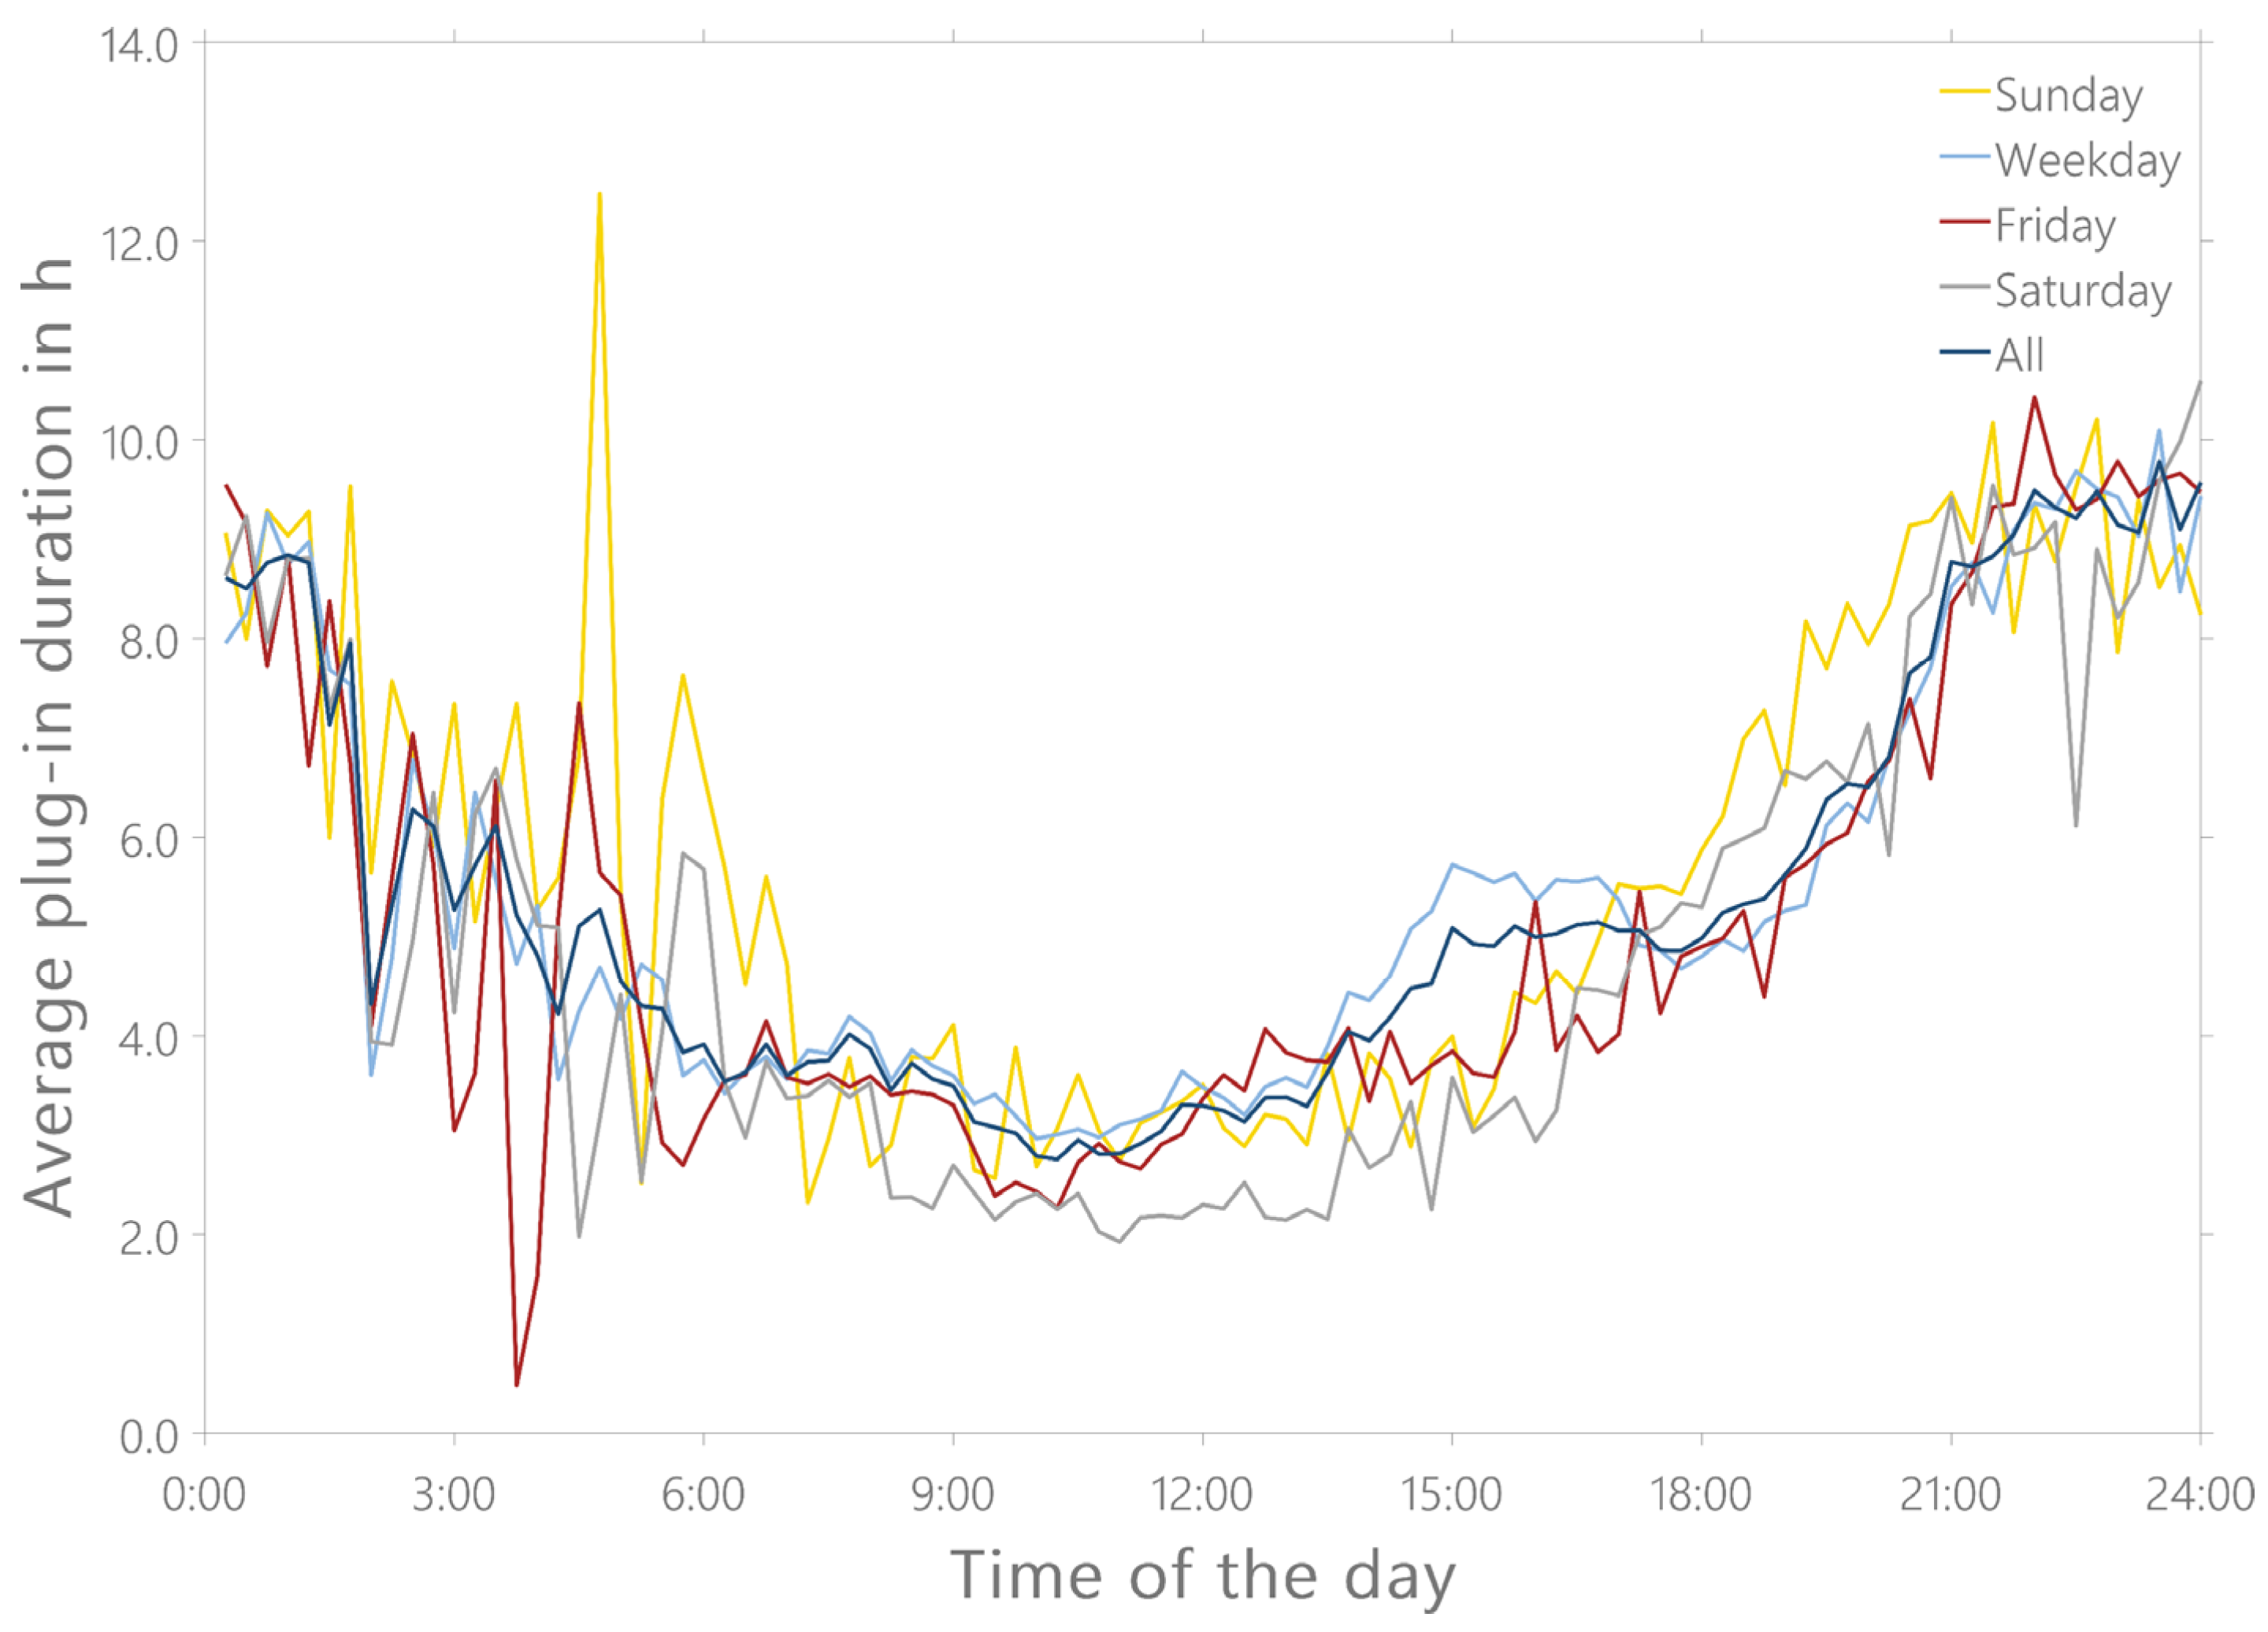
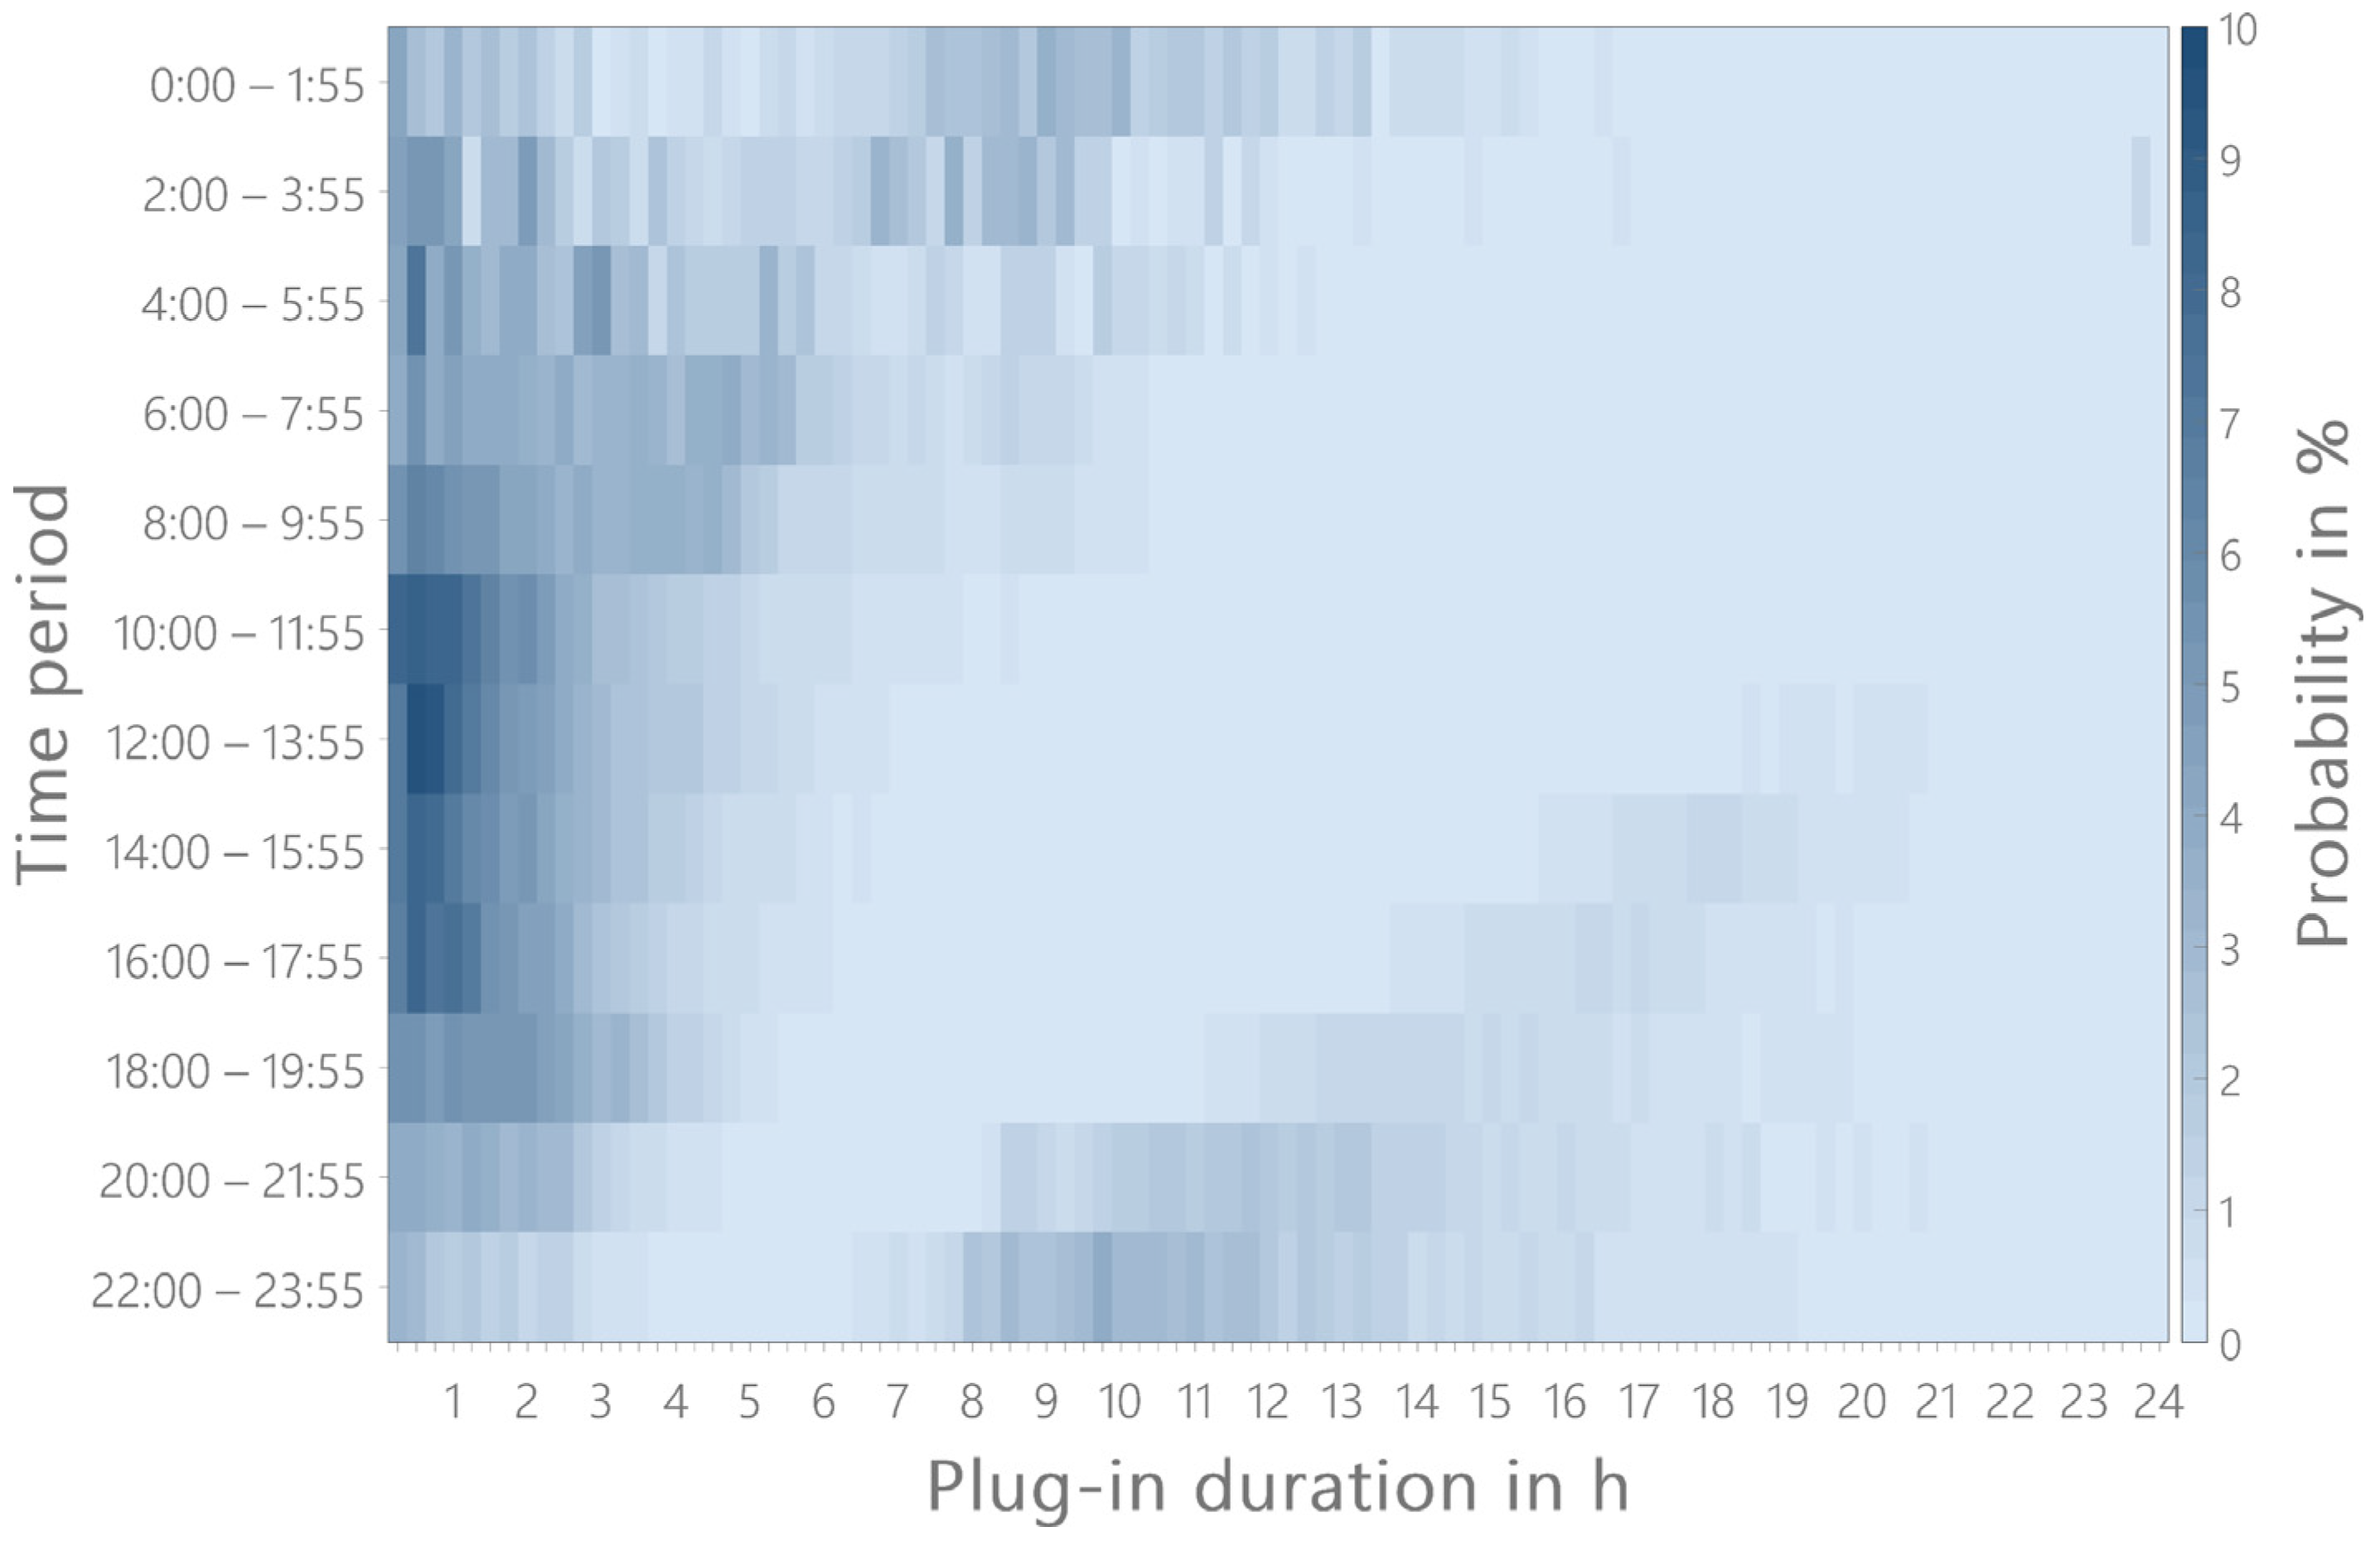
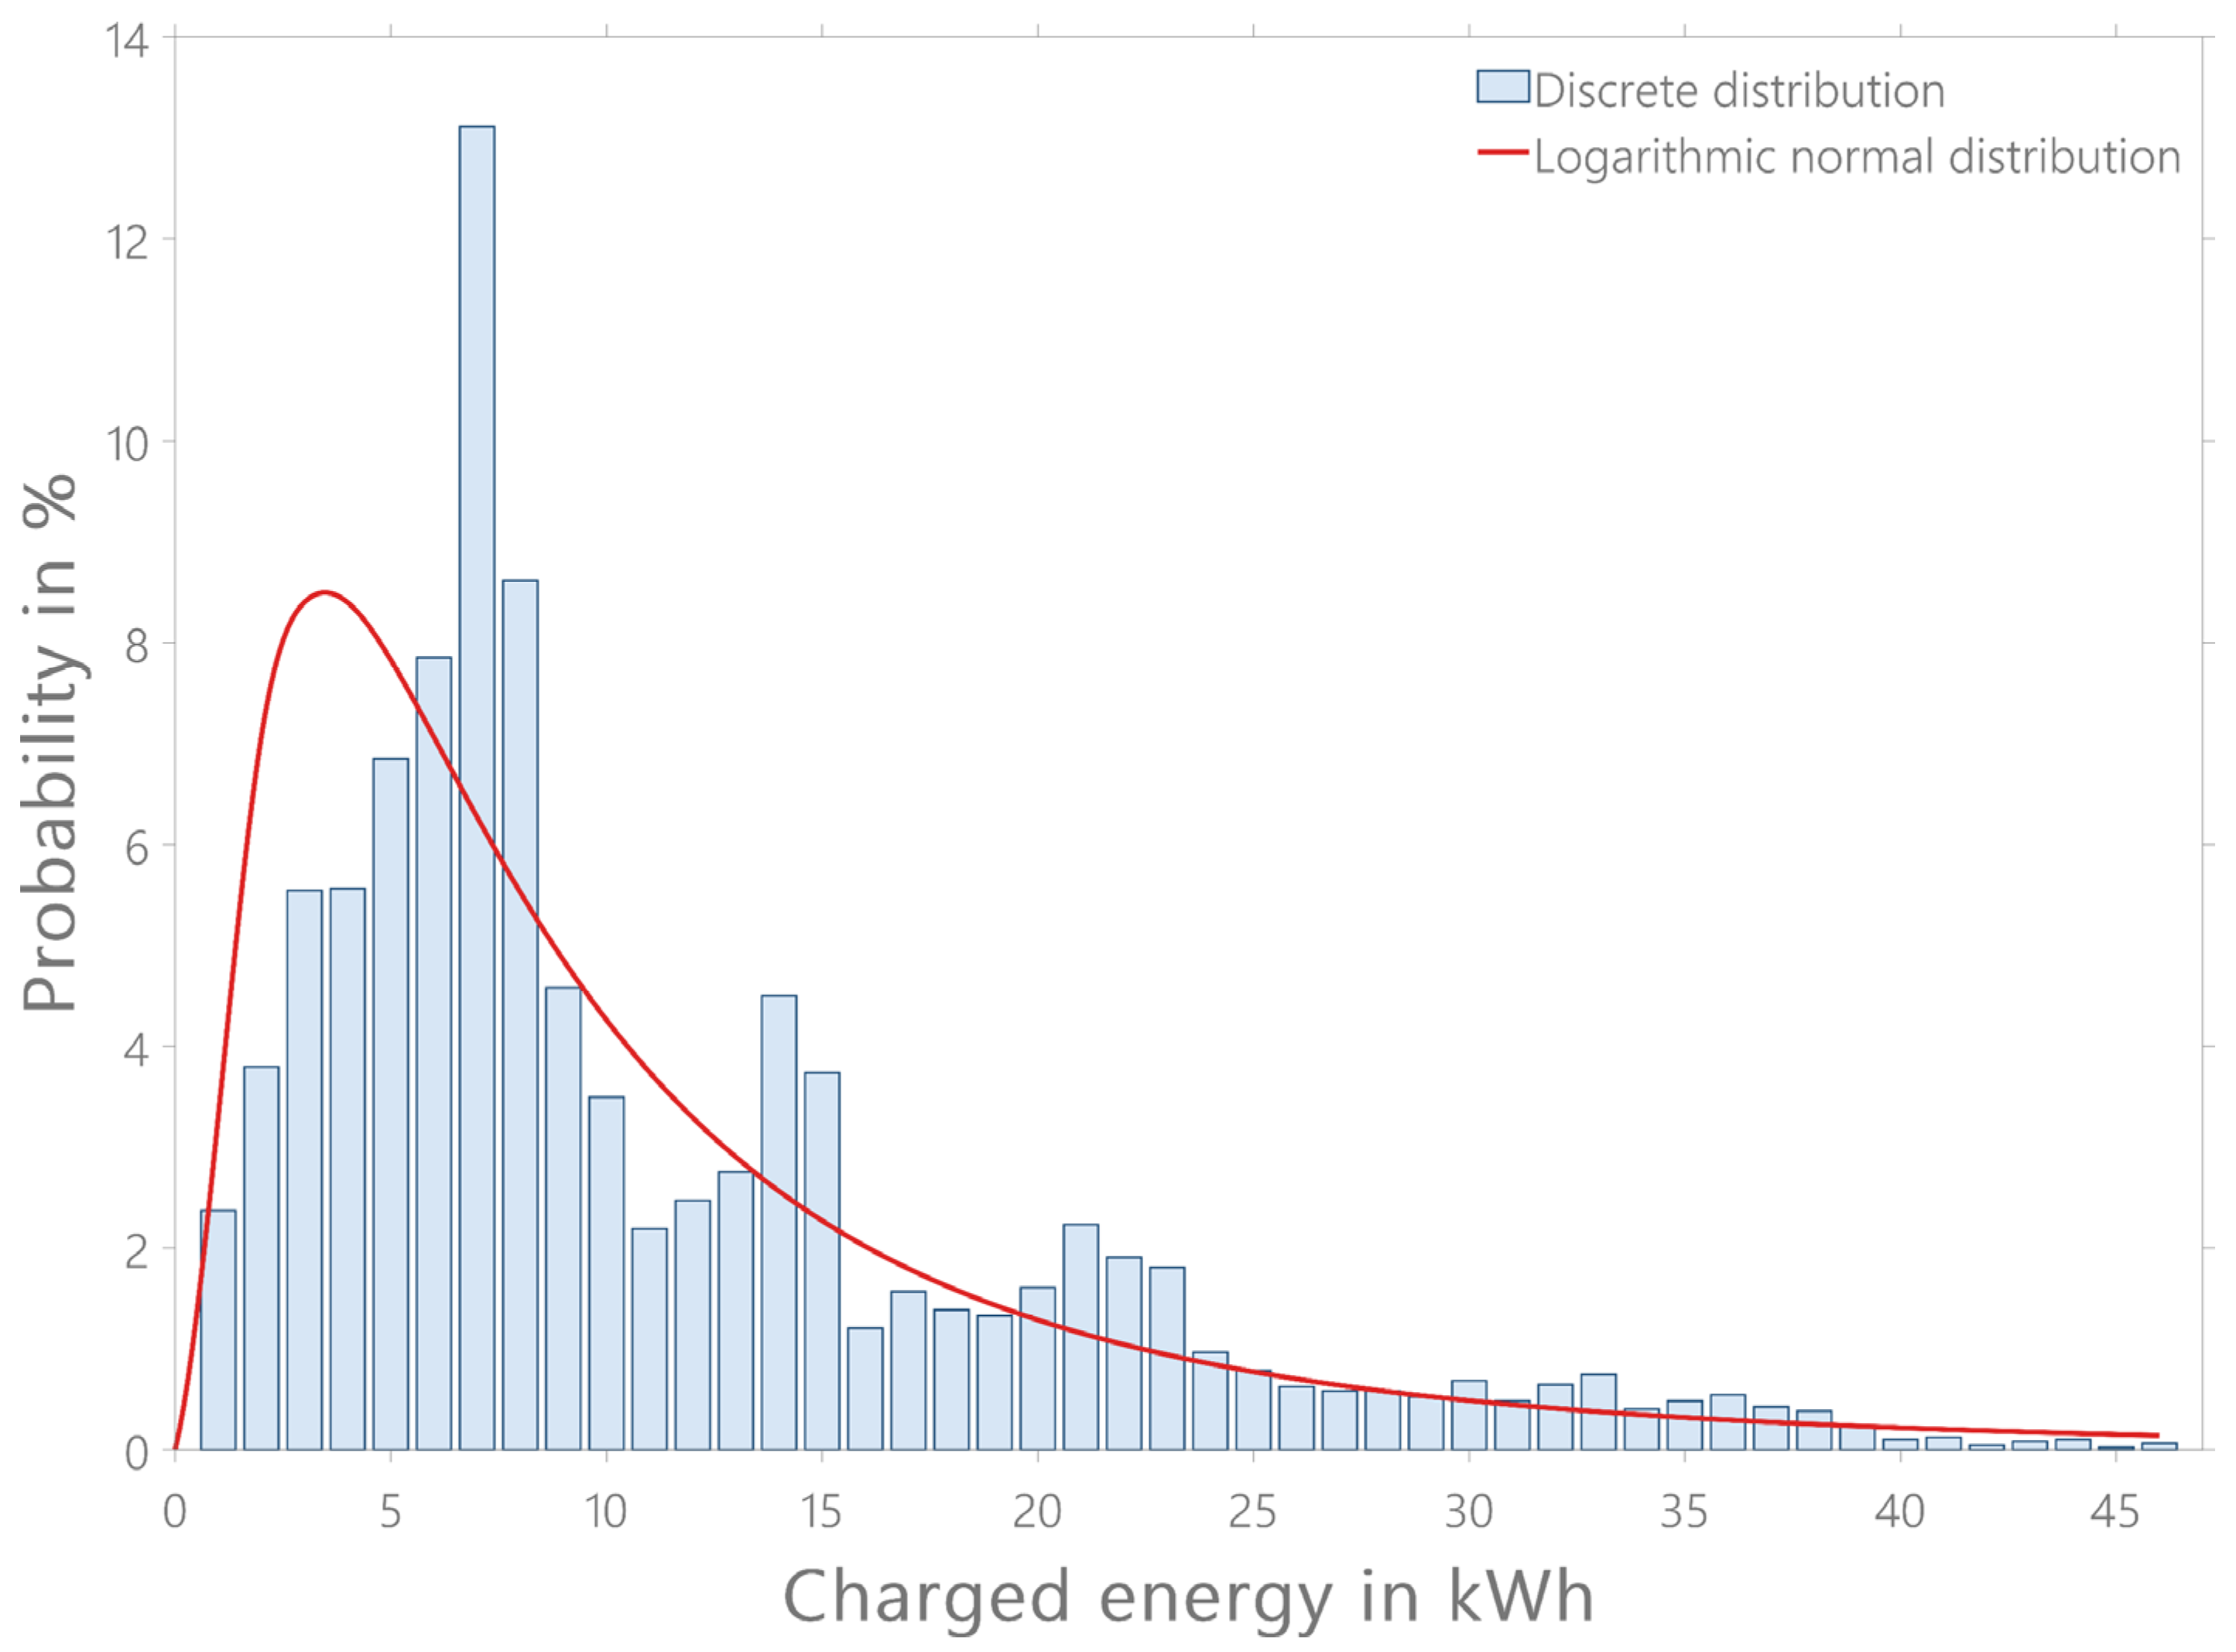
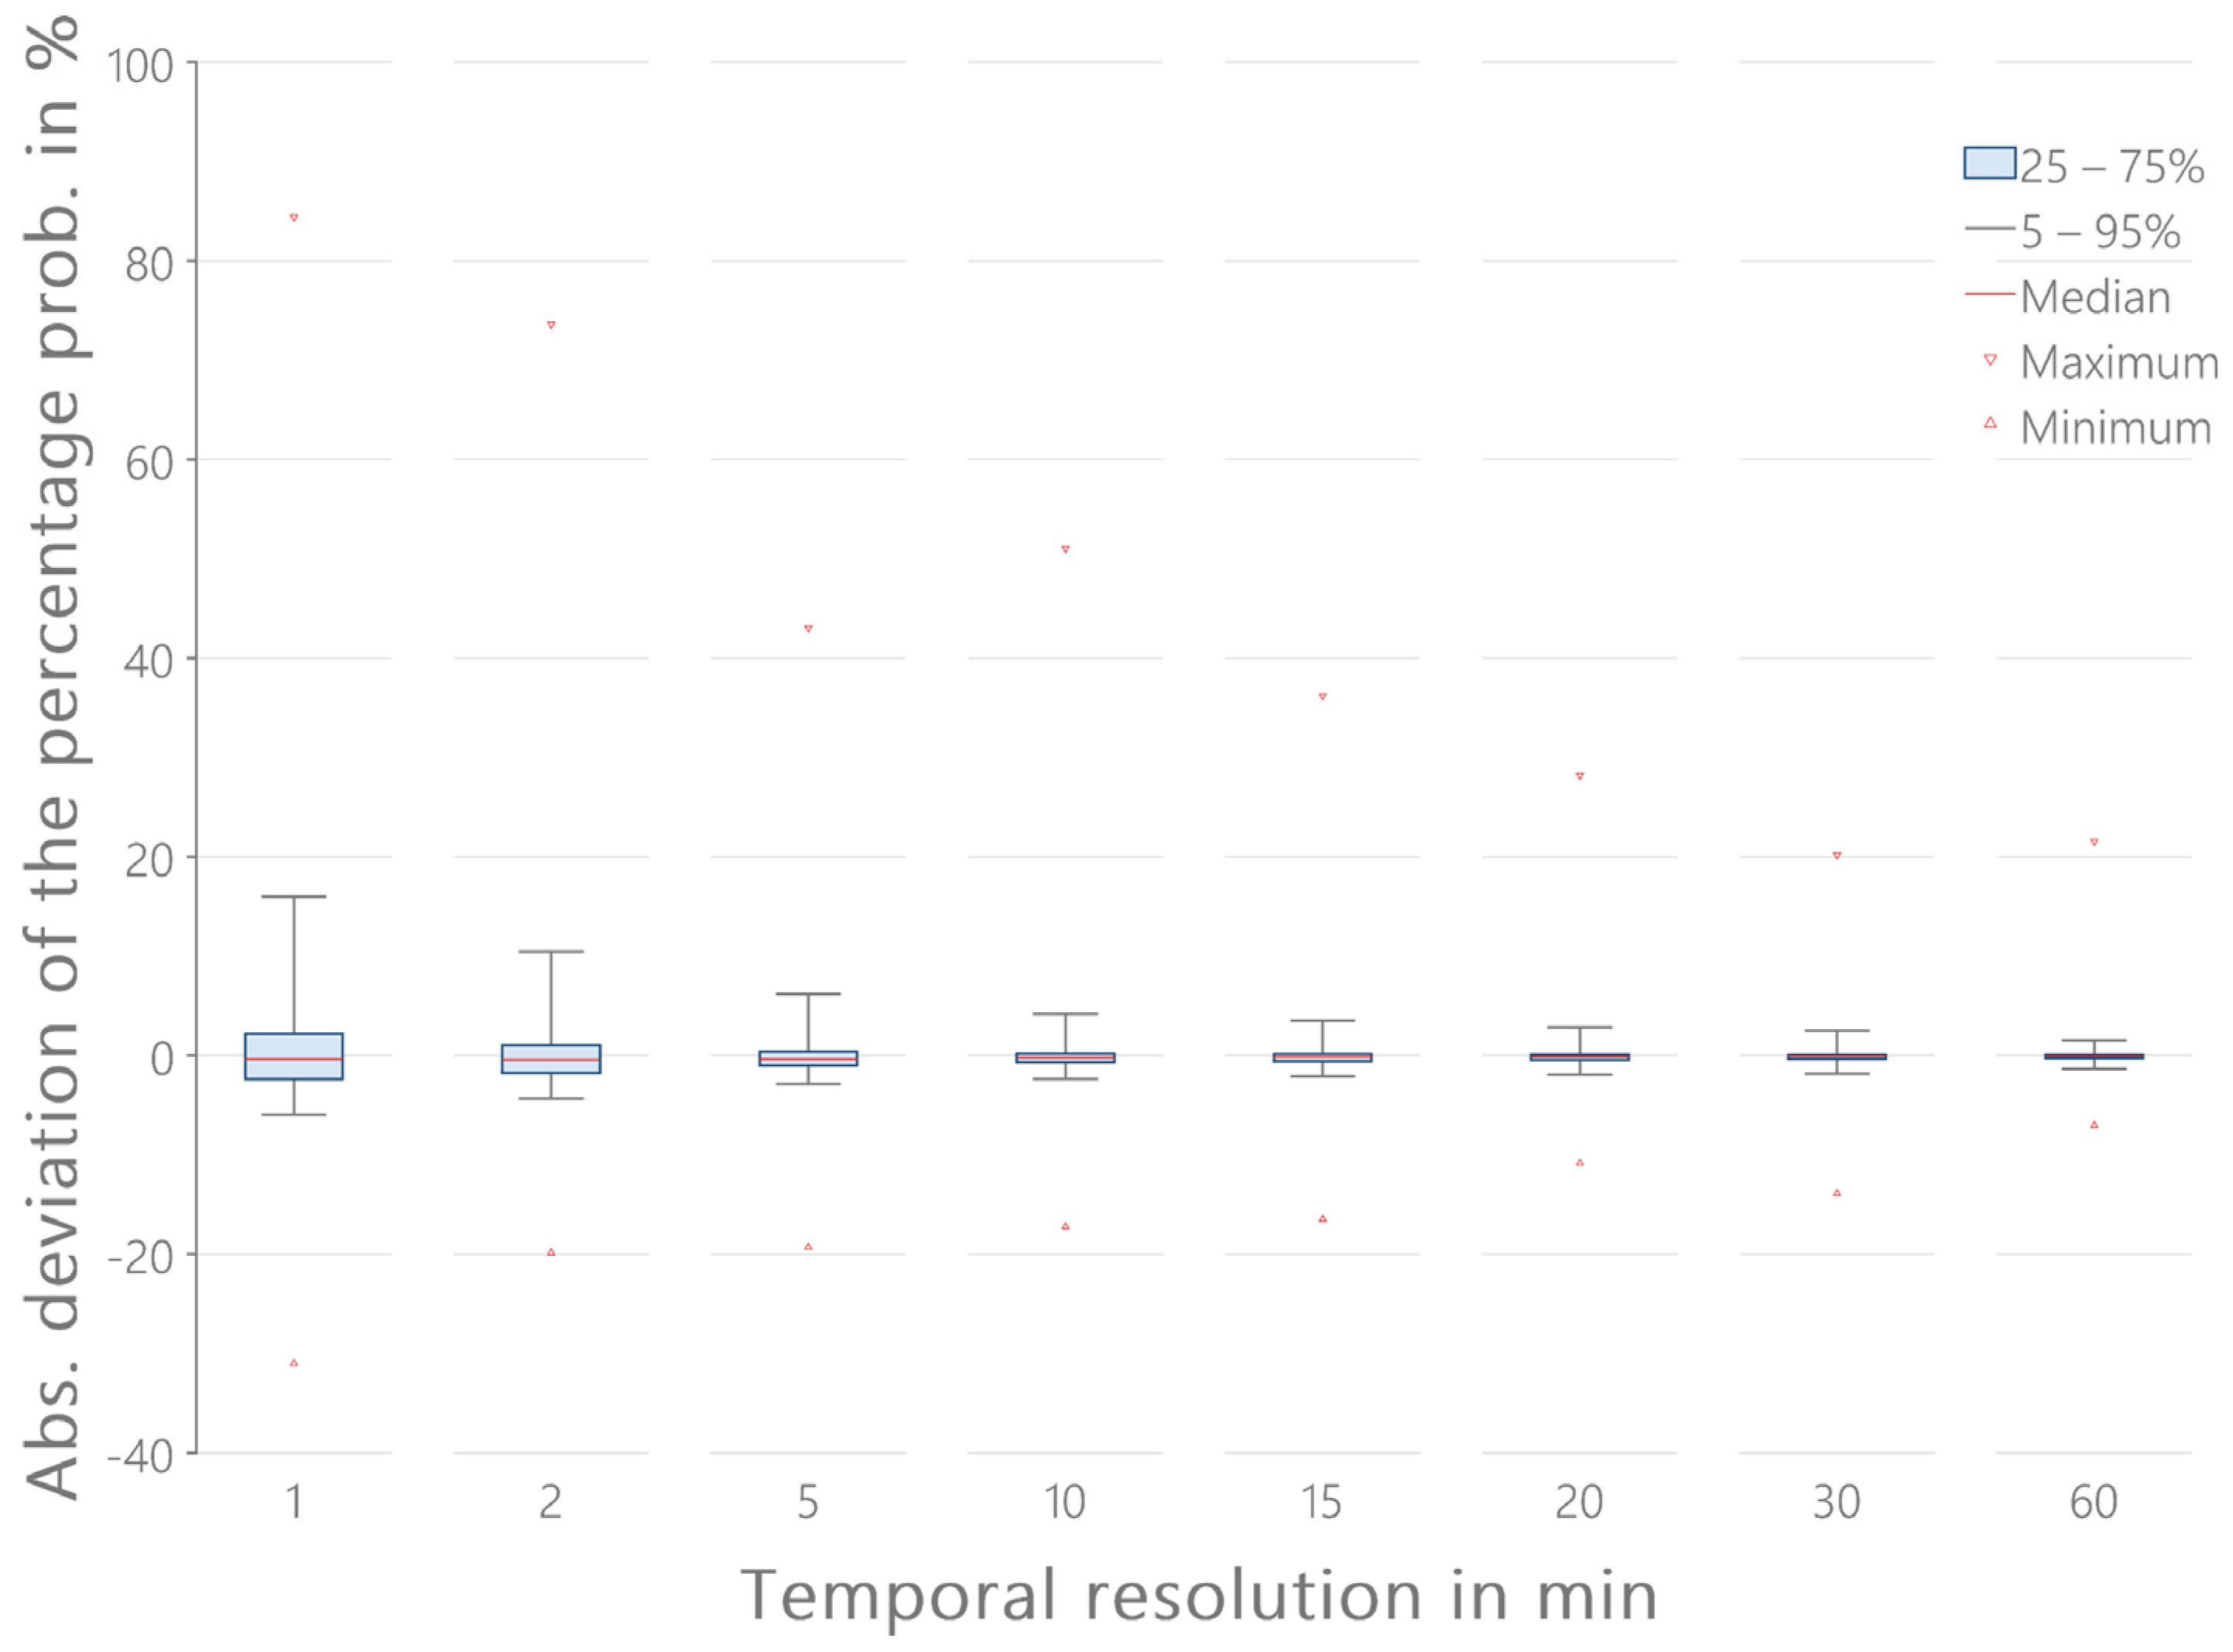
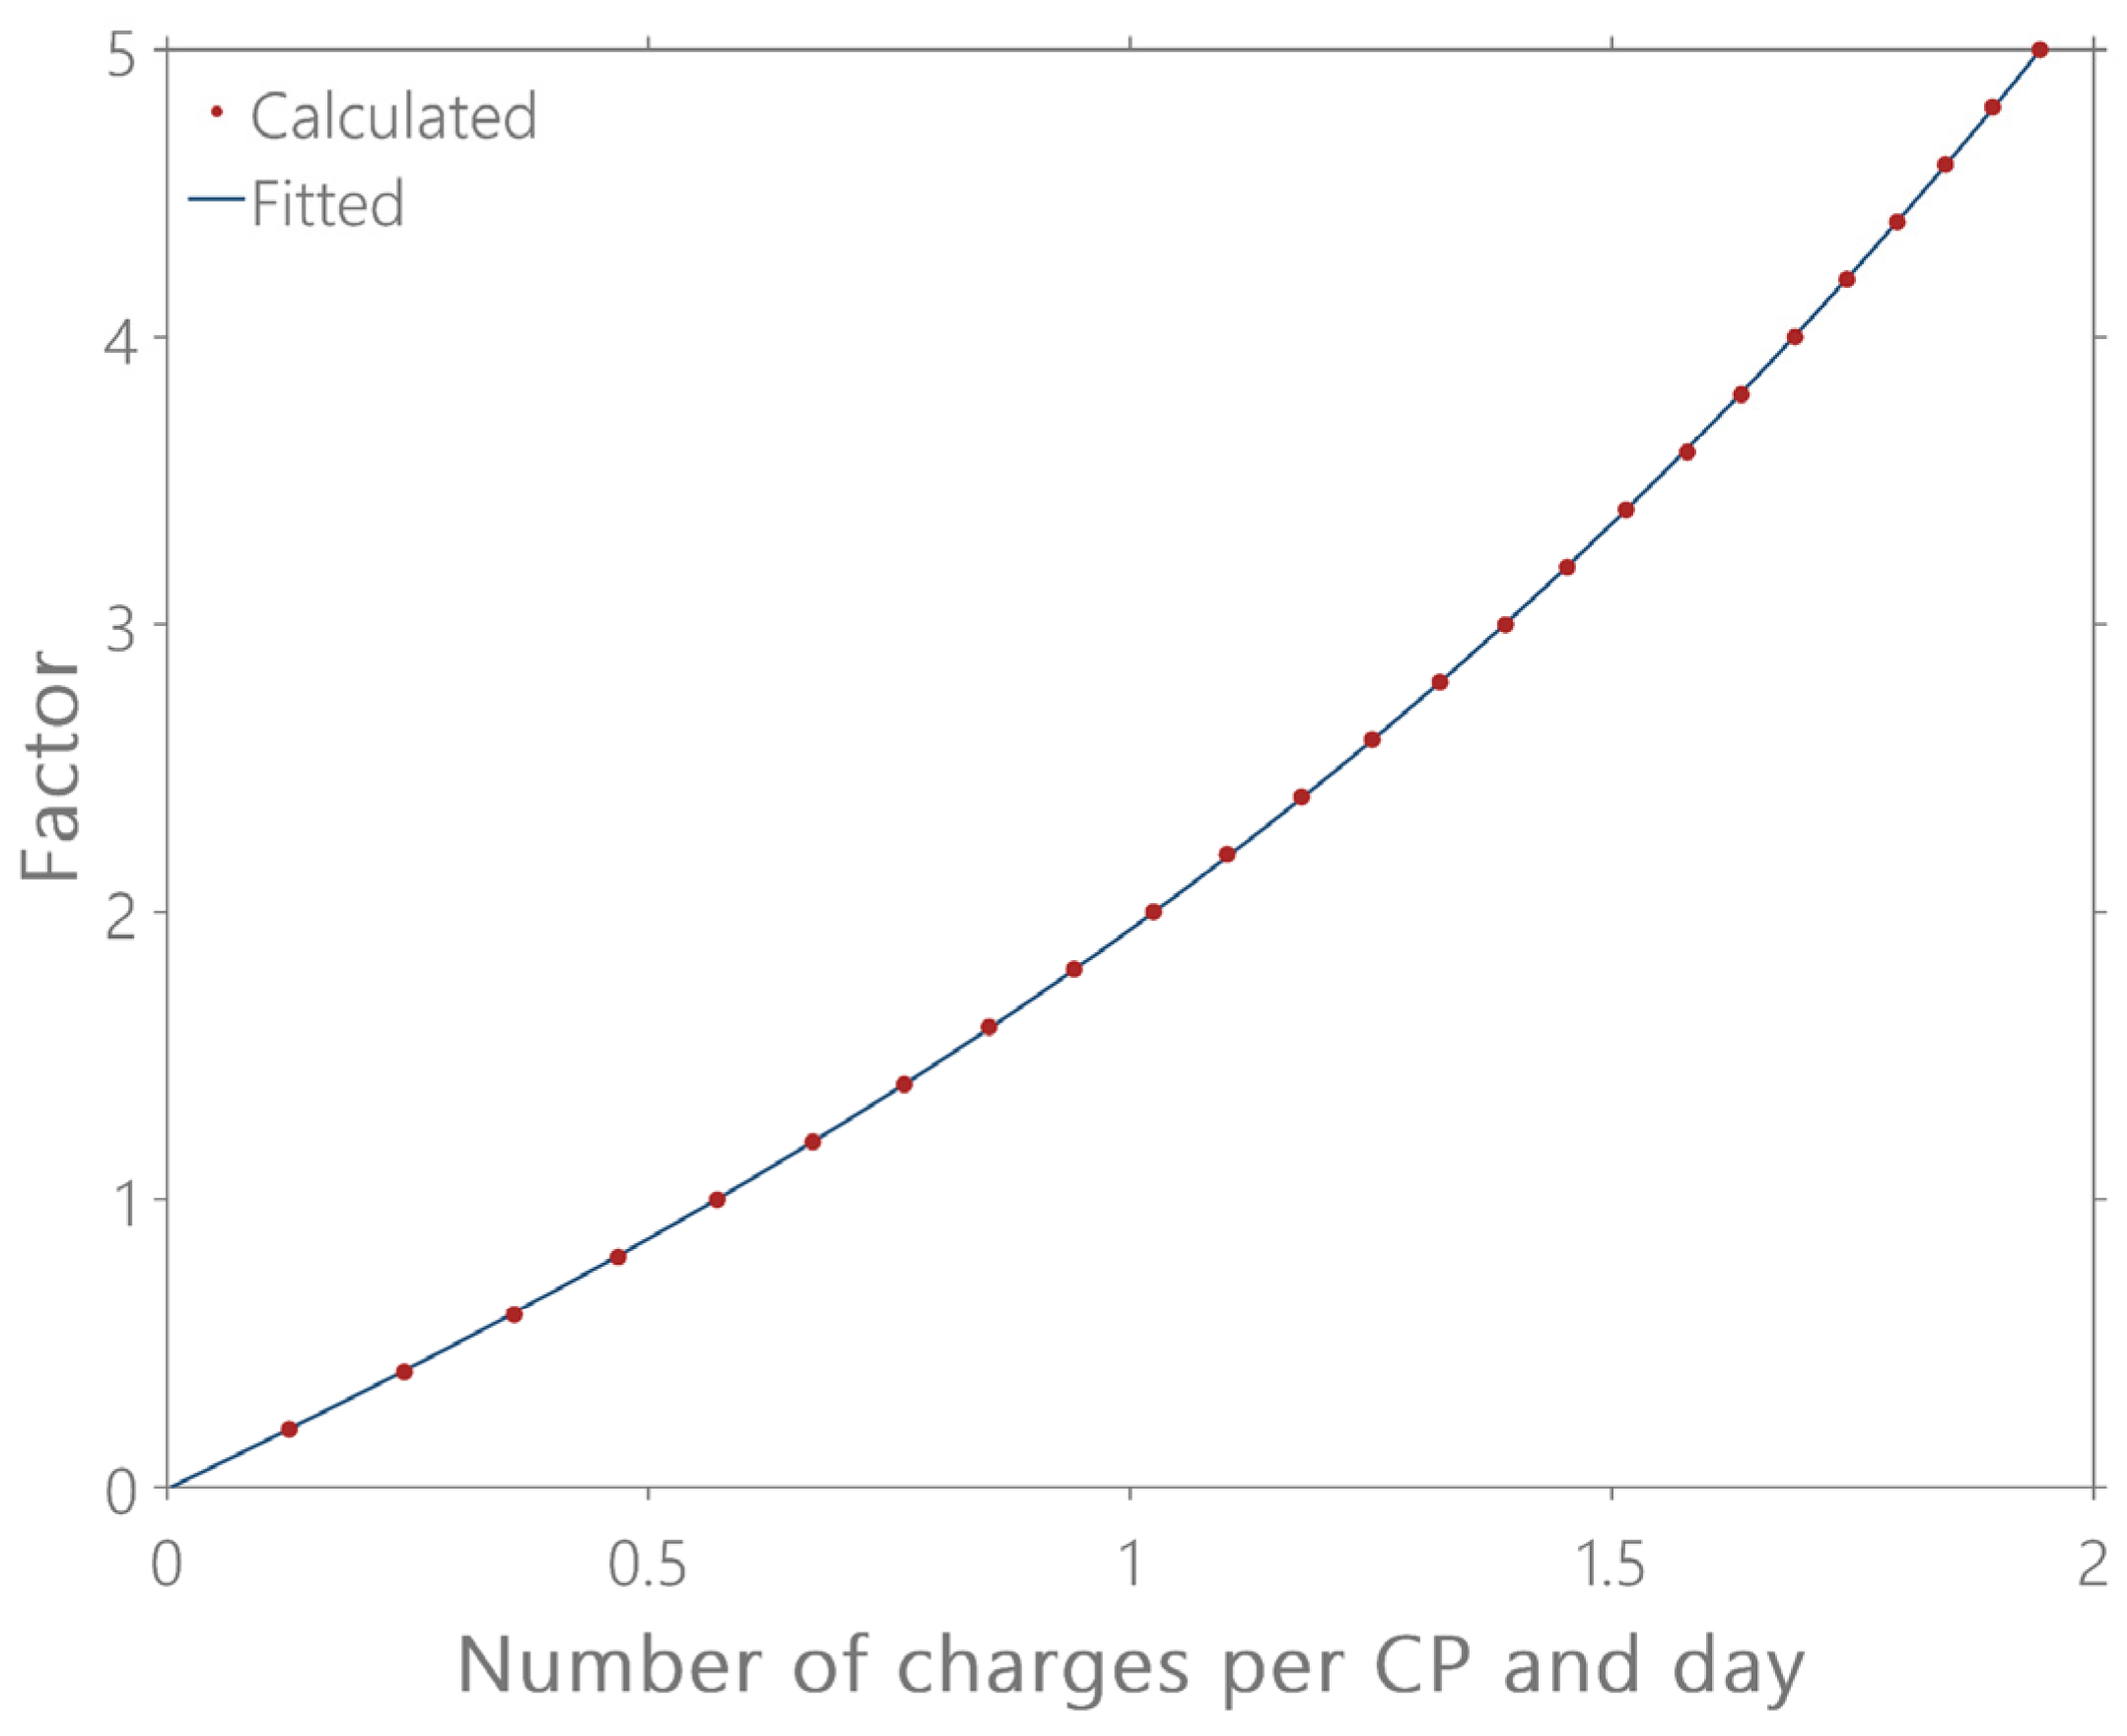
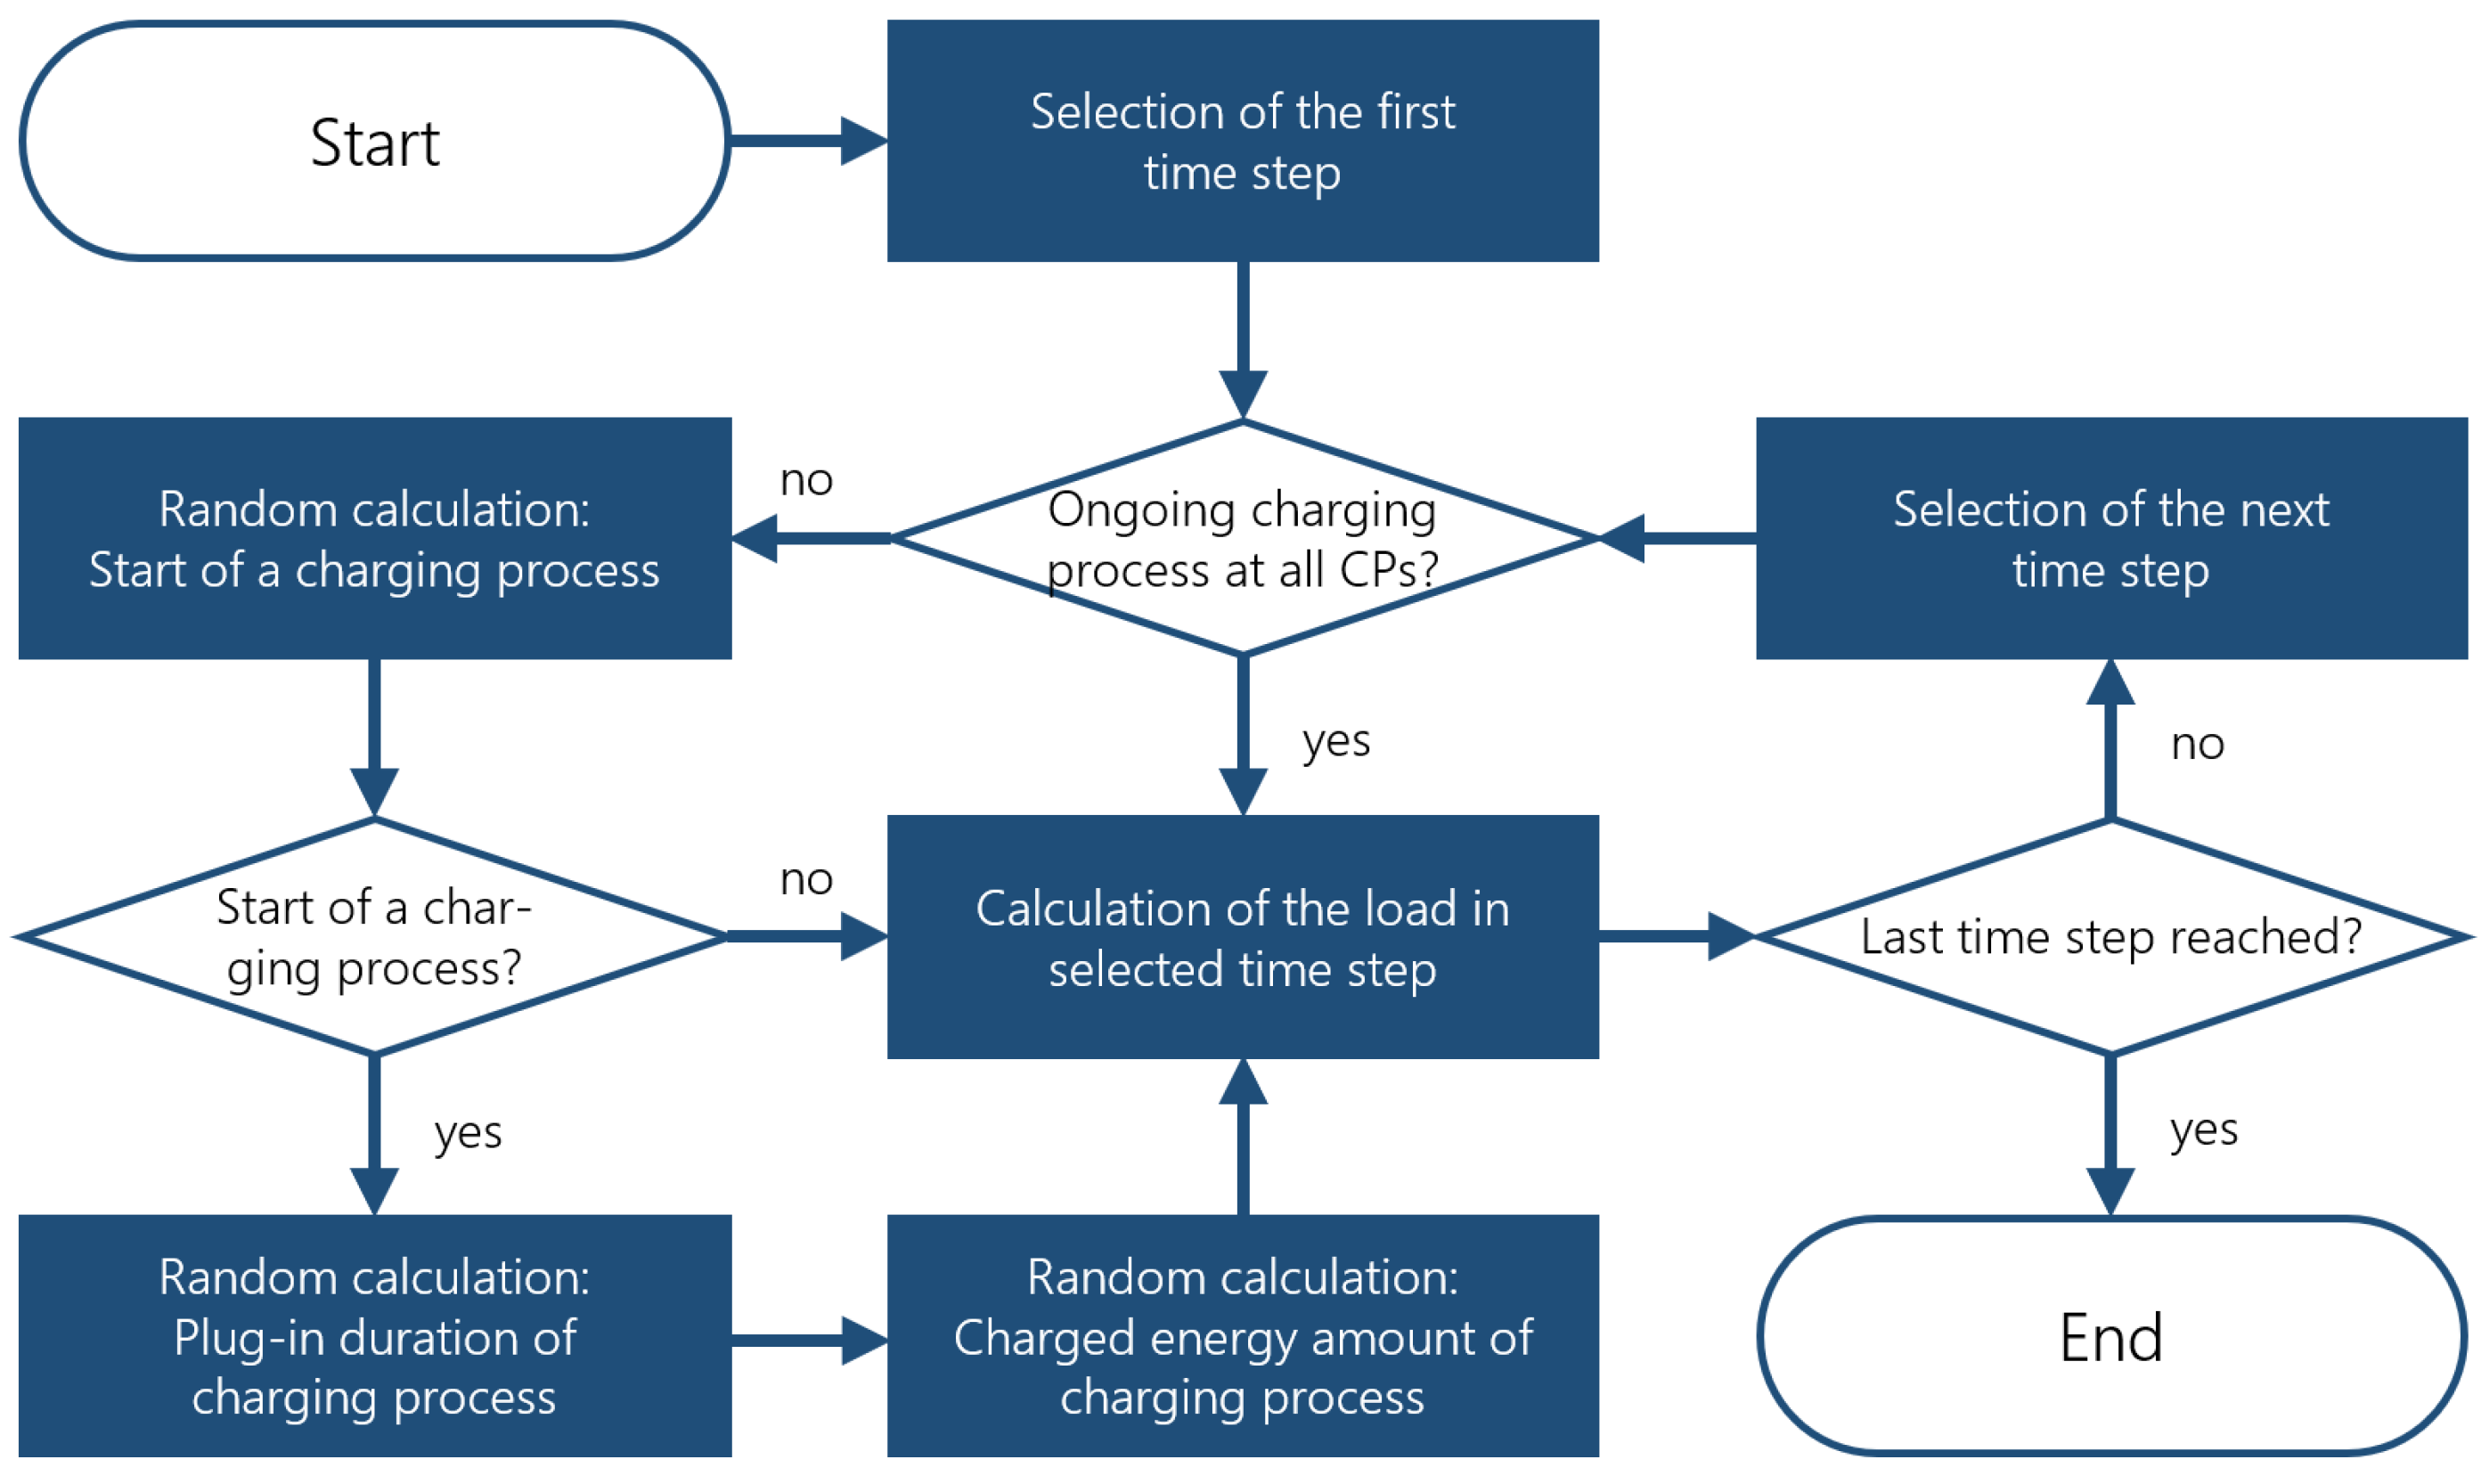

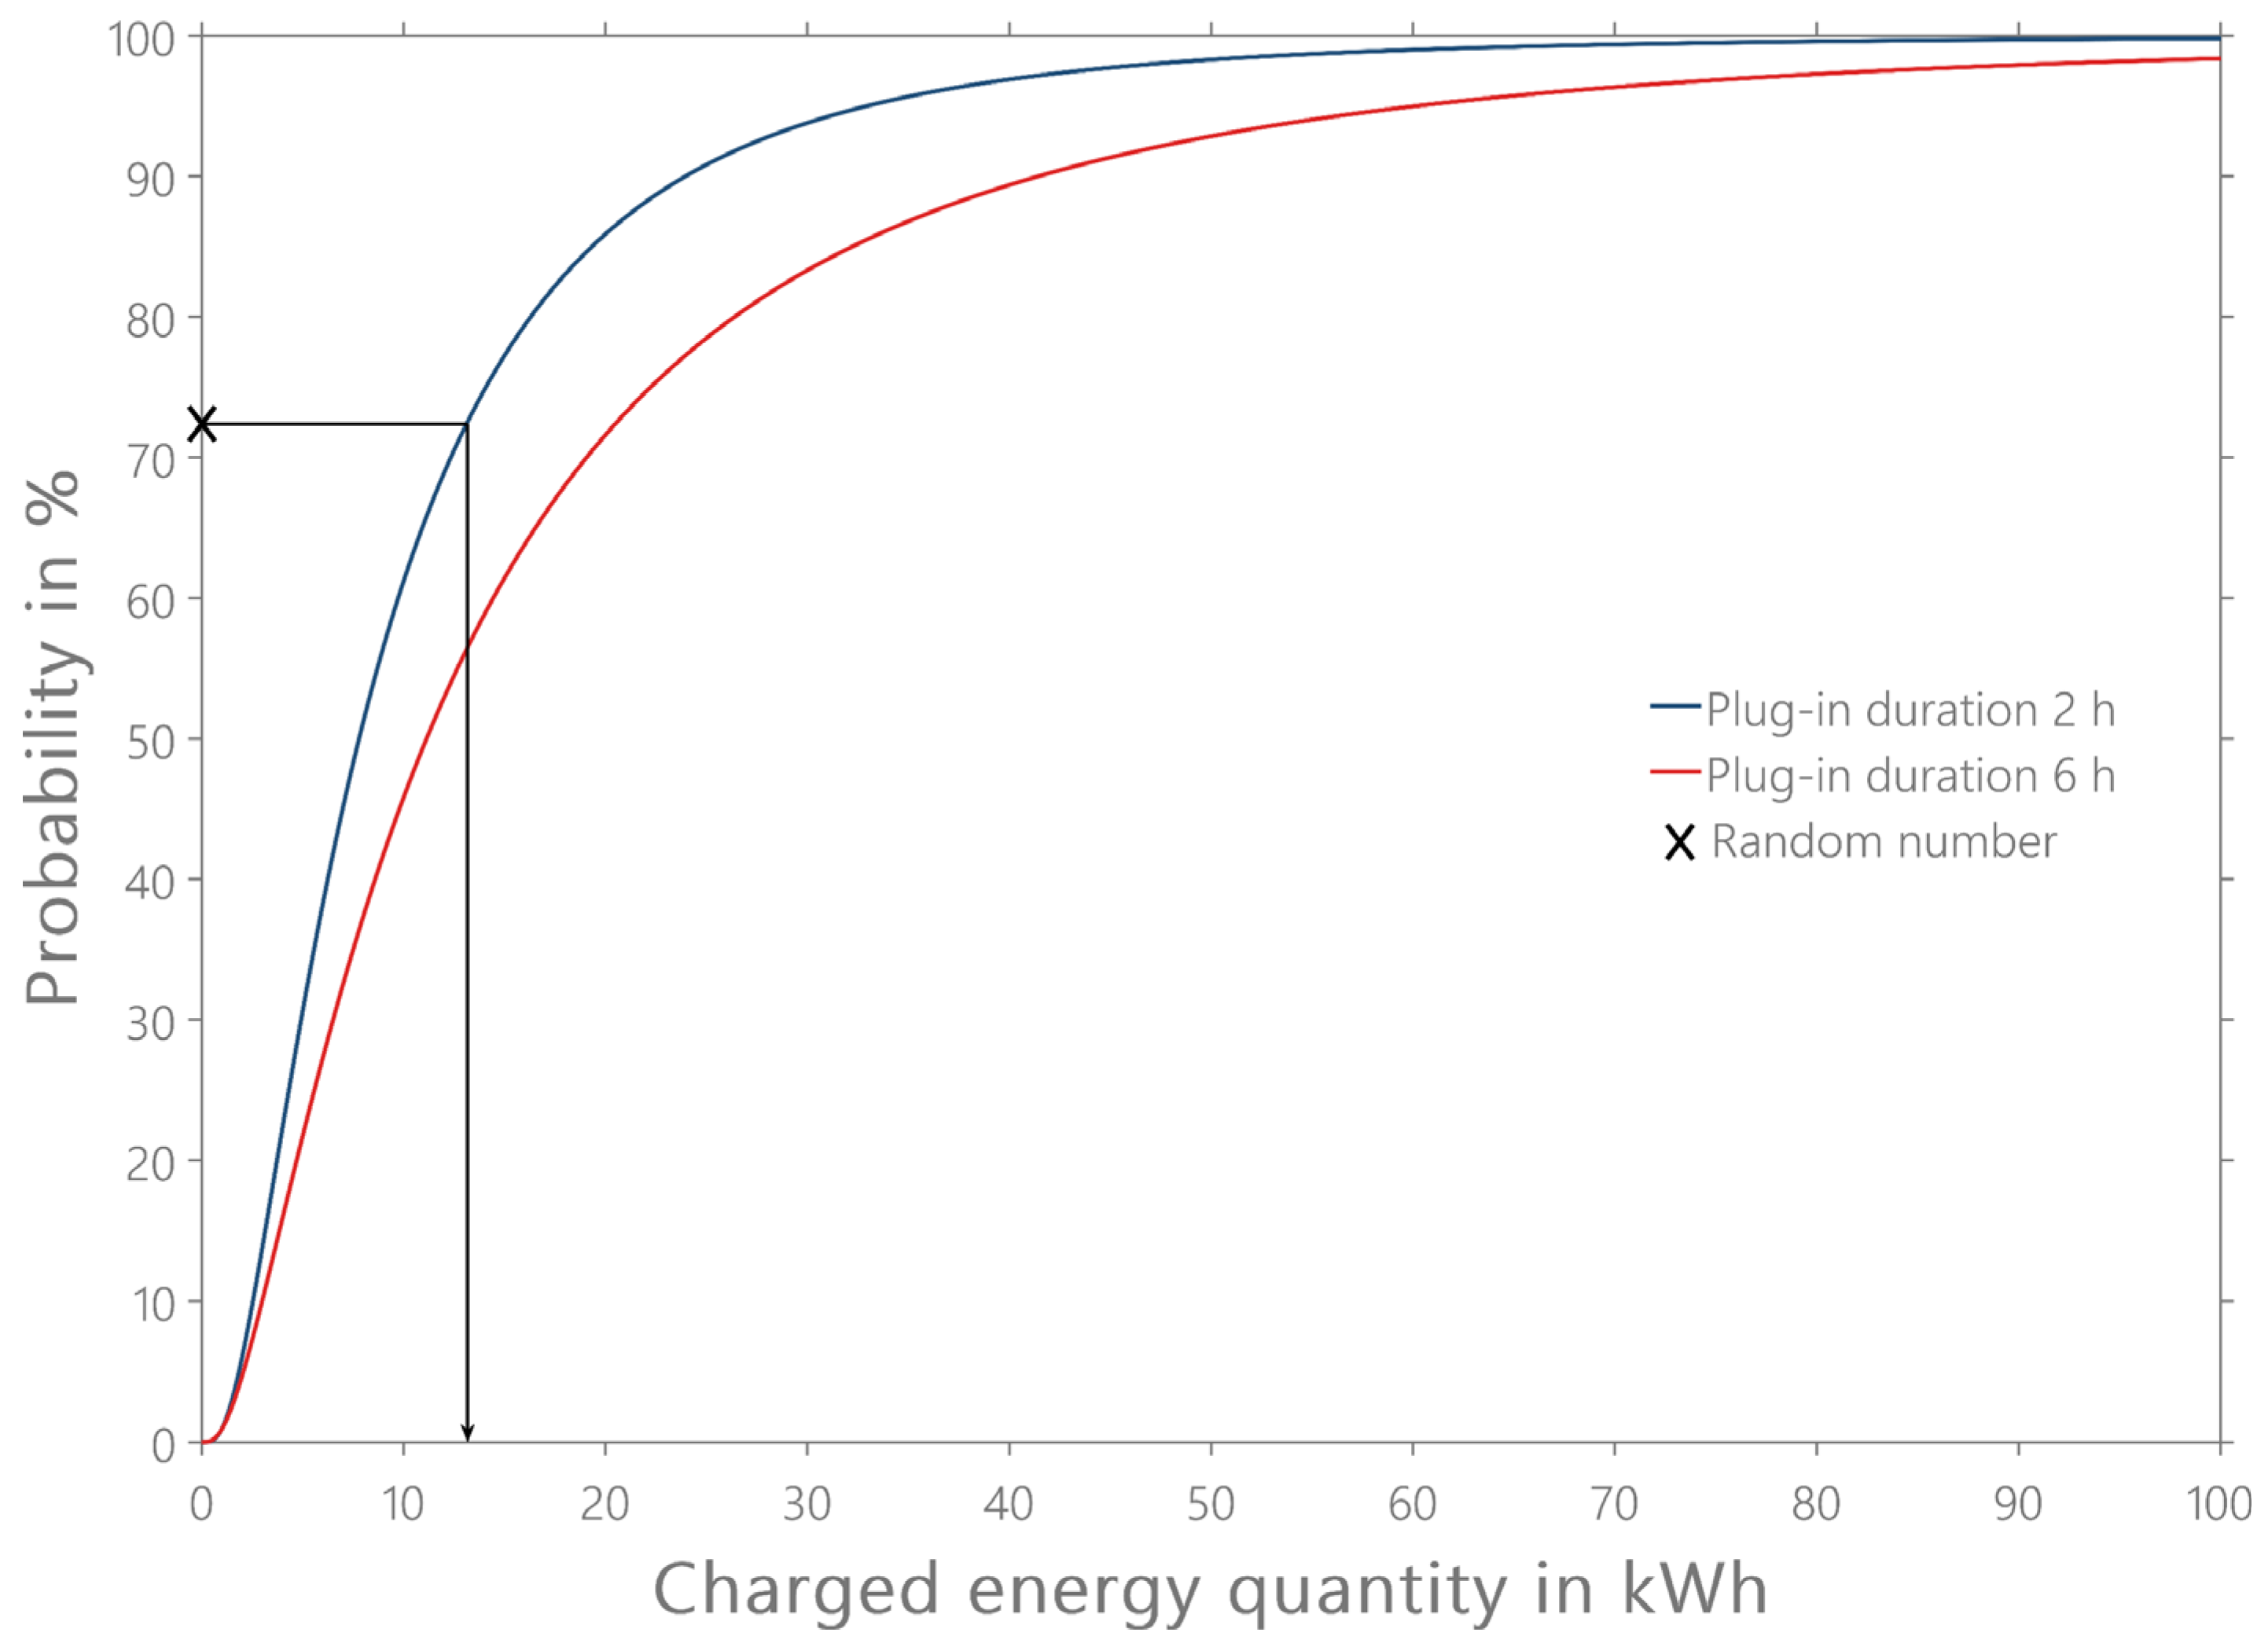
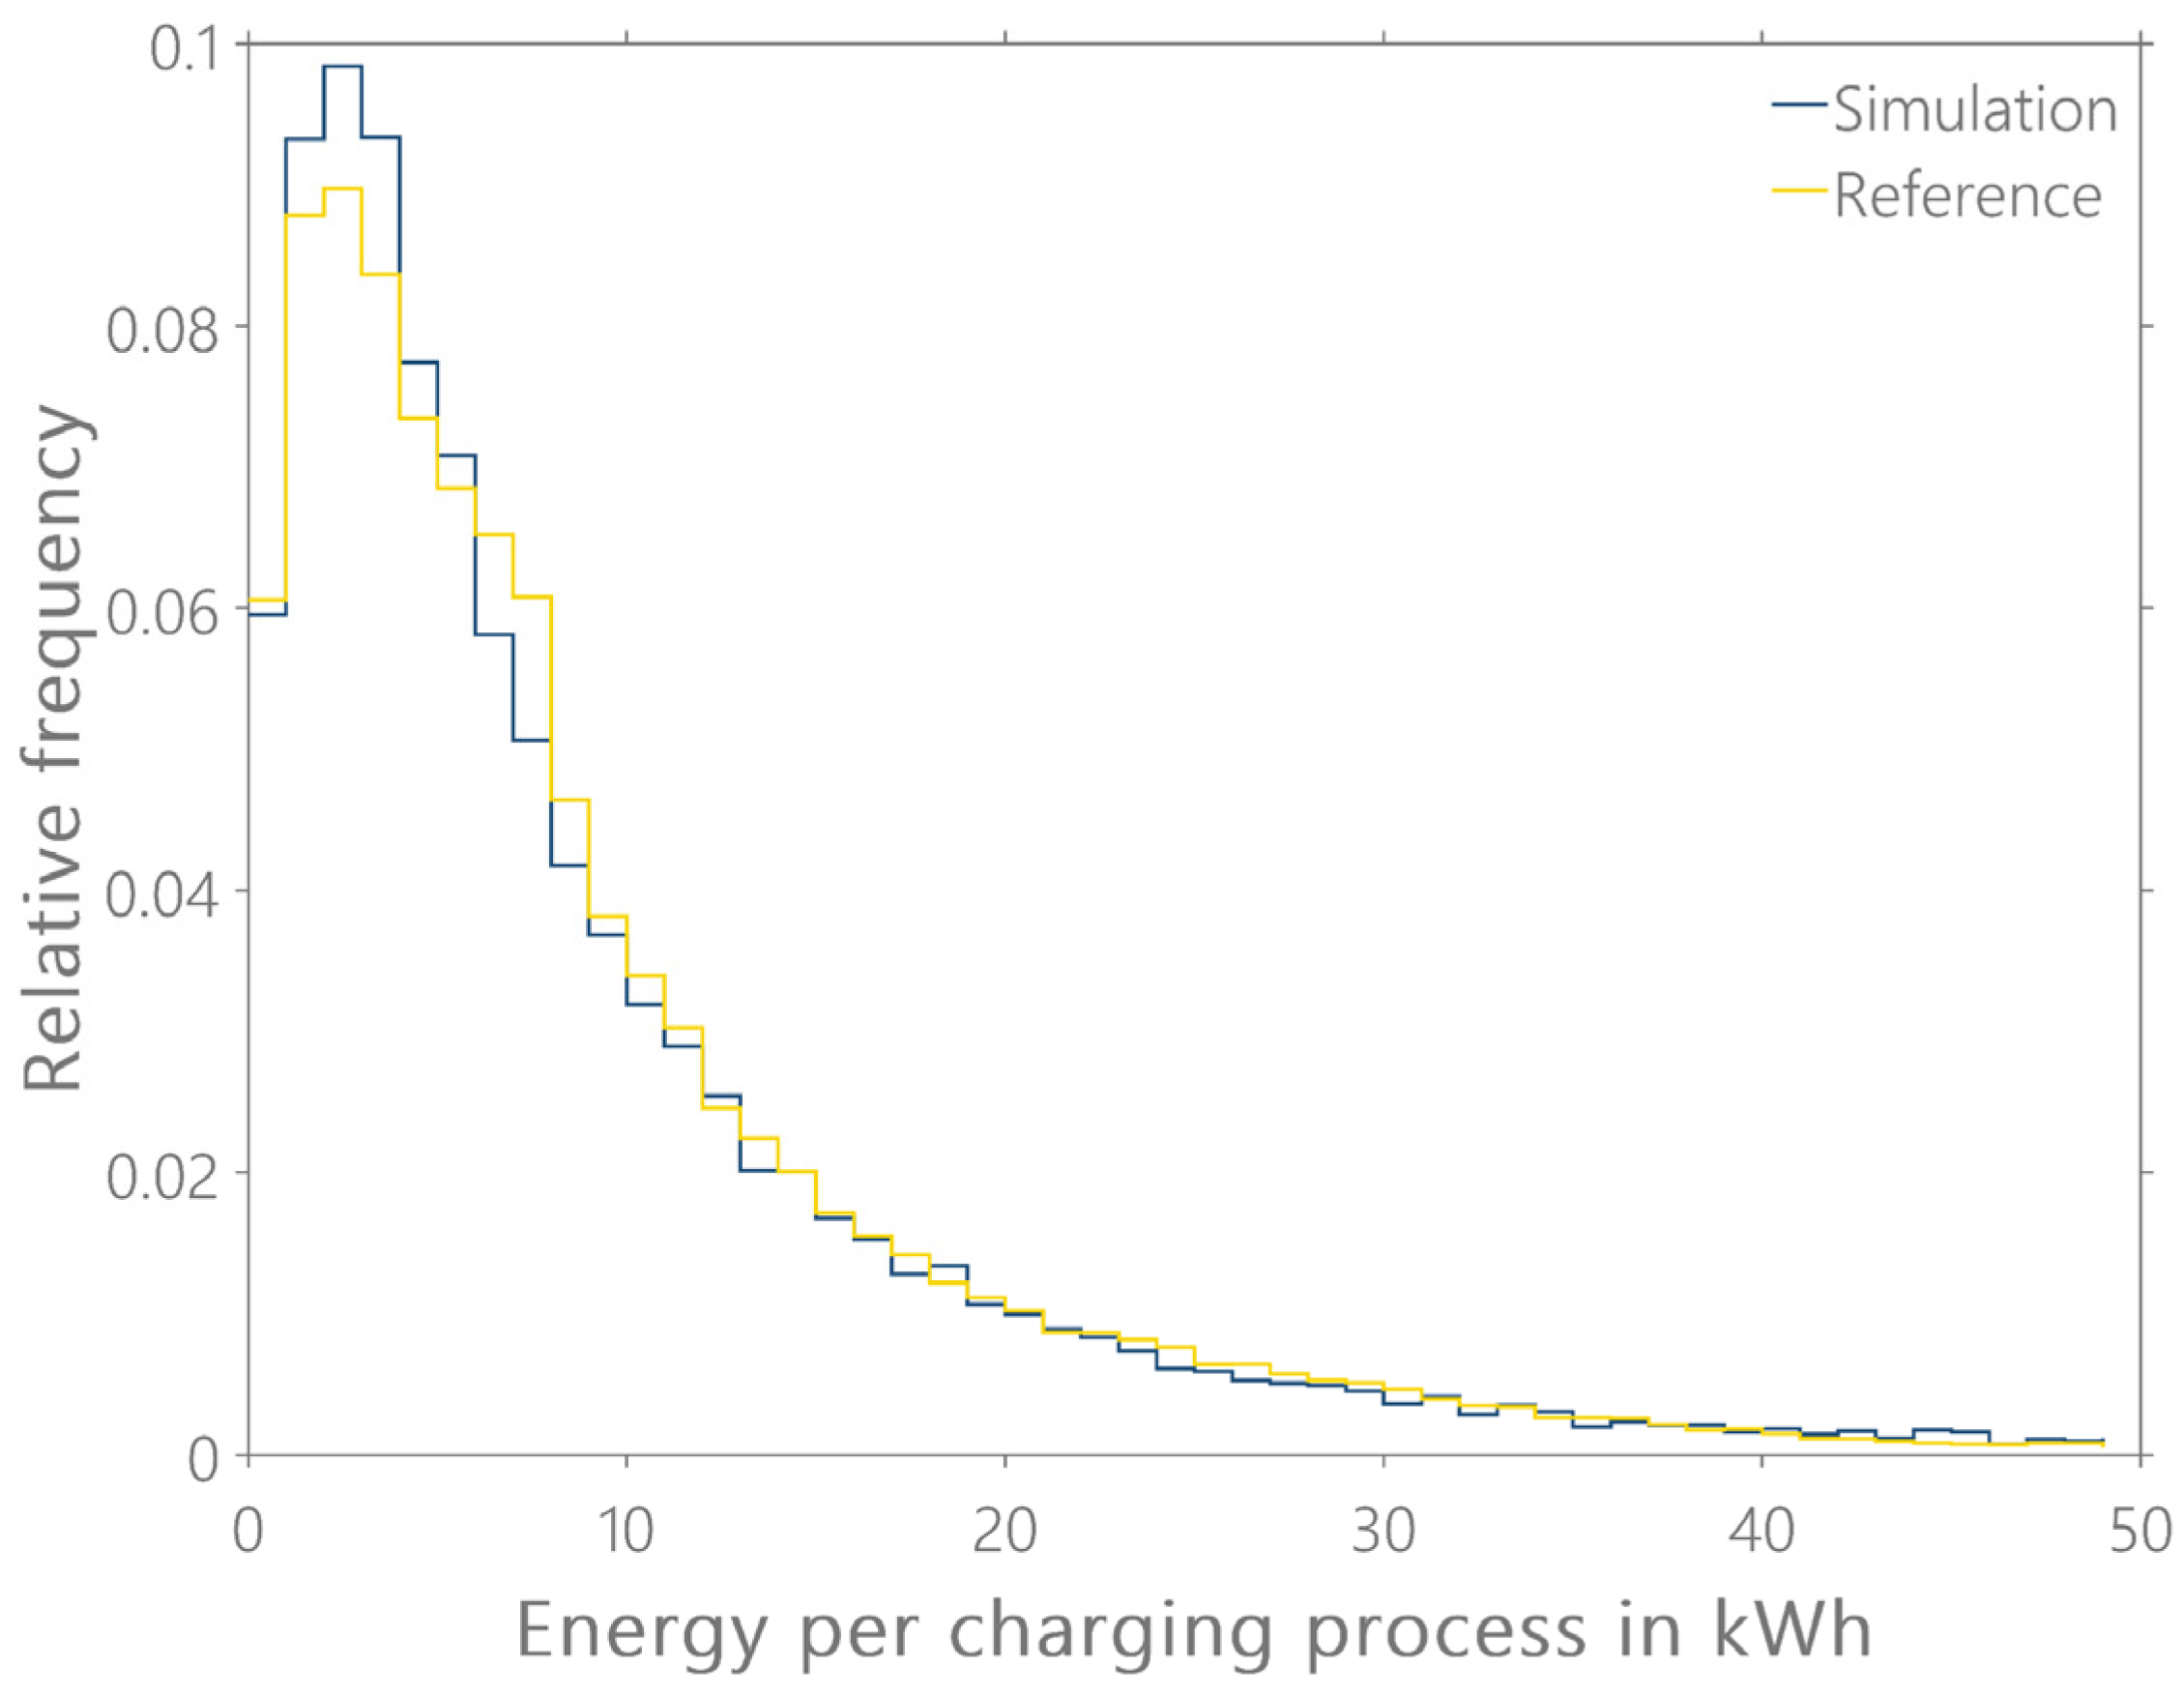
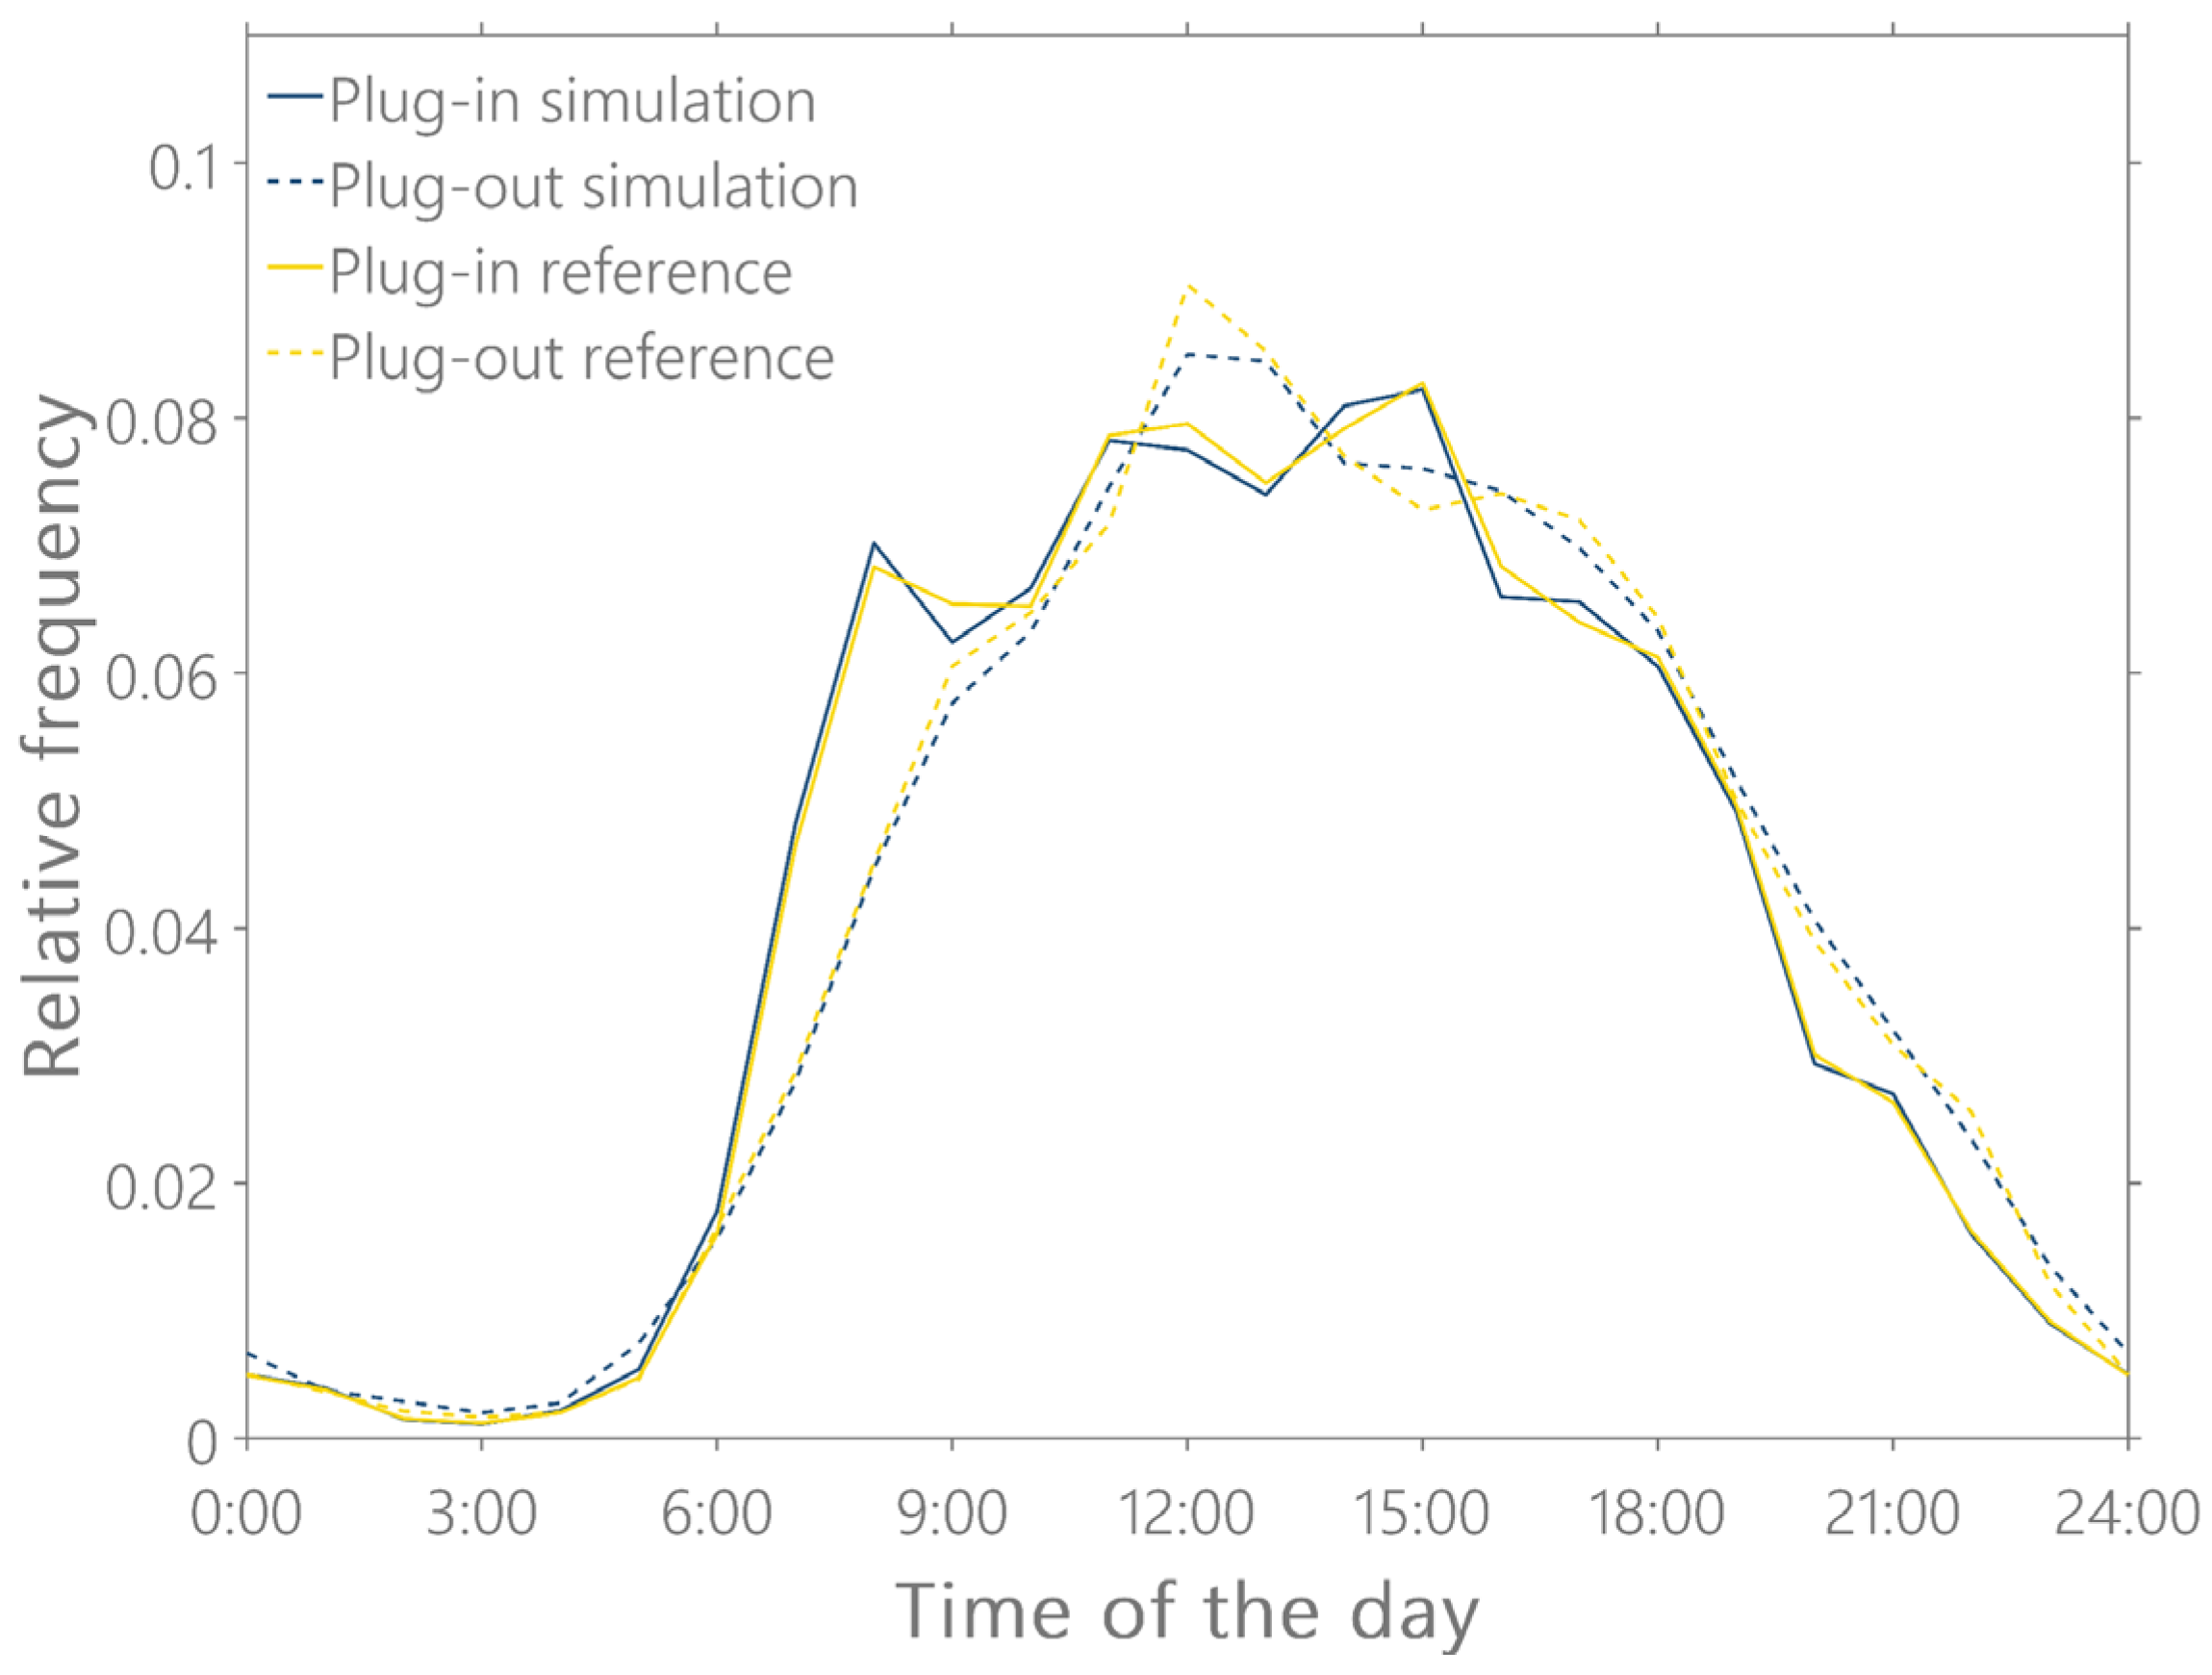
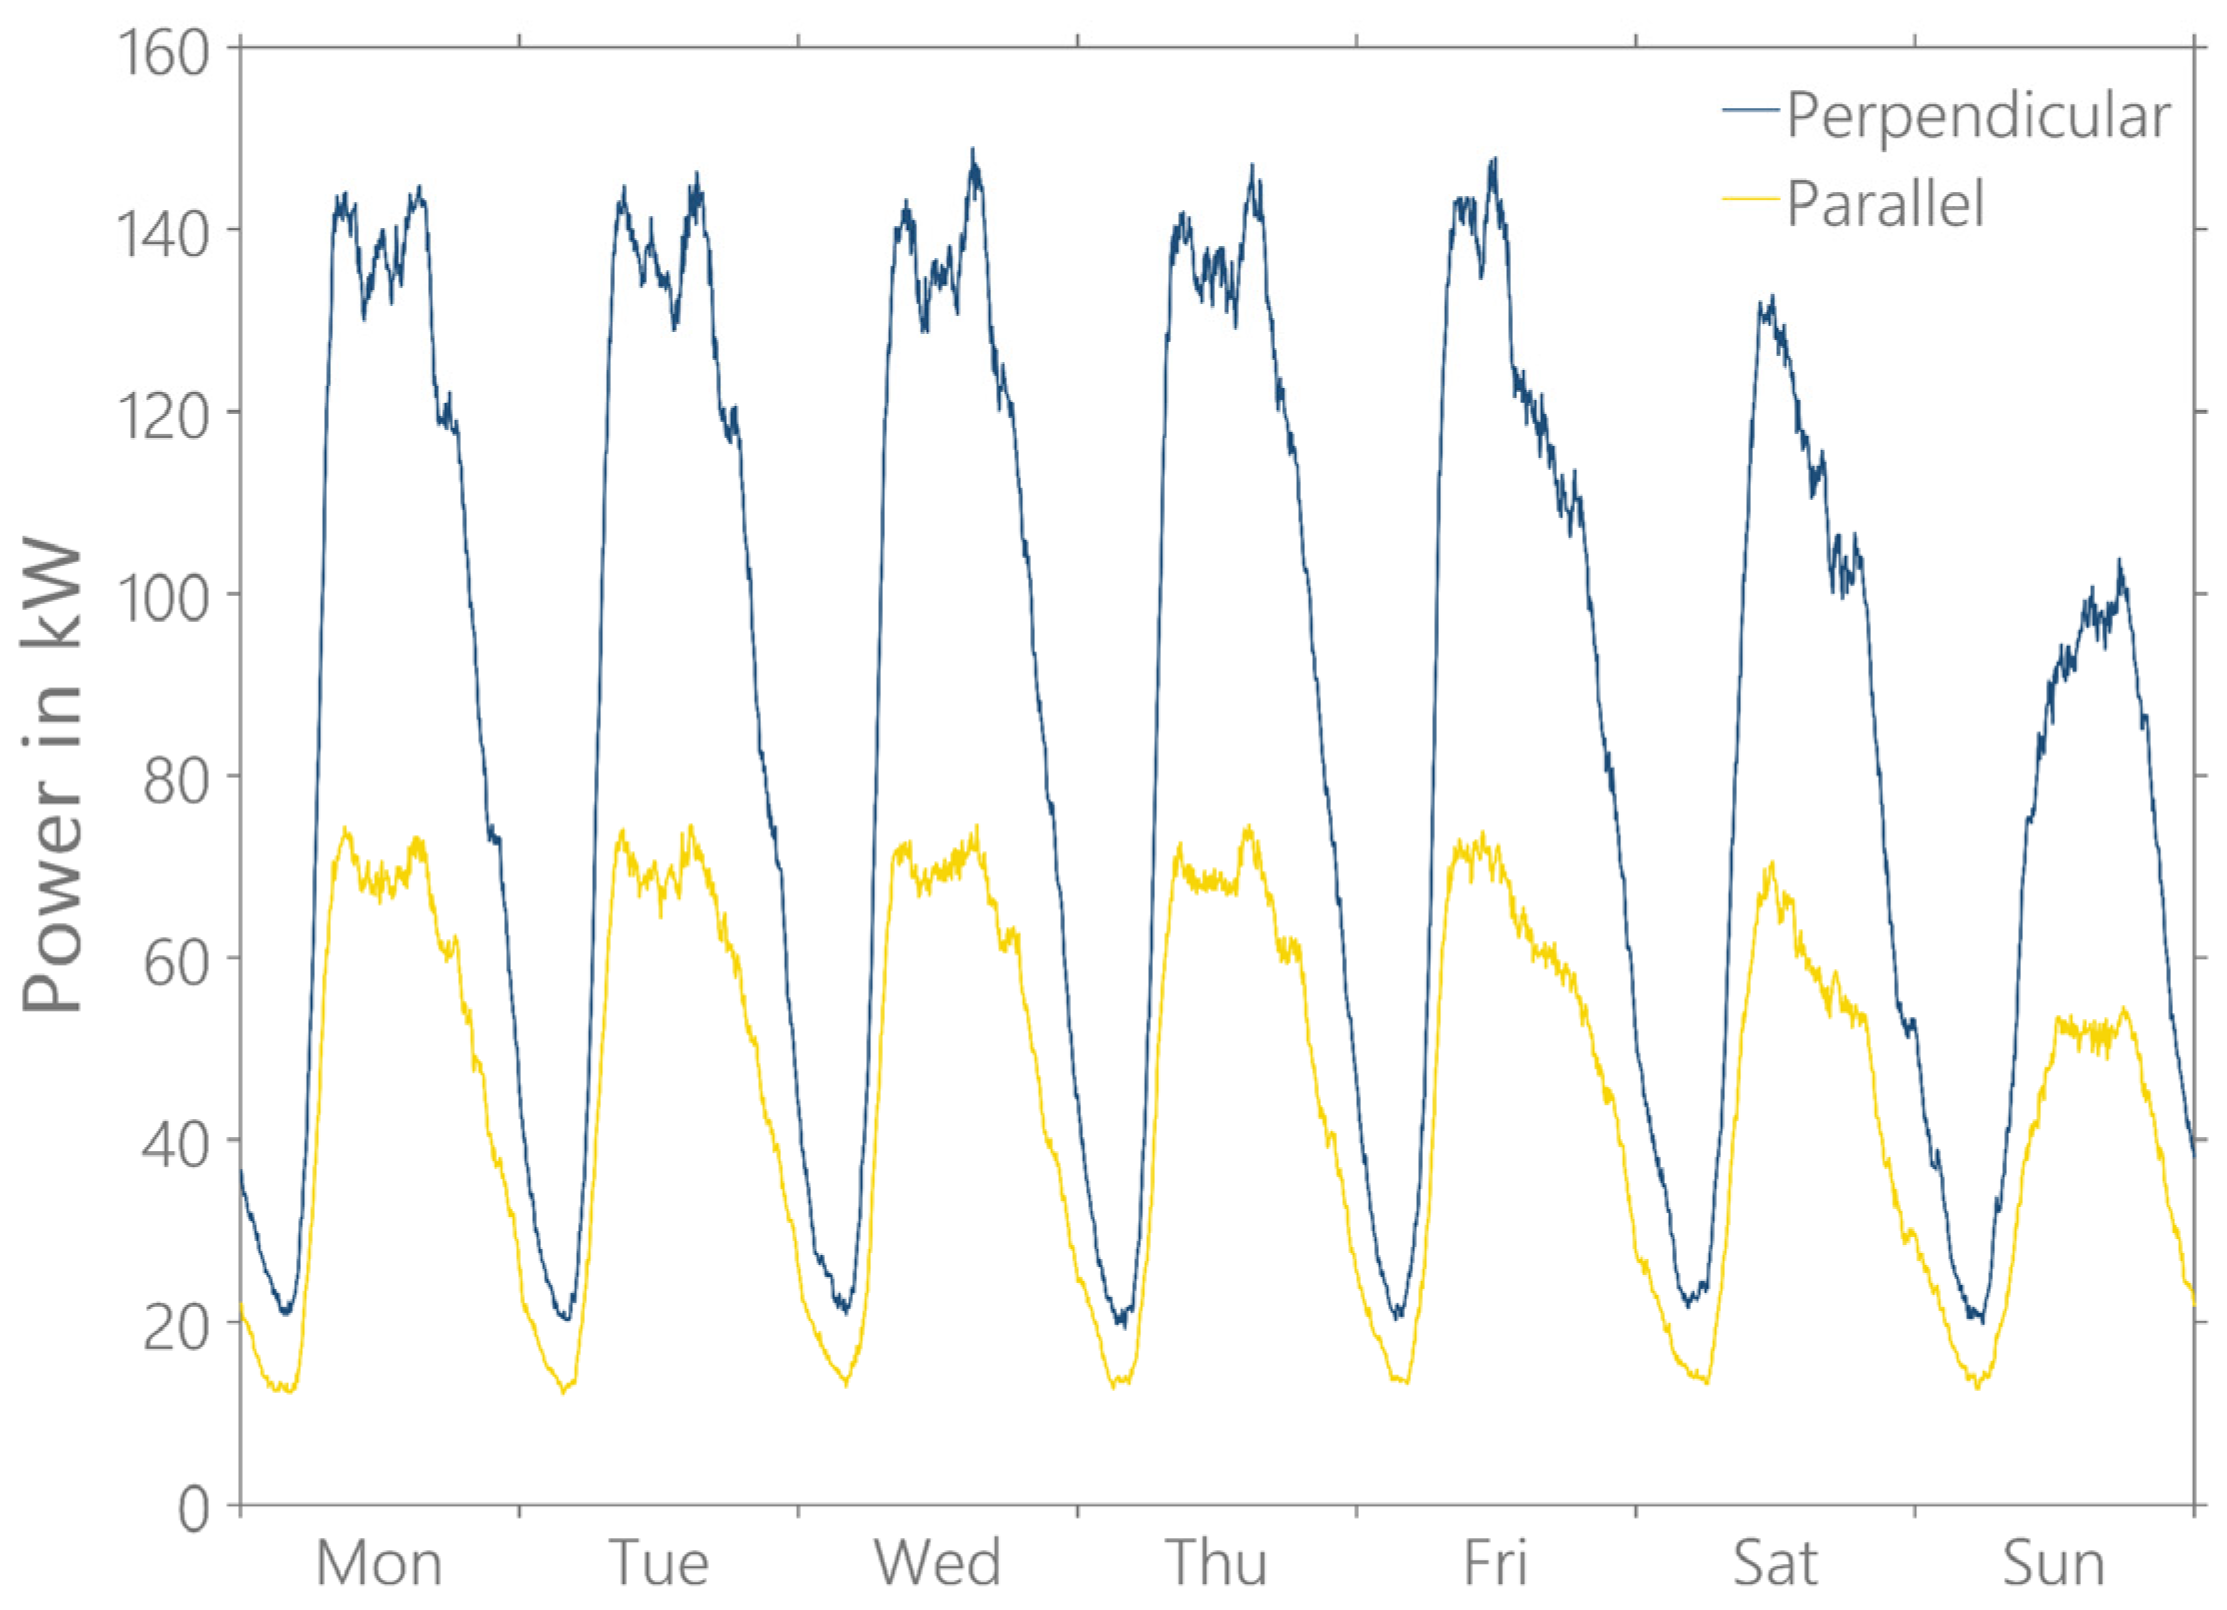
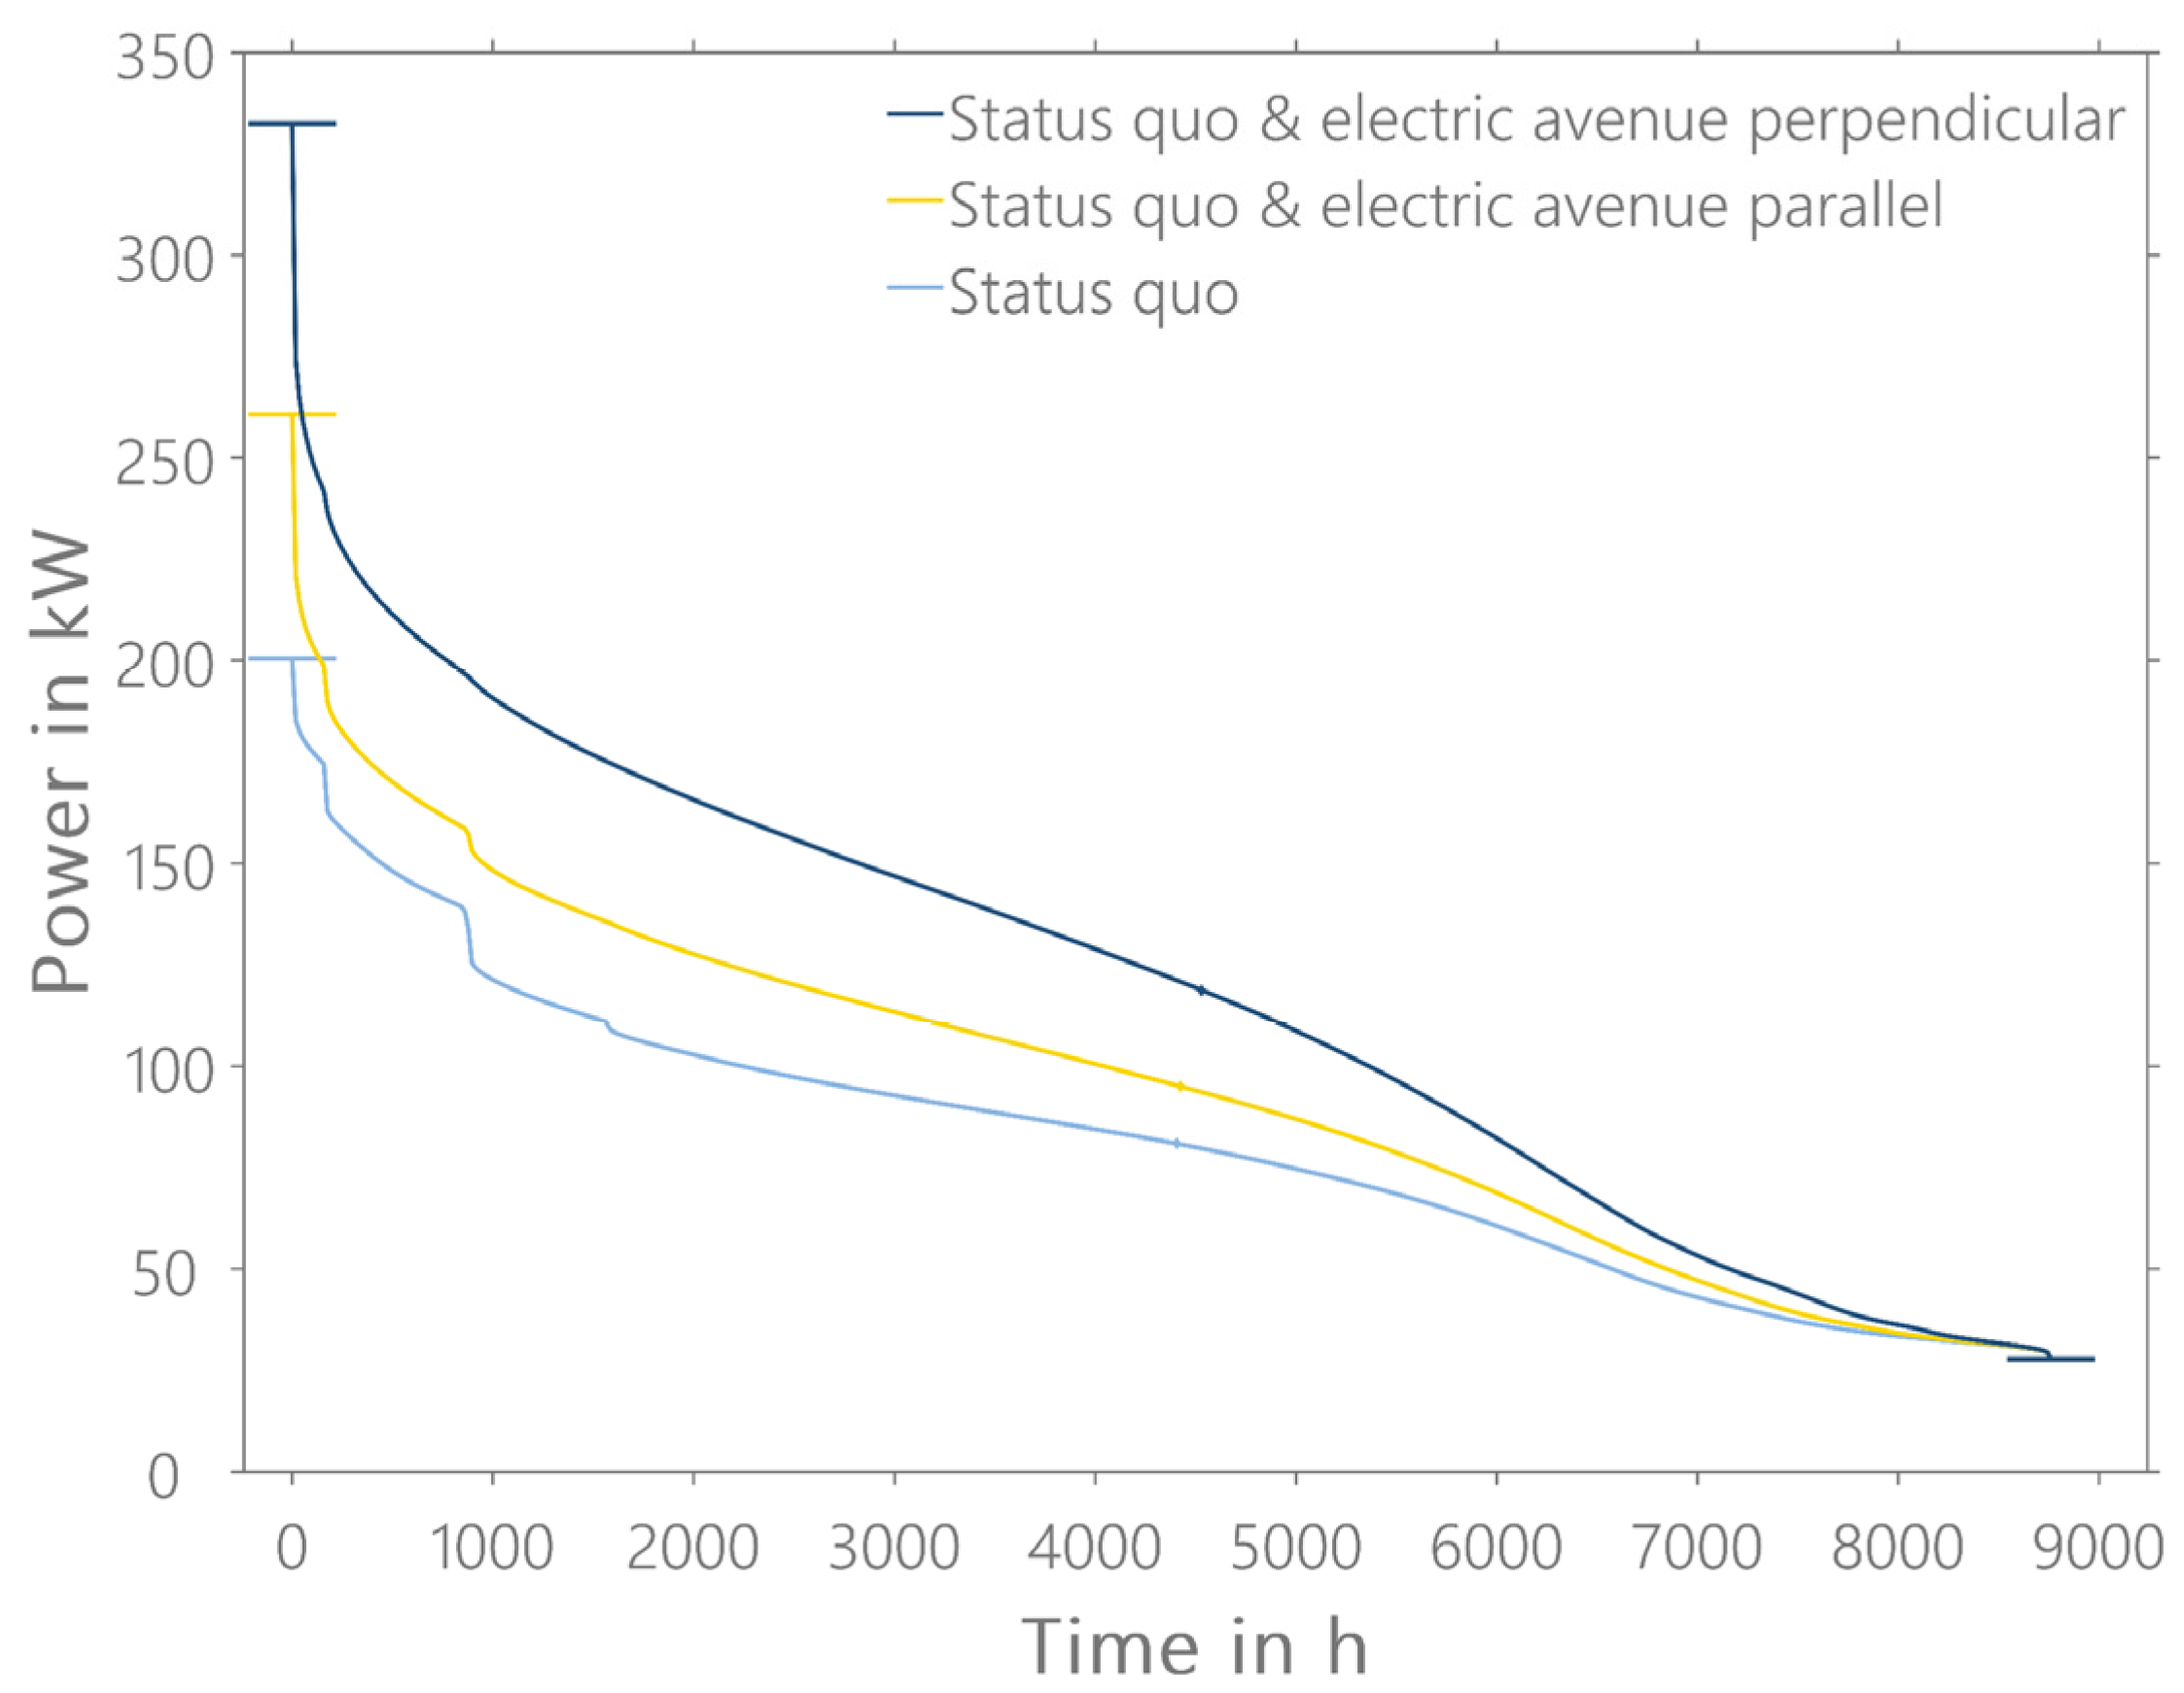
Publisher’s Note: MDPI stays neutral with regard to jurisdictional claims in published maps and institutional affiliations. |
© 2022 by the authors. Licensee MDPI, Basel, Switzerland. This article is an open access article distributed under the terms and conditions of the Creative Commons Attribution (CC BY) license (https://creativecommons.org/licenses/by/4.0/).