Article

DNS Study of Spherically Expanding Premixed Turbulent Ammonia-Hydrogen Flame Kernels, Effect of Equivalence Ratio and Hydrogen Content

by
Nithin Mukundakumar
1,* and
Rob Bastiaans
1,2
1
Power and Flow, Department of Mechanical Engineering, Eindhoven University of Technology, P.O. Box 513, 5600 MB Eindhoven, The Netherlands
2
Eindhoven Institute for Renewable Energy Systems (EIRES), Eindhoven University of Technology, P.O. Box 513, 5600 MB Eindhoven, The Netherlands
*
Author to whom correspondence should be addressed.
Energies 2022, 15(13), 4749; https://doi.org/10.3390/en15134749
Submission received: 5 May 2022 / Revised: 9 June 2022 / Accepted: 22 June 2022 / Published: 28 June 2022

Abstract

:
In this study, 3D premixed turbulent ammonia-hydrogen flames in air were studied using DNS. Mixtures with 75%, 50% and 25% ammonia (by mole fraction in the fuel mixture) and equivalence ratios of 0.8, 1.0 and 1.2 were studied. The studies were conducted in a decaying turbulence field with an initial Karlovitz number of 10. The flame structure and the influence of ammonia and the equivalence ratio were first studied. It was observed that the increase in equivalence ratio smoothened out the small scale wrinkles while leading to strongly curved leading edges. Increasing the amount of hydrogen in the fuel mixtures also led to increasingly distorted flames. These effects are attributed to local increases in the equivalence ratio due to the preferential diffusion effects of hydrogen. The effects of curvature on the flame chemistry were studied by looking at fuel consumption rates and key reactions. It was observed that the highly mobile H2 and H species were responsible for differential rates of fuel consumption in the positively curved and negatively curved regions of the flame. The indication of a critical amount of hydrogen in the fuel mixture was observed, after which the trends of reactions involving H radical reactions were flipped with respect to the sign of the curvature. This also has implications on NO formation. Finally, the spatial profiles of heat release and temperature for 50% hydrogen were studied, which showed that the flame brush of the lean case increases in width and that the flame propagation is slow for stoichiometric and rich cases attributed to suppression of flame chemistry due to preferential diffusion effects.

1. Introduction

Hydrogen is set to become the most important energy source for the renewable energies transition. With the conclusion of COP26, where more than 125 countries have agreed to phase down coal and fossil fuels, the decarbonization of many sectors such as residential heating and power generation can only be achieved through carbon-free alternatives, such as hydrogen. However, due to its low energy density [1], the amount of energy stored per unit volume, storing the large amounts required for these sectors becomes expensive and large. Additionally, safe hydrogen storage is more expensive than conventional fuels due to its high reactivity and diffusive nature [2]. One way to tackle this issue would be to store hydrogen in the form of ammonia.
Ammonia is particularly attractive to the existing infrastructure and supply chain due to its use in agriculture as a fertilizer [3]. Hydrogen can be recovered by either cracking or by direct combustion of ammonia in gas turbines or additionally through partial cracking [4]. Due to the relative simplicity of burning ammonia directly in gas turbines, with some modification to existing designs, direct combustion of ammonia is preferred over cracking [5].
However, there are several challenges with using ammonia as a fuel in combustors. The reactivity of ammonia is significantly lower than that of hydrogen or methane, which means that current gas turbine combustors need to be redesigned for optimum performance. To mitigate this, methane and hydrogen has been proposed as diluents to improve reactivity and flame stability. To this end, to quantify the performance of hydrogen and methane as potential diluents, Tang et al. [6] studied the effect of methane and hydrogen mixtures with ammonia and observed in their experimental study that the addition of hydrogen has a better effect of improving combustion performance over methane. Wiseman et al. [7] also studied the blow-out behaviour of ammonia-hydrogen and methane flames, and arrived at the conclusion that methane-air flames exhibit a stronger tendency to flame extinction compared to ammonia-hydrogen flames.
Additionally, the nitrogen in ammonia leads to very high levels of NOx emissions, making the use of ammonia as fuel especially challenging. Early research showed that rich combustion of pure ammonia led to lower NOx as compared to lean mixtures [5]. Two-stage humidified combustion strategies, known as Rich-Quench-Lean, have also shown significant reduction in NOx emissions while providing good power output [8]. Although recent interest in ammonia combustion has led to many numerical works on the turbulent combustion behaviour of ammonia, these are mostly with industrial/semi-industrial gas turbine combustor geometry and thus lack a fundamental approach. Moreover, we found that studies on 3D simulations of premixed ammonia/hydrogen flames are small in number.
Bioche et al. [9] studied rich ammonia-hydrogen flames using large eddy simulations in a generic swirl burner. They observed that the performance of the swirl burner at 54% in the fuel mixture at an equivalence ratio of 1.5 was close to the performance of a reference methane-air case at an equivalence ratio of 0.83. Somarathne et al. [10] conducted a numerical study using LES on a low NOX swirl combustor with secondary air injection at high pressure. They observed that for stoichiometric and rich flames, as the pressure is increased, NO and unburnt NH3 emissions decreased, while there was no effect on unburnt H2. They also observed that secondary air injection led to NO generation again in extremely rich conditions. Many 1D flame studies have also been conducted to study reaction pathways and to develop reaction mechanisms [4,11,12,13,14].
Recent fundamental studies include a study by Netzer et al. [15], who studied the effect of curvature on NO formation using 2D DNS of turbulent planar flames. They observed a correlation between NO and H and O radicals and the impact of H radicals on NO formation in the curved flame surfaces. However, their study did not investigate cases with very high amounts of hydrogen (by mole fraction). Rieth et al. [16] also studied curvature effects on the burning rates of hydrogen/ammonia/air flames. They concluded that the fast diffusing hydrogen radicals and molecules significantly impact the flame chemistry with respect to flame curvature.
In this study, a 3D DNS study of turbulent spherically expanding flame kernels of ammonia diluted with various levels of hydrogen at different equivalence ratios were conducted to understand fundamental turbulent flame characteristics of ammonia-hydrogen fuel mixtures. The UC San Diego mechanism with updated nitrogen chemistry [17] was used for this purpose. The flame structure was qualitatively studied, along with the curvature influence on flame chemistry. In the first section, the numerical setup is discussed. In the second section, the results are presented with various observations, and finally, the paper is concluded with key conclusions.

2. Numerical Set-Up and Conditions

DNS studies of spherically expanding turbulent 3-D flame kernels were conducted. The DNS cases were run using an in-house finite difference code. The code uses the 6th order compact differencing scheme from Lele [18] and the 5th order upwind scheme from De Lange [19] for the convective terms to avoid numerical diffusion. The time discretization was done using a 3rd order compact Runge–Kutta scheme [20]. The boundary conditions were modelled using the Navier–Stokes characteristic boundary conditions [21]. Subsonic outflow conditions were imposed for all faces of the cubic domain used for this study.
A mesh dependency study was conducted by computing the flame position after a fixed amount of time for various grid sizes, and the error between consecutive runs was measured. The grid sizes were then reduced until no significant change in flame position was observed between two consecutive grid size reductions. The study showed that the solution becomes independent of the mesh when there are 14 grid points for the laminar flame thickness. This was consistent with past studies using similar discretization methods. The flame thickness was computed using the thermal gradient method. A time step of less than 1e-8s was used, as this ensures stability of the code.
The initial turbulence was generated by convoluting a random stream function with a filter. The gradient of the resulting field produces the velocity field. This way, the turbulence is homogenous, isotropic and divergence-free, the latter by definition. The spectra of such an initial field after it has decayed is plotted in Figure 1a. Although the initial turbulence does not follow the −5/3 law, as it decays, the spectra relaxes to the −5/3 law.
The turbulence decays over time, as is seen in practical applications. The decay of U r m s for a non-reactive case has been plotted in Figure 1b. Initially, the turbulence decay is slow, caused by adjusting a randomly initiated turbulence structure to a structure defined by decaying homogeneous isotropic turbulence. This way, the reactive case can also be initiated at a set U r m s value.
The turbulence decay behaviour has been detailed in [22,23]. The integral length scale can be selected by choosing a particular filter width. The chemistry was initialized by converting a 1D flame, generated using CHEM1D [24], into a 3D flame kernel. It is also of note that by superimposing the laminar initial condition, the velocity field loses its divergence-free character. The cases studied in this paper are detailed in Table 1, where ϕ is the equivalence ratio, T i l is the laminar inner layer temperature, s l is the laminar flame speed, v is the turbulent RMS velocity, l t is the integral length scale, l f is the laminar flame thickness, Re is the Reynolds Number, η is the Kolomogorov length scale and τ is the eddy turnover time. Re is computed as v l t s l l f , and K a is computed as K a 2 = ( v / s l ) 3 l t / l f giving the ratio v s l computed as K a 2 / 3 l t l f 1 / 3 , where K a is the Karlovitz number. The cases were selected to compare three equivalence ratios of 0.8, 1 and 1.2 and three ammonia composition percentages of 25%, 50% and 75% in air at constant K a of 10 at atmospheric pressure. These test points fall in the thin reaction zone. Since we used a constant K a and l t l f , all cases can be represented by a single point on the Peters–Borghi regime diagram [25], and the instantaneous turbulent velocity field is different for each case. Diffusion is modelled using the constant Lewis approach, where the Lewis numbers are obtained from a 1D adiabatic flame solution computed using CHEM1D, an in-house 1D code [24], with a multi-component diffusion model including thermal diffusion which is implemented in the code using the EGLIB fortran library from Ern and Giovangigli [26]. The UC San Diego [17] mechanism was used for this study due to its sufficient accuracy combined with its short number of reactions and species. Although several other mechanisms for ammonia combustion exist [27,28,29,30,31,32,33], these have large numbers of reactions and species, restricting their use in DNS studies and hence were not considered for use in this study.

3. Results and Discussion

3.1. Flame Structure

The effect of turbulence on the flame chemistry and the flame structure is sensitive to both mixture ratios and the equivalence ratio. In Figure 2, these dependencies can be clearly seen.
Here, the positively curved regions are convex towards the reactants, and the negatively curved regions are concave towards the reactants. For a constant mixture ratio, as the equivalence ratio is increased, the flame starts to wrinkle with highly strained leading edges. As for a constant equivalence ratio, as the percentage of hydrogen is increased, a larger number of wrinkles with larger curvature values is observed. It is also observed that the case with 50% ammonia with an equivalence ratio of 1.2 is different from the other cases, but this is just a consequence of the randomness of the turbulence initialization.
The curvature can be studied quantitatively using the probability distributions shown in Figure 3. The PDF was computed by fitting a normal distribution function over the curvature values on the flame surface.
The spread of the PDF with lower amounts of hydrogen clearly indicate that although the flame is wrinkled, the radius of the curvature is very large, i.e., the curvature values are small. Taking an equivalence ratio of 0.8 as an example, we can see that the probability is distributed among larger values of curvature as the amount of hydrogen is increased. This indicates that the flame structure becomes more strained as the amount of hydrogen increases. For a constant amount of hydrogen, as the equivalence ratio is increased, the spread increases, indicating that the wrinkles with low curvature values are smoothed out, leading to highly strained leading edges with strong curvature. These observations can be explained with the preferential diffusion effects of hydrogen. In Figure 4, we see the variations in local equivalence ratio due to the diffusion of hydrogen into positively curved flame fronts. For the lean cases, for positive values of flame curvature, the flame speeds will be considerably high since the equivalence ratio increases due to stoichiometry. This leads to the points having a higher equivalence ratio to accelerate, thereby increasing the wrinkling of the flames. Since the preferential diffusion effects of the flames increase with the amount of hydrogen, the flame surface becomes more distorted as the amount of hydrogen in the mixture is increased. As we increase the global equivalence ratio, in stoichiometric and rich cases, the local equivalence ratio is pushed to rich levels, and hence the points on the surface where the flame speed is higher than the rest of the flame reduce, generating the trend that the small-scale wrinkles are smoothed out as the global equivalence ratio is increased. Further flame shape analysis can be conducted by looking at the flame surface area, which will be studied in future publications.

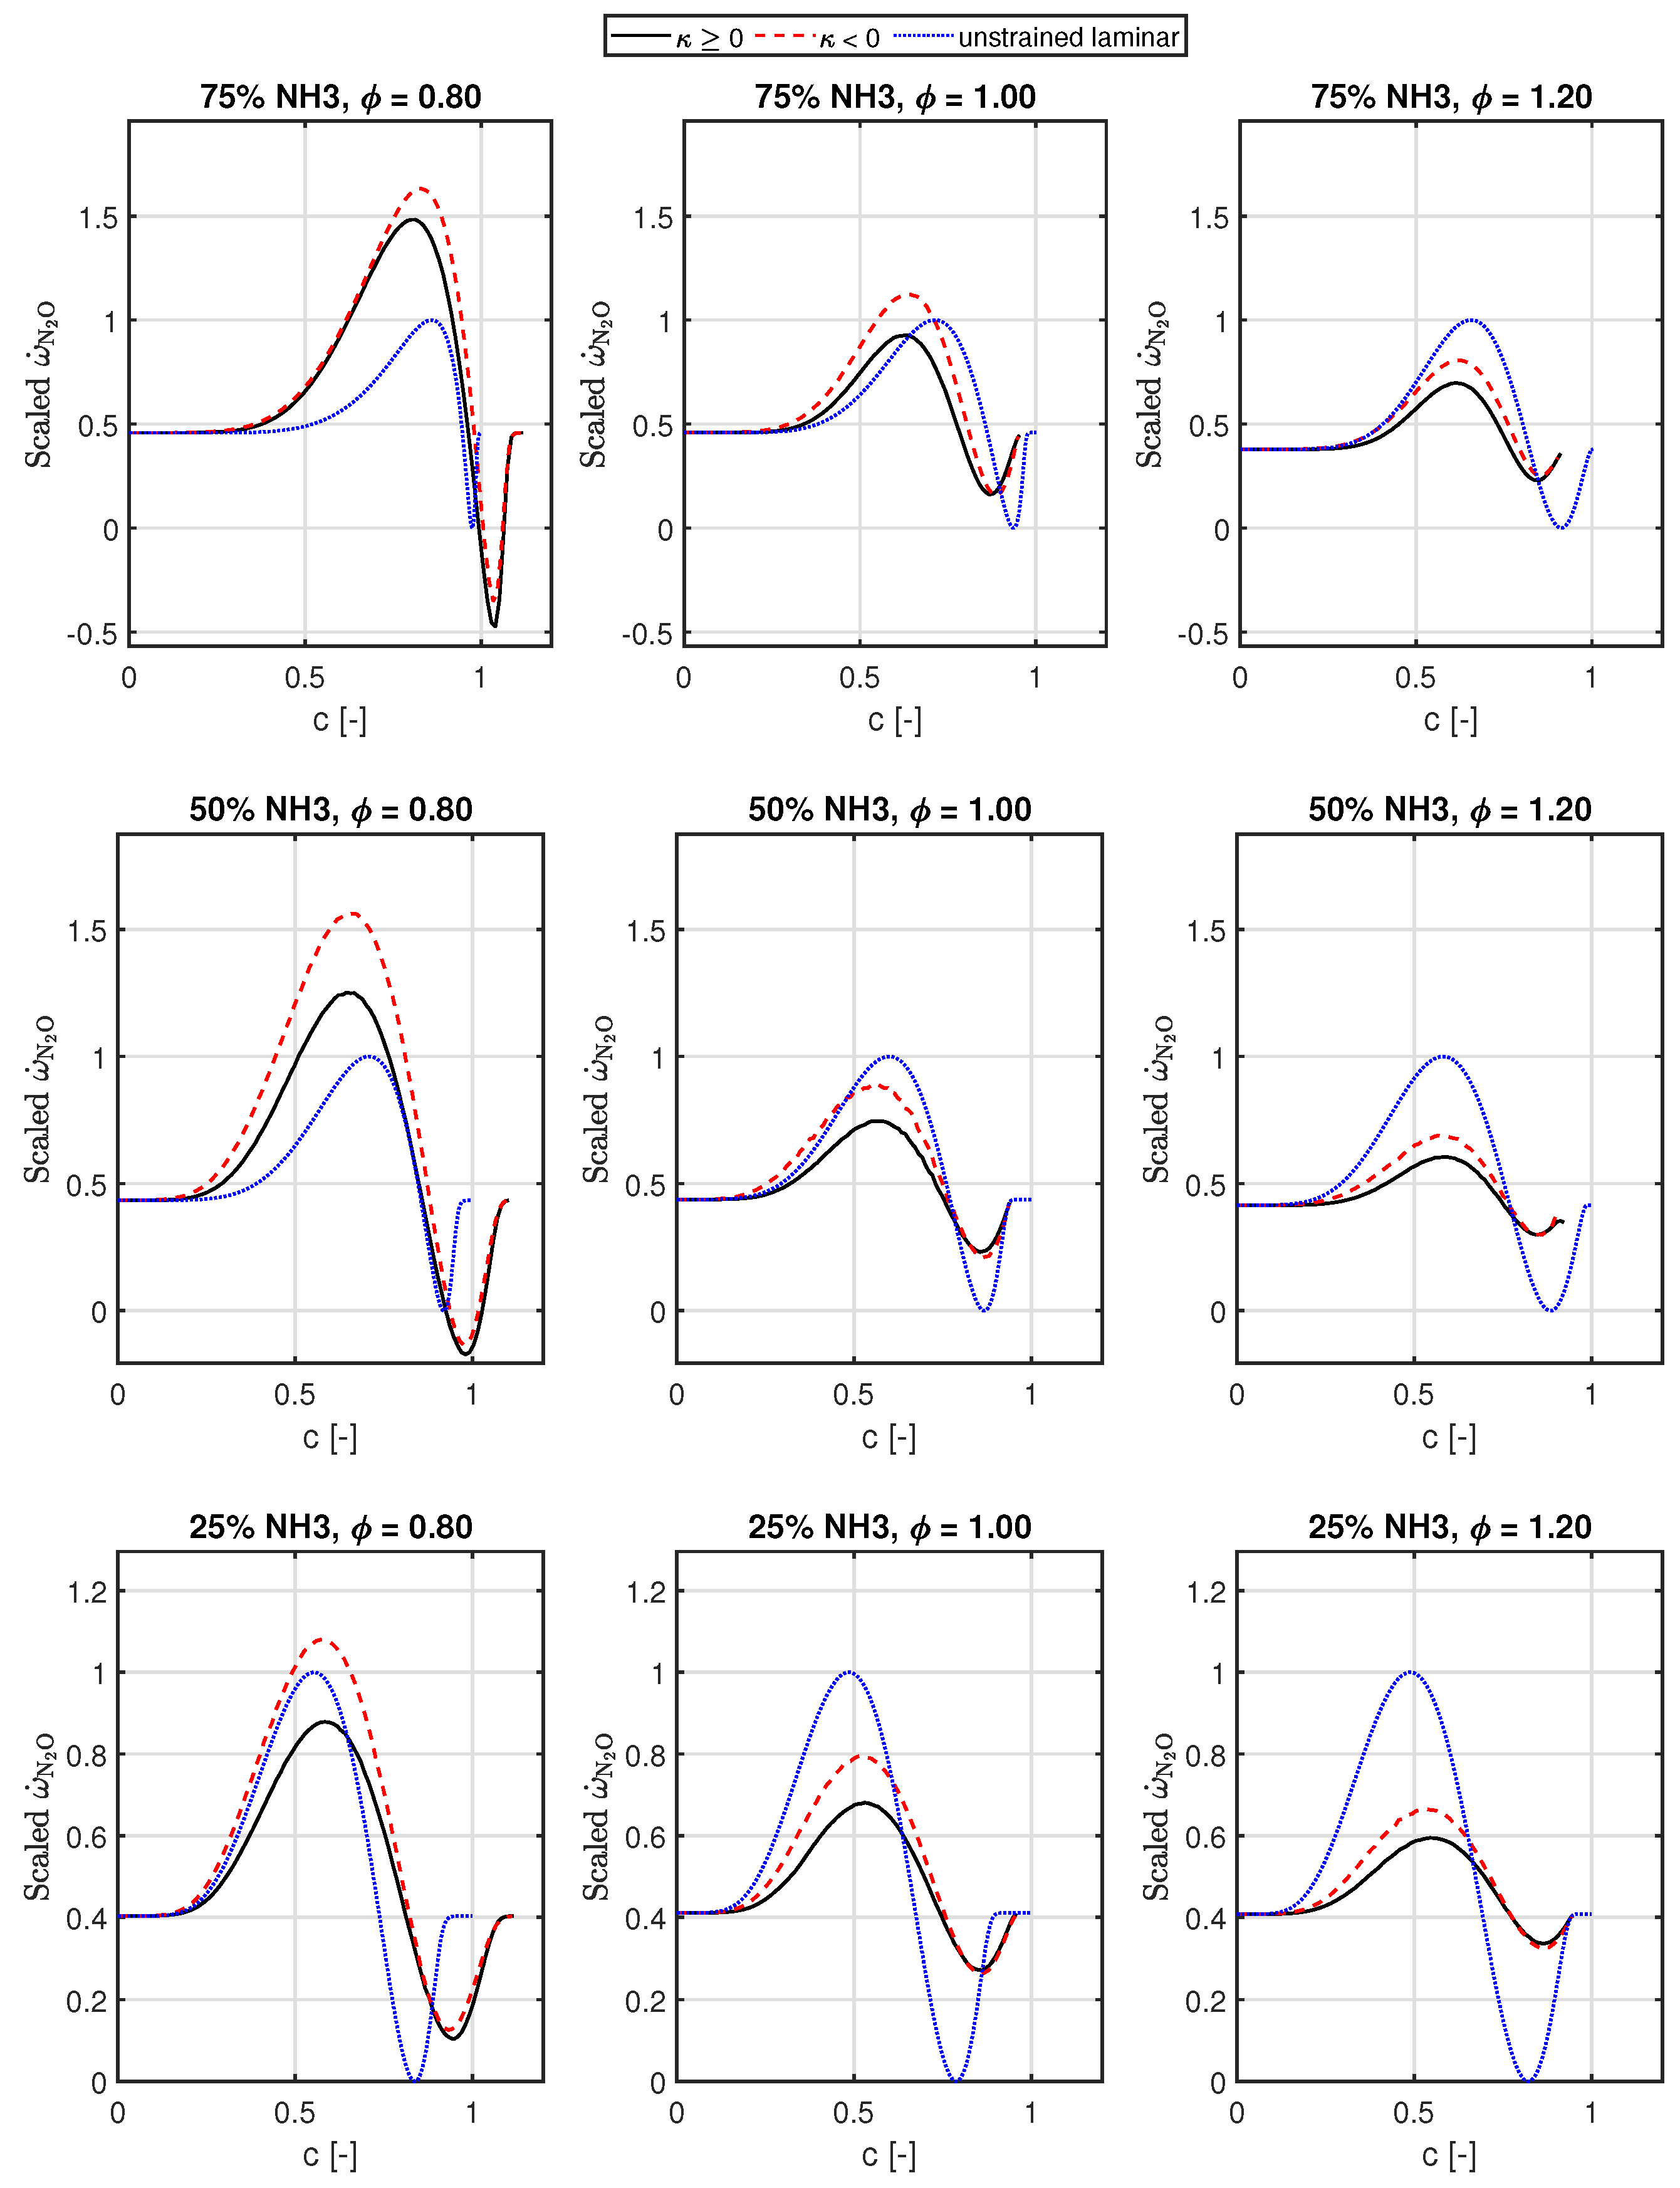
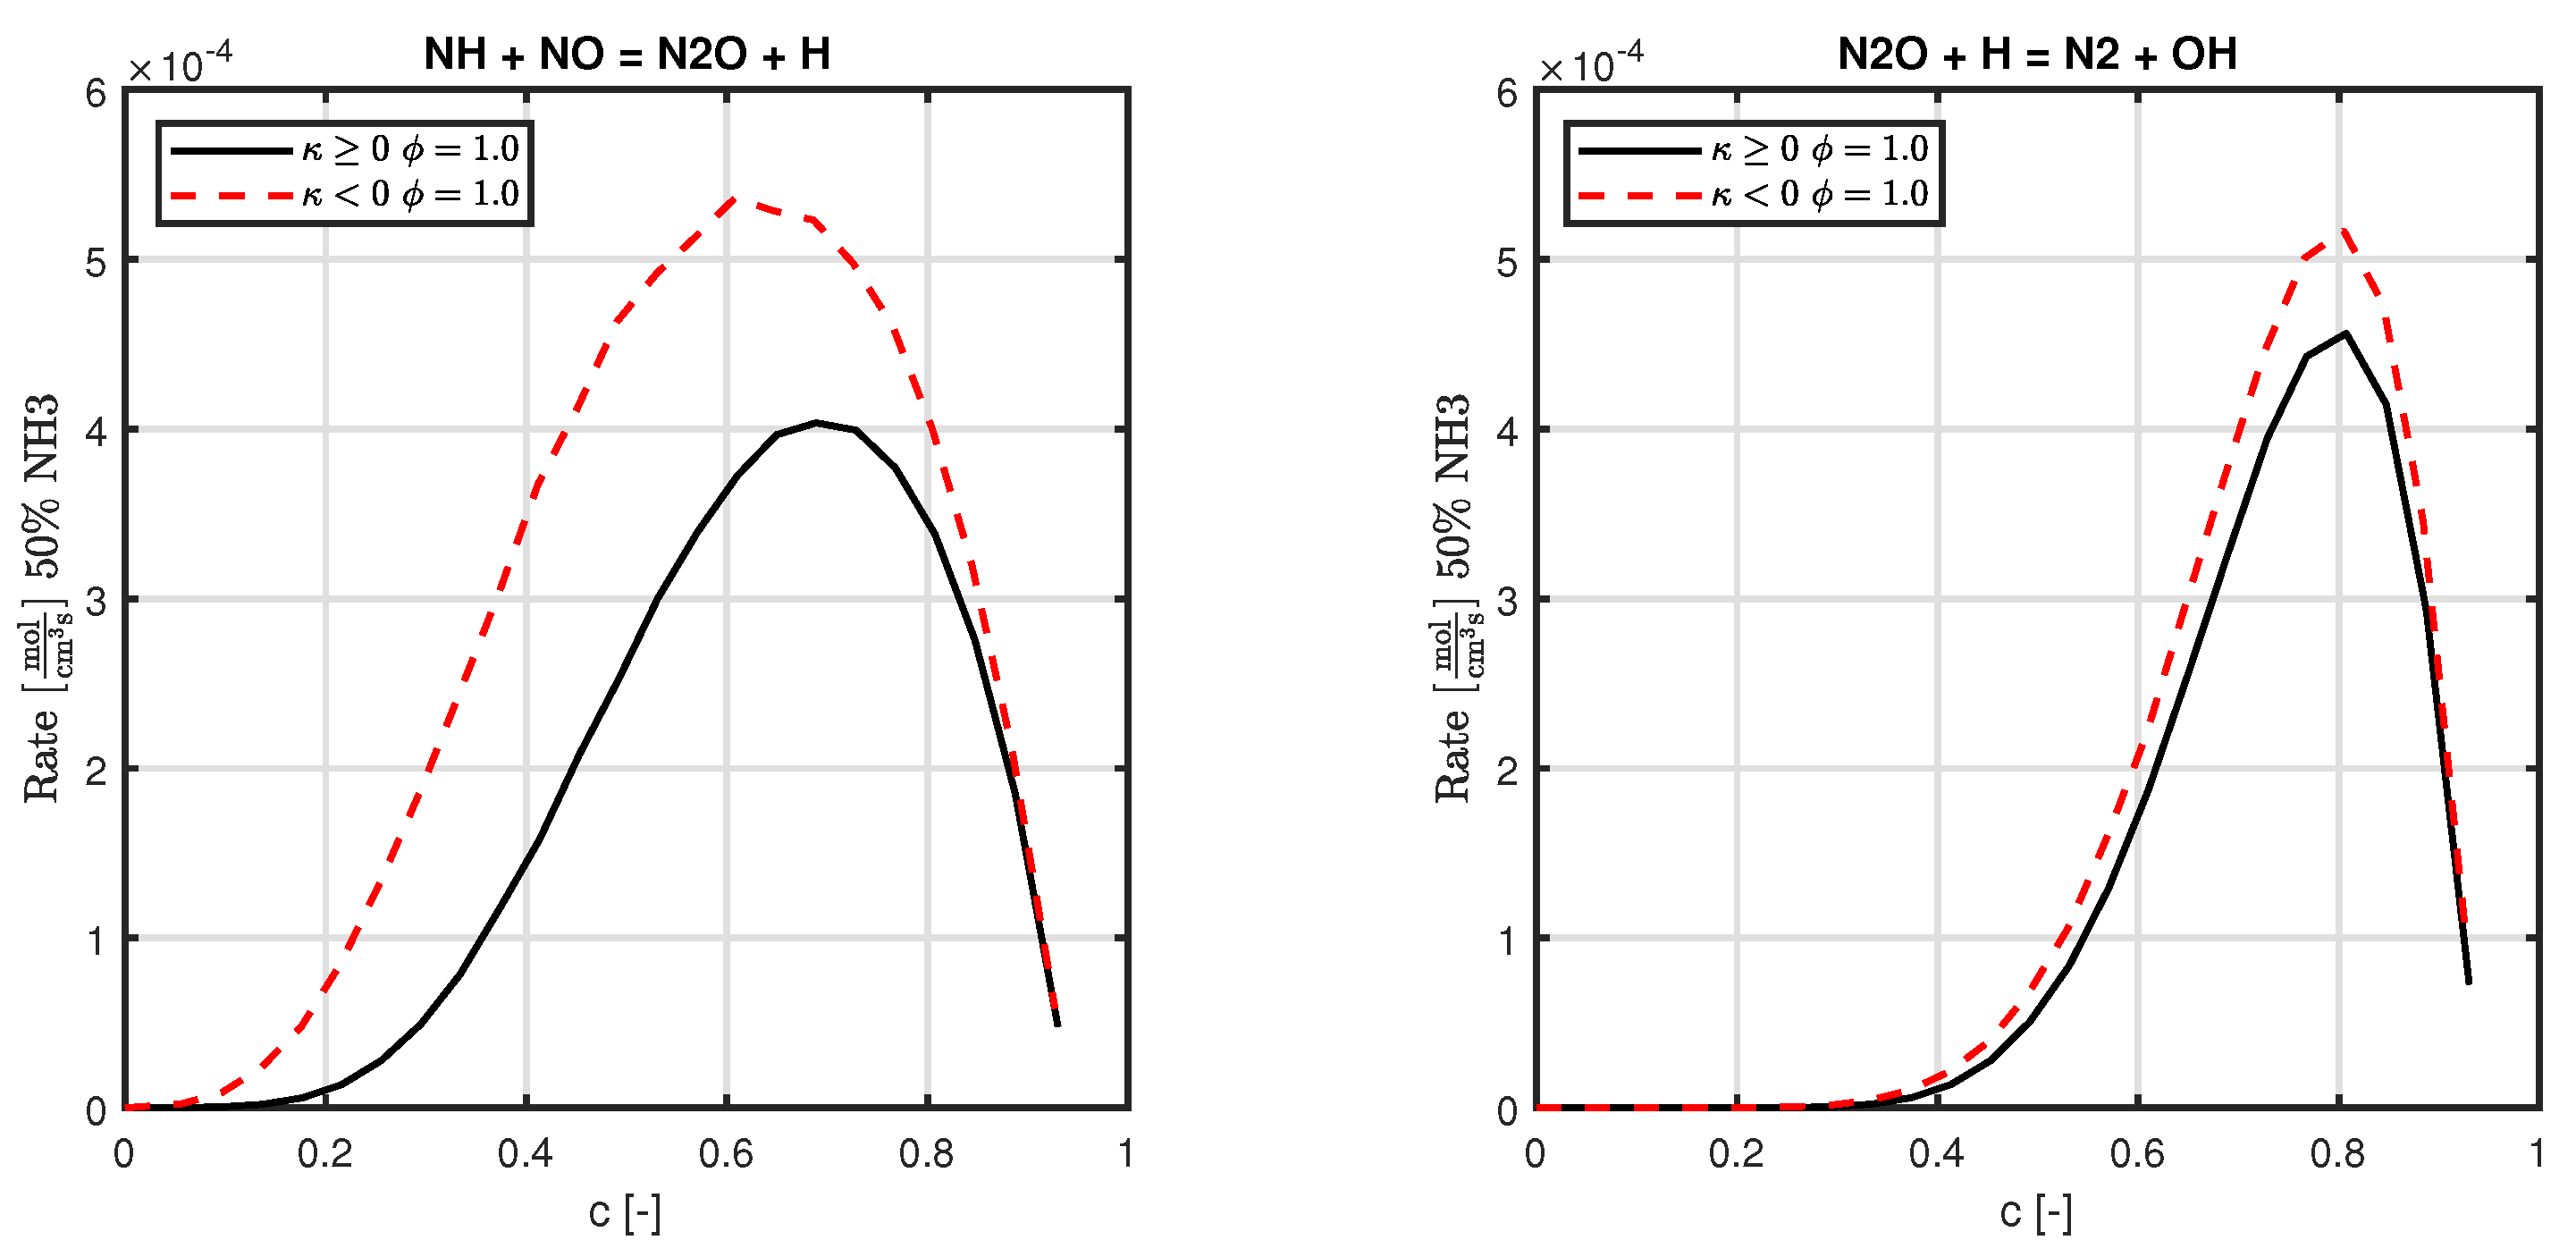
3.2. Curvature Effects on Flame Chemistry

In Figure 5, the conditional averages of the source term of hydrogen have been plotted. The averages are conditioned on the value of the progress variable, defined by the mass fraction of H2O and notated as c. The progress variable is normalized using the maximum and minimum values of the same from the corresponding one-dimensional unstrained flame solution.
c = Y H 2 O min ( Y H 2 O 1 D ) max ( Y H 2 O 1 D ) min ( Y H 2 O 1 D )
The average is split into two components based on if the curvature is negative or positive, and the values are scaled to the range of corresponding one dimensional unstrained flames, similar to the progress variable. We see that the consumption of hydrogen is enhanced compared to the laminar unstrained case for lean mixtures. Additionally, for stoichiometric cases, the maximum consumption rate is more or less similar to the unstrained case, but for the rich case, the consumption is reduced. This has to do with the increase in local equivalence ratio, as seen in Figure 4. Additionally, the consumption of hydrogen is most enhanced when the mixture has more ammonia. This is because the spread of the source terms increases as the amount of ammonia is decreased, so while the average might seem lower than the cases with more ammonia, the maximum values are significantly higher (≈5 to 6 times). Moreover, for all lean cases, the consumption of hydrogen is higher for positive curvature due to the enhanced equivalence ratio in these regions, as detailed by Rieth et al. [16]. However, this trend is flipped when the global equivalence ratio is increased.
As the equivalence ratio increases to stoichiometric and beyond, for a negative curvature, the flame has a higher consumption of hydrogen compared to the lean case. To understand this phenomenon, in Figure 6, the reaction rates of the most important reactions involving hydrogen molecules have been plotted in a similar process as Figure 5.
For globally lean cases, reactions involving H2 as reactants will see enhancement of the positive curvature as the local equivalence ratio increases for these curvature values. However, as the global ratio is increased, these reactions are not further enhanced for positive curvatures as the local equivalence ratio gets higher, and the points on the flame front with negative curvature are now closer to the stoichiometric ratio. An H radical reacts with NHx to produce H2. This reaction is enhanced again for a positive flame curvature, since the production of an H radical is higher in these areas; however, this does not reduce the H2 consumption since the reaction rates are approximately 3 to 5 times less than the consumption reaction:
H 2 + OH H 2 O + H
It is also of note that the difference in the rates for negative and positive curvatures is higher for the lean case, which can be related back to the fact that the flame surface for the rich case has lesser spread in the local equivalence ratio.
In Figure 7, the source terms of ammonia have been plotted, similar to Figure 5. We see that compared to the hydrogen source term, the deviation from the 1D unstrained laminar flame for NH3 source term is lower, as expected, since the diffusive mobility for NH3 is lesser compared to H2.
The trend observed for H2 is also seen here, where for positive curvature values, a higher rate of consumption is observed, whereas the stoichiometric and lean cases have the opposite trend. This is, however, only observed for the case with the most ammonia. We see that as the amount of ammonia is reduced, for the lean case, the trend in which there is higher consumption for positive curvature reverses, contrary to the behaviour of H2. The major consumption reaction of ammonia is:
NH 3 + OH NH 2 + H 2 O
The OH radical here becomes the rate limiting species. The main reactions through which OH is produced are:
H + O 2 OH + O
HO 2 + H 2 OH
H 2 O + O 2 OH
The reaction rates of these reactions have been plotted in Figure 8.
Equations (4) and (5) are OH production reactions which involve H radicals and are enhancedfor positive curvature for the highest amount of ammonia, while the opposite is observed when the amount of ammonia is reduced. Although we know that hydrogen radicals are focused at the flame front with negative curvature values [16], the contradictory behaviour observed for the most amount of ammonia could be due to the fact that the H radical pool in the cases with the most ammonia is sufficiently low such that it is consumed before any diffusion processes enable focussing of the radical in the negatively curved flame front. Since the H radical is produced more in the flame fronts with positive curvature, due to the increase in the local equivalence ratio, the OH-producing reactions involving H radicals are higher for a positive curvature. As the amount of ammonia is decreased, the H radical pool gets larger, and there is sufficient time for the diffusion process to focus H in the flame front with negative curvature, hence increasing the reaction rates of OH-producing reactions. This means that the NH3-consuming reactions increase for negative curvatures as the amount of ammonia is reduced. This also hints at a critical amount of hydrogen in the fuel mixture at which the signs of the curvature affect the concentration of H radicals. This has effects on NO reactions as well, which is discussed further. The final OH-producing reaction, Equation (6), involves H2O, which will have higher concentrations for positive curvatures due to a higher equivalence ratio, hence enhancing the reaction.
In Figure 9, the source term for NO has been plotted in the same way as the source terms for NH3 and H2. Similar to the source term of hydrogen, we see the enhancement of the NO source term for lean cases, while for rich cases, we see decreased NO production compared to corresponding one-dimensional unstrained flames.
We also see that for the highest amount of ammonia, the NO source term is only slightly different between positive and negative curvature values at higher values of c, and for lower values of c, there is a negative source term. The negative values are higher for negative curvature. However, when the amount of ammonia is reduced, increased NO production is seen for negative curvature values compared to positive curvature, and this difference increases with decreasing ammonia across all equivalence ratios. This is because the main reaction for NO production in lean conditions is
HNO + H NO + H 2
This reaction is enhanced for negative curvature for the case with the least amount of ammonia, while the opposite is observed for the highest amount of ammonia, as can be seen in Figure 10.
This can also be explained similarly as for the trend observed for the source term of NH3, where the H radical, although it is supposed to enhance reactions for negative curvatures, does not for the highest amount of ammonia due to a possible competition between the reaction and diffusion timescales of the species. Additionally, the increased consumption of NH3 for negative curvatures also causes fuel-borne NO emissions, which contributes to the increased production of NO. Finally, the negative source terms disappear as the percentage of ammonia is decreased, since the reduction of NO is rate-dependent on fundamental reactions involving NH3 [3]. For rich cases, Netzer et. al [15] observed that the main pathway for NO is through Thermal-NO, and since the adiabatic flame temperature for negative curvatures are higher, due to the local equivalence ratio being closer to stoichiometry, the NO production is also higher. The practical implication for this is that if the curvature of the flame can be controlled in the combustors, a balance between positively curved and negatively curved flame surfaces could be achieved where the NO production is reduced.
In Figure 11, the source terms of N2O have been plotted just as the source terms of NO. Interestingly, unlike previous source terms, the production of N2O remains consistently higher in the negatively curved regions across all equivalence ratios and mixture ratios.
This is because the major N2O producing reaction is
NH + NO N 2 O + H
This reaction is dependent on the NH mass fraction, which has higher a production for negative curvatures due to its dependence on H radicals, which are more concentrated for negative curvatures, as discussed in the previous sections. This has been plotted in Figure 12. At higher values of c, the source terms become negative, and here the sensitivity to the sign of the curvature becomes negligible. This is mainly governed by the reaction:
N 2 O + H N 2 + OH
The reaction has been plotted in the second figure in Figure 12.

3.3. Time Evolution of Temperature and Heat Release

The effects of preferential diffusion and turbulence on the flame also affect the heat release and temperature. By looking at time evolutions of these, the effects of the variations in flame chemistry observed in the previous section on the flame can be studied. In Figure 13, the conditional mean of the heat release at different non-dimensional values of r, the radius from the centre, has been plotted for 0.5, 0.75 and 1 eddy turn over time for a 50% ammonia and 50% hydrogen case.
The radius is non-dimensionalised using the maximum radius of the domain, D . Taking the case with ϕ = 0.8 , the peak heat release decreases as the flame expands. Additionally, we still see some heat release in the core of the kernel, which decreases as the equivalence ratio increases. As the equivalence ratio is increased to 1, there is a significant reduction in heat release from a 0.5 to 0.75 eddy turnover time, and then it more or less remains constant for 1 eddy turnover time. We also see that the flame brush widens over time as the equivalence ratio is increased, but not for the rich condition. For the rich flame, as the flame expands, the flame brush remains more or less constant, but the peak heat release increases. We also see that the peak moves closer to the centre.
In Figure 14, the conditional mean of the temperature at different non-dimensional values of r, the radius from the centre, has also been plotted. In all cases, we see a slight increase in temperature at the core. We see that in the lean case, the flame propagates the most in the 3 time instances we have selected for analysis. It is also of note that for an equivalence ratio 1 at a 0.5 eddy turnover time, the temperature gradient is quite high across the flame brush, which then smoothens out. This is correlated with the sharp peak in heat release seen in Figure 13. For the rich case, the flame propagation is low, which can be attributed to the fact that the flame chemistry is significantly suppressed, as discussed in the earlier sections.

4. Conclusions

A DNS study of turbulent premixed expanding ammonia-hydrogen flames in air was conducted. The study was conducted for various equivalence ratios and amounts of hydrogen in the fuel mixture at a constant Karlovitz number of 10.
The key conclusions from the study are:
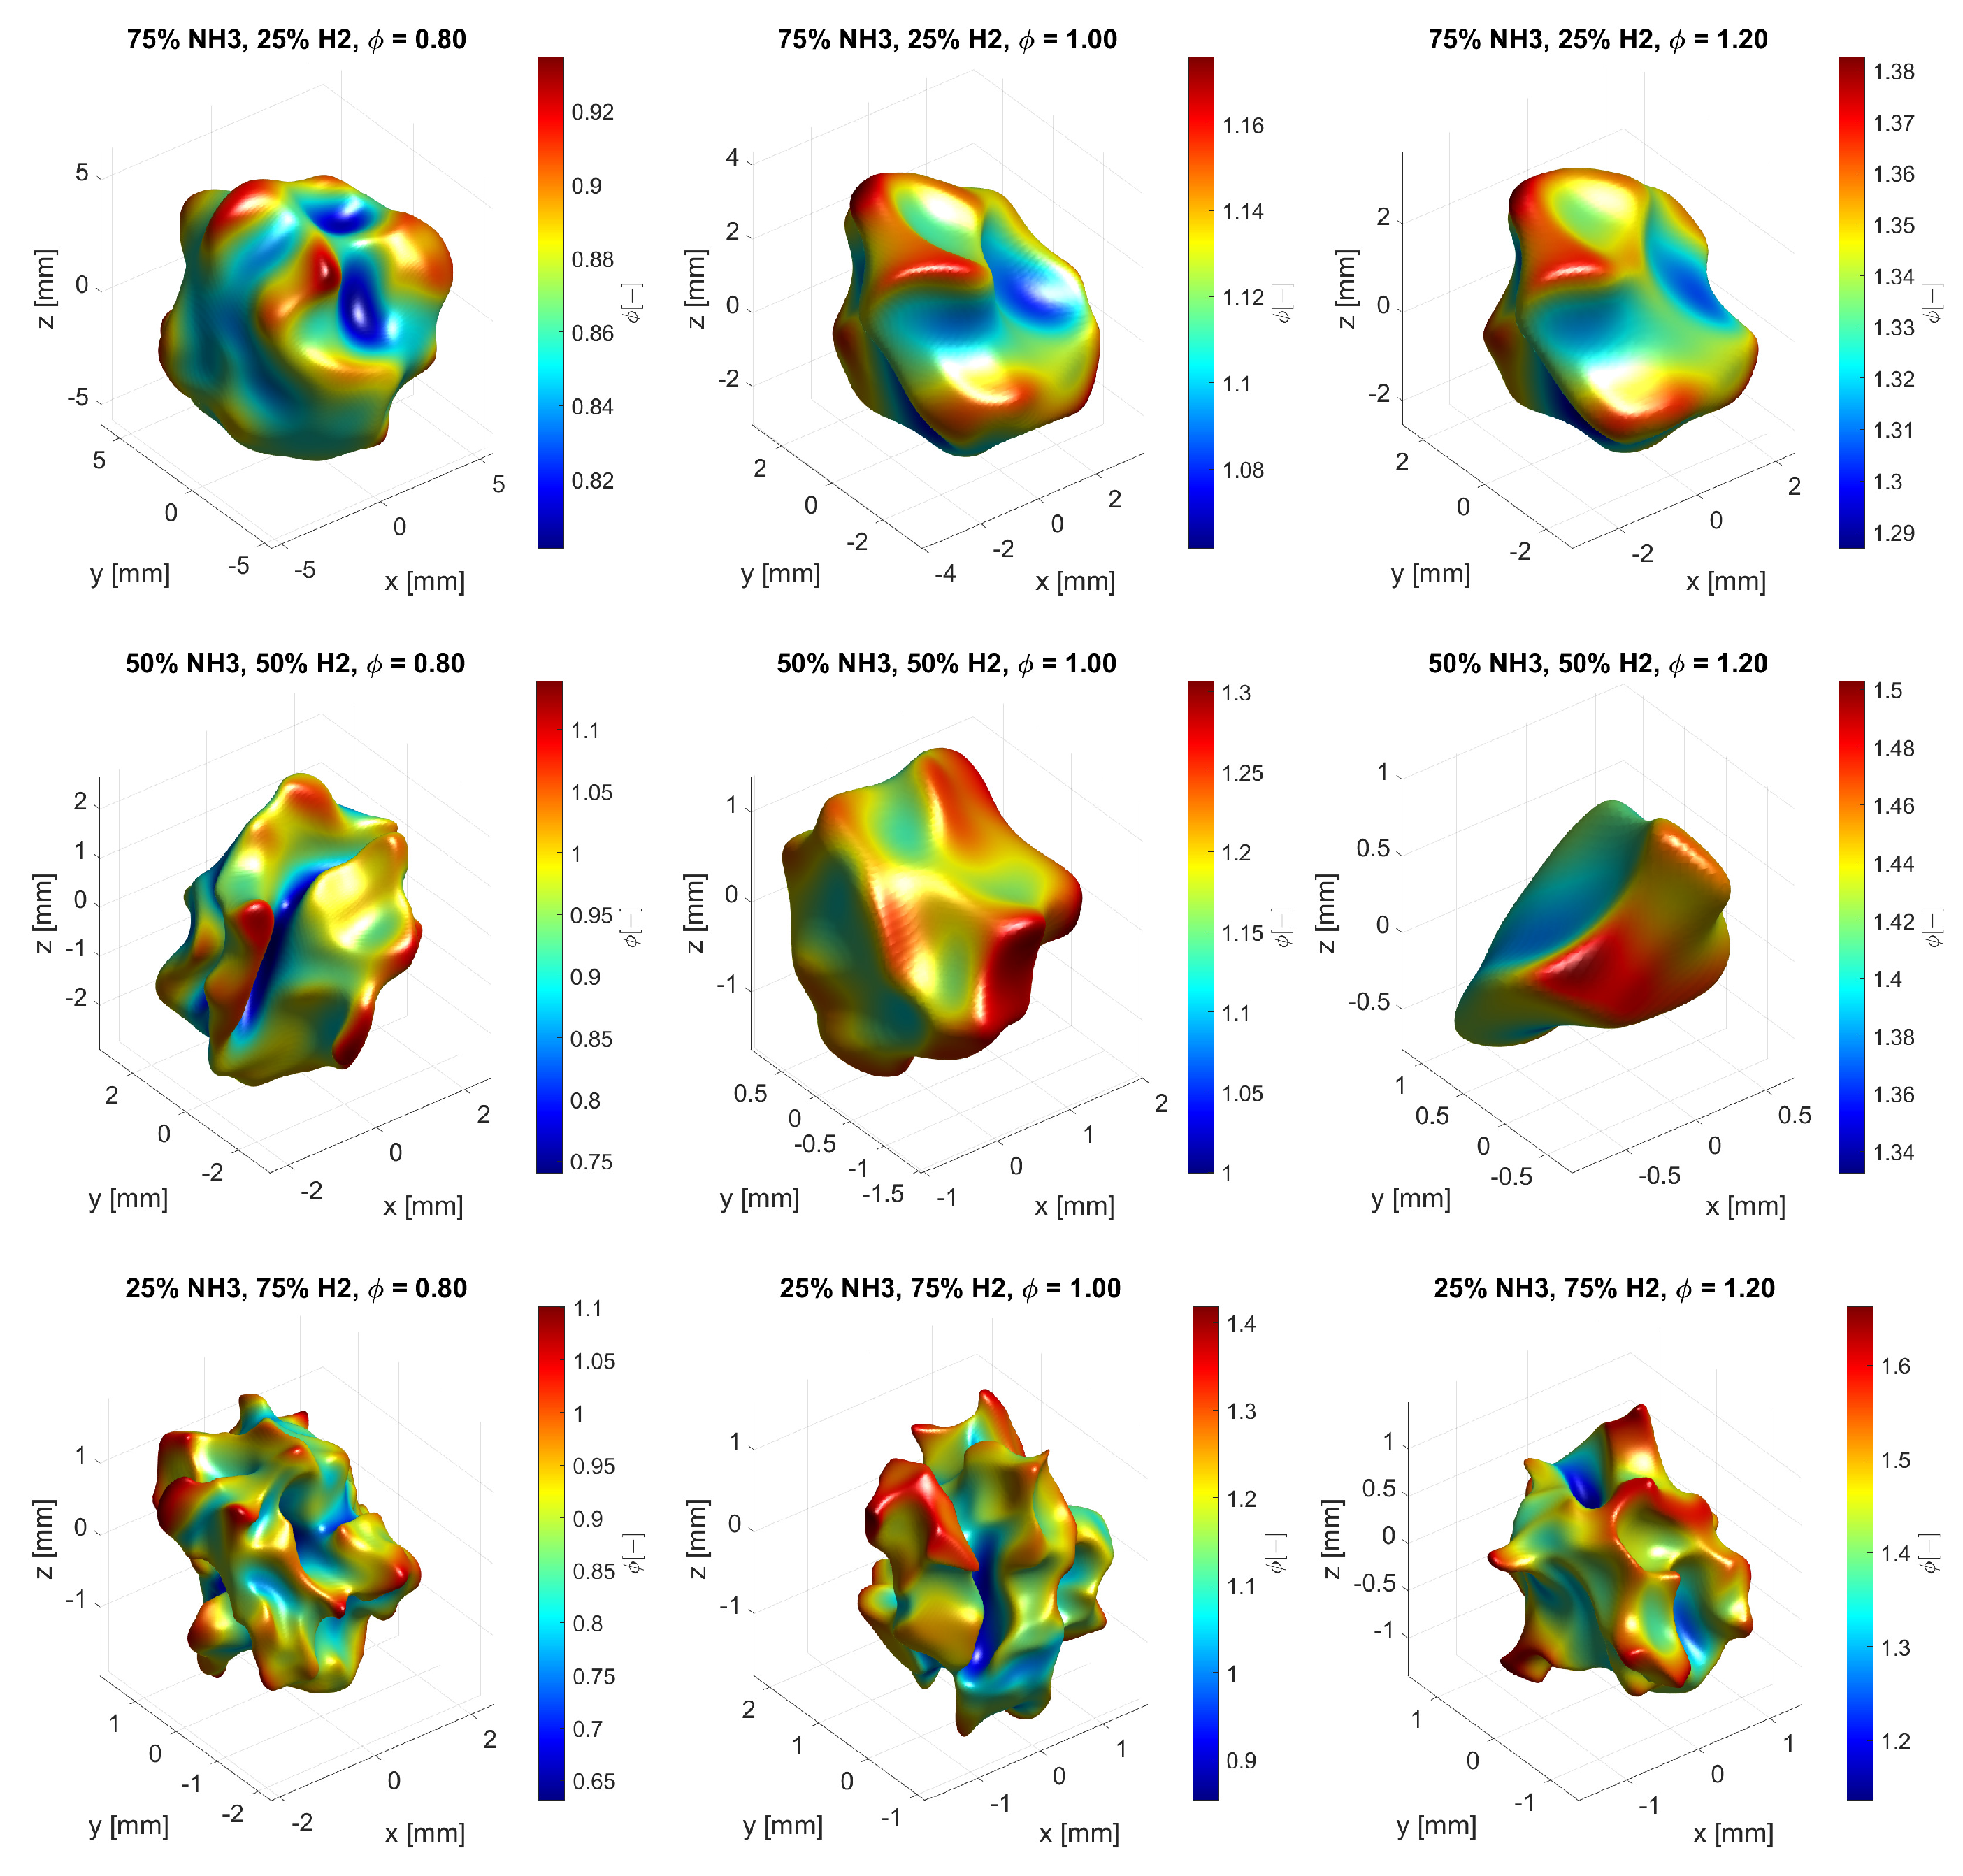
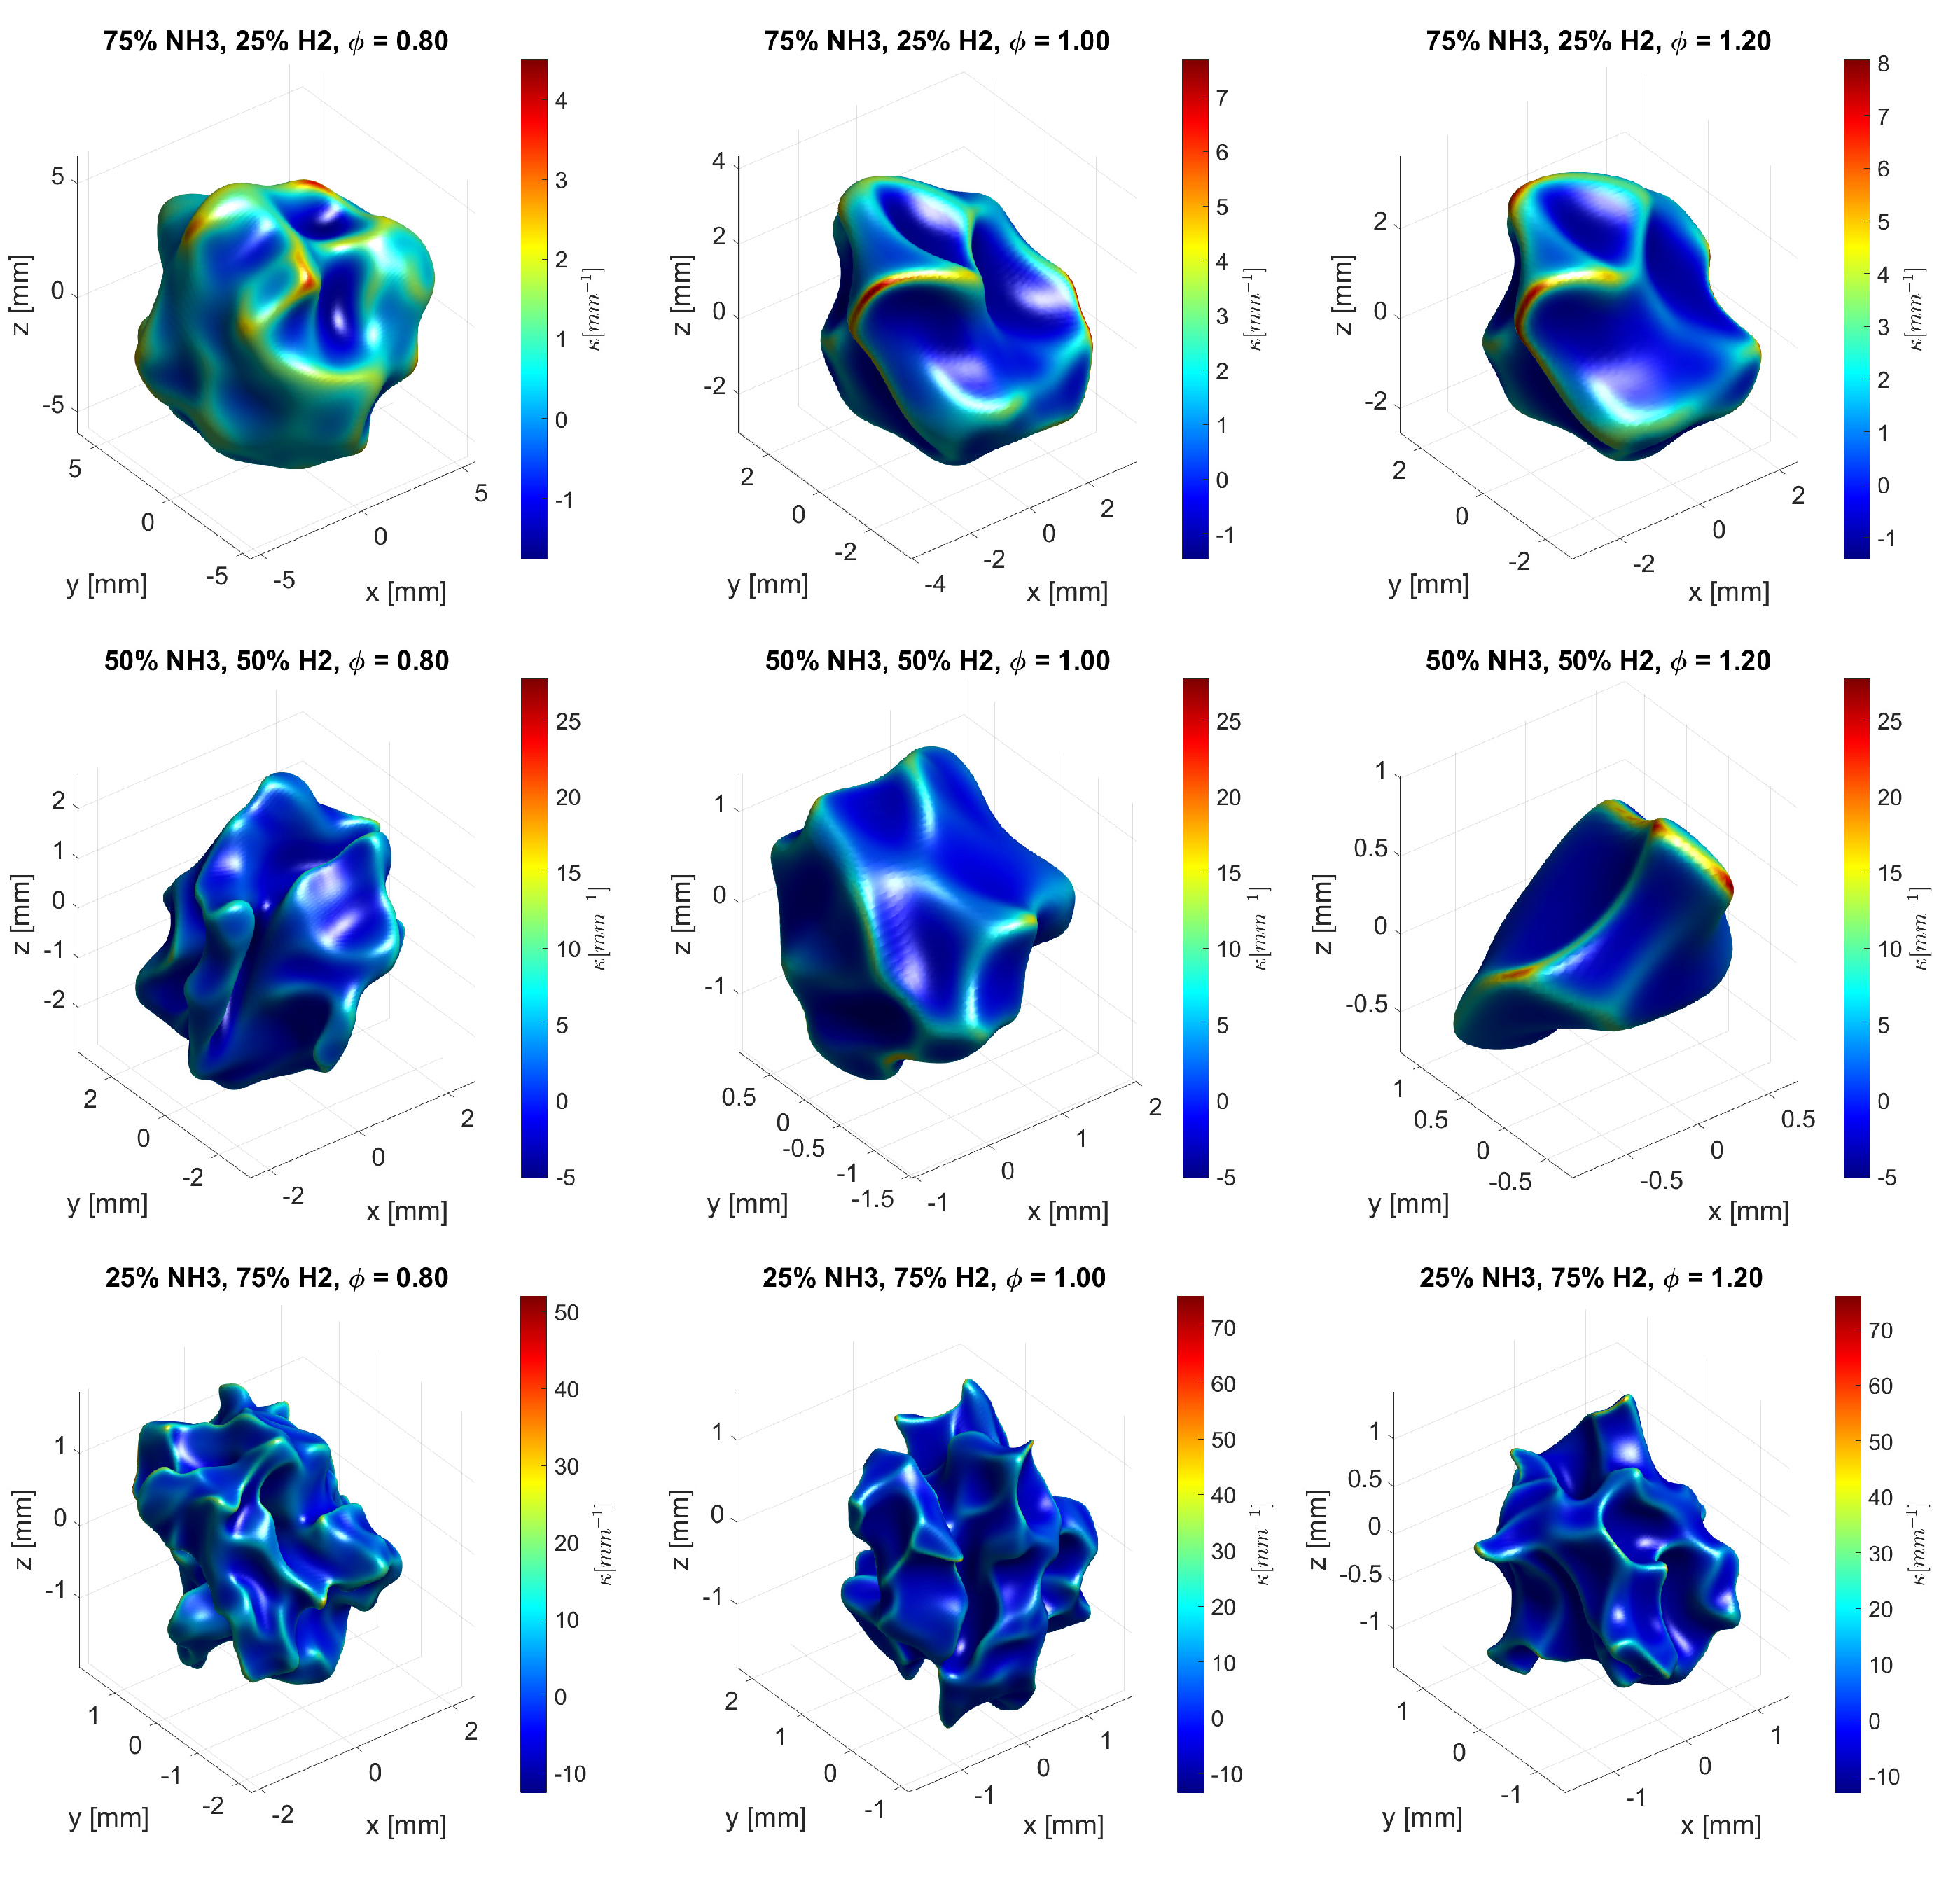
  • Due to variations in local equivalence ratio, the flame surface is distorted for all cases;
  • As the equivalence ratio is increased for each amount of hydrogen, the flame surface smoothens out, forming strongly curved leading edges with positive curvature;
  • As the amount of hydrogen is increased, the flame structure becomes more wrinkled due to the increase in spread of the local equivalence ratios as the preferential diffusion effects of hydrogen becomes stronger.
The effect of flame curvature on flame chemistry was also studied by looking at source terms of key species such as H2 and NH3 and NOx emissions.
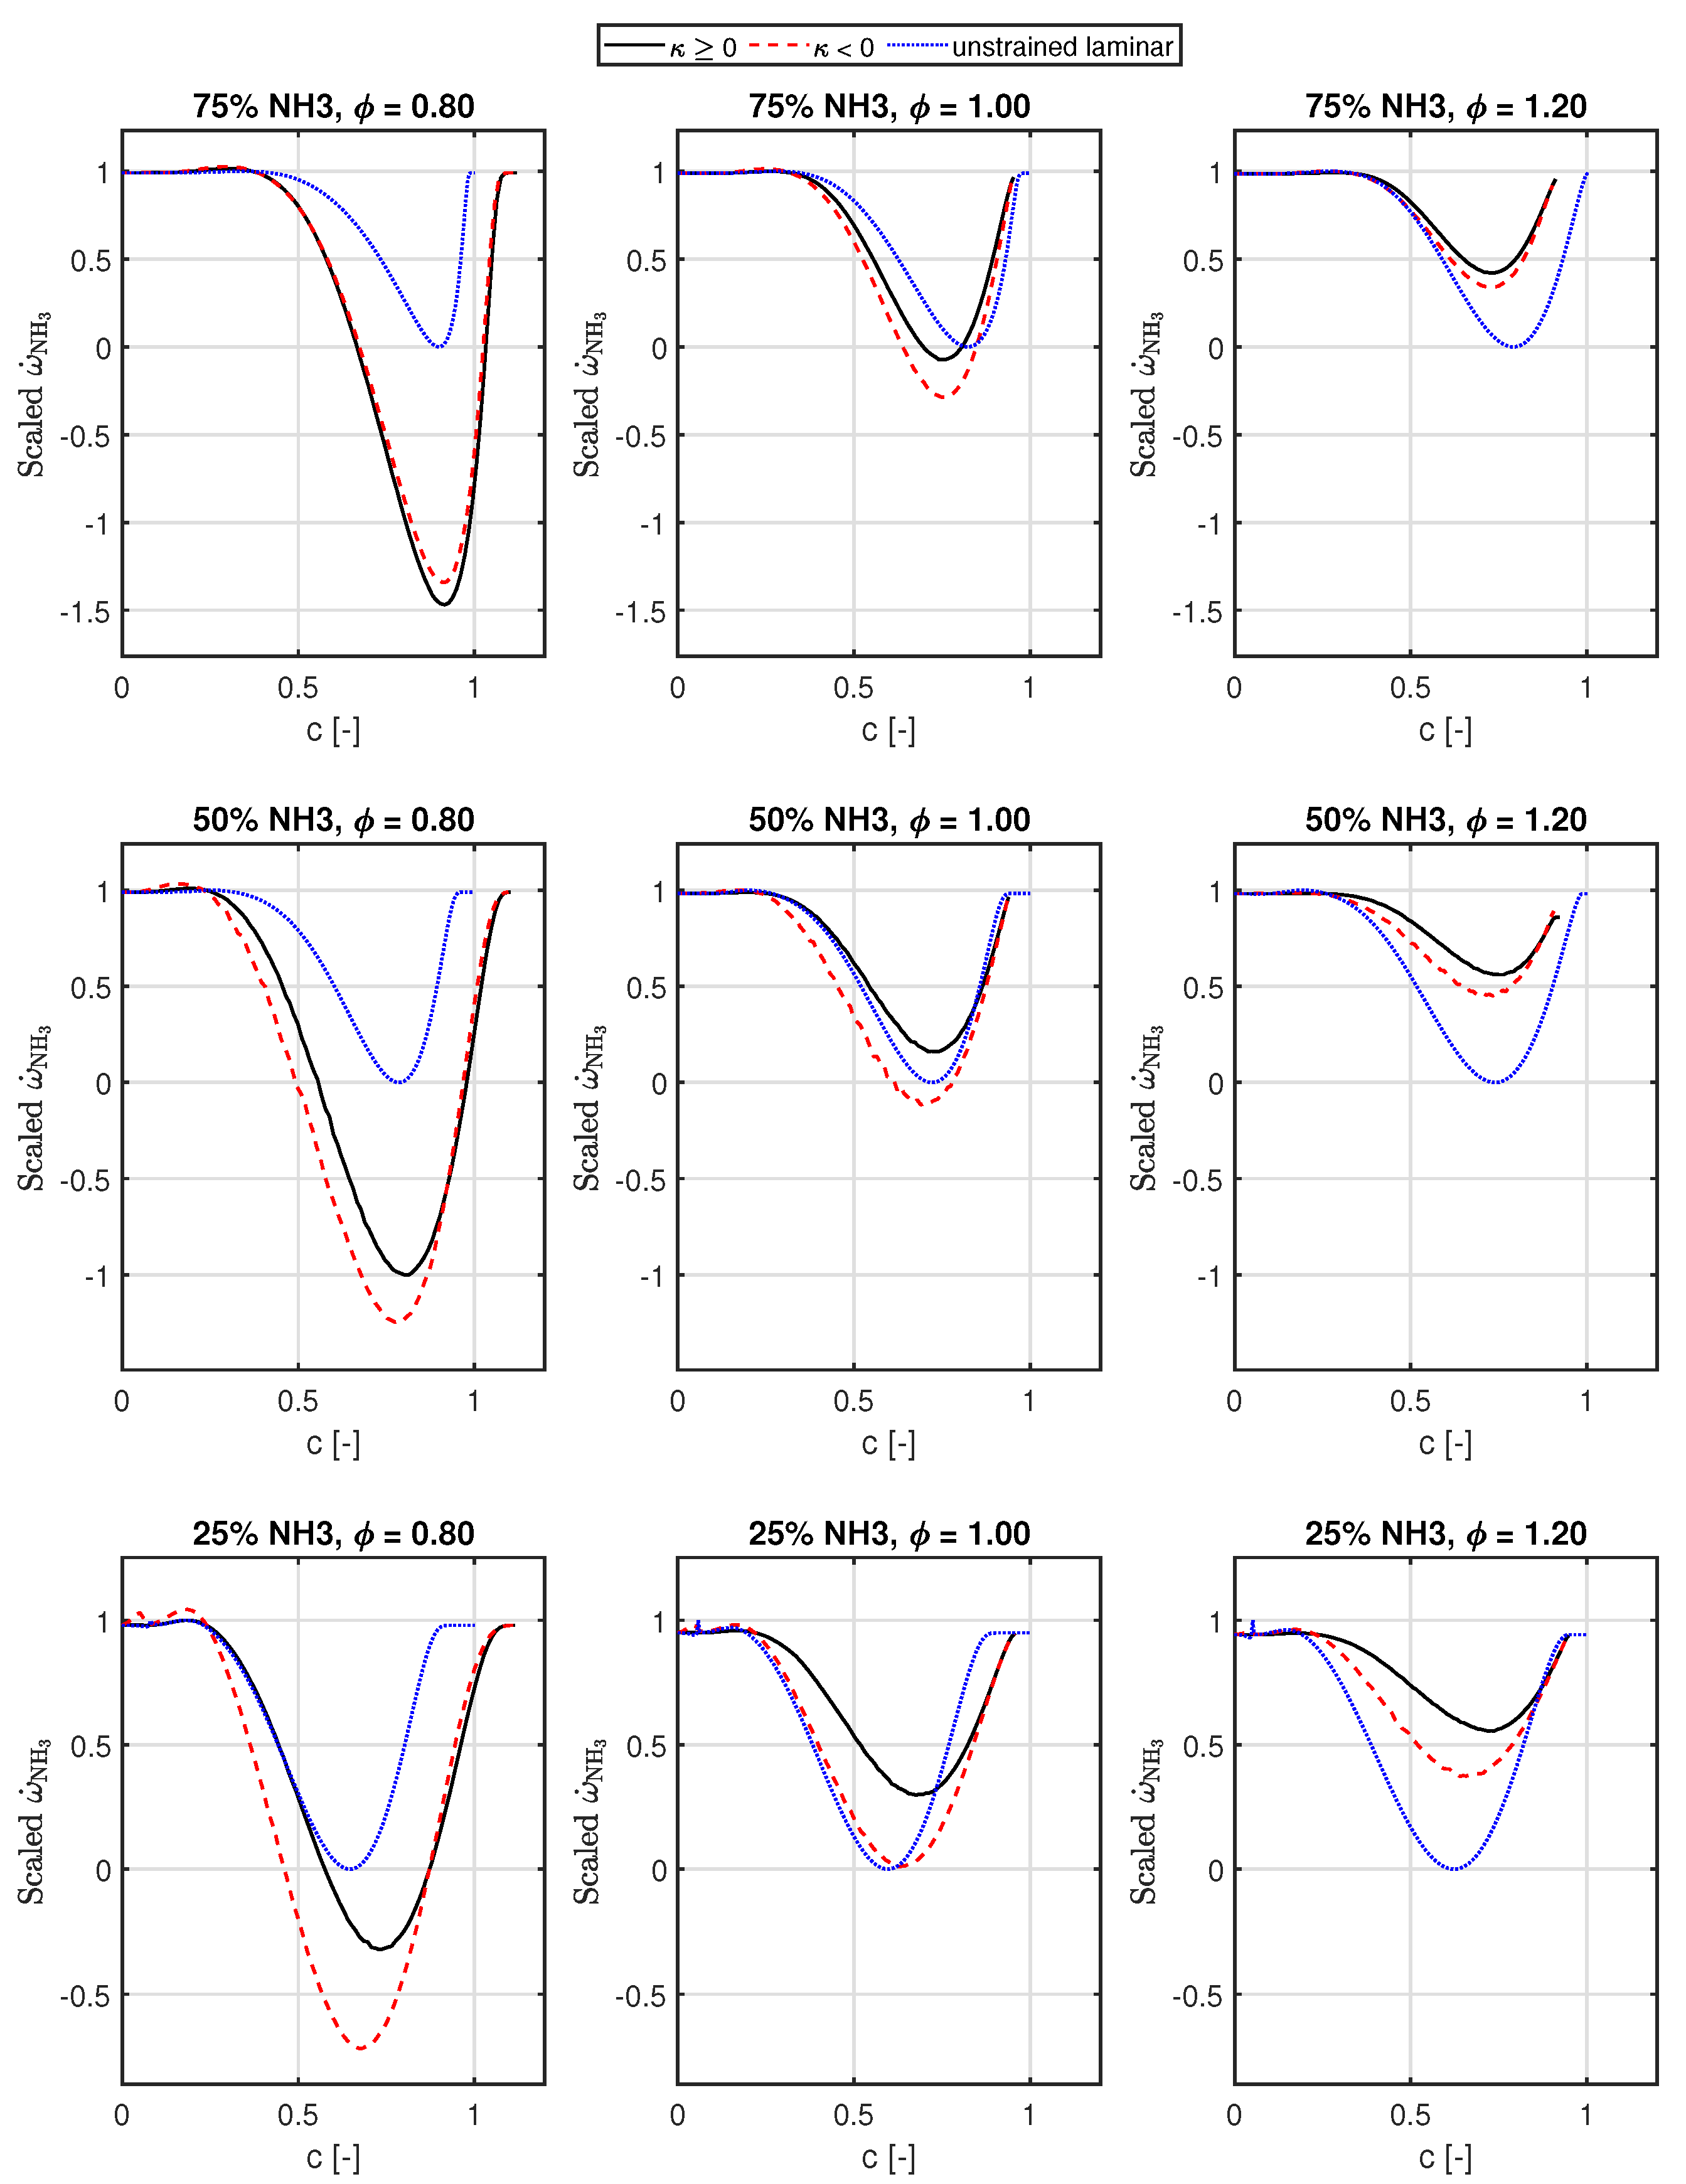
  • Due to the increase in equivalence ratio to near stoichiometry for all lean cases, the reactivity of all reactions are increased compared to the unstrained flat flame cases;
  • For all rich cases, the opposite is observed again as the equivalence ratio is pushed to high levels, decreasing reactivity;
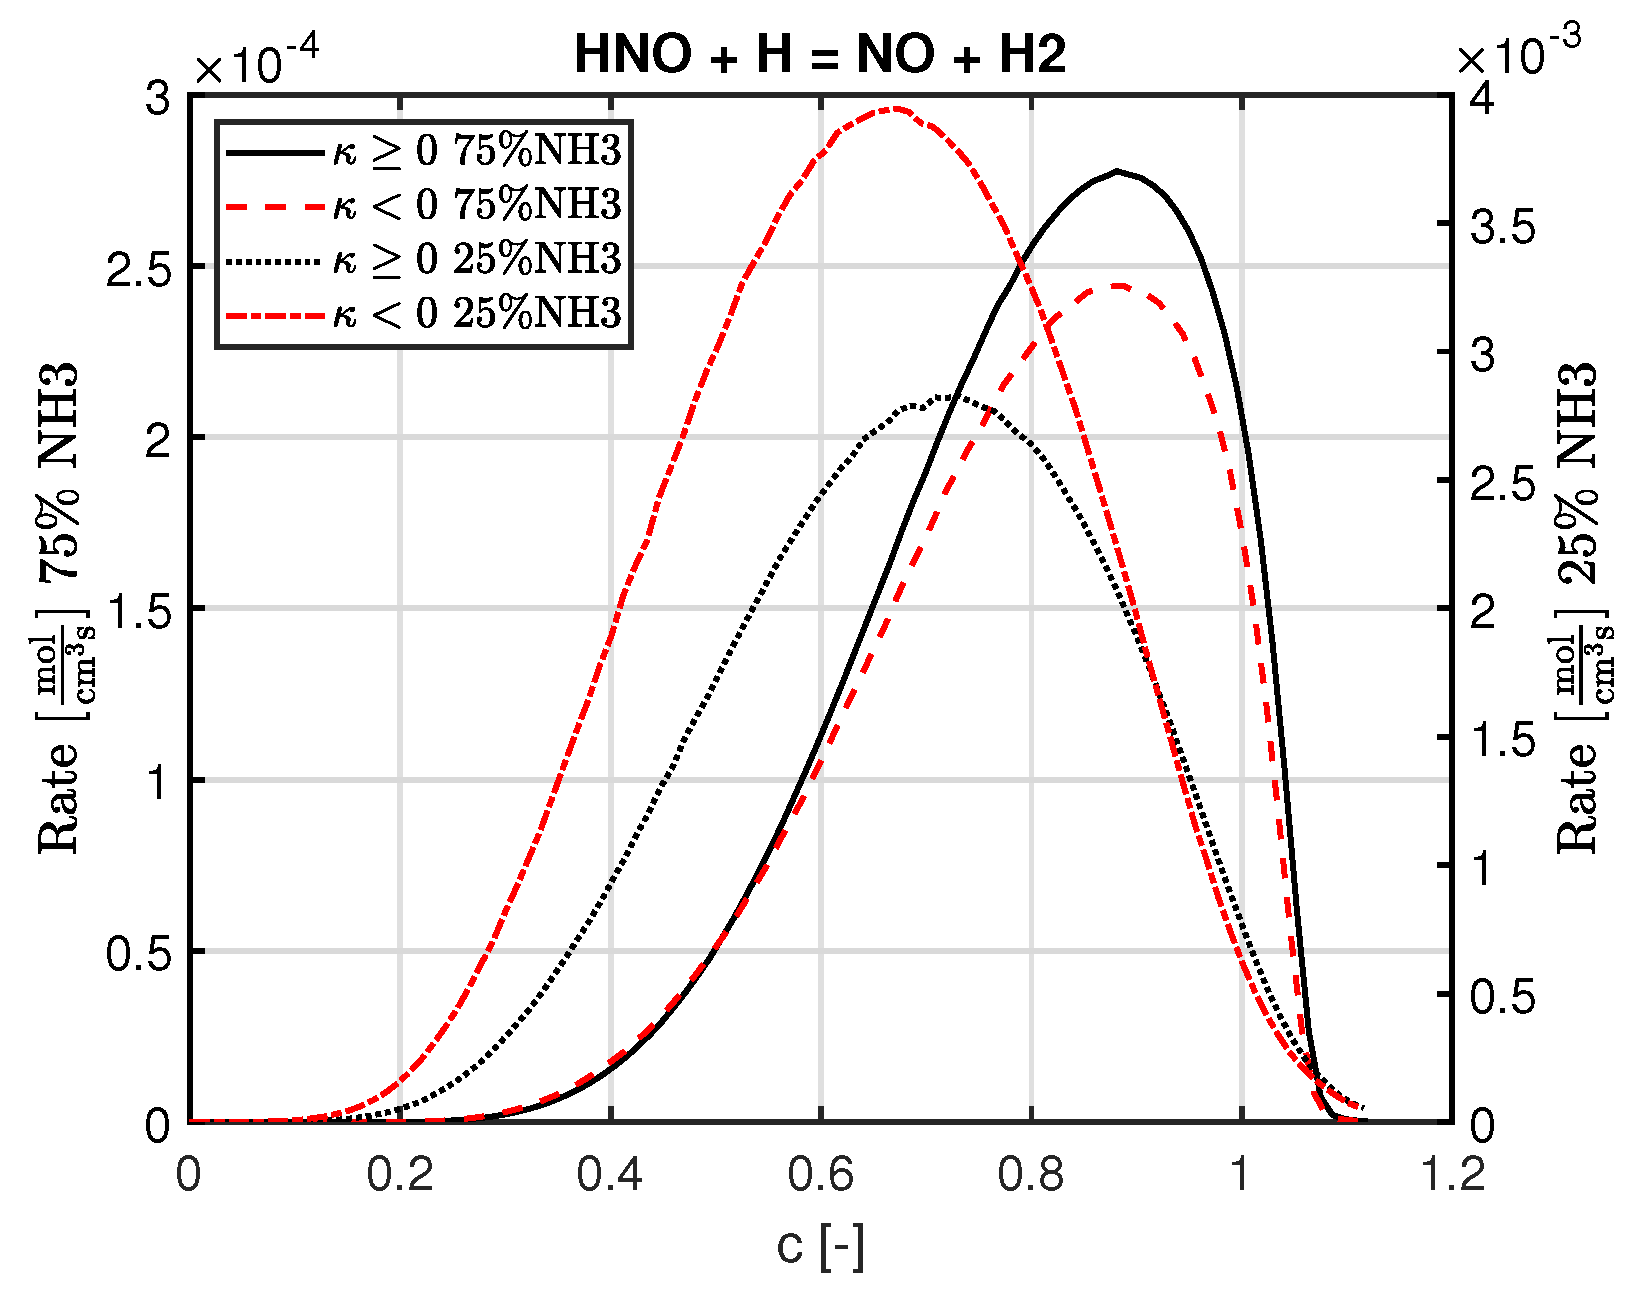
  • The effect of the sign of the curvature influences the flame significantly. The role of the H radical is quite important in this perspective;
  • The existence of a critical amount of hydrogen in the fuel mixture is observed, after which the trend of some reactions with respect to the sign of the curvature is flipped speculated to be due to competing reactive and diffusive timescales of hydrogen radicals.
The effect of curvature on NO emissions also showed that NO source terms showed significant sensitivity to the sign of the curvature, with the rates increasing in the negatively curved regions significantly.
Averaged temperature and heat release profiles over r were also studied. The analysis showed that at higher equivalence ratios, flame propagation is lower, which can be correlated to turbulence chemistry interactions.
Further research is required to quantify some of these effects and to study possible consequences in practical applications. Additionally, similarly to Rieth et al. [16], the effect of diffusion parameters of molecular and atomic hydrogen needs to be studied for higher amounts of hydrogen in the fuel mixture to study the impact on the flame chemistry. The effect of explicitly including Soret and Dufour diffusion effects on the flame chemistry is also needed to understand implications of various diffusion models on the accuracy of current numerical models. Further study is also needed to fully understand the correlation of H radical concentration and curvature based on the fuel mixture. Additionally, the flame structure can be further quantitatively studied with comparisons of flame surface area. Finally, experimental comparisons have been planned for the cases studied in this paper.

Author Contributions

Conceptualization, N.M. and R.B.; methodology, N.M.; formal analysis, N.M. and R.B.; investigation, N.M.; resources, R.B.; writing—original draft preparation, N.M.; writing—review and editing, N.M. and R.B.; visualization, N.M.; supervision, R.B.; project administration, R.B.; funding acquisition, R.B. All authors have read and agreed to the published version of the manuscript.

Funding

This publication was made possible by receiving funding from the European Union’s Horizon 2020 Research and Innovation Programme under Grant Agreement N. 884157.

Institutional Review Board Statement

Not applicable.

Informed Consent Statement

Not applicable.

Data Availability Statement

Not applicable.

Conflicts of Interest

The authors declare no conflict of interest.

References

  1. Ramage, J. Energy: A Guidebook; Oxford University Press: Oxford, UK, 1998; Volume 35, pp. 35–3899. [Google Scholar] [CrossRef]
  2. Felderhoff, M.; Weidenthaler, C.; Von Helmolt, R.; Eberle, U. Hydrogen storage: The remaining scientific and technological challenges. Phys. Chem. Chem. Phys. 2007, 9, 2643–2653. [Google Scholar] [CrossRef] [PubMed]
  3. Valera-Medina, A.; Xiao, H.; Owen-Jones, M.; David, W.I.; Bowen, P.J. Ammonia for power. Prog. Energy Combust. Sci. 2018, 69, 63–102. [Google Scholar] [CrossRef]
  4. Hussein, N.A.; Valera-Medina, A.; Alsaegh, A.S. Ammonia-Hydrogen Combustion in a Swirl Burner with Reduction of NOx Emissions. Energy Procedia 2019, 158, 2305–2310. [Google Scholar] [CrossRef]
  5. Kobayashi, H.; Hayakawa, A.; Somarathne, K.D.A.; Okafor, E.C. Science and technology of ammonia combustion. Proc. Combust. Inst. 2019, 37, 109–133. [Google Scholar] [CrossRef]
  6. Tang, G.; Jin, P.; Bao, Y.; Chai, W.S.; Zhou, L. Experimental investigation of premixed combustion limits of hydrogen and methane additives in ammonia. Int. J. Hydrogen Energy 2021, 46, 20765–20776. [Google Scholar] [CrossRef]
  7. Wiseman, S.; Rieth, M.; Gruber, A.; Dawson, J.R.; Chen, J.H. A comparison of the blow-out behavior of turbulent premixed ammonia/hydrogen/nitrogen-air and methane–air flames. Proc. Combust. Inst. 2021, 38, 2869–2876. [Google Scholar] [CrossRef]
  8. Mashruk, S.; Xiao, H.; Valera-Medina, A. Rich-Quench-Lean model comparison for the clean use of humidified ammonia/hydrogen combustion systems. Int. J. Hydrogen Energy 2021, 46, 4472–4484. [Google Scholar] [CrossRef]
  9. Bioche, K.; Bricteux, L.; Bertolino, A.; Parente, A.; Blondeau, J. Large Eddy Simulation of rich ammonia/hydrogen/air combustion in a gas turbine burner. Int. J. Hydrogen Energy 2021, 46, 39548–39562. [Google Scholar] [CrossRef]
  10. Somarathne, K.D.K.A.; Hatakeyama, S.; Hayakawa, A.; Kobayashi, H. Numerical study of a low emission gas turbine like combustor for turbulent ammonia/air premixed swirl flames with a secondary air injection at high pressure. Int. J. Hydrogen Energy 2017, 42, 27388–27399. [Google Scholar] [CrossRef]
  11. Otomo, J.; Koshi, M.; Mitsumori, T.; Iwasaki, H.; Yamada, K. Chemical kinetic modeling of ammonia oxidation with improved reaction mechanism for ammonia/air and ammonia/hydrogen/air combustion. Int. J. Hydrogen Energy 2018, 43, 3004–3014. [Google Scholar] [CrossRef]
  12. Xiao, H.; Valera-Medina, A.; Bowen, P.J. Study on premixed combustion characteristics of co-firing ammonia/methane fuels. Energy 2017, 140, 125–135. [Google Scholar] [CrossRef]
  13. Lee, J.H.; Kim, J.H.; Park, J.H.; Kwon, O.C. Studies on properties of laminar premixed hydrogen-added ammonia/air flames for hydrogen production. Int. J. Hydrogen Energy 2010, 35, 1054–1064. [Google Scholar] [CrossRef]
  14. Nozari, H.; Karabeyoğlu, A. Numerical study of combustion characteristics of ammonia as a renewable fuel and establishment of reduced reaction mechanisms. Fuel 2015, 159, 223–233. [Google Scholar] [CrossRef]
  15. Netzer, C.; Ahmed, A.; Gruber, A.; Løvås, T. Curvature effects on NO formation in wrinkled laminar ammonia/hydrogen/nitrogen-air premixed flames. Combust. Flame 2021, 232, 111520. [Google Scholar] [CrossRef]
  16. Rieth, M.; Gruber, A.; Williams, F.A.; Chen, J.H. Enhanced burning rates in hydrogen-enriched turbulent premixed flames by diffusion of molecular and atomic hydrogen. Combust. Flame 2021, 239, 111740. [Google Scholar] [CrossRef]
  17. Jiang, Y.; Gruber, A.; Seshadri, K.; Williams, F. An updated short chemical-kinetic nitrogen mechanism for carbon-free combustion applications. Int. J. Energy Res. 2020, 44, 795–810. [Google Scholar] [CrossRef]
  18. Lele, S.K. Compact finite difference schemes with spectral-like resolution. J. Comput. Phys. 1992, 103, 16–42. [Google Scholar] [CrossRef]
  19. de Lange, H.C. Inviscid flow modelling using asymmetric implicit finite difference schemes. Int. J. Numer. Methods Fluids 2005, 49, 1033–1051. [Google Scholar] [CrossRef]
  20. Kennedy, C.A.; Carpenter, M.H.; Lewis, R.M. Low-storage, explicit Runge–Kutta schemes for the compressible Navier–Stokes equations. Appl. Numer. Math. 2000, 35, 177–219. [Google Scholar] [CrossRef] [Green Version]
  21. Poinsot, T.J.; Lele, S.K. Boundary conditions for direct simulations of compressible viscous flows. J. Comput. Phys. 1992, 101, 104–129. [Google Scholar] [CrossRef]
  22. Yu, K.; Colonius, T.; Pullin, D.I.; Winckelmans, G. Dynamics and decay of a spherical region of turbulence in free space. J. Fluid Mech. 2021, 907, A13. [Google Scholar] [CrossRef]
  23. de Swart, J.A.M. Modeling and Analysis of Flame Stretch and Preferential Diffusion in Premixed Flames; Technische Universiteit Eindhoven: Eindhoven, The Netherlands, 2009. [Google Scholar]
  24. Somers, L. The Simulation of flat Flames with Detailed and Reduced Chemical models. Ph.D. Thesis, Technische Universiteit Eindhoven, Eindhoven, The Netherlands, 1994. [Google Scholar] [CrossRef]
  25. Peters, N. Turbulent Combustion; Cambridge University Press: Cambridge, UK, 2000. [Google Scholar] [CrossRef]
  26. Ern, A.; Giovangigli, V. EGLIB: A General-Purpose Fortran Library for Multicomponent Transport Property Evaluation, CERMICS Internal Report; Technical Report 96-51; 1996; Available online: https://www.cmap.polytechnique.fr/www.eglib/manual.ps (accessed on 21 June 2022).
  27. Konnov, A.A. Implementation of the NCN pathway of prompt-NO formation in the detailed reaction mechanism. Combust. Flame 2009, 156, 2093–2105. [Google Scholar] [CrossRef]
  28. Tian, Z.; Li, Y.; Zhang, L.; Glarborg, P.; Qi, F. An experimental and kinetic modeling study of premixed NH3/CH4/O2/Ar flames at low pressure. Combust. Flame 2009, 156, 1413–1426. [Google Scholar] [CrossRef]
  29. Mendiara, T.; Glarborg, P. Ammonia chemistry in oxy-fuel combustion of methane. Combust. Flame 2009, 156, 1937–1949. [Google Scholar] [CrossRef]
  30. Okafor, E.C.; Naito, Y.; Colson, S.; Ichikawa, A.; Kudo, T.; Hayakawa, A.; Kobayashi, H. Experimental and numerical study of the laminar burning velocity of CH4–NH3–air premixed flames. Combust. Flame 2018, 187, 185–198. [Google Scholar] [CrossRef]
  31. Glarborg, P.; Miller, J.A.; Ruscic, B.; Klippenstein, S.J. Modeling nitrogen chemistry in combustion. Prog. Energy Combust. Sci. 2018, 67, 31–68. [Google Scholar] [CrossRef] [Green Version]
  32. Han, X.; Wang, Z.; He, Y.; Zhu, Y.; Cen, K. Experimental and kinetic modeling study of laminar burning velocities of NH3/syngas/air premixed flames. Combust. Flame 2020, 213, 1–13. [Google Scholar] [CrossRef]
  33. Shrestha, K.P.; Lhuillier, C.; Barbosa, A.A.; Brequigny, P.; Contino, F.; Mounaïm-Rousselle, C.; Seidel, L.; Mauss, F. An experimental and modeling study of ammonia with enriched oxygen content and ammonia/hydrogen laminar flame speed at elevated pressure and temperature. Proc. Combust. Inst. 2021, 38, 2163–2174. [Google Scholar] [CrossRef]
Figure 1. Characteristics of the initial turbulent field. (a) Turbulent energy spectrum of a sample turbulence field. (b) Decay of turbulence intensity. The rms velocity has been non-dimensionalised with initial rms velocity and the time has been non-dimensionalised with τ , the eddy turnover time.
Energies 15 04749 g001
Figure 2. Flame structure of all the cases after one eddy turnover time. The iso-surface is taken at the inner layer temperature calculated from a one-dimensional freely propagating flat flame. The surface is coloured with curvature values.
Energies 15 04749 g002
Figure 3. Probability density functions of curvature on the flame surface (isotherms at laminar inner layer temperature).
Energies 15 04749 g003
Figure 4. Iso-surfaces of the flame kernel taken after one eddy turnover time, coloured with local equivalence ratio. Significant deviation from the global equivalence ratio can be seen from this image.
Energies 15 04749 g004
Figure 5. Conditional average of the source term of hydrogen split by positive and negative curvature.
Energies 15 04749 g005
Figure 6. Reaction rates of reactions involving H2 doubly conditioned on curvature and progress variables for 75% ammonia case.
Energies 15 04749 g006
Figure 7. Conditional average of the source term of ammonia split by positive and negative curvature.
Energies 15 04749 g007
Figure 8. Reaction rates of key reactions involving the consumption of NH3 and production of OH radicals at a constant equivalence ratio of 0.8 for 75% and 25% NH3. The y-axis for the 25% case is on the right.
Energies 15 04749 g008
Figure 9. Conditional average of the source term of NO split by positive and negative curvature.
Energies 15 04749 g009
Figure 10. Reaction rates of NO-producing reaction for a constant equivalence ratio of 0.8 for 75% and 25% NH3. The rates for the 25% NH3 case have been plotted on the right y-axis.
Energies 15 04749 g010
Figure 11. Conditional average of the source term of N2O split by positive and negative curvatures.
Energies 15 04749 g011
Figure 12. Conditional averages split by the sign of the curvature for reaction rates of N2O reactions for 50% ammonia at a stoichiometric equivalence ratio.
Energies 15 04749 g012
Figure 13. Conditional average of heat release averaged over r for 50% hydrogen.
Energies 15 04749 g013
Figure 14. Conditional average of temperature averaged over r for 50% hydrogen.
Energies 15 04749 g014
Table 1. Database of the simulation parameters used for the DNS studies.
Case% NH3 ϕ T il [K] s l [m/s] l f [m] v s l l t l f Re v [m/s] η [m] τ [s]
A750.817630.091.51 × 10 3 4.6414.640.4254.78 × 10 4 3.55 × 10 3
B751.018470.141.13 × 10 3 4.6414.640.6733.58 × 10 4 1.68 × 10 3
C751.216850.171.02 × 10 3 4.6414.640.7773.22 × 10 4 1.31 × 10 3
D500.816440.276.08 × 10 4 4.6414.641.2581.92 × 10 4 4.83 × 10 4
E501.017400.395.14 × 10 4 4.6414.641.8181.63 × 10 4 2.83 × 10 4
F501.217490.434.94 × 10 4 4.6414.641.9781.56 × 10 4 2.50 × 10 4
G250.814420.683.69 × 10 4 4.6414.643.1401.17 × 10 4 1.17 × 10 4
H251.014930.973.38 × 10 4 4.6414.644.4921.07 × 10 4 7.53 × 10 5
I251.215341.133.12 × 10 4 4.6414.645.2499.85 × 10 5 5.93 × 10 5
Publisher’s Note: MDPI stays neutral with regard to jurisdictional claims in published maps and institutional affiliations.

