Abstract
The maximum entropy bootstrap for time series is applied in this study to investigate the nexus between carbon emissions from electricity generation and the gross domestic product, using a bivariate framework for eight Middle Eastern countries between 1995 and 2017. The sample under study includes oil-producing countries such as Bahrain, Iran, Iraq, Kuwait, Oman, Qatar, Saudi Arabia, and United Arab Emirates. As the electricity generation in these economies relies mainly on oil and gas, finding out the existence and direction of the relationship between the two considered variables has remarkable implications for policymakers and governments in these countries to achieve both higher economic growth and environmental protection. As expected, this nexus is validated for all countries in the sample but not in all models, time periods, and lags. Therefore, policymakers can set appropriate electricity conservation policies based on these varied empirical findings to boost economic growth with minimum environmental degradation.
1. Introduction
Energy is known as a crucial production factor for economic growth and social welfare, especially after the industrial revolution [1]. Economic growth has traditionally been measured by the gross domestic product (GDP), and its increasing trend has led to higher energy demand and exploitation of natural energy resources in recent decades. This extensive use of energy causes environmental degradation and increased greenhouse gas (GHG) emissions. Although the natural level of GHGs is essential for the normal mechanism of atmosphere and life on Earth, the recent increase in human population and activities through industrialization, agricultural development, deforestation, and the burning of fossil fuels have increased energy consumption and GHG emissions. These changes disrupt the natural balance of atmospheric gases and cause global warming, which is currently one of the most challenging problems of modern societies [2,3]. The economic growth and energy consumption nexus and the dynamics of this relationship have been widely examined in the economic literature. The same applies to the correlation between real GDP, energy consumption, and carbon emissions. What is known as (economy–energy–environment) 3E literature identifies opposite results from the application of the Environmental Kuznets Curve (EKC) hypothesis. EKC suggests that initially, real economic growth has a negative impact on the environment while it can improve it after passing the economic threshold; see, for instance, [4,5,6]. Therefore, economic growth can be a solution to limit and keep GHG emissions under control [7]. Notwithstanding, EKC empirical results are not validated by several authors (Dogan and Ozturk [8]; Ozcan [9]; Du et al. [10], among others). According to Zhang et al. [11], these contradictory empirical results are due to countries, time periods, and econometric models.
Electricity
The causal relationships among electricity consumption, economic growth, and carbon emissions have attracted the attention of several researchers in the last decades [12]. Economic growth increasingly depends on electricity consumption [13]. According to the International Energy Agency (IEA), global energy demand and global electricity demand increased in 2019 by 0.9% and 1.4%, respectively. The statistics of IEA in 2020 indicate that during the Coronavirus Disease of 2019 (Covid-19) pandemic, monthly reduction in full lockdown was 20% on average, more than 1.5% on an annual basis, while the global electricity demand was expected to fall by 5% in 2020. In more industrialized economies, lockdown had a smaller effect on electricity demand. Further, the global energy demand declined by 3.8% in the first quarter of 2020 relative to the first quarter of 2019. The collected data from 30 countries until April 2020 indicated that the energy demand reduction depended on the duration and stringency of lockdowns [14].
Electricity generation is the major driver of carbon dioxide (CO2) emissions worldwide [15,16]. For the countries in our sample, electricity generation highly depends on fossil fuel resources that are the main reason for CO2 emissions and air pollution. Accordingly, finding out the relationship between carbon emission from electricity generation (CEEG) and GDP is an essential research topic. Understanding the existence and direction of this nexus is required to set efficient electricity conservation policies and to achieve sustainable economic growth while preserving environmental quality [17].
This study contributes to the existing literature in two ways. Firstly, empirical literature on the nexus between carbon emissions from electricity generation (CEEG) and the gross domestic product (GDP) is still scarce, and the main goal of this study is investigating this relationship for oil-based economies in the Middle East that will help governments to implement appropriate policies. Secondly, to examine the impacts between CEEG and GDP, the promising the maximum entropy bootstrap for time series [18,19] is applied. This approach overcomes some problems of traditional econometric methods that are based on asymptotic theory. In addition, the maximum entropy bootstrap guarantees more robust, accurate, and reliable results even for small samples [19]. Furthermore, this work considers three time periods with the Kyoto Protocol being the turning point for the whole period considered in our research. Studying the relationship between these two variables during years before and after the Kyoto agreement reveals how it is empirically effective in this context.
2. Literature Review
Several studies have investigated the connection between economic growth, carbon emissions, and energy consumption with an increasing concern about environmental pollution, global warming, and natural resource depletion. Since electricity acts as a stimulus for economic growth and development, the causal relationship between electricity consumption/generation and economic growth has been explored by several authors. The outputs of those empirical studies point to four main hypotheses: neutrality, feedback, growth, and conservation hypotheses. According to the neutrality hypothesis, there is no causal relationship between electricity generation and economic growth that states neither energy conservation nor expansion policies will have any effect on economic growth. Feedback hypothesis suggests bidirectional causality and interdependence between the two variables. Based on the growth hypothesis, the existence of unidirectional causality running from electricity generation to economic growth is confirmed, which means that the economy is dependent on energy and particularly on electricity, and any electricity conservation policy can be detrimental to future economic growth. The last hypothesis is conservation that suggests unidirectional causality running from economic growth to electricity generation. Then, the economy is relatively less dependent on electricity and environmental policies for energy conservation, and reducing GHG emissions will have a minimum adverse effect on economic growth. These theoretical arguments are generally based on positive causality, but when causality is negative, the energy dependence interpretation becomes less intuitive and alternative interpretations will be revealed [20,21,22,23].
Studies on the relationship between energy and the environment can be categorized according to different variables. There is a group of studies on the energy consumption/demand and economic growth that has been investigated for 30 years by scholars and several researchers [24]. Yalta [20] investigates the causality between energy consumption and real GDP in Turkey during 1950–2006, using the maximum entropy bootstrap. As shown by the results, there is no nexus between energy consumption and GDP, and the neutrality hypothesis is confirmed. However, several authors have studied this linkage in other countries, and different results have been obtained. For instance, Altinay and Karagol [25] employ Hsiao’s version of the Granger method for the period 1950–2000 in Turkey, and no causality between energy consumption and GDP is found. Further, Soytas and Sari [26] study the same variables for Turkey from 1960 to 1995, using the vector error correction model (VECM), and unidirectional causality running from energy consumption to GDP is validated. The findings of the mentioned papers vary through different applied methodologies and time periods in Turkey. In the same vein, Alam et al. [21] study the connection between energy demand and GDP for Bangladesh, applying the maximum entropy approach over the period 1980–2011. Unidirectional causality from GDP to energy demand is proved by the findings, which implies the conservation hypothesis. Therefore, economic growth does not depend on energy demand and any energy conservation policy has no impact on GDP. Other researchers have analyzed the energy consumption and carbon emission nexus. In this context, Gul et al. [27] examine the nexus between energy consumption and CO2 emissions applying the maximum entropy bootstrap approach for Malaysia over the period 1975–2013. In this study, both bivariate and multivariate frameworks are considered, and findings reveal unidirectional causality running from energy consumption to carbon emission for both frameworks. Other scholars address the connection between economic growth and carbon emissions. In this vein, we can mention Mousavian and Sadeghi [28], who examine the nexus between GDP and CO2 emissions in Iran in the 1973–2010 period, applying the maximum entropy bootstrap methodology. Both bivariate and multivariate frameworks are examined in this work. The findings validate the existence of unidirectional causality from GDP to carbon emissions for bivariate frameworks and no nexus between them for multivariate frameworks. Thus, conservation and neutrality hypotheses are confirmed by the results of causality tests for bivariate and multivariate models, respectively. Further, the relationship among more than two variables has been the subject of other studies, namely, Hwang and Yoo [22] investigate the nexus between three main factors in the economy, including energy consumption, CO2 emissions, and economic growth. This study considers annual data for Indonesia during 1965–2006 and uses a unit root test and error correction model. The evidence shows a bidirectional relationship between energy consumption and CO2 emissions. This means that any increase in energy consumption leads to an increase in CO2 emissions and vice versa. There is also a unidirectional causality from economic growth to CO2 emissions and energy consumption that supports the conservation hypothesis. In this case, any energy conservation policy has no negative impact on economic growth. In similar work, Lotfalipour et al. [17] investigate the existence of a relationship between economic growth, carbon emissions, and fossil fuel consumption in Iran from 1967 to 2007 using the Toda-Yamamoto method. Granger causality from economic growth and fossil energy consumption to carbon emissions is found in this research.
Abou-Elseoud and Kreishan [23] investigate the nexus between electricity consumption and GDP in Bahrain, as an oil-exporting country, between 1980 and 2019. The Autoregressive Distributed Lag (ARDL) model is applied in this paper. The empirical results show the existence of unidirectional causality running from electricity consumption to GDP. According to the estimates, the growth hypothesis is revealed in Bahrain, which means that the economy is energy dependent. Bahrain was the first country in the Gulf region that started a diversification policy that reached 80 percent of GDP without oil. This also means that the structure of the economy has shifted from the production of goods to services [29]. Bahrain’s economy is based on financial activities in the region, so electricity is a key factor for long-term planning of the country. In conclusion, the result of the Granger causality test shows the unidirectional causality from electricity consumption to economic growth. Further, the significant impact of electricity consumption on GDP is justified according to the estimated coefficients. In a similar study, Ibrahiem [12] explores the causality between electricity consumption and GDP at the macro level in Egypt from 1971 to 2013, dividing the economy into three main sectors: agriculture, industry, and services. The results suggest the feedback hypothesis of bidirectional causality between electricity consumption and GDP. Moreover, the sectoral results show the neutrality hypothesis between electricity consumption and output in the agricultural sector and the existence of the feedback hypothesis in the services sector. The conservation hypothesis and the unidirectional causality running from industrial production to electricity consumption in this sector are confirmed by the results. Therefore, electricity saving measures should be taken according to different sectoral results. The nexus of electricity consumption and economic growth in three large economies, United States, India, and China, is investigated by Wu et al. [30]. The results support different hypotheses for these countries. There is a bidirectional relationship between electricity consumption and economic growth that supports the feedback hypothesis, which means that an increase in the degree of electricity consumption causes an increase in economic growth and vice versa. The results for India report the unidirectional relationship running from electricity consumption to economic growth, which supports the growth hypothesis. In China, a negative relationship is found, meaning that less electricity consumption causes higher economic growth. Consequently, in this economy, economic growth can be obtained with less electricity consumption and environmental degradation.
The influence of the nonlinear economic growth threshold effect of urbanization on electricity consumption in China is explored by Liu et al. [31]. As the rate of urbanization in China is growing rapidly and electricity plays a fundamental role to promote economic growth, it is urgent to figure out the relationship between these two main variables. Further, the fast urbanization negatively affects the environmental quality. Therefore, for sustainable development, the government needs to deal with energy conservation, sustainable use of energy sources, and ecological damage raising from increasing electricity supply and consumption. The findings of this paper indicate that the urbanization rate (PUR) stimulates electricity consumption before the threshold, and when the economic growth level crosses the threshold, this promoting impact will be significantly weakened. According to Zhang et al. [32], the main factors to increase total electricity consumption are economic activities while the energy intensity prevents this. In another study, Lin and Wang [33] state that China has the world largest electricity system, while a complete reform of this market is in motion. This paper investigates the inconsistency of economic growth and electricity consumption in China for the period 2000–2016. Based on the findings, the authors conclude that increasing inventory, fixed capital, and industrial electricity consumption reduce the gap between economic growth and electricity consumption that leads the higher rate of economic growth than electricity consumption.
Thus, to put it briefly, it seems evident that empirical results and implications of research studies on the nexus between diverse energy and economic aggregates depend substantially on the underlying variables, time periods, econometric techniques, and samples. Furthermore, countries in these samples may be chosen according to different criteria—in terms of development, energy system, available natural resources, among other factors—which may introduce a bias in the analysis. Overall, the existing literature yields mixed and inconclusive results, making it difficult to recommend a general energy–environmental policy approach.
3. Data, Methodology, and Statistical Models
3.1. Data
The two variables in this paper are CO2 emissions from electricity generation (CEEG), measured in million tons (MT) per capita as a proxy for environmental degradation, and the gross domestic product (GDP) per capita measured in 2010 constant price US dollars as an indicator of economic growth. Annual time series of CEEG and GDP were collected from International Energy Agency (IEA) [34] and the World Bank [35]. The data are expressed in logarithms over the period 1995–2017 for the latest available data for eight Middle Eastern countries: Bahrain, Iraq, Iran, Kuwait, Oman, Qatar, Saudi Arabia, and the United Arab Emirates.
Figure 1 includes the trend of GDP and CO2 emissions from electricity generation in this sample of countries. Both variables followed a similar trend over the 23 years. This may indicate a correlation between them as CEEG has an increasing trend when GDP grows and vice versa. The rate of change varies across countries and years for many reasons. There are many factors that yield these variations, such as national and international policies that cause GDP and CEEG to decrease or increase. For example, the most important global agreement between 1995 and 2017 is the Kyoto Protocol, which was adopted in 1997. Under this agreement, developed and industrialized countries, which bear the main responsibility for greenhouse gas emissions through their industrial activities of more than 150 years, committed to reduce their greenhouse gas emissions by 5.2% between 2008 and 2012. In 2005, it became an international law and entered into force for 37 industrialized countries and the European Union. The countries considered in the current study did not sign the Kyoto Protocol initially. Since they benefited from a large share of the world’s oil, natural gas, and coal reserves [36], those economies are based on fossil fuel resources, which play a fundamental role in socio–economic development and at the same time in greenhouse gas emissions. Therefore, they faced worldwide concern about global warming and pollution and have implemented appropriate policies to reduce their share of carbon emissions. They joined the Kyoto Protocol in 2005, except for Iraq, which followed in 2006. Accordingly, to figure out the efficiency of international efforts to control global warming and GHG emissions, this study analyses three time periods: 1995–2017 (TP1), 1995–2005 (TP2), and 2006–2017 (TP3). A comparison of the results of the two subperiods, TP2 and TP3, reveals the impact of energy efficiency projects that have been prioritized in the policy portfolio of several countries after Kyoto ratification (Figure 1).

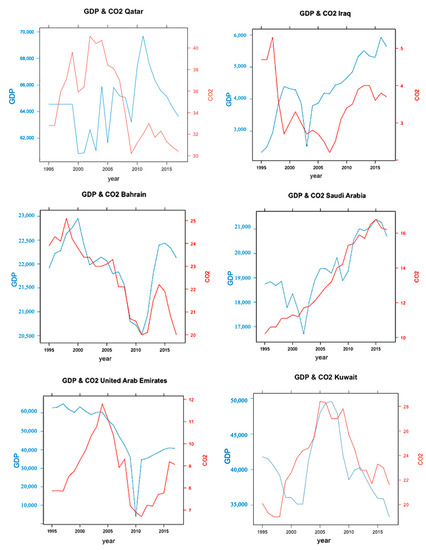
Figure 1.
Gross domestic product (GDP) and CO2 emissions from electricity generation (CEEG) per capita for the sample of countries. (Source: IEA and World Bank).
The plots illustrate the decline in GDP and CEEG after 2010 in most of the countries as the governments started to reform energy subsidies by raising energy prices. For instance, Saudi Arabia and Bahrain started to increase energy prices in 2016, which is shown in the corresponding plots by decreasing CO2 emissions between 2016 and 2017.
3.2. Methodology
This study applies the maximum entropy bootstrap (meboot) for time series that was introduced by Vinod [18] to find the possible nexus between carbon emissions of electricity generation (CEEG) and the gross domestic product (GDP) in the sample of eight countries. The maximum entropy bootstrap for time series is a recent and powerful technique that allows statistical formulations free of restrictive and unnecessary assumptions usually employed by practitioners, e.g., [18,19,37]. The maximum entropy bootstrap approach creates a large number (e.g., 999 by default) of resamples (replicates) of the two original time series of variables, CEEG and GDP, as elements of an ensemble, which satisfies the ergodic and the central limit theorems. Then, the estimates for each parameter of interest are obtained from the replicates and subsequently, they are used to construct confidence intervals. Given its advantages, the Highest Density Region (HDR) method proposed by Hyndman [38] is applied in this work to obtain the confidence intervals, which will allow inference analysis through hypothesis testing.
The meboot has some advantages over other approaches. For instance, it can be applied under all types of non-stationarity or fractional stationarity, including structural breaks, non-linearity, near unit roots, and data integration [24]. Additionally, there is no need to shape destroying transformations in the data, such as differencing to make the time series stationary [19]. Since traditional hypothesis testing and confidence intervals based on asymptotic theory may cause misleading results when samples of relatively small size are considered [39], the inference analysis from meboot will be more reliable and robust [19].
3.3. Statistical Models
The time series models to study the bivariate relationship between carbon emissions from electricity generation (CEEG) and the gross domestic product (GDP) are defined as
and
where is the residual term, and represent, time and lags, respectively. Several packages from the R Software were used in this work: packages [40] and [41] to extract information from linear regression models, package [42] for dynamic linear regression models, package [19] for the maximum entropy bootstrap, and package [36] to find HDR with graphics for the sampling distributions of ’s ().
For convenience in the discussion of results and considering , the 12 models obtained from Equations (1)–(4) are described in Table 1.

Table 1.
The 12 models under study in this work.
From Model 1 to Model 6, some confidence intervals for parameter are computed (from the estimates obtained in the 999 replications) to find the existence and direction of the relationships between as an explanatory variable and as a dependent variable. The same variables at year and are added in Model 7 to Model 12 as explanatory variables, and some confidence intervals for parameter are computed for the same purpose. The hypothesis test for the parameters of interest is defined as
for . Naturally, if the null hypothesis, , is rejected (zero does not belong to a specified confidence interval), then the corresponding variable ( or ) is considered relevant to explain the response ( or ) at a given significance level, assuming a specific statistical model and for the sample under study.
The detailed results for the eight countries and the corresponding policy implications are presented in the following sections.
4. Empirical Findings
The confidence intervals (CI) at three confidence levels (, and ), and the graphics of HDR are presented and discussed in this section. Model 1 to Model 6 and Model 7 to Model 12 are presented separately in two tables, for each country, according to the estimated ’s . Most of the CI lead to the same decision in terms of rejection or no rejection of the null hypothesis, but there are some cases that depend on the confidence level considered. For example, Figure 2 presents three confidence intervals based on the HDR of estimates, in Model 7, for Iraq, over the 1995–2005 period (TP2). Based on the results, only the confidence interval at 99% for , , leads to the non rejection of the corresponding null hypothesis, . The confidence interval at 95% (and consequently at lower confidence levels, where the usual 90% is included) leads to the rejection of the same null hypothesis, indicating a possible impact of GDP on CEEG.
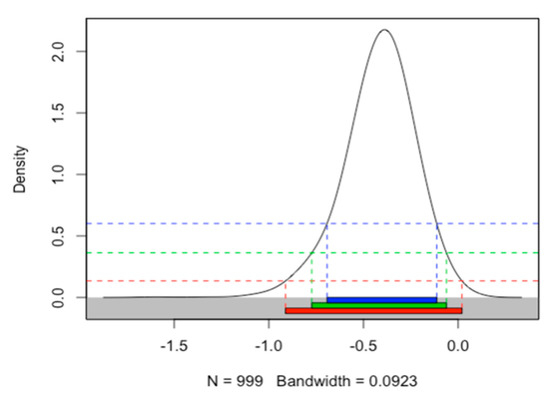
Figure 2.
Highest density region (HDR) of estimates, Model 7 and TP2 for Iraq.
To have a constant basis for the analyses, only the confidence intervals at 90%, i.e., , are chosen for discussion and comparison purposes. However, the other CI are also reported, allowing additional statistical analyses.
4.1. Iraq
Table 2 presents the CI for parameter in Models 1–6 for Iraq in the three time periods. The findings confirm the neutrality hypothesis for all models during TP1, which means no evidence of a relationship between CEEG and GDP. However, according to the CI for the same models over TP2 and TP3, the feedback hypothesis is validated, which reveals the existence of a bidirectional relationship between the two variables. No changes in the results, before and after Kyoto agreement, reveal that it has no impact on the relationship between the two considered variables. The only exception is Model 6, in TP2. Note that, if both limits of CI for the parameter are positive (negative), this means that a unit increase in the predictor implies an increase (a decrease) in the response variable, within a specific confidence level. Based on feedback hypothesis validated in both TP2 and TP3, it is necessary for the government to provide a sustainable plan. Meanwhile, electricity conservation and electricity efficient policies should be adopted to reduce emissions and environmental degradation but at the same time, any adverse effects on economic growth must be considered.
Table 2.
Confidence Intervals for in Models 1–6 for Iraq, in the three time periods.
Models 7–12 presented in Table 3 indicate a mix of decisions in terms of rejection or non rejection of the corresponding null hypothesis. Some surprising results of no impact between CEEG and GDP in TP1 can be possibly justified by structural breaks that coincide with economic, political, and/or military events that have been happening over the last decades in Iraq and the Middle East in general. Firstly, we can refer to the Gulf war and Iraq’s invasion of Kuwait in 1990 that led to a rapid increase in the oil price until the end of the 1990s (last quarter), a 86.3% rise [43]. Further, the second war in Iraq started in 2003 after assertion of intelligence agencies indicating that Iraq had weapons of mass destruction. After that event, civil war and violent attacks in the country have proceeded until now, which in turn can be the reason for the absence of a stable economy and long-term policies [44].
Table 3.
Confidence Intervals for in Models 7–12 for Iraq, in the three time periods.
Moreover, according to the statistics from World Bank presented in Table 4, the electricity generation from petroleum resources in Iraq dropped from 1995 to 2015 (last available statistics), which may have affected the relationship between CEEG and GDP due to less dependency of electricity generation on oil, natural gas, and coal resources, and consequently on CO2 emissions. This table shows the share of oil, natural gas, and coal resources in electricity production in 1995 and 2015 (last statistics available) of the total, presented as a percentage. The electricity generation of Bahrain, Kuwait, Oman, Qatar, and United Arab Emirates is still completely based on fossil fuel resources. In Saudi Arabia and Iran, the dependency on those resources increased by 7.8% and 2.5% respectively, while it dropped significantly in Iraq, a 48% reduction.
Table 4.
Electricity production from oil, natural gas, and coal resources (% of total).
As the most important reason for neutrality hypotheses, we can refer to the ratio of electricity consumption to fossil fuel consumption per capita in Iraq. As shown in Figure 3, the scales are KWH for electricity consumption and MWH for fossil fuel consumption, and presenting them in the same scale, namely, KWH, as in Figure 4, the electricity consumption is almost zero. This reveals a fact that the economy has almost no dependence on electricity, and the CEEG and GDP do not have a significant impact on each other.
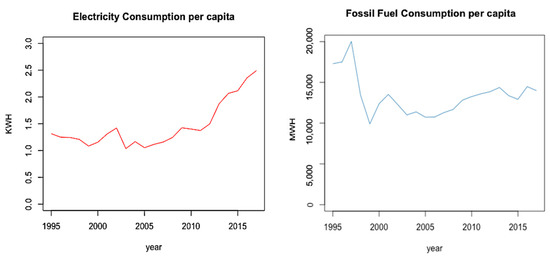
Figure 3.
Electricity and fossil fuel consumption per capita in Iraq during 1995–2017. (Source: Our World in Data).
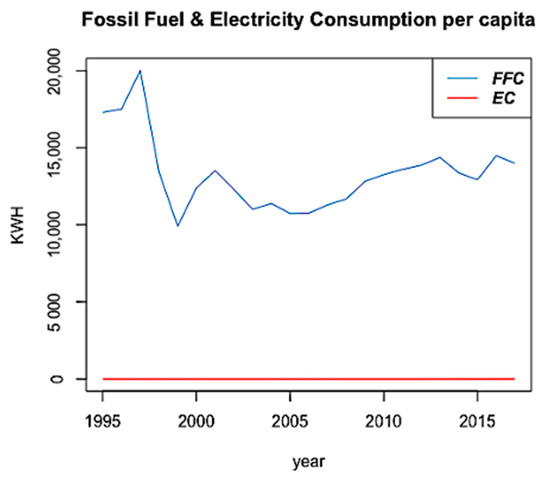
Figure 4.
Fossil fuel and electricity consumption per capita in Iraq during 1995–2017. (Source: Our World in Data).
4.2. Bahrain
Table 5 includes the CI for parameter in Models 1–6 for Bahrain, which reveals the existence of a bidirectional positive impact between CEEG and GDP in TP1 for all defined models. The feedback hypothesis and bidirectional relationship is validated since the electricity generation in Bahrain depends on fossil fuel resources, by 100 percent (see Table 4). Different conclusions are found in TP2, which is the period before the ratification of the Kyoto Protocol, only for Model 2 and Model 3. From the CI for TP3, it is possible to identify a bidirectional relationship between CEEG and GDP for lags , while the neutrality hypothesis is assumed when is considered (Model 3 and Model 6). The analysis of CI for in Models 7–12, in Table 6, supports different hypotheses, depending on the time periods, the models, and the confidence levels considered. We can conclude that the results are not robust for the number of lags as well as the time periods. The inconsistency of results for CEEG and the GDP nexus for Bahrain makes it difficult to propose a reliable policy. To explain this relationship, it may be necessary to define a multivariate framework to control other important variables, in order to possibly obtain more consistent results.
Table 5.
Confidence Intervals for in Models 1–6 for Bahrain, in the three time periods.
Table 6.
Confidence Intervals for in Models 7–12 for Bahrain, in the three time periods.
4.3. Kuwait
In the case of Kuwait, Table 7 presents the evidence from the CI for parameter in Models 1–6 that shows a bidirectional positive impact between CEEG and GDP in TP1 and TP3. Under the feedback hypothesis, two variables are interdependent and an increase in one variable causes an increase in the other one and vice-versa [45]. This means that increasing the GDP will raise CEEG and degrade the environment. Therefore, the government must develop policies for higher GDP and lower carbon emissions at the same time. According to the World Bank (2020), the electricity generation in Kuwait was 100% based on oil, natural gas, and coal resources until 2015, as shown in Table 4. On the other hand, the Kuwait government has the highest subsidies and pays 95% of the economic cost of energy, but in 2015, the government decided to start adjustments on diesel, gasoline, and electricity prices. This policy can lead to an increase in GDP by increasing the prices and exports of petroleum and a decrease in electricity consumption and CEEG because of the reductions of misusing energy over time. In Models 7–12 for the time periods before and after Kyoto Protocol, the findings illustrate some opposite relations between variables. As it is clear in Table 8, there is a unidirectional positive relationship running from CEEG to GDP that supports a growth hypothesis over period TP2, which implies that electricity acts as a stimulus for economic growth. Under this hypothesis, decision-makers should promote policies to improve energy infrastructure to achieve increasing electricity demand with higher efficiency. While results from lags show a unidirectional positive relationship running from GDP to CEEG over TP3, which validates the conservation hypothesis and supports the premise of less dependency of the economy on energy and minimum negative effects on economic growth [46], a bidirectional positive relationship is assumed for , considering 90% and 95% confidence levels in Model 12.
Table 7.
Confidence Intervals for in Models 1–6 for Kuwait, in the three time periods.
Table 8.
Confidence Intervals for in Models 7–12 for Kuwait, in the three time periods.
Figure 5 represents the plots of HDR of the estimates for Models 1–6 during 1995–2017 (TP1) in Kuwait. The three horizontal bars in the plots represent the probability coverage levels of 90%, 95%, and 99%, respectively [36]. (All the other HDR graphics are available upon request to the authors. They are omitted here for the sake of simplicity).


Figure 5.
HDR of estimates, Models 1–6 for Kuwait in TP1.
4.4. Iran
Under Models 1–6 for Iran, as presented in Table 9, there is a bidirectional relationship between CEEG and GDP, during TP1 and TP2, that supports a feedback hypothesis. Some features of the energy and electricity system in Iran, such as electricity generation based on natural gas, and high fossil fuel subsidies for electricity generation and consumption, support these results. Conclusions for TP3 depend on the model and confidence levels.
Table 9.
Confidence Intervals for in Models 1–6 for Iran, in the three time periods.
As per capita CO2 emissions in Iran are among the highest in the world, continuing increasing the use of fossil fuels will result in more environmental damage and the waste of energy resources. It is worth mentioning that, due to its various climate conditions and proximity to the equator, Iran’s capacity to use renewable sources, namely, solar energy is extremely high. According to specialists, Iran has an average of 2200 kilowatt-hour solar radiation per square meter annually [47].
Based on the CI presented in Table 10, there is a unidirectional relationship running from CEEG to GDP, over TP1 and TP2, that supports a growth hypothesis, which means that the electricity consumption drives economic growth. Conclusions for TP3 depend on the model considered. The rejection of the corresponding null hypotheses, , is only verified in Model 12. Figure 6 represents the plots of HDR of the estimates for Models 7–12 during 2006–2017 (TP3) in Iran.
Table 10.
Confidence Intervals for in Models 7–12 for Iran, in the three time periods.


Figure 6.
HDR of estimates, Models 7–12 for Iran in TP3.
Previous conclusions may be supported by the fact that electricity generation is fueled by primary energy sources, mainly natural gas. Iran is a developing country that has the world’s fourth and second largest proven crude oil and natural gas reserves, respectively. Therefore, the country heavily relies on fossil fuel resources. According to the World Bank statistics presented in Table 4, the electricity generation relied 93.9% on oil, natural gas, and coal resources in 2015 (last available statistics). In addition, sanctions against the energy sector do not allow the country to upgrade its infrastructure, which in turn cause inefficiency, a waste of energy, and environmental issues [48].
Figure 7 and Figure 8 present the electricity generation and the share of renewable energy of electricity generation in the countries under investigation for the entire period (1995–2017).

Figure 7.
Electricity generation of the countries under study during 1995–2017, (Our World in Data).
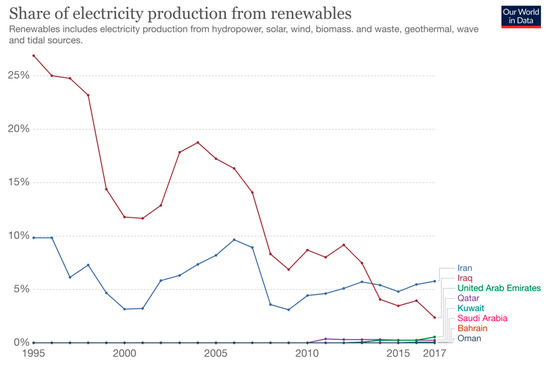
Figure 8.
Share of electricity generation from renewable energy resources, (Our World in Data).
Figure 9 shows the share of electricity generation from renewable energy resources in Iran, which is not significant. Thus, by increasing electricity production, Iran faced some complex challenges, such as high pollutant emissions and an extreme depletion of nonrenewable resources during that time period. To overcome these challenges, the government started to reform the prices and the reduction of subsidies on domestic petroleum, natural gas, and electricity in 2010. These reforms and external factors, such as sanctions against this economy, and the insecure and unstable situation in the area, may justify the different results over the period 2006–2017.

Figure 9.
Share of electricity generation from renewable energy resources in Iran, (Our World in Data).
Our findings can be compared to those obtained by Halkos and Ckampoura [49] for a sample of 119 countries, for the period 2000–2018, using quadratic and cubic regression models. These models were constructed to examine the linkage between CO2 emissions as a dependent variable, and GDP, electricity generation from fossil fuels, electricity generation from renewables, and population density as independent variables. From the 47 high-income countries of the sample, Bahrain presented the highest levels of electricity production from fossil fuels (0.021955 GWh/capita in 2006), while Qatar—one of the countries in our sample whose results do not appear in this article due to space restrictions—had the highest level of CO2 emissions per capita for the whole period (the highest being observed in 2001). Those authors also show that their results confirm the EKC hypothesis and the existence of an inverted U-shape curve in the dynamic model for high-income countries—Bahrain, Kuwait, Oman, Qatar, Saudi Arabia and UAE in our sample—and in both static and dynamic models for the upper-middle income countries which are, for our sample, the case for Iran and Iraq [49].
Due to space limitations, the results for the remaining four countries (Qatar, Oman, Saudi Arabia, and United Arab Emirates) are not shown here, but they are available upon request to the authors. From the results for these four countries, it is noteworthy to highlight that, in the case of Qatar, the observed bidirectional relationship supports a feedback hypothesis for Models 1–6 in TP1, while the conclusions in TP2 and TP3 depend on models and confidence levels. Regarding Oman, different hypotheses are suggested in the three time periods, depending on models and confidence levels. In the case of Saudi Arabia, for Models 1–6, the feedback hypothesis is supported by the observed bidirectional relationship in TP1 and TP3, and for Models 10–12, there is a unidirectional relationship running from CEEG to GDP in TP1. The results of the United Arab Emirates suggest a feedback hypothesis from Models 1–6 in TP2, following the observed bidirectional relationship between GDP and CEEG. In Models 10–12 over TP2, a unidirectional relationship is found, which suggests that CEEG has an impact on GDP in United Arab Emirates.
5. Conclusions and Policy Implications
The objective of this study was to explore the nexus between carbon emissions from electricity generation and the gross domestic product in eight oil and natural gas-based economies, in the Middle East, during three time periods. The parameters of the bivariate time series models were estimated through the maximum entropy bootstrap. As expected, the results are different between countries, time periods, models, and time lags. Naturally, this variety of findings does not allow an implementation of common policies for all nations. Consequently, policymakers must adopt serious appropriate policies for environmental pollution and economic growth according to different confirmed hypotheses and relationships between CEEG and GDP. These group of countries are oil and natural gas producers and have enormous oil resources, which can be still a major factor of economic growth. Thus, energy subsidies are one of the most common fiscal policies used by governments, both directly on electricity prices and indirectly on oil and natural gas as main inputs to electricity generation. According to Sdralevich et al. [50], the Middle East and North African (MENA) countries have the highest share of energy subsidies in the world, up to 48% of global subsidies and 9% of the GDP of those countries in 2011.
High levels of subsidies cause lower domestic electricity prices than the world market price and lower than the marginal cost, which has negative consequences, such as misuse of electricity, and burdens governments. Consequently, as the electricity generation is mainly based on natural gas and oil, the main cost will be carbon emissions of electricity generation [51]. Moreover, this level of subsidies has an adverse effect on the economy because even wealthy households benefit from this support when they do not need it, and this policy increases inequality in countries. Another negative consequence is the renewable energy market and clean energy technologies improvement. Since huge investment is required to construct renewable electricity plants, governments should encourage and support the private sectors to invest in renewable projects in order to shift the electricity sector to clean resources such as biomass, solar, wind, and hydro. Due to the geographical location of the sample countries, they benefit from abundant clean energy sources, which makes renewable power plants the best alternative for the current power generation system, which ultimately reduces harmful emissions and environmental degradation. For these reasons, governments have started adjusting domestic prices and subsidies over the past decade. Iran was the first country in the area that started reforming energy prices, tariffs, and subsidies in 2010. By increasing domestic energy prices, demand and consumption declined and the government increased the oil export, but it was just for a short time as the international sanctions started. Katiri and Fattouh [52] referred to Iran’s reform of domestic energy pricing as an important example because of some features such as the large and heterogeneous population, large income gaps, and additional factors such as intensification of international sanctions. In this sample, Kuwait has the highest subsidies since the government pays 95% of the economic cost of energy. In 2015, the government started to adjust the fuel prices by increasing the gasoline prices by 40%, which was the first time since 1998. Other countries have begun adjusting the domestic energy prices in electricity and transportation sectors from 2011 [52]. However, as this protects low-income households and electricity producers, the reform policy is complicated and has social, economic, and political consequences, which require structural revisions. Finally, since economic growth and environmental protection are the main goals of developing countries, alternative renewable energy sources such as biofuels, biomass, solar, hydropower, and wind power must be provided to ensure adequate electricity generation to support higher economic growth and development.
Modern economies depend on the availability of reliable and affordable electricity. Notwithstanding, electricity production is still one of the world’s largest contributors of CO2 and other GHG emissions. Our findings confirm that the relationship among electricity production, economic growth, and the environment is rather complex. In some of the countries in our sample, such as Iraq and Iran, electricity shortages remain one of the main barriers to economic and social development [53]. In these countries, there are severe problems concerning electrical networks, which has led to the spread of fuel generators of different kinds and dimensions. Generally, they use fuel oil mixed with gas oil. In the case of Iraq, this is also caused by the lack of kerosene. In any case, this presents a heavy burden on environmental degradation and the emission of a very high level of CO2. Moreover, power plants also use fossil fuels, making the situation worse.
Higher-income countries in our sample can implement different strategies to disentangle electricity production, economic growth, and CO2 emissions through policies towards a greater energy efficiency and an increasing share of renewable energies. They have enough financial capacity to make a fast energy transition and no relevant socio–economic problems to be solved.
Iran and Iraq are considered upper-middle income countries by the World Bank. The Iraq Ministry of Electricity has already defined a clear set of goals towards decarbonization of electricity production. In recent years, electricity has been mainly produced from natural gas, which is the least expensive of liquid fossil fuels and less of a pollutant than other alternatives. Notwithstanding, its use to produce electricity may be considered a waste as it could be exported and its impact on GHGs remains relevant. For a country with one of the largest oil and gas reserves, pollution and efficiency problems are an urgent problem that must be solved. Therefore, it is planned that 9.4% of total electricity demand in 2030 shall be from renewable sources, which can be considered a conservative goal [54].
In this regard, CEEG and the GDP nexus play a critical role to equip policy makers to achieve sustainable economic growth. They should foster a strategy to provide a mixed energy portfolio for the future, in order to replace fossil fuels with cheap and clean energy including renewable sources that are less sensitive to environmental pollution.
Further, for sustainable development, the most important factor is increasing energy productivity by improving technology and better energy conservation that lead to the reduction of the energy/GDP ratio that measures energy intensity [55]. Some studies show the lack of energy efficiency and insufficient technological improvement in those countries, which can be the reason for the increasing trend of CEEG [56].
Future research will examine the impact of some socio–economic and environmental variables, such as the population density, rural-urban population ratio, sectoral electricity consumption, foreign direct investment, and income gap between poor and rich households. This study can be extended to a multivariate framework by adding other possible influential variables to the models, to avoid possible bias due to omitted variables in the bivariate analysis, which can be considered a limitation of this work.
Author Contributions
Conceptualization, Z.Z. and I.S.; methodology, Z.Z., P.M. and I.S.; software, Z.Z. and P.M.; validation, Z.Z., P.M. and I.S.; formal analysis, Z.Z., P.M. and I.S.; investigation, Z.Z., P.M. and I.S.; resources, Z.Z. and I.S.; data curation, Z.Z. and I.S.; writing—original draft preparation, Z.Z., P.M. and I.S.; writing—review and editing, Z.Z., P.M. and I.S.; visualization, Z.Z., P.M. and I.S.; supervision, Z.Z., P.M. and I.S.; project administration, Z.Z., P.M. and I.S.; funding acquisition, P.M. and I.S. All authors have read and agreed to the published version of the manuscript.
Funding
This work is supported by the Center for Research and Development in Mathematics and Applications (CIDMA) through the Portuguese Foundation for Science and Technology (FCT–Fundação para a Ciência e a Tecnologia), reference UIDB/04106/2020. This research has been also financed by Portuguese public funds through FCT–Fundação para a Ciência e a Tecnologia, I.P., in the framework of the project with reference UIDB/04105/2020.
Data Availability Statement
Data were collected from the International Energy Agency and the World Bank.
Acknowledgments
We would like to express our gratitude to the Editors and to three anonymous referees for carefully reading the article. They offered extremely valuable suggestions for improvements.
Conflicts of Interest
The authors declare no conflict of interest.
References
- Rahman, M.M. Do population density, economic growth, energy use and exports adversely affect environmental quality in Asian populous countries? Renew. Sustain. Energy Rev. 2017, 77, 506–514. [Google Scholar] [CrossRef]
- Koutroumanidis, T.; Ioannou, K.; Arabatzis, G. Predicting fuel wood prices in Greece with the use of ARIMA models, artificial neural networks and a hybrid ARIMA-ANN model. Energy Policy 2009, 37, 3627–3634. [Google Scholar] [CrossRef]
- Dritsaki, C.; Dritsaki, M. Causal relationship between energy consumption, economic growth and CO2 emissions: A dynamic panel data approach. Int. J. Energy Econ. Policy 2014, 4, 125–136. [Google Scholar]
- Shahbaz, M.; Mahalik, M.K.; Shahzad, S.J.H.; Hammoudeh, S. Does the Environmental Kuznets Curve exist between globalization and energy consumption? Global evidence from the cross-correlation method. Int. J. Finance Econ. 2019, 24, 540–557. [Google Scholar] [CrossRef]
- Kais, S.; Sami, H. An econometric study of the impact of economic growth and energy use on carbon emissions: Panel data evidence from fifty eight countries. Renew. Sustain. Energy Rev. 2016, 59, 1101–1110. [Google Scholar] [CrossRef]
- Rauf, A.; Liu, X.; Amin, W.; Ozturk, I.; Rehman, O.U.; Hafeez, M. Testing EKC hypothesis with energy and sustainable development challenges: A fresh evidence from belt and road initiative economies. Environ. Sci. Pollut. Res. 2018, 25, 32066–32080. [Google Scholar] [CrossRef]
- Chakamera, C.; Alagidede, P. Electricity crisis and the effect of CO2 emissions on infrastructure-growth nexus in Sub Saharan Africa. Renew. Sustain. Energy Rev. 2018, 94, 945–958. [Google Scholar] [CrossRef]
- Dogan, E.; Ozturk, I. The influence of renewable and non-renewable energy consumption and real income on CO 2 emissions in the USA: Evidence from structural break tests. Environ. Sci. Pollut. Res. 2017, 24, 10846–10854. [Google Scholar] [CrossRef]
- Ozcan, B. The nexus between carbon emissions, energy consumption and economic growth in Middle East countries: A panel data analysis. Energy Policy 2013, 62, 1138–1147. [Google Scholar] [CrossRef]
- Du, L.; Wei, C.; Cai, S. Economic development and carbon dioxide emissions in China: Provincial panel data analysis. China Econ. Rev. 2012, 23, 371–384. [Google Scholar] [CrossRef]
- Zhang, X.; Zhang, H.; Yuan, J. Economic growth, energy consumption, and carbon emission nexus: Fresh evidence from developing countries. Environ. Sci. Pollut. Res. 2019, 26, 26367–26380. [Google Scholar] [CrossRef]
- Ibrahiem, D.M. Investigating the causal relationship between electricity consumption and sectoral outputs: Evidence from Egypt. Energy Transit. 2018, 2, 31–48. [Google Scholar] [CrossRef]
- Rahman, M.M. Environmental degradation: The role of electricity consumption, economic growth and globalization. J. Environ. Manag. 2020, 253, 109742. [Google Scholar] [CrossRef]
- The International Energy Agency-IEA. World Energy Outlook. 2020. Available online: https://www.iea.org/reports/world-energy-outlook-2020 (accessed on 25 October 2020).
- Pfeiffer, B.; Mulder, P. Explaining the diffusion of renewable energy technology in developing countries. Energy Econ. 2013, 40, 285–296. [Google Scholar] [CrossRef]
- Shaari, M.S.; Razak, N.A.A.; Basri, B.H. The Effects of Electricity Consumption and Economic Growth on Carbon Dioxide Emission. Int. J. Energy Econ. Policy 2017, 7, 287–290. Available online: https://www.econjournals.com/index.php/ijeep/article/view/5279 (accessed on 8 June 2020).
- Lotfalipour, M.R.; Falahi, M.A.; Ashena, M. Economic growth, CO2 emissions, and fossil fuels consumption in Iran. Energy 2010, 35, 5115–5120. [Google Scholar] [CrossRef]
- Vinod, H.D. Maximum entropy ensembles for time series inference in economics. J. Asian Econ. 2006, 17, 955–978. [Google Scholar] [CrossRef]
- Vinod, H.D.; López-de-Lacalle, J. Maximum Entropy Bootstrap for Time Series: The meboot R Package. J. Stat. Softw. 2009, 29, 1–19. [Google Scholar] [CrossRef]
- Yalta, A.T. Analyzing energy consumption and GDP nexus using maximum entropy bootstrap: The case of Turkey. Energy Econ. 2011, 33, 453–460. [Google Scholar] [CrossRef]
- Alam, M.J.; Ahmed, M.; Begum, I.A. Nexus between non-renewable energy demand and economic growth in Bangladesh: Application of Maximum Entropy Bootstrap approach. Renew. Sustain. Energy Rev. 2017, 72, 399–406. [Google Scholar] [CrossRef]
- Hwang, J.H.; Yoo, S.H. Energy consumption, CO2 emissions, and economic growth: Evidence from Indonesia. Qual. Quant. 2014, 48, 63–73. [Google Scholar] [CrossRef]
- Abou Elseoud, M.S.; Kreishan, F.M. Energy-GDP Nexus for Oil-Exporting Country: The Case of Bahrain. Int. J. Energy Econ. Policy 2020, 10, 80–86. [Google Scholar] [CrossRef]
- Coers, R.; Sanders, M. The energy-GDP nexus; addressing an old question with new methods. Energy Econ. 2013, 36, 708–715. [Google Scholar] [CrossRef]
- Altinay, G.; Karagol, E. Structural break, unit root, and the causality between energy consumption and GDP in Turkey. Energy Econ. 2004, 26, 985–994. [Google Scholar] [CrossRef]
- Soytas, U.; Sari, R. Energy consumption and GDP: Causality relationship in G-7 countries and emerging markets. Energy Econ. 2003, 25, 33–37. [Google Scholar] [CrossRef]
- Gul, S.; Zou, X.; Hassan, C.H.; Azam, M.; Zaman, K. Causal nexus between energy consumption and carbon dioxide emission for Malaysia using maximum entropy bootstrap approach. Environ. Sci. Pollut. Res. 2015, 22, 19773–19785. [Google Scholar] [CrossRef]
- Mousavian, S.M.; Sadeghi, S.K. Carbon Emissions, Energy Consumption and GDP per Capita Nexus in Iran: Causality Analysis Using Maximum Entropy Bootstrap. Iran. Energy Econ. 2014, 3, 91–116. [Google Scholar]
- Kreishan, F.M.; Elseoud, M.S.A.; Selim, M. Oil revenue and state budget dynamic relationship: Evidence from Bahrain. Int. J. Energy Econ. Policy 2018, 8, 175–179. [Google Scholar] [CrossRef]
- Wu, C.F.; Wang, C.M.; Chang, T.; Yuan, C.C. The nexus of electricity and economic growth in major economies: The United States-India-China triangle. Energy 2019, 188, 116006. [Google Scholar] [CrossRef]
- Liu, X.; Sun, T.; Feng, Q.; Zhang, D. Dynamic nonlinear influence of urbanization on China’s electricity consumption: Evidence from dynamic economic growth threshold effect. Energy 2020, 196, 117187. [Google Scholar] [CrossRef]
- Zhang, C.; Su, B.; Zhou, K.; Yang, S. Analysis of electricity consumption in China (1990-2016) using index decomposition and decoupling approach. J. Clean. Prod. 2019, 209, 224–235. [Google Scholar] [CrossRef]
- Lin, B.; Wang, Y. Inconsistency of economic growth and electricity consumption in China: A panel VAR approach. J. Clean. Prod. 2019, 229, 144–156. [Google Scholar] [CrossRef]
- International Energy Agency-IE. Available online: https://www.iea.org (accessed on 15 June 2020).
- World Bank. Available online: https://data.worldbank.org (accessed on 15 June 2020).
- Farhani, S.; Rejeb, J.B. Energy Consumption, Economic Growth and CO2 Emissions: Evidence from Panel Data for MENA Region. Int. J. Energy Econ. Policy 2012, 2, 71–81. [Google Scholar]
- Vinod, H.D. Hands-On Intermediate Econometrics Using R: Templates for Extending Dozens of Practical Examples; World Scientific: Hackensack, NJ, USA, 2008. [Google Scholar]
- Hyndman, R.J. Computing and Graphing Highest Density Regions. Am. Stat. 1996, 50, 120–126. [Google Scholar] [CrossRef]
- Davidson, R.; MacKinnon, J.G. Several tests for model specification in the presence of alternative hypotheses. Econometrica 1981, 49, 781–793. [Google Scholar] [CrossRef]
- Fox, J. An R and S-PLUS Companion to Applied Regression; Sage Publications: Thousand Oaks, CA, USA, 2002. [Google Scholar]
- Zeileis, A.; Hothorn, T. Diagnostic Checking in Regression Relationships. R News 2002, 2, 7–10. Available online: http://CRAN.R-project.org/doc/Rnews/ (accessed on 5 May 2020).
- Zeileis, A. Dynlm: Dynamic Linear Regression. 2008. Available online: http://CRAN.R-project.org/package=dynlm (accessed on 5 May 2020).
- Tatom, J.A. The 1990 Oil Price Hike in Perspective. Federal Reserve Bank St. Louis 1991, 73, 3–18. Available online: https://ideas.repec.org/a/fip/fedlrv/y1991inovp3-18.html (accessed on 10 June 2020).
- Prados, A.B. Iraq: Post-War Challenges and U.S. Responses, 1991–1998. CRS Report Congress. 1999. Available online: https://fas.org/sgp/crs/mideast/98-386.pdf (accessed on 14 July 2020).
- Tiwari, A.K.; Eapen, L.M.; Nair, S.R. Electricity consumption and economic growth at the state and sectoral level in India: Evidence using heterogeneous panel data methods. Energy Econ. 2021, 94, 105064. [Google Scholar] [CrossRef]
- Hwang, D.B.; Gum, B. The causal relationship between energy and GNP: The case of Taiwan. J. Energy Dev. 1992, 16, 219–226. [Google Scholar]
- Solar Power Plants to Replace Fossil Fuel. Zawya. Available online: https://web.archive.org/web/20110610071343/http:/www.zawya.com/mobile/default.cfm/sidZAWYA20101220044922/actstory (accessed on 7 February 2021).
- Aien, M.; Mahdavi, O. On the Way of Policy Making to Reduce the Reliance of Fossil Fuels: Case Study of Iran. Sustainability 2020, 12, 10606. [Google Scholar] [CrossRef]
- Halkos, G.E.; Gkampoura, E.C. Examining the Linkages among Carbon Dioxide Emissions, Electricity Production and Economic Growth in Different Income levels. Energies 2021, 14, 1682. [Google Scholar] [CrossRef]
- Sdralevich, C.; Sab, R.; Zouhar, Y.; Albertin, G. Subsidy Reforms in the Middle East and North Africa; Recent Progress and Challenges Ahead; International Monetary Fund, IMF: Washington, DC, USA, 2014. [Google Scholar]
- Krane, J.; Monaldi, F.J. Oil Prices, Political Instability, and Energy Subsidy Reform in MENA Oil Exporters; Center for Energy Studies; Rice University’s Baker Institute for Public Policy: Houston, TX, USA, 2017. [Google Scholar]
- Katiri, L.E.; Fattouh, B. A brief political economy of energy subsidies in the middle east and north Africa. Int. Dev. Policy 2017, 7, 58–87. [Google Scholar] [CrossRef]
- Hashim, B.M.; Sultan, M.A.; Maliki, A.A.; Al-Ansari, N. Estimation of Greenhouse Gases emitted from energy Industry (Oil refining and Electricity generation) in Iraq using IPCC Methodology. Atmosphere 2020, 11, 662. [Google Scholar] [CrossRef]
- The Republic of Iraq, Ministry of Electricity, Electricity Master Plan Department, Volume 3, Generation Planning, and Final Report by Parsons Brinckerhoff (PB). 2010. Available online: http://www.iraq-jccme.jp/pdf/archives/electricity-master-plan.pdf (accessed on 6 May 2020).
- Mahmood, T.; Ullah, S.; Mumtaz, M. Dependence of Energy Intensity on Economic Growth: Panel Data Analysis of South Asian Economies. Int. J. Energy Econ. Policy 2021, 11, 234–239. [Google Scholar] [CrossRef]
- Behboodi, D.; Aslani, N.; Sojoudi, S. Decomposition of energy intensity and analysis of effective factors in Iranian economy. Q Energy Econ. Rev. 2010, 6, 105–305. [Google Scholar]


Publisher’s Note: MDPI stays neutral with regard to jurisdictional claims in published maps and institutional affiliations. |
© 2021 by the authors. Licensee MDPI, Basel, Switzerland. This article is an open access article distributed under the terms and conditions of the Creative Commons Attribution (CC BY) license (https://creativecommons.org/licenses/by/4.0/).