Abstract
As a consequence of increasing air pollution, the European Commission has decided to introduce special directives laying down the measures to achieve climate and energy neutrality. Renewable energy (RE) sources play an important role in the pursuit of these goals, which has been taken into account in the 2030 Agenda for Sustainable Development. The aim of this article is to describe patterns and trends in the achievements of the energy policy of European Union (EU) countries in the field of renewable energy in sustainable development. The identification of leaders in this field gives the possibility to analyse actions taken by the governments of these countries and the possible implementation of the introduced solutions on the ground of individual Member States at the regional and national levels. At the beginning Main goal of energy policy on the field of renewable energy sources (RES) is to increase production from environmentally friendly sources that is why trends were determined in order to assess the rate of achievement of the national target for changes the share of energy from renewable sources in total gross energy consumption. Groups of similar countries were then identified on the basis of three indicators corresponding to the targets set in the climate and energy package. In the group of analysed countries, 14 have achieved the 2020 targets and 4 have exceeded the 2030 targets. The main renewable energy sources (RES) are biofuels, wind, and hydropower. In the assessment of the achievement of energy policy targets, the best situation was observed in the case of Denmark, Ireland, and the United Kingdom. These countries have significantly increased the share of renewable energy in total energy consumption. Compared to other EU countries, they have reduced the economy’s energy consumption and greenhouse gas emissions the most.
1. Introduction
Sustainable energy management is undoubtedly related to increased use of renewable energy sources, which ensure energy security, diversify energy supplies, and maintain and improve the environmental and life quality of local communities. Renewable energy sources play an important role in the concept of sustainable development and sustainable energy.
Most studies in the field of renewable energy sources (RES) deal with the research on determinants of the development of this type of energy in the EU countries ([1,2,3]. The subject of numerous articles is the search for a connection between Gross Domestic Product (GDP) and renewable energy (RE) [4,5,6]. Among those, who have carried out research on the grouping of the EU countries in terms of different variables characterising the development of RES, are the studies by Neizel [7], Śmiech and Papież [8], Kasman and Duman [9].
The aim of this study was to show the differences between EU countries in terms of the implementation of policies for the development of renewable energy sources (RES), as well as to identify the countries that most effectively implement these policies. The determination of leaders in this field gives a possibility to analyse actions taken by the governments of these countries and possible implementation of the introduced solutions on the ground of individual Member States on regional and national levels. The paper asks the following research questions: What are the most common types of RES used in the analysed countries? Will the EU countries achieve their national RES targets? Which countries are most effective in introducing energy policies to take environmentally friendly measures?
At the preliminary stage, groups of countries similar in terms of the structure of renewable energy production in 2018 were defined using Czekanowski’s method [10]. The similarity of countries in terms of the structure of renewable energy production (by source of origin) was presented. The main goal of the energy policy in the field of RES is to increase the production of energy from environmentally friendly sources. Thus, at the second stage, the trends assessing the rate of achieving of the national targets by each of the analysed Member States were determined and the countries which at the current rate of development will meet the targets provided in the climate and energy packages for the coming years were identified. Next, a typological division of countries in terms of the level of achieving of energy policy targets using the model method of linear ordering of objects (the Technique for Order of Preference by Similarity to Ideal Solution-TOPSIS) was carried out.
The selection of variables for the assessment was based on the strategic targets of EU climate and energy policy referred to as “20-20-20”, which should have been achieved by 2020. The analysis identified homogeneous groups of countries with respect to the three energy policy-specific variables included in the 2020 climate and energy package. This allowed us to compare the Member States in terms of the targets listed in the package, taking into account the effects of changes in the structure of energy production assessed in terms of three variables: the rate of change in greenhouse gas (GHG) emissions reduction, changes in the share of renewable energy sources (RES) in gross final energy consumption, and the modernisation of economies (reduction of energy intensity—EI). Information about the most successful countries in terms of achieving national targets may be helpful when formulating energy policy for the next few years in Member States. Research carried out on new technologies will make it possible in the future to obtain energy from ecological sources not only more effectively, but also more economically. Observing the solutions proposed by leaders in this field will make it possible in the future to diversify sources of environmentally friendly energy.
1.1. The Concept of Sustainable Development
Sustainable development to be regarded as a type of socio-economic development rejecting egocentric approach to development, but also departing from extreme anthropocentrism, in particular in the short-term perspective. Currently, when analysing this concept, researchers tend to focus on a new, also supra-environmental, approach emphasising intergenerational equity, the sustainability of human living environment and the quality of human life. The Brundtland Report [11], which might be regarded as an important contribution to organising the terminology relating to sustainable development, draws attention to three important implications of the proposed definition of this type of development, i.e., environmental obligations towards future generations, intra- and inter-species equity, and viewing sustainability not as a state but as a process. However, Haughton [12], when analysing the aspect of intergenerational equity, mainly focused on natural-environmental-capital. Hence, he focused in particular on the economic management of natural resources, the recirculation of resources, maintaining an appropriate relationship between consumption and investment, and ensuring demographic sustainability which is often neglected in such considerations.
Kates, Parris, and Leiserowitz [13] propose four alternative methods of defining sustainable development through goals, indicators, values and economic practice (Table 1). However, this approach does not take into account the changes in social needs, spatial components and cultural differences. It focuses on economic aspects, which undoubtedly perform a decisive role in terms of contributing to human welfare and foster or even determine the quality of life.

Table 1.
Overview of approaches to the definition of sustainable development.
Sustainable development can be defined as economic development that is stimulated by the societal demands and that is carried out with appropriate economic calculation taking environmental aspects into account. Among the main goals of sustainable development, Janka [24] lists:
- ‑
- Ensuring equal opportunities in terms of access to natural assets (taking future generations into account);
- ‑
- Maintaining the sustainability of all natural processes and ecosystems;
- ‑
- Conservation of non-renewable resources and the possibility for renewable resources to regenerate;
- ‑
- Increasing the share of environmentally-friendly projects;
- ‑
- Using renewable energy sources in global economies while improving the quality of the environment and human lives. Konstańczak [25] emphasises that the idea of sustainable development is to improve both the condition of our planet and the comfort of human life through consistent action in specific areas.
In 2015, the United Nations adopted the 2030 Development Strategy. All UN member states unanimously adopted the resolution “Transforming our world: the 2030 Agenda for Sustainable Development” containing 17 Sustainable Development Goals (SDGs) to be achieved by 2030.
Focusing on the sustainable development strategy, it emphasises the need to promote a modern way of life taking into account appropriate environmental policies and philosophies that will counteract past practices of non-prospective exploitation of the earth’s resources [26].
Public authorities play an important role in the implementation of the Sustainable Development Goals, as they set the targets for the protection of the environment and its resources [27]. It should be stressed that in market economy conditions public authorities do not own most of the factors necessary for the implementation of this strategy, which is why they have to use the appropriately selected instruments to trigger the activity of specific entities, and thus contribute to the implementation of environmental policy targets.
The concept of sustainable development includes many references to the management of resources, including energy resources. In many countries, in particular those with coal, but also oil and even natural gas, such resources are a factor triggering various environmental and socio-economic imbalances. Therefore, the concept of sustainable development was also transferred to the energy sector, which gave rise to the term “sustainable energy development”, the most important rule of which is effective use of energy, human, economic, and natural resources [28].
Sustainable development in relation to the energy sector (sustainable energy) should be defined as the conversion of primary energy into secondary energy, i.e., electricity and heat, and its delivery to the end consumer in such a way as to meet the needs of present and future generations taking into account the economic, social, and environmental aspects of human development [29].
Renewable energy sources play an increasingly important role in the concept of sustainable development and sustainable energy. They offer hope for a green transformation with regard to energy, as well as for satisfying the demand for energy in countries without their own energy resources.
Promoting and supporting the development of the use of energy from renewable sources contributes to the compliance with sustainable development principles, such as:
- The principle of integration of environmental policy with sectoral policy-through the development of RES, environmental goals are taken into account to the same extent as economic and social objectives;
- The principle of equal access to the natural environment-the development of RES offers equal opportunities in terms of the use of natural resources and human needs;
- The socialisation principle-through the development of RES, environmental education is carried out to stimulate ecological sensitivity and to build new environmental ethics;
- The prevention principle-the development of RES imposes on the investor the obligation to assess the environmental impact of the planned project and to monitor it after project completion;
- The principle of applying best available techniques-solutions for generating energy from RES allow implementation of the best reasonable and available technologies, e.g., in the form of wind farms.
Sustainable energy development in the context of RES occurs when it concerns activities integrated on various levels, including global, national, and local, as well as in individual areas of such development: economic, social, psychological, environmental, technological, informational, political, and legal [30].
Ensuring the implementation of the above objectives and Sustainable Development Goals is a necessity resulting from the obligations of each Member State towards the EU.
1.2. Renewable Energy Sources
In the 2030 Agenda for Sustainable Development, one of the goals is to ensure universal access to “affordable, reliable, sustainable and modern energy”. It is to be achieved by “increasing substantially the share of renewable energy in the global energy mix” and “promoting investment in energy infrastructure and clean energy technology” [31].
The measures taken in this respect are intended to increase the effectiveness of the fight against the progressive degradation of the environment and the increasing greenhouse gas emission, which pose a serious threat to humanity in the form of environmental pollution and adverse climate change [32]. In order to halt these processes, global developed countries are implementing the United Nations Framework Convention on Climate Change (UNFCCC). It describes the basic framework for global cooperation in this complex area. This document was supplemented by the provisions of the 2030 Agenda, the Kyoto Protocol (1997), and the Copenhagen Accord (2009). These arrangements identify measures to address the deteriorating quality of the environment [33].
The European Union also developed a strategy aimed at fulfilling international commitments in the fight against climate change as well as introducing the concept of sustainable energy [34]. The strategy is being implemented progressively in three major stages through the achievement of the programme targets set out in each of them [35,36] (Table 2).
Table 2.
Energy policy targets in the European Union.
A key event for the development of RES in EU Member States was the agreement [38] reached during the 21st session of the Conference of the Parties held in Paris.
Its aims include combating climate change and supporting economic development to achieve more sustainable development and lower greenhouse gas emissions. The main objective of the agreement is to keep the temperature at the level between 1.5 and 2 °C higher than in the pre-industrial period. The agreement, having entered into force in 2016, was ratified by 187 countries. Signatories are required to prepare their NDC (National Determined Contribution), in which they outline methods to reduce GHG emissions, and methods to monitor the progress of its implementation.
Consequently, the EU adopted a plan under the 2030 Framework for Climate and Energy [39] to create a sustainable energy system. The plan consists of the following components:
- Improving energy efficiency;
- Providing access to affordable energy for all consumers;
- Increasing energy independence, which is important in light of the information that 55% of the energy consumed in the Member States was produced from resources originating outside the EU;
- Introducing a fully integrated common energy market (energy union);
- EU Member States becoming world leaders in producing energy from renewable sources.
It was therefore planned that renewable energy sources will play an important role in the future EU energy system.
The European Union’s actions are important for achieving global energy equilibrium, as it is composed of countries with a high level of consumption, well-developed economies, and strong urbanisation.
An important role in the future EU energy system.
In 2018, energy production in the EU was at 634.751 TOE, of which 35.2% came from fossil fuels, 30.8% from nuclear power plants, and 34% from RES. The value of energy produced from RES in EU Member States was at 217.388 TOE, of which 40% was from solid biofuels, 14% from wind and hydropower, and 9% from liquid biofuels. The share of energy derived from solar and geothermal sources and from biogas was less than 5%.
In the course of strategy implementation, between 2020 and 2050 the energy mix is to be substantially modified so that by the end of the reference period (2050) 20% of energy will come from fossil fuels, 25% from nuclear power plants, and 55% from RES.
Renewable energy sources are of key importance due to rising CO2 emissions. Therefore, economists and analysts are focusing on the particular importance of the use of renewable energy sources instead of conventional resources [40]. In their opinion, the path to a sustainable environment should lead to a reduced use of traditional energy sources, which should be replaced by RES, characterised by lower GHG emissions and environmentally-friendly technological processes [41,42]. In addition, RES support the implementation of the majority of the energy policy targets adopted by many European countries, i.e., increased diversification of supplies makes it possible to reduce the demand for imported energy. The implementation of the energy and climate package through the reduction of greenhouse gas and dust emissions will support the development of competitive markets as well as the growth of innovation and entrepreneurship of the human capital. In addition, the more widespread the sources of distributed generation and the use of regional resources for its production, the greater the likelihood of ensuring local energy security and reducing transmission losses. The main energy policy objectives in the area of RES include:
- Minimum use of forests for biomass production and maximising the use of agricultural areas for diversified RES generation;
- Significant increase in the share of biofuels in total transport fuels;
- Creating an appropriate framework for the sustainable development of distributed generation sources.
According to sustainable development standards, one of the priorities for politicians at every level should be to reduce the negative impact of the energy sector on the environment. Hence the importance of measures to mitigate the adverse effects of climate and biotic changes.
In the context of energy sources, the problem of sustainable development can be limited to the use of sources which are not significantly depleted by continued use, and whose use does not result in large-scale emissions of pollutants or other substances hazardous to the environment. It is also important that their use does not perpetuate significant risks to human life and health, but also social injustice [43].
Prandecki points out that there is no doubt that renewable sources are an example of the most sustainable energy generation technologies. However, their use must take into account many factors and conditions at the national and regional level, e.g., generating capacity, access to energy resources, as well as the demand for energy in a given area and the size of its distribution [44]. Suska-Szczerbicka emphasises that renewable energy sources are characterised by a special property, as their use in a given location does not limit the generally available energy resources; instead, the level of RES remains constant, and they are not depleted [45]. Non-renewable resources can thus be treated as an energy reserve of sorts, which can be used in “better times”, i.e., when production and energy technologies are radically improved.
Therefore, the inexhaustibility, universality, and general availability of renewable energy resources, combined with an effectively pursued energy policy, encourage the increasing use of RES in energy production worldwide [46]. In particular, this is due to the fact that the potential offered by renewable energy sources is considerable and includes wind energy, solar energy, aerothermal energy, geothermal energy, hydrothermal energy, hydropower, wave, current and tidal energy, energy from biomass, biogas, agricultural biogas, and bioliquids. Society is slowly becoming aware of the existence of so many alternative energy sources in relation to conventional energy sources; however, the necessity to meet international obligations resulting from the sustainable development strategy, as well as the United Nations Framework Convention on Climate Change and the 1997 Kyoto Protocol on the reduction of GHG emissions into the atmosphere, results in intensified measures to develop the RES sector.
The importance of clean and sustainable energy to which all citizens have universal access is underscored by the fact that in its Agenda for Sustainable Development, the UN decided to highlight an area that focuses on energy. The key targets of this goal include:
- Substantially increasing the share of renewable energy in the global energy mix.
- Ensuring universal access to affordable, reliable and modern energy services, including RES.
Among the technologies available on the market, there are solutions that are financially available only to the largest entities, such as governments or enterprises, but there are also solutions dedicated to households, corresponding to their financial capacity. These are state-of-the-art technologies under continuous development, which constantly reduces their price and improves their reliability.
2. Materials and Methods
The statistical material used in the study was obtained from the Eurostat [47], World Bank [48], and International Renewable Energy Agency databases [49]. The time frame of the study covered the period from 2010 to 2019. Three countries, Cyprus, Malta, and Luxembourg, were omitted from part of the analyses due to their negligible renewable energy generation (less than 10PJ in 2018). The direction and rate of change of the share of renewable energy in gross final energy consumption was determined by identifying trend models on the basis of time series . The fitting of the trend line resulted from the analysis of the increments of the studied characteristic in the studied time. Statistical verification of trend models was also performed.
Czekanowski’s method, [50,51,52,53,54] was used to indicate the similarities of countries in terms of the structure of renewable energy production (by source). The following components of the structure of renewable generation were selected for the analysis: hydropower, solar (thermal, photovoltaic-PV), wind, biofuels (solid, liquid), biogas, geothermal, renwaste, and other renewable. The Manhattan metric was used as a measure of distance. Ordering of the diagram (graphical representation of the distance matrix of objects) was performed with the use of MaCzek software, version 3.3.49 [55]. Jan Czekanowski invented the original method at the beginning of the 20th century, twenty years ahead of subsequent works on classification problems. The advantage of a Czekanowski’s diagram is that it presents the relationships and similarities between the studied objects and at the same time emphasises all the connections between variables. A Czekanowski’s diagram, being a kind of a similarity map of objects, unlike dendrograms, also preserves information about the relationships between all pairs of objects in a series.
In the process of creating a synthetic measure for assessing the level of implementation of energy policy goals resulting from the National Renewable Energy Action Plans, the synthetic variable proposed by Hwang was applied [56]. The choice of the country ordering algorithm was preceded by the Kukuła, Luty [57] procedure supporting the selection of the linear ordering method. Under the Technique for Order of Preference by Similarity to Ideal Solution method (TOPSIS), a three-stage algorithm was adopted. Firstly, the characteristics describing the analysed phenomenon were selected using Sustainable Development Goals indicators (Table 3). The basis for the selection of variables for the assessment was the strategic EU climate and energy policy objectives referred to as “20-20-20”, which should have been achieved by 2020.
Table 3.
Variable description.
The selected variables indicate the percentage by which the figure increased (share of renewable energy in gross final energy consumption) or decreased (energy intensity level of primary energy, greenhouse gas emissions intensity of energy consumption) in the given year compared to 2010.
In the second step, the features were normalised using the feature standardisation method according to the following formula:
where ,− the actual and normalised value of the feature for the object i, respectively; ,− the arithmetic mean and standard deviation of the feature , respectively. Then, for each variable, vector coordinates of the pattern () and the anti-pattern () of development were determined, defined as follows:
In the third step, the values of the synthetic variable for each object were determined according to the following formula:
where , are the Euclidean distances-between the objects and the pattern and the anti-pattern of development defined as:
The highest value indicates the best object.
The value of the synthetic variable made it possible to divide the analysed objects into groups according to the following principle:
- Group 1:
- Group 2:
- Group 3:
- Group 4:
where are respectively the arithmetic mean and the standard deviation of the synthetic variable defined according to Formula (3).
The TOPSIS method has found great recognition in many fields, among others in economics or management. This method is a counterpart of Hellwig’s taxonomic method of ordering objects, which takes into account both the best and the worst alternatives for measuring the adopted diagnostic variables.
3. Results
3.1. Differentiation of the European Union Member States in Terms of Renewable Energy Production
Achieving the long-term targets set in the National Renewable Energy Action Plans requires a shift from conventional resources towards low-carbon energy sources. This implies the need to invest in an energy infrastructure that generates energy from environmentally-friendly sources. The disparities in RES energy production between EU Member States were, and still are, very large (Figure 1; Table 4). In particular, these differences become visible when the Member States are divided into countries that joined the EU before 2004 (EU-14) and others (EU-11). The clear leader in the EU is Germany, where the amount of energy generated in 2018 was 1800 PJ. Among the EU-11, Poland produced the most energy from RES in 2018 (372PJ). In 2018, in the case of eight countries (Croatia, Estonia, Czechia, Hungary, Latvia, Lithuania, Slovakia, Slovenia) RES production did not exceed 100 PJ.
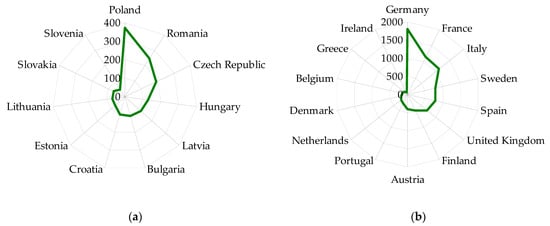
Figure 1.
Renewable energy production in EU countries 2018 (PJ): (a) Countries that joined the EU in 2004 or later, (b) Countries that joined the EU before 2004. Source: Own study based on [49].
Table 4.
Numerical characteristics of renewable energy production by source in EU country groups 2019 (PJ).
Basic characteristics of the volume of renewable energy generation by source also indicate notable differences between the EU-14 and the EU-11 (Table 4). Biofuels are definitely an important source of renewable energy in both analysed groups, with the average production volume in the EU-14 amounting to more than double the production in the EU-11.
The second major renewable energy source in the EU-11 was hydropower, with the average national production in 2018 amounting to 14.9 PJ. This figure was 78.4 PJ in the EU-14, which was lower than the average national production from wind power (90.5 PJ).
The similarity of Member States in terms of the structure of renewable energy production (by source) using the Czekanowski method and the Manhattan metric, taking into account 2018 data, is presented in Figure 2. This figure is a graphic visualisation of the distance matrix (similar). For pairs of countries with identical structures, the distance is zero. The increasing structural differences of the compared spatial objects are accompanied by an increase in the value of the measure of similarity.
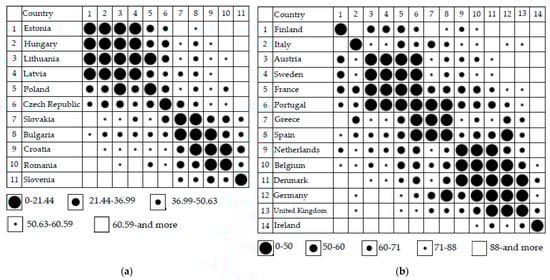
Figure 2.
Similarity of EU Member States in terms of renewable energy production structure (by source) as of 2018: (a) Countries that joined the EU in 2004 or later, (b) Countries that joined the EU before 2004. Own study based on [49].
In the EU-11, countries such as Estonia, Hungary, Lithuania, and Latvia form a homogeneous group. In this group, biofuels are the main source of energy. The structure of renewable energy generation in Poland also shows significant similarity to the Member States from this group. Thus, in Estonia as much as 95% of RES is generated from biofuels. A slightly smaller percentage of energy from this source is generated in Latvia (89%), Hungary (86%) Lithuania (86%), and Poland (79%). The second largest renewable energy source in these countries in terms of share is respectively: wind (Poland 12%, Lithuania 6%, Estonia 3%), water (Latvia 7%), and geothermal (Hungary 5%).
Seventy-two percent of RES production in Czechia comes from biofuels. The second largest source in this country in terms of share is biogas (13%).
Slovakia, Bulgaria, Croatia, and Romania are another group showing significant similarity of the analysed structure. In Bulgaria and Slovakia, renewable energy is generated from biofuels (64% and 67%, respectively) and hydropower (17% and 19%, respectively). In such countries as Croatia and Romania, almost 62% of RES comes from biofuels, and 28% and 26% from hydropower, respectively.
Slovenia stands out among the EU-11 for having the highest share of renewable energy production from hydropower (38%). The country generates 51% of its renewable energy from biofuels.
In the EU-14, countries such as Finland, Italy, and Ireland are distinguished by the structure of RES generation by source. In Finland, this energy is mainly derived from biofuels (77%) and hydropower (10%). Italy stands out from all EU Member States due to significant percentage of renewable energy from geothermal sources (20%). Furthermore, 29% of renewable energy in Italy comes from biofuels and 16% from hydropower. Ireland derives 56% of its energy from wind and 21% from biofuels.
Countries such as Austria, Sweden, France, and Portugal generate about 50% of their renewable energy from biofuels. The second largest source of this energy is hydropower, whose share in total production is 33%, 28%, 20%, and 17%, respectively. For Portugal, energy generated from wind also accounts for 17% of total renewable energy.
Greece and Spain have a renewable energy generation structure similar to Portugal. In these countries, the main sources of renewable energy are biofuels, wind, solar, and hydropower.
Another group in the EU-14 are the Netherlands, Belgium, Denmark, Germany, and the United Kingdom. In these countries, the main RES are biofuels and wind. In Germany and the UK, 18% and 17% of this energy is derived from biogas, respectively.
3.2. Achieving EU Energy Policy Targets Relating to Renewable Energy Sources
In 2019, the share of RES in gross energy consumption in the EU was 18.9%, which means that the 2020 target is 1.1 pp. short of being met. Back in 2010, the share in the EU energy mix was only 13.2%. Between 2010 and 2019, the share of RES in national energy mixes increased in all EU Member States (Figure 3). The clear EU leader in terms of RES share in gross energy consumption is Sweden (56.4%), followed by Finland (43.1%), Latvia (41.0%), and Denmark (37.2%). On the other hand, in 2019 the Member States with the lowest share of RES were the Netherlands, with a share of only 8.8%, followed by Belgium (9.9%), Malta (8.5%), and Luxembourg (7.0%).
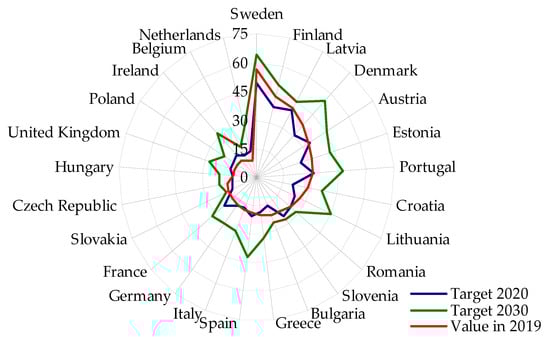
Figure 3.
Share of renewable energy in gross final energy consumption in year 2019 and target 2020 and 2030 (%). Source: Own study based on [47].
In 2019, fourteen EU Member States reached the targets they had committed to achieve by 2020: Bulgaria, Czechia, Denmark, Estonia, Greece, Croatia, Italy, Latvia, Lithuania, Finland, Romania, Slovakia, Sweden, and Cyprus. Four countries, Hungary, Austria, Portugal, and Germany, were close to meeting their 2020 commitment, falling short by less than 0.7 pp. The widest gap to meet the national 2020 targets was observed for France (5.8 pp.), the Netherlands (5.2 pp.), Ireland (4.0 pp.), Belgium (3.1 pp.), and Slovenia (3.0 pp.). Other Member States fall short by 1.6 pp. (Spain) to 2.8 pp. (Poland).
According to the target set by the European Union by 2030 as part of the so-called “Winter Package”, the share of RES in the EU energy mix should increase to 32%. It is worth noting that three countries have set national targets for the share of renewable energy in gross final energy consumption for at least 50%: Sweden (64%), Denmark (55%), and Finland (50%). The nine countries which have set a target of increasing their share of energy from renewable sources to no more than 25% include Poland (21%), Bulgaria (25%), Luxembourg (23%), Czechia (21%), Hungary (20%), Cyprus (19%), Slovakia (18%), Belgium (18%), and Malta (11%).
For the majority of EU Member States (excluding Hungary and Slovenia), between 2010 and 2019 there were continuous and regular changes in the share of renewable energy in gross final energy consumption (%), which allowed for the determination of trend models (Table 5). By extrapolating the fitted linear trends, forecasts for 2020 and 2030 were developed. The quality of these forecasts will depend on the stability of the economic regularity of the phenomenon over time, as they are built on the assumption that the trend observed so far will not change. In the next step, they were compared with the targets set in the national plans of respective Member States.
Table 5.
Development trend models share of renewable energy in gross final energy consumption (%) and EU country projections estimated from time series 2010–2019 .
The rate of changes to date indicates that not all Member States will achieve the target without adjusting their policies. Bulgaria, Czechia, Denmark, Finland, Latvia, Slovakia, and Sweden are likely to meet the 2030 targets.
The leaders in the implementation of energy policies in the context of RES are Denmark and Finland, where the average annual increase in 2010–2019 was 1.72 pp. and 1.19 pp., respectively. The least intensive measures among the EU Member States were taken in Poland, Austria, and Romania, where year-on-year indicators increased by 0.21 pp., 0.25 pp., and 0.26 pp., respectively.
In Hungary and Slovenia, the trends in renewable energy in gross final energy consumption over the years under study were not stable. The coefficients of the average rate of change of the phenomenon, which were estimated respectively at the level of 0.999 and 1.005, indicate that the changes of the examined characteristic over the ten years only slightly. Thus, in the case of Hungary there was a decrease of 0.13 pp and for Slovenia an increase of 0.89 pp.
3.3. Achievement of EU Energy Policy Targets
The aim of this part of the analysis was to identify similarities between Member States in terms of taking action to meet the EU energy policy targets set out in the 2020 climate and energy package. Groups were identified by comparing the dynamics of the three variables: reduction of the energy intensity of the economy (EI), reduction of greenhouse gas emissions (GHG) and share of energy from renewable sources (RES). Groups of similar countries were created using a synthetic variable proposed under the TOPSIS method.
The final breakdown into four country groups is presented in Table 6. Descriptive statistics for the variables in the groups are listed in Table 7.
Table 6.
Groups of EU Member States similar in terms of achievement of energy policy targets as of 2019.
Table 7.
Numerical characteristics of indicators of the level of achievement of energy policy targets in groups of Member States.
The first group included Denmark, Ireland, and the United Kingdom. The share of energy derived from renewable sources in 2019 compared to 2010 increased by 219% in the UK, by 107% in Ireland and by 69% in Denmark (Table 7). This group also saw the largest decrease in the energy intensity of the economy, averaging 25.70%. There was also a significant, although not the largest, reduction in greenhouse gas emissions compared to 2010.
Countries from the second group increased their share of low-carbon energy sources on average by 21%, with the largest change in the Netherlands (123%) and Slovakia (86%). Significant progress in this group could be observed in relation to GHG emission reductions, as the average result was similar to that of the first group at 15.11%. The leaders in this respect were Finland (26.33%), Sweden (23.96%), and Lithuania (18.09%).
In the third group, which included the largest number of countries, the share of energy from renewable sources increased on average by 37% in the analysed period. The most intensive measures in this respects were taken in Greece (95.27%), Belgium (65%), Bulgaria (54%), and Czechia, where the share of renewable energy increased by 54%. Energy intensity reduction measures in certain countries did not bring the desired effects, in particular in Greece, where the energy intensity of the economy increased in 2015 compared to 2010. The rate of changes in GHG emissions reduction was almost one half lower compared to the first and the second group.
Austria, Portugal, and Spain formed the fourth group. These were countries where measures to increase energy generation from environmentally-friendly sources were the least effective. The energy intensity of the economy was reduced only slightly, on average by 4.87%. Changes in the reduction of greenhouse gas emissions were also very low in this group, with the average result of 3.36% in 2018 compared to 2010. It is worth noting that these Member States did not manage to reduce greenhouse gas emissions by 20%; in fact, these values increased compared to 1990.
The relationship between energy generation from RES and economic growth assessed in terms of GDP growth is of great interest to the economists. Authors of numerous studies [58,59,60,61] analyse different countries and use different modelling methods to verify hypotheses on the existence of causal connections between energy consumption, including energy obtained from renewable sources, and GDP growth. Figure 4 presents the descriptive statistics of real GDP in thousands of euro per capita in 2019, and the trend coefficients of the share of renewable energy in gross final energy consumption (%) presented in Table 5 in the groups of similar countries in terms of the level of achievement of energy targets in 2019 adopted variables to assess the level of achievement of energy policy targets resulting from the National Renewable Energy Action Plans.
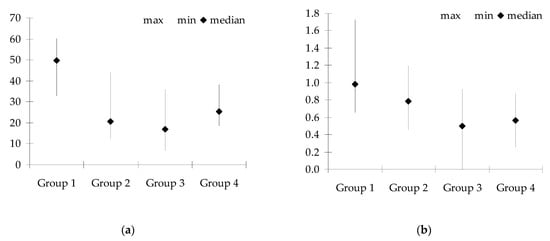
Figure 4.
Figure characteristics of real GDP in thousands of euro per capita in 2019 (a) and trend coefficients of the share of renewable energy in gross final energy consumption (%) (b) in groups of similar countries in terms of the level of achievement of energy targets in 2019, respectively. Own study based on Table 5, [47].
All Group 1 countries had real GDP per capita in 2019 significantly higher than the EU-wide figure of GBP 27.970. Ireland and the UK have set national targets for the share of renewable energy in gross final energy consumption for both 2020 and 2030 that are lower than those indicated in the European Commission Directive. At the current rate of change, these countries will not meet the policy (Table 5). Denmark, on the other hand, has set targets significantly higher than those set for the EU, which it consistently fulfils. In all Group 1 countries the main sources of environmentally friendly energy are biofuels and wind.
Among the countries classified in the second group, only the Netherlands is predicted to miss its national target of share of renewable energy in gross final energy consumption for 2020, although it is one of the lowest in the EU. This indicator for Group 2 countries has on average increased from 0.46 pp to 1.19 pp year on year. The GDP per capita variation was 48.4% for the countries in this group. The three countries of this group that joined the EU in 2004 had GDP per capita significantly lower than the others. The main source of renewable energy for all countries in this group is biofuels.
The most populous group of similar countries in terms of measures taken to achieve the EU energy policy objectives set out in the climate and energy package for 2020 is characterised by the lowest average rate of change of the share of renewable energy in gross final energy consumption. Countries in this group have generally (except Slovenia, Romania, France, and Croatia) set this indicator at the level of no more than 18%. Half of them have a GDP per capita of less than EUR 17000. Among the countries in this group, that joined the EU in 2004 or later, biofuels are the main source of renewable energy. Among the EU-14 Group 2 countries, other resources are also used to diversify energy sources.
The three countries classified in Group 4 set their national targets for share of renewable energy in gross final energy consumption for 2020 and 2030 at a higher than average for EU level. Portugal, with the lowest GDP per capita in this group, had the highest (also in this group) average annual increase of renewable energy in gross final energy consumption. The opposite was true for Austria. Important sources of renewable energy in these countries are biofuels, hydropower, and wind.
Increasing requirements, in particular the environmental ones, for the construction of various renewable energy production plants have and will have a direct impact on RES development in the coming years. This includes new environmental requirements for the construction of hydropower plants, as well as various national restrictions on the location of biogas plants and wind farms. The latter are also accused and sometimes stigmatised for being harmful to the environment, including bioflora, in an almost hidden yet significant way. Agriculture, a potentially important producer of resources for renewable energy generation [62] also seems to be in decline in this respect. Although the issue of supporting the production of energy resources in agriculture is one of the components of the EU Common Agricultural Policy, between 2014 and 2020 the “enthusiasm” in this area has clearly faded [63]. Most of the instruments and mechanisms of financial support for the production of energy resources have been withdrawn, both on arable land and grassland, as well as with regard to new energy plantings. Production of these resources is now carried out on a strictly commercial basis with the EU direct payments applied on a general basis. Hence, maize processed in biogas plants has become the most important commodity in many Member States. However, there are still great opportunities for RES production in rural areas, in particular on farms. This is reflected in the Green New Deal, which will be implemented between 2021 and 2027 in EU Member States [64]. The Green New Deal is a new appeal to the Member States to respect the environment in the conditions of sustaining economic development and raising the standard and quality of life. It thus meets both the general conditions for sustainable development and for promoting the level of economic development. It formulates ambitious EU climate targets for 2030 and beyond to 2050. It also indicates that, on the basis of research and by stimulating innovation, it is possible to provide clean energy at affordable prices on a much larger scale. It also draws attention to the need to accelerate the achievement of zero pollution in the operation of energy equipment (and chemical plants). Rural areas, including agricultural areas, are to play a greater role in photovoltaic installations, heat pumps [65], biogas plants, and wind farms. RES production should also have a more local nature, i.e., be based on relatively small plants generating energy for the needs of local businesses and households of the local population. The development of prosumer energy, i.e., photovoltaic micro-plants, is also a great opportunity to increase renewable energy production. It can be assumed at some risk that the future of RES development lies in the popularisation, even at the massive scale, of small photovoltaic plants which, by producing energy from sunlight instead from heat, can be installed in almost all EU Member States. It is an open question how the economies of EU Member States will react to the upcoming economic changes caused by the COVID-19 pandemic. Its various effects, also those relating to the economy, including energy, will probably become apparent in its wake. The level of economic development measured by GDP (per capita) may be reviewed. Changes in the economy caused by the pandemic, their rate, but also the direction of necessary and possible transformation will be important, also from the cognitive point of view. In view of the economic slowdown and the threat of recession, and thus a drop in the demand for energy, will the priorities in the area of RES support be maintained? It can be expected, however, that the demand for electricity will increase, which will undoubtedly be strongly influenced by the accelerating conversion of the European car fleet from liquid fuels to hybrid or purely electric vehicles. Moreover, countries whose energy production is mainly or significantly based on coal, such as Poland and Germany, will be encouraged by pro-environmental EU regulations and the system of financial transfers to restructure their energy portfolios, which will undoubtedly involve the development of RES.
4. Conclusions
Renewable energy sources (RES) are playing an increasingly important role in the energy supply structure, and certain RES technologies have reached the level of competitiveness similar to technologies based on fossil fuels. The process of gradual transformation from a coal-based economy to an economy using green, low-carbon technologies that meet social needs and ensure energy security not only locally, but also regionally and in the long term, is being initiated by the growing number of EU Member States.
Over the past decade or so, the importance of energy from renewable sources in Europe has significantly increased. EU Member States are highly diversified in terms of generating energy from these sources. In the group of countries that joined the EU after 2004, the problem of generating energy from renewable sources is related, on the one hand, to the necessity of fulfilling national obligations in the ratified energy and climate package and, on the other hand, to the specific nature of the economies of those countries, which are mainly based on conventional energy.
The low share of renewable energy sources is also due to the fact that investments in environmentally-friendly energy solutions require corresponding large financial outlays.
Research has confirmed that the share of renewable energy in in gross final energy consumption in the analysed EU Member States is highly diverse. This is mainly due to the resources for energy production available in these countries and the existing and still efficient systems for their acquisition and generation of non-renewable energy. It also depends on the level of energy demand in the economy, including households. In these analyses, it is also important to refer the level and structure of the produced energy to such country characteristics as its area and population. The environmental conditions in a given country are also important here, in particular climate conditions and those affecting the productivity of ecosystems, which can produce resources for RES generation. The use of RES technologies depends largely on natural circumstances. The ongoing research on modern technologies gives the possibility to use various sources of energy. Some of them, with the use of modern solutions, are or will be able to be introduced in many countries. Hence, the presentation of a group of similar countries in terms of the main sources of energy. This information will give the opportunity to compare a given country with others of similar environmental and geographical conditions and, if such opportunities arise, to diversify the sources of energy.
Among the leaders in generating energy from renewable sources are Germany, France, and Italy. The structure of energy production from different sources is highly dependent on natural predestination, including in particular hydropower, wind energy, solar energy, and biomass. The highest share of RES from biofuels is reported in Estonia, Latvia, Lithuania, and Hungary. With regard to hydropower, Austria, Sweden, Croatia, and Romania are the leaders among the analysed countries. On the other hand, Ireland, United Kingdom, Denmark, and Germany have a high share of wind energy production.
In the case of all analysed EU Member States, there is an upward trend in the share of renewable energy in gross final energy consumption, which is mainly due to the need to achieve the national targets set out in the national plans which are a direct result of EU directives. Most countries (14) have met the 2020 target and 4 have exceeded the 2030 target. The most dynamic changes in 2019 compared to 2010 occurred in Denmark, Finland, and Sweden, which allowed these countries to significantly exceed their 2020 targets by 9.22%, 6.39%, and 8.32%, respectively.
Some Member States made efforts to increase production of (energy from) RES, and some probably decided to purchase the volumes of energy they require to meet their national RES target within the so-called Statistical Transfer. Virtual green energy may be supplied by the countries which have already met their targets.
The leaders in implementing environmentally friendly energy policies are Denmark, the UK, and Ireland. These countries show the highest rate of change in terms of achieving the targets set in their National Renewable Energy Action Plans. The decrease in energy intensity of these economies and efforts to reduce greenhouse gas emissions are also positive. In addition to environmental conditions, which Ireland undoubtedly has at its disposal, solutions for the implementation of new technologies may be implemented in the countries where the dynamics of changes in the aforementioned areas is lower than the EU average. This refers to organisational as well as technological solutions.
In the struggle to improve the quality of the climate, it is important to reduce the energy intensity of the economy and greenhouse gas emissions. The least effective measures in this respect were introduced by Austria, Portugal, and Spain, where the energy intensity of the economy was reduced only slightly, by 4.87% on average, and the reduction of greenhouse gas emissions was very low, at 3.36% on average in 2018 compared to 2010.
Institutional aspects have an impact on the development of the RES market, including the country’s level of development, its innovativeness, or its openness to change. It should also be considered that each EU Member State has its own established sources of non-renewable energy, previously built power plants, as well as financial and human capital involved in the energy sector. Moreover, important is the political situation in respective countries where restructuring the energy mix requires large capital outlays, the decline of part of the old classic power stations and hence a reduction in employment or even regression in sub-regional development. However, the increase in environmental awareness of societies and various pro-environmental activities of the state and non-governmental organisations are strong determinants for the continuation of sustainable development, in which RES are a very important link. The EU policy has a significant impact on the activities undertaken in the Member States in the field of introducing technologies that generate energy from RES. National authorities supervised by the European Commission in many countries guarantee the implementation of policies favouring positive climate change. It is also connected with the implementation of the recommendations contained in the EU Directives regarding the support of RES development. Removal of government subsidies for the extraction of fossil fuels affects the relative increase in the competitiveness of RES, which is an example of an effective policy encouraging the use of this technology. The possibility of implementing RES technologies also depends on natural conditions; however, the overwhelming majority of countries are able to effectively implement RES. Identifying the leading countries makes it possible to compare the actions taken by the member states, both on the legislative and organisational level. Determining the pace of changes in the implementation of the national goals for 2030 will allow to determine which countries will be able to achieve the goals regarding the share of renewable energy sources in the total energy mix. Identifying the similarities will allow countries to implement policies that have been proven effective, in relation to the introduced EU criteria, in countries with similar environmental and institutional conditions.
Author Contributions
Conceptualization, W.M., M.Z., L.L., and K.M.; methodology, L.L.; formal analysis, L.L. and M.Z.; investigation, M.Z., W.M., and L.L.; resources, M.Z, W.M., K.M., and L.L.; data curation, L.L. and M.Z.; writing—original draft preparation, W.M., M.Z., L.L., and K.M.; writing—review and editing, W.M.; visualisation, L.L.; supervision, W.M.; funding acquisition, L.L., W.M. and M.Z. All authors have read and agreed to the published version of the manuscript.
Funding
The research was cofinanced from resources of Faculty of Agriculture and Economics University of Agriculture in Krakow.
Institutional Review Board Statement
Not applicable.
Informed Consent Statement
Not applicable.
Data Availability Statement
Not applicable.
Conflicts of Interest
The authors declare no conflict of interest.
References
- Cadoret, I.; Padovano, F. The political drivers of renewable energies policies. Energy Econ. 2016, 56, 261–269. [Google Scholar] [CrossRef]
- Lucas, J.N.V.; Francés, G.E.; González, E.S.M. Energy security and renewable energy deployment in the EU: Liaisons dangereuses or virtuous circle? Renew. Sustain. Energy Rev. 2016, 62, 1032–1046. [Google Scholar] [CrossRef]
- Papież, M.; Śmiech, S.; Frodyma, K. Determinants of the renewable energy development in the EU countries. A 20-year perspective. Renew. Sustain. Energy Rev. 2018, 91, 918–934. [Google Scholar] [CrossRef]
- Menegaki, A.N. Growth and renewable energy in Europe: A random effect model with evidence for neutrality hypothesis. Energy Econ. 2011, 33, 257–263. [Google Scholar] [CrossRef]
- Alper, A.; Oguz, O. The role of renewable energy consumption in economic growth: Evidence from asymmetric causality. Renew. Sustain. Energy Rev. 2016, 60, 953–959. [Google Scholar] [CrossRef]
- Kula, F. The long-run relationship between renewable electricity consumption and GDP: Evidence from panel data. Energy Sources Part B Econ. Plan. Policy 2014, 9, 156–160. [Google Scholar] [CrossRef]
- Neitzel, D. Examining Renewable Energy and Economic Growth: Evidence from 22 OECD Countries. Honors Program Theses, 2017. Available online: https://scholarship.rollins.edu/honors/46 (accessed on 25 February 2021).
- Śmiech, S.; Papież, M. Energy consumption and economic growth in the light of meeting the targets of energy policy in the EU: The bootstrap panel Granger causality approach. Energy Policy 2014, 71, 118–129. [Google Scholar] [CrossRef]
- Kasman, A.; Duman, Y.S. CO2 emissions, economic growth, energy consumption, trade and urbanization in new EU member and candidate countries: A panel data analysis. Econ. Model. 2015, 44, 97–103. [Google Scholar] [CrossRef]
- Czekanowski, J. Zarys Metod Statystycznych w Zastosowaniu do Antropologii; Prace Towarzystwa Naukowego Warszawskiego: Warsaw, Poland, 1913. [Google Scholar]
- Brundtland, G.H. Report of the World Commission on Environment and Development: Our Common Future towards Sustainable Development 2; Part II. Common Challenges Population and Human Resources 4. 1987; Available online: https://sustainabledevelopment.un.org/content/documents/5987our-common-future.pdf. (accessed on 24 February 2021).
- Haughton, G. Environmental Justice and the Sustainable City. J. Plan. Educ. Res. 1999, 18, 233–243. [Google Scholar] [CrossRef]
- Kates, R.; Parris, T.M.; Leiserowita, A.A. What is sustainable development? Goals, indicators, values, and practice. Environ. Sci. Policy Sustain. Dev. 2005, 47, 8–21. [Google Scholar]
- Sachs, J.D. From Millennium Development Goals to Sustainable Development Goals. Lancet 2012, 37, 2206–2211. [Google Scholar] [CrossRef]
- Griggs, D.; Stafford-Smith, M.; Gaffney, O.; Rockström, J.; Öhman, M.C.; Shyamsundar, P.; Steffen, W.; Glaser, G.; Kanie, N.; Noble, I. Policy: Sustainable Development Goals for People and Planet. Nature 2013, 495, 305–307. [Google Scholar] [CrossRef]
- Przekształcamy Nasz świat: Agenda na Rzecz Zrównoważonego Rozwoju 2030 (We are Transforming Our World: The 2030 Agenda for Sustainable Development) Rezolucja Zgromadzenia Ogólnego ONZ A/RES/70/1, Paryż, 25 Września 2015. Available online: http://www.unic.un.org.pl/files/164/Agenda%202030_pl_2016_ostateczna.pdf. (accessed on 24 February 2021).
- Cele Zrównoważonego Rozwoju (Sustainable Development Goals). Available online: www.un.org.pl (accessed on 11 January 2021).
- Eurostat, Indicators—Sustainable Development Indicators. Available online: https://ec.europa.eu/eurostat/data/database (accessed on 19 March 2021).
- Główny Urząd Statystyczny. Wskaźniki Zrównoważonego Rozwoju Polski (Sustainable Development Indicators of Poland) Katowice; Główny Urząd Statystyczny: Warsaw, Porland, 2021.
- 27 Zasad Zrównoważonego Rozwoju—Deklaracja z Rio (27 Principles of Sustainable Development—Rio Declaration). Available online: https://www.ekologia.pl/artykul/inne/27-zasad-zrownowazonego-rozwoju,7035.html (accessed on 19 February 2021).
- De Andrade, L.O.M.; Filho, A.P.; Solar, O.; Rígoli, F.; De Salazar, L.M.; Serrate, P.C.F.; Ribeiro, K.G.; Koller, T.S.; Cruz, F.N.B.; Atun, R. Social Determinants of Health, Universal Health Coverage, and Sustainable Development: Case Studies from Latin American Countries. Lancet 2015, 385, 1343–1351. [Google Scholar] [CrossRef]
- Hassini, E.; Surti, C.; Searcy, C. A Literature Review and a Case Study of Sustainable Supply Chains with a Focus on Metrics. Int. J. Prod. Econ. 2012, 140, 69–82. [Google Scholar] [CrossRef]
- Del Río, P.; Carrillo-Hermosilla, J.; Könnölä, T. Policy Strategies to Promote Eco-Innovation An Integrated Framework. J. Ind. Ecol. 2010, 14, 541–557. [Google Scholar] [CrossRef]
- Janka, R.M. Emisja Zanieczyszczeń. In Podstawy Programowania Wielkości Emisji Oraz Opłat za Wprowadzanie Zanieczyszczeń do Atmosfery; (Emission of Pollution. Basics of Programming the Amount of Emissions and Charges for Discharging Pollutants into the Atmosphere); Wydawnictwo KURIER: Opole, Poland, 2006. [Google Scholar]
- Konstańczak, S. Racjonalność strategii zrównoważonego rozwoju (Rationality of the sustainable development strategy). In Etyka Biznesu i Zrównoważony Rozwój. Interdyscyplinarne Studia Teoretyczno-Empiryczne; Śląskie Centrum Etyki Biznesu i Zrównoważonego Rozwoju: Katowice, Poland, 2016; Volume 1, pp. 58–70. [Google Scholar]
- Lewandowski, W.M. Proekologiczne Odnawialne Źródła Energii (Pro-Ecological Renewable energy Sources); Wydawnictwo Naukowo-Techniczne: Warsaw, Porland, 2007. [Google Scholar]
- Gradziuk, P.; Gradziuk, B. Próba oceny efektów absorpcji Środków z Funduszy Europejskich na rozwój wykorzystania odnawialnych źródeł energii w województwie lubelskim (An attempt to assess the effects of the absorption of funds from European Funds on the development of the use of renewable energy sources in the Lublin Province). Rocz. Nauk. Ekon. Rol. i Rozw. Obsz. Wiej. 2017, 104, 95–105. [Google Scholar] [CrossRef]
- Ciepielewska, M. Rozwój Odnawialnych Źródeł Energii w Polsce w Świetle Unijnego Pakietu Klimatyczno-Energetycznego Oraz Ustawy o Odnawialnych Źródłach Energii (Development of renewable energy sources in Poland in the light of the EU Climate and Energy Package and the Act on Renewable Energy Sources). Gospod. Prakt. Teor. 2016, 43, 7–18. [Google Scholar] [CrossRef]
- Prandecki, K. Theoretical Aspects of Sustainable Energy. Energy Environ. Eng. 2014, 2, 83–90. [Google Scholar] [CrossRef]
- Pultowicz, A. Mechanizm wsparcia rozwoju energetyki wiatrowej w Polsce na tle rozwiązań europejskich (Mechanism to support the development of wind energy in Poland compared to European solutions). In Problemy Regionalne i Globalne We Współczesnej Gospodarce Światowej; Rymarczyk, J., Michalczyk, W., Eds.; Tom 2, Katedra Międzynarodowych Stosunków Gospodarczych, Akademia Ekonomiczna we Wrocławiu: Wrocław, Poland, 2005; pp. 128–135. [Google Scholar]
- Wąs, A.; Sulewski, P.; Krupin, V.; Popadynets, N.; Malak-Rawlikowska, A.; Szymańska, M.; Skorokhod, I.; Wysokiński, M. The Potential of Agricultural Biogas Production in Ukraine—Impact on GHG Emissions and Energy Production. Energies 2020, 13, 5755. [Google Scholar] [CrossRef]
- Mahjabeen, N.; Shah, S.Z.; Chughtai, S.; Simonetti, B. Renewable energy, institutional stability, environment and economic growth nexus of D-8 countries. Energy Strategy Rev. 2020, 29, 100484. [Google Scholar] [CrossRef]
- Li, X. Diversification and localization of energy systems for sustainable development and energy security. Energy Policy 2005, 33, 2237–2243. [Google Scholar] [CrossRef]
- European Commission, Energy Union Package—Communication from the Commission to the European Parliament, the Council, the European Economic and Social Committee, the Committee of the Regions and the European Investment Bank: A Framework Strategy for a Resilient Energy Union with a Forward-Looking Climate Change Policy, COM(2015) 80 Final. 2015. Available online: https://eur-lex.europa.eu/resource.html?uri=cellar:8263aedc-5ab2-11e9-9151-01aa75ed71a1.0009.02/DOC_1&format=PDF (accessed on 12 February 2021).
- Gokgoz, F.; Guvercin, M.T. Energy security and renewable energy efficiency in EU. Renew. Sustain. Energy Rev. 2018, 96, 226–239. [Google Scholar] [CrossRef]
- Chalvatzis, K.J.; Ioannidis, A. Energy supply security in the EU: Benchmarking diversity and dependence of primary energy. Appl. Energy 2017, 207, 465–476. [Google Scholar] [CrossRef]
- European Commission, Commission Communication (COM(2018)773) A Clean Planet for All: A European Strategic Long-Term Vision for a Prosperous, Modern, Competitive and Climate Neutral Economy, Brussels. 2018. Available online: https://eur-lex.europa.eu/legal-content/EN/TXT/PDF/?uri=CELEX:52018DC0773&qid=1616667870433&from=EN (accessed on 12 February 2021).
- Nations Union Paris Agreement. In Proceedings of the Conference of the Parties to the United Nations Framework Convention on Climate Change, Paris, France, 30 November–12 December 2015.
- European Commission. Communication from the Commission to the European Parliament, the Council, the European Economic and Social Committee and the Committee of the Regions. A Policy Framework for Climate and Energy in the Period from 2020 to 2030. Available online: https://eur-lex.europa.eu/legal-content/EN/ALL/?uri=CELEX:52014DC0015 (accessed on 22 February 2021).
- Shahbaz, M.; Raghutla, C.; Chittedi, K.R.; Jiao, Z.; Vo, X.V. The Effect of Renewable Energy consumption on Economic Growth: Evidence from the Renewable Energy Country Attractive Index. Energy 2020, 207, 118162. [Google Scholar] [CrossRef]
- Karakosta, C.; Pappas, C.; Marinakis, V.; Psarras, J. Renewable energy and nuclear power towards sustainable development: Characteristics and prospects. Renew. Sustain. Energy Rev. 2013, 22, 187–197. [Google Scholar] [CrossRef]
- Pultowicz, A. Przesłanki rozwoju rynku odnawialnych źródeł energii w Polsce w Świetle idei zrównoważonego rozwoju (Premises for the development of the renewable energy market in Poland in the light of the idea of sustainable development). Probl. Ekorozw. Probl. Sustain. Dev. 2009, 4, 109–115. [Google Scholar]
- Boyle, G.; Everett, B.J.; Ramage, J. Energy Systems and Sustainability. Power for a Sustainable Future; Oxford University Press: Oxford, UK, 2004. [Google Scholar]
- Prandecki, K. Teoretyczne podstawy zrównoważonej energetyki (Theoretical foundations of sustainable energy). In Polityka Gospodarcza w Okresie Transformacji i Kryzysu; Studia Ekonomiczne Uniwersytet Ekonomiczny w, Katowicach; Barteczek, A., Rączaszek, A., Eds.; Uniwersytet Ekonomiczny w Katowicach: Katowice, Poland, 2014; p. 166. [Google Scholar]
- Suska-Szczerbicka, M. Wykorzystywanie Odnawialnych Źródeł Energii w Strategii Zrównoważonego Rozwoju (The Use of Renewable Energy Sources in the Strategy of Sustainable Development). VII Konferencja Samorządowa Dylematy Rozwoju Zrównoważonego, Uniwersytet Szczeciński, Wydział Nauk Ekonomicznych i Zarządzania, Kalisz. 2011. Available online: http://global.am-wind.pl/czytaj/za%C5%82acznik_nr_2_kalisz.pdf (accessed on 12 December 2020).
- Chodkowska-Miszczuk, J.; Środa-Murawska, S.; Biegańska, J. Znaczenie edukacji w zakresie odnawialnych źródeł energii w upowszechnianiu zasad rozwoju zrównoważonego The importance of education in the field of renewable energy sources in the dissemination of the principles of sustainable development). Ekonomia i Środowisko 2016, 1, 34–49. [Google Scholar]
- Eurostat. Available online: https://ec.europa.eu/eurostat (accessed on 25 January 2021).
- World Development Indicators. Available online: http://www.worldbank.org/data/onlinedatabases/onlinedatabases.html (accessed on 20 January 2021).
- Intentational Reanwable Energy Agency. Available online: https://www.irena.org/statistics (accessed on 20 February 2021).
- Sołtysiak, A.; Jaskulski, P. Czekanowski’s diagram a method of multidimensional clustering. In New Techniques for Old Times. CAA 98. Computer Applications and Quantitative Methods in Archaeology, Proceedings of the 26th Conference, Barcelona, March 1998; Barceló, J.A., Briz, I., Vila, A., Eds.; BAR International Series 757; BAR Publishing: Oxford, UK, 1999; pp. 175–184. [Google Scholar]
- Homa, M.; MoŚcibrodzka, M. Application of diagram methods and hierarchical agglomerative procedures to assess the risk of investment funds on The Warsaw Stock Exchange. Nauki o Finans. 2016, 4, 21–34. [Google Scholar] [CrossRef][Green Version]
- Krakowiak-Bal, A. Multidimensional comparative analysis of other gainful activities of agricultural holdings in EU countries. Infrastruktura i Ekologia Terenów Wiejskich 2009, 7, 129–137. [Google Scholar]
- Västerlund, A. Czekanowski’s Diagram: Implementing and Exploring Czekanowski’s Diagram with Differeneriation Methods. Ph.D. Thesis, Division for Statistics and Machine Learning, Department of Computer and Information Science, Linköping University, Linköping, Sweden, 2019. [Google Scholar]
- Warzecha, K. The use of quantitative methods in research on selected behavioral addictions of young people. Stud. Ekon. 2015, 247, 121–139. [Google Scholar]
- MaCzek-program Do Grupowania Obiektów. Available online: http://www.antropologia.uw.edu.pl/MaCzek/maczek.html#instal (accessed on 23 February 2021).
- Hwang, C.L.; Yoon, K. Multiple Attribute Decision Making: Methods and Applications; Springer: Berlin/Heidelberg, Germany, 1981. [Google Scholar]
- Kukuła, K.; Luty, L. Propozycja procedury wspomagającej wybór metody porządkowania liniowego (Proposition of procedure supporting choice of linear ordering metod). Przegląd Statystyczny (Stat. Rev.) 2015, 62, 219–231. [Google Scholar]
- Apergis, N.; Payne, J.E. Renewable energy consumption and economic growth: Evidence from a panel of OECD countries. Energy Policy 2010, 38, 656–660. [Google Scholar] [CrossRef]
- Belke, A.; Dobnik, F.; Dreger, C. Energy consumption and economic growth: New insights into the cointegration relationship. Energy Econ. 2011, 33, 782–789. [Google Scholar] [CrossRef]
- Coers, R.; Sanders, M. The energy–GDP nexus; addressing an old question with new methods. Energy Econ. 2013, 36, 708–715. [Google Scholar] [CrossRef]
- Rafindadi, A.A.; Ozturk, I. Impacts of renewable energy consumption on the German economic growth: Evidence from combined cointegration test. Renew. Sustain. Energy Rev. 2017, 75, 1130–1141. [Google Scholar] [CrossRef]
- Rokicki, T.; Perkowska, A.; Klepacki, B.; Bórawski, P.; Bełdycka-Bórawska, A.; Michalski, K. Changes in Energy Consumption in Agriculture in the EU Countries. Energies 2021, 14, 1570. [Google Scholar] [CrossRef]
- Plan Strategiczny dla Wspólnej Polityki Rolnej (Strategic Plan for the CAP), MRiRW, Warszawa, 2020. pp. 1–148. Available online: https://www.gov.pl/attachment/e2a25e58-8e6d-435e-bb3e-b29c888128b9 (accessed on 21 February 2021).
- Communication from the Commission to the European Parliament, the European Council, the Council, the European Economic and Social Committee and the Committee of the Regions the European Green Deal, COM (2019) 640; Brussels. 2019. Available online: https://eur-lex.europa.eu/resource.html?uri=cellar:b828d165-1c22-11ea-8c1f-01aa75ed71a1.0002.02/DOC_1&format=PDF (accessed on 12 February 2021).
- Gradziuk, P.; Gradziuk, B. Perspektywy rozwoju rynku pomp ciepła w Polsce w kontekŚcie strategii Unii Europejskiej „Czysta Planeta Dla Wszystkich (Prospects for the development of the heat pumps market in Poland in the context of the new EU strategy “A Clean Planet for All”). Polish Assoc. Agric. Econ. Agribus. Stow. Ekon. Rol. Agrobiznesu 2018, 20, 77–82. [Google Scholar] [CrossRef]
Publisher’s Note: MDPI stays neutral with regard to jurisdictional claims in published maps and institutional affiliations. |
© 2021 by the authors. Licensee MDPI, Basel, Switzerland. This article is an open access article distributed under the terms and conditions of the Creative Commons Attribution (CC BY) license (https://creativecommons.org/licenses/by/4.0/).