Article

Implications on Feedstock Processing and Safety Issues for Semi-Batch Operations in Supercritical Water Gasification of Biomass

1
Laboratory of Energy Technology, Faculty of Science and Engineering, Åbo Akademi University, Rantakatu 2, 65100 Vaasa, Finland
2
ENGIE Eps-Electro Power Systems S.A.–Via Antonio Paracca, 12/d, 10098 Rivoli, TO, Italy
*
Author to whom correspondence should be addressed.
Energies 2021, 14(10), 2863; https://doi.org/10.3390/en14102863
Submission received: 17 April 2021 / Revised: 10 May 2021 / Accepted: 11 May 2021 / Published: 15 May 2021
(This article belongs to the Special Issue Waste-to-Energy Processes Using Supercritical Fluids)

Abstract

:
Biomass with a large amount of moisture is well-suited to be processed by supercritical water gasification, SCWG. The precipitation of inorganics, together with char formation and re-polymerization, can cause reactor plugging and stop the process operations. When plugging occurs, sudden injections of relatively large mass quantities take place, influencing the mass flow dynamics significantly in the process. Reactor plugging is a phenomenon very well observed during SCWG of industrial feedstock, which hinders scale-up initiatives, and it is seldom studied with precision in the literature. The present study provides an accurate evaluation of continuous tubular reactor dynamics in the event of sudden injections of water. An interpretation of the results regarding water properties at supercritical conditions contributes to comprehending mass and heat transfer when plugging occurs. Experiments are then compared to SCWG of a biomass sample aiming to give key insights into heat transfer and fluid dynamics mechanisms that could help develop operational and control strategies to increase the reliability of SCWG. In addition, a simplified model is presented to assess the effect of material integrity on burst-event likelihood, which states that SCWG is safe to operate, at 250 bar and 610 °C, in tubular reactors made of 0.22 wall thickness-to-diameter ratio Inconel-625 with superficial microfractures smaller than 30 µm. We also suggest improvement opportunities for the safety of SCWG in continuous operation mode.

1. Introduction

The world population is forecasted to be over 9 billion by 2040 [1], and sustainable development measures are indeed needed. One of the most important aspects of sustainable development is reducing the adverse outcomes of electricity production processes [2]. In addition, the energy need for the same population is also increasing, and by 2040 it is estimated to be 150 trillion megawatt-hours per year [3]. Sustainable solutions must be implemented on a large scale and quickly to reduce greenhouse gases associated with energy consumption being released into the atmosphere. Biomass is often referred to as a renewable energy source and represents only a small percentage of the feedstock used for power conversion. It is reported that the yearly biomass availability could be estimated to be in the range of the equivalent of 10 11 tons of oil [4]. There are still many different industrial processes dealing with biomass, and therefore, large quantities of organic waste or industrial streams are available for energy production without deforestation. In the EU, about 88 million tons of food waste is generated annually [5]. Biomethane production is currently less than 5% of the estimated overall potential, while full utilization of biomethane could cover some 20% of current worldwide gas demand [6]. Nevertheless, biological processes need long retention times to give favorable conversions to bio-methane [7], which is a disadvantage to fully meeting the future demand of biogas.
In thermal gasification, moisture reduction is necessary since it will reduce the process efficiency [8]. Most biomass requires a previous drying process for most gasification processes to be commercially available since they were developed for coal and peat gasification in the first place [9]. On the other hand, for organic streams of more than 40% moisture content, supercritical water gasification, SCWG, is particularly suitable for converting the incoming feedstock to gaseous fuels with comparable hydrogen yield when compared to thermal gasification: between 5 and 70 mol H2 per Kg of biomass [10,11]. This is because water itself acts as a medium and as a reactant in the SCWG of biomass. However, thermal gasification has been investigated more in detail for solutions such as chemical looping, for instance [12], and safety pitfalls are well understood.
SCWG can be considered low-temperature gasification (with good carbon gasification efficiency around 600 °C), and the product gas composition can vary depending on the temperature and pressure adopted. However, it has been shown that pressure does play a minor role in the composition [13,14]. In addition, SCWG allows for more precise tuning of the produced syngas composition with respect to the temperature. SCWG can be applied together with several kinds of processes. The feedstock used can differ in terms of composition and properties while avoiding the energetically intensive drying step required for conventional thermal gasification.
SCWG can be applied to industrial facilities where the amount of biomass processed is very large. The feedstock presents a large amount of moisture, or if the feedstock presents a danger to the environment. In that case, SCW oxidation is applied [15]. One of these processes of interest is pulp and paper production, where lignin is separated from the cellulose and hemicellulose fraction by a cooking process. This step can be carried over through kraft pulping, and a black liquor stream is produced. In the literature, various studies can be found on SCWG of black liquor [14,16,17], and new methods are proposed on how to utilize black liquor in more efficient ways. Two of these methods include the LignoBoost and LignoForce technologies [3,18,19,20]. To understand the importance of black liquor fuel in Finland, the production of electricity employing BL processing is comparable to the amount produced by using fossil fuels in the country [21].
Through these years, our research group has studied black liquor SCWG [22]. The idea behind those studies is that part of the process stream could be diverted to the SCWG reactor system to produce fuel gases and allow for more capacity in the boiler. This is the same approach as the LignoBoost and LignoForce processes; however, in our case, only SCWG is applied. Based on this motivation, to successfully carry out SCWG of black liquor, the reactor clogging due to inorganics and char precipitation should be investigated systematically. As an alternative, the combustion of black liquor is very well described [23]. The same feedstock is also studied in regards to gasification [24], co-gasification with different feedstock [25], pyrolysis [26], and hydrothermal carbonization [27], and even its gasification has been investigated to produce methanol [28]. The problem of corrosion should also not be underestimated. Corrosion, together with plugging, can lead to immediate shutdown of the SCWG operations; nevertheless, this is an important issue when it comes, for instance, to using water in nuclear reaction processes. One example is the water used to harvest energy from nuclear processes such as fission or even the new nuclear fusion trials. In this respect, Hirose et al. [29] studied the corrosion/stress phenomena to crack ferritic/martensitic steel in SCW. These conditions are the ones experienced, for instance, in a water-cooled solid breeder (WCSB) blanket, which can be used in nuclear power plants. The problem there is to capture the highest amount of heat by having the smallest thickness of envelope since, in this way, the efficiency is greater. SCW also gives higher thermodynamic efficiency to normal power plants.
In the literature, various simulations were made to prove the feasibility of SCWG and its integration within biorefineries [30]. However, the operational problems encountered in this process were seldom taken into account [31]. In SCWG, salts, and inorganics precipitate since the dielectric constant of water drops to very low values, giving the possibility of separating valuable chemicals. On the other hand, clogging can occur because of this phenomenon. It is beneficial to remark here that, in almost the totality of the studies reported on SCWG of industrial feedstock, it is very seldom mentioned that processes had to be interrupted because of clogging of the reactor, stress-related issues, or the reactor leaking [32]. Demonstration scale tests had to be stopped since the fluid flow demonstrated very different behavior from what was expected for the experiments [33].
The problem of reactor clogging is investigated in the present study. More in detail, the authors focus on a typical behavior observed when plugging occurs for a short period. By precipitating, inorganics form a wall-kind clog at the inlet section; because of the upstream rising in pressure, the clog experiences a series of ruptures, which provokes sudden injections of mass into the reactor. This investigation aims to study these sudden injections and provide key information regarding reactor strain as described in the following sections of this manuscript. The investigation reported here was done using distilled water only, injected at precise time steps by a pneumatic pump. Among all our experimental trials, we chose to focus on the main medium, water, for the following reasons:
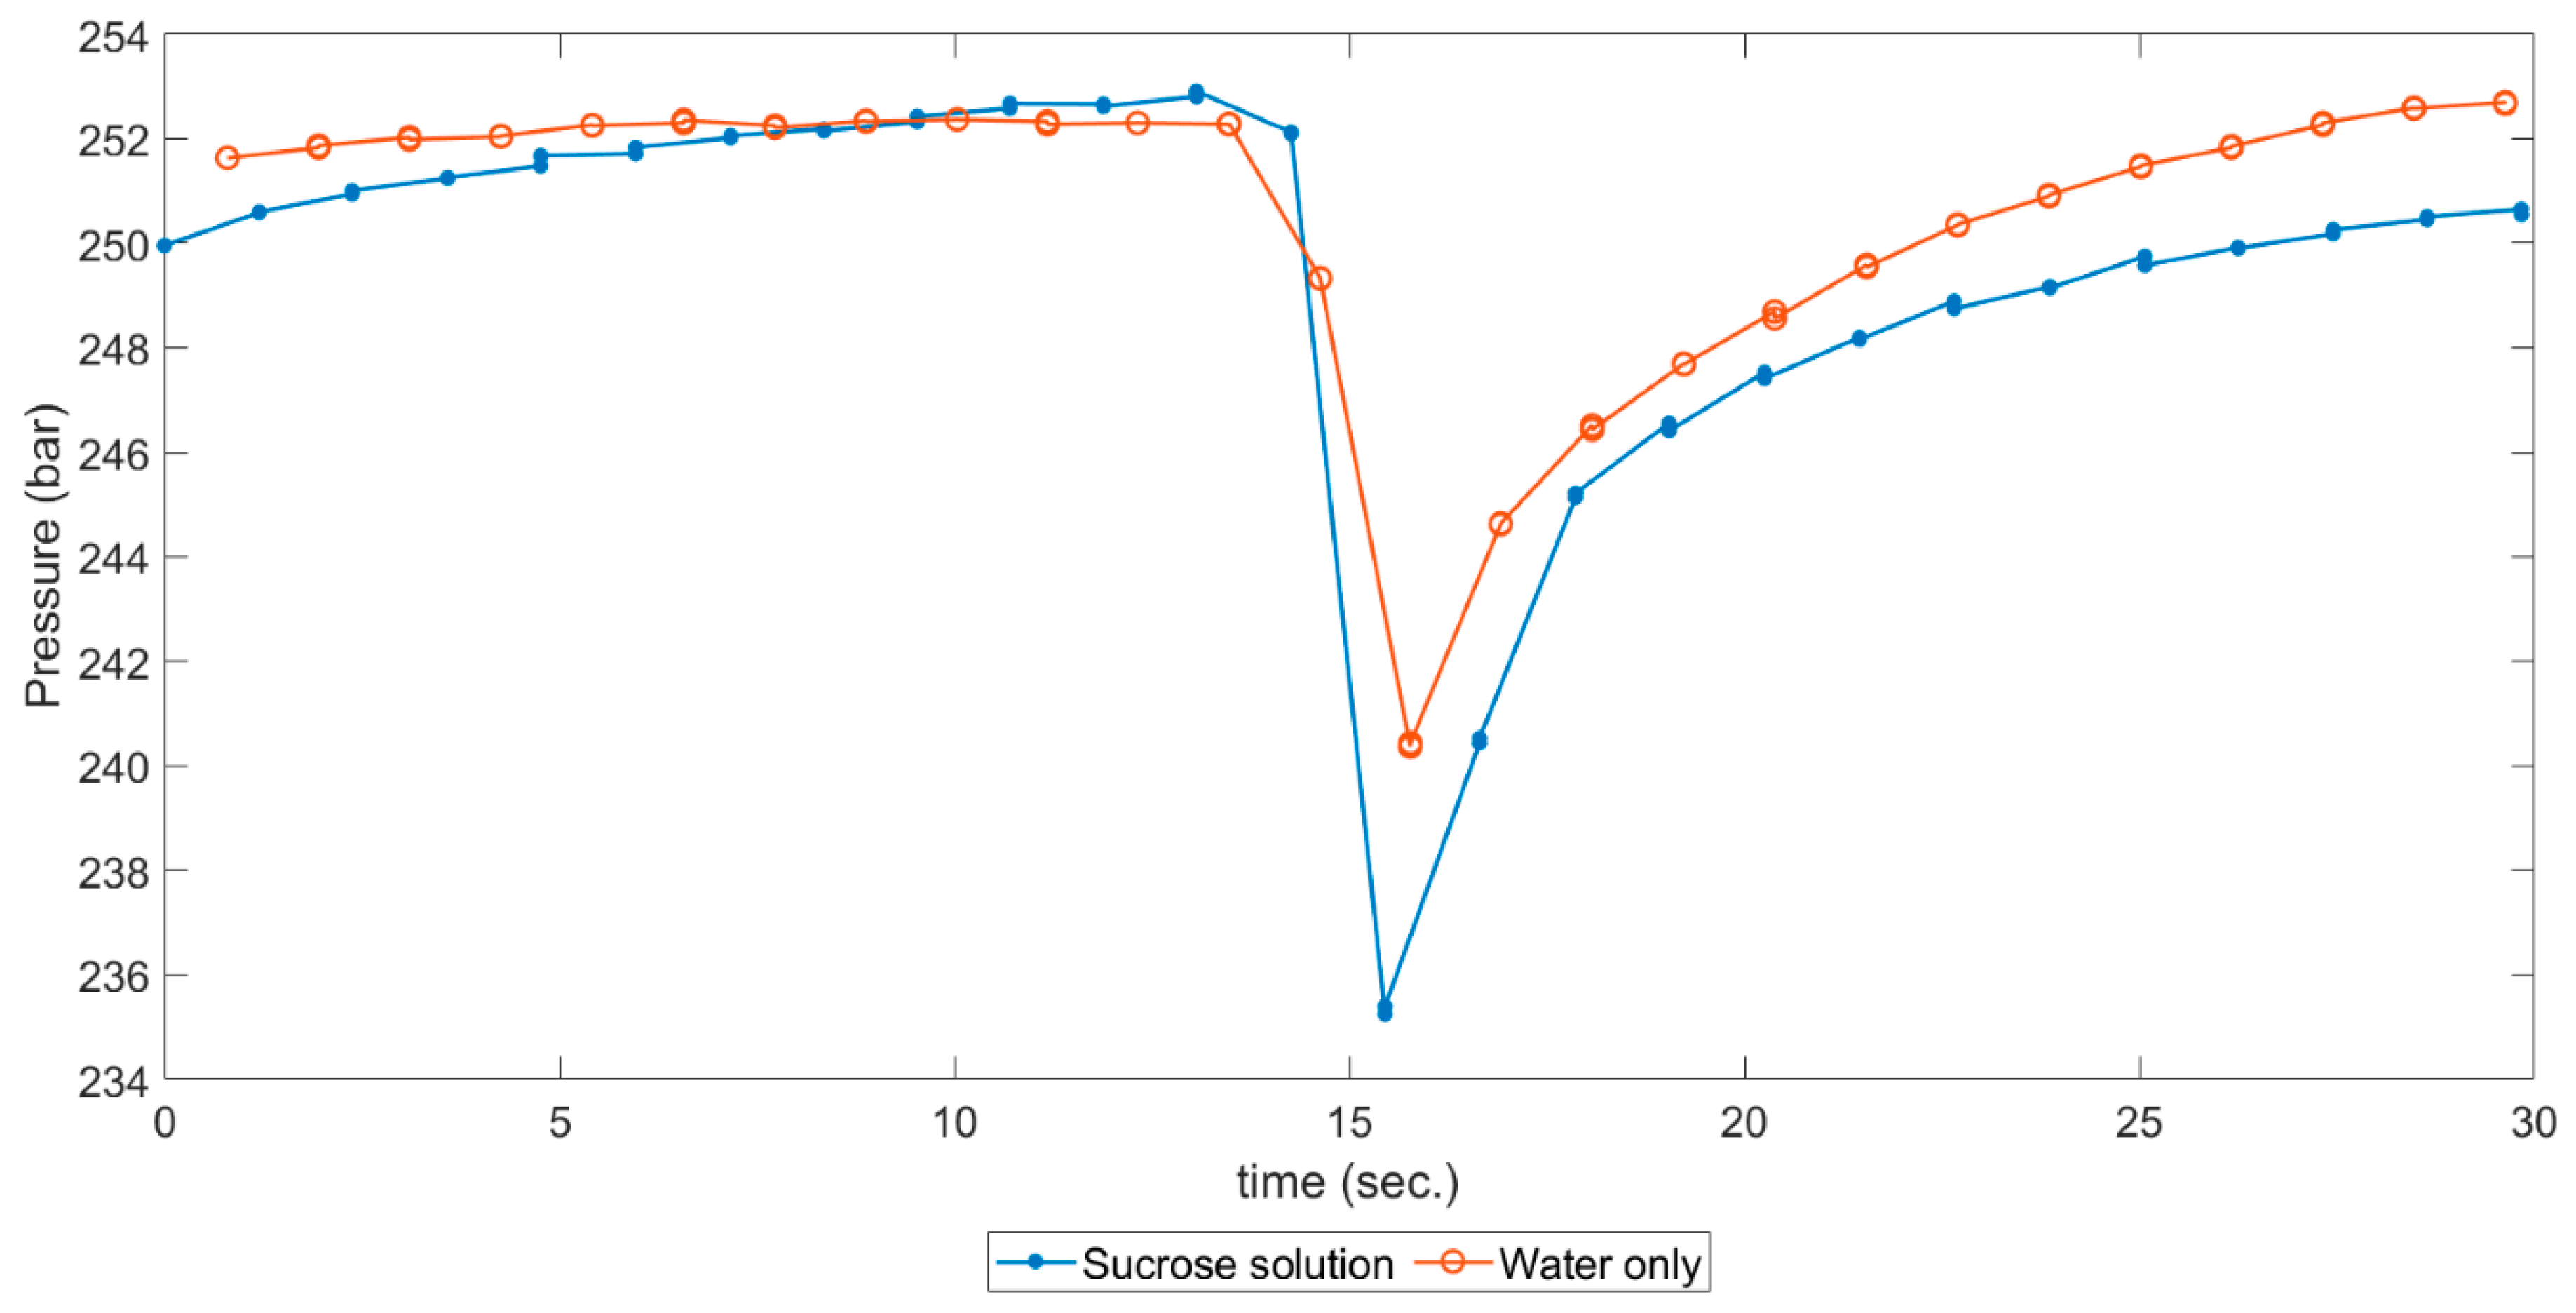
  • Feedstock should be used in a diluted form in SCWG, which means that water accounts for most of the inlet mass, which means that the medium expansion represents the major concern for pressure difference; and
  • By using water only, the experimental results are more homogeneous; this gives a more stable data series.
The controlled, sudden mass injection is finally compared to when complete clogging took place for a longer period. The case presented for the comparison is related to SCWG experiments done on diluted sucrose and by running the experiments in continuous mode. This controlled experiment illustrates the case when an incident happened, even in the case of a feedstock with no inorganics. The final example is also used here to demonstrate that such non-controlled sudden injections may cause the pressure and temperature conditions to go below the critical point, and this might give additional implications, discussed in the manuscript.
Reactor plugging is not only limited to stopping the operations, but it can also have serious consequences when a feedstock with a high amount of organics is used. To the author′s knowledge, this issue, related to biomass concentration, is never mentioned in literature studies regarding SCWG. The problem of plugging (or also known as clogging) in SCWG was mentioned by Heidenreich and co-authors [34], where the process was described to take place typically at 30 MPa. In other works, it was also determined that char can be formed from complex organic feedstock and this, together with salt precipitation and metal oxide formation, is responsible for clogging [35,36,37].
On the other hand, the re-polymerization phenomenon is the cause of unexpected trends in concentration profiles within the reactor. This is because, at longer residence times and high temperatures, more char could be produced from those reactions. Therefore this will heavily influence the concentration of produced gases [38]. A similar situation was also mentioned in regards to supercritical water oxidation, SCWO [36].
The dominant mode of heat transfer within the current state of the art of SCWG is conductive heat transfer, and thus, it is important to consider any accumulation of salts or plugging. Such an accumulation may lead to additional pressure build-up and deviation from standard conditions. This may also lead to slow reheating of the reactor after feed entry, which will keep the system away from the set operating conditions and may provoke burst events [32,35].
To our knowledge, no systematic studies on the clogging aspect in SCWG have been investigated. The scope of this research study is to investigate the reactor behavior and the SCWG process operation when a stepwise feeding system is adopted. This is done, as mentioned, to simulate sudden ruptures of plugging clogs formed during the deposition of char and inorganics. Clogging is one of the major issues that hinder the scale-up of SCWG [32]. We assessed this issue by designing a controlled experiment that aimed to generate the same effect on density variations within the reactor.
The modeling of the thermodynamic parameters concerning this dynamic behavior is not straightforward. As a matter of fact, diverse factors should be considered: heat and mass flow, valve characteristics, operating parameters, and related dimensions. The heat transferred to the fluid from the reactor walls plays an important role in modeling the system as well. Therefore, it is of utmost importance to accurately describe the mode of operation for an SCWG system since these types of studies give the necessary information that can be readily used for new kinds of reactor designs [39]. Furthermore, water content is as high as 95% of feed composition by mass in supercritical water gasification. Thus, studying the properties of supercritical water and its dynamics is essential for a deeper understanding of the gasification process.
This work aims to deliver insightful results to describe the system behavior, and therefore, a more reliable economic analysis on the operational risks can be performed. Our research on SCWG for diverse kinds of industrial feedstock provided us with a large amount of experimental data. To some extent, a continuous mode of operation can forecast the frequency of plugging and sudden mass injection based on the type of feedstock adopted. When plugging occurs with an industrial type of feedstock, the fluid dynamics within the reactor system are similar to the simulation presented here. One example demonstrated in this study relates to previous SCWG experiments carried out in a continuous operation mode when sudden plugging and rupture of the formed clog occurred [31]. Data provided in this work can contribute to identifying failures due to clogging that could help develop control strategies to increase the safety of SCWG. Lastly, we propose a simplified model to assess the effect of material integrity on burst-event likelihood on duty and suggest safety improvements for the continuous operation of SCWG.

2. Materials and Methods

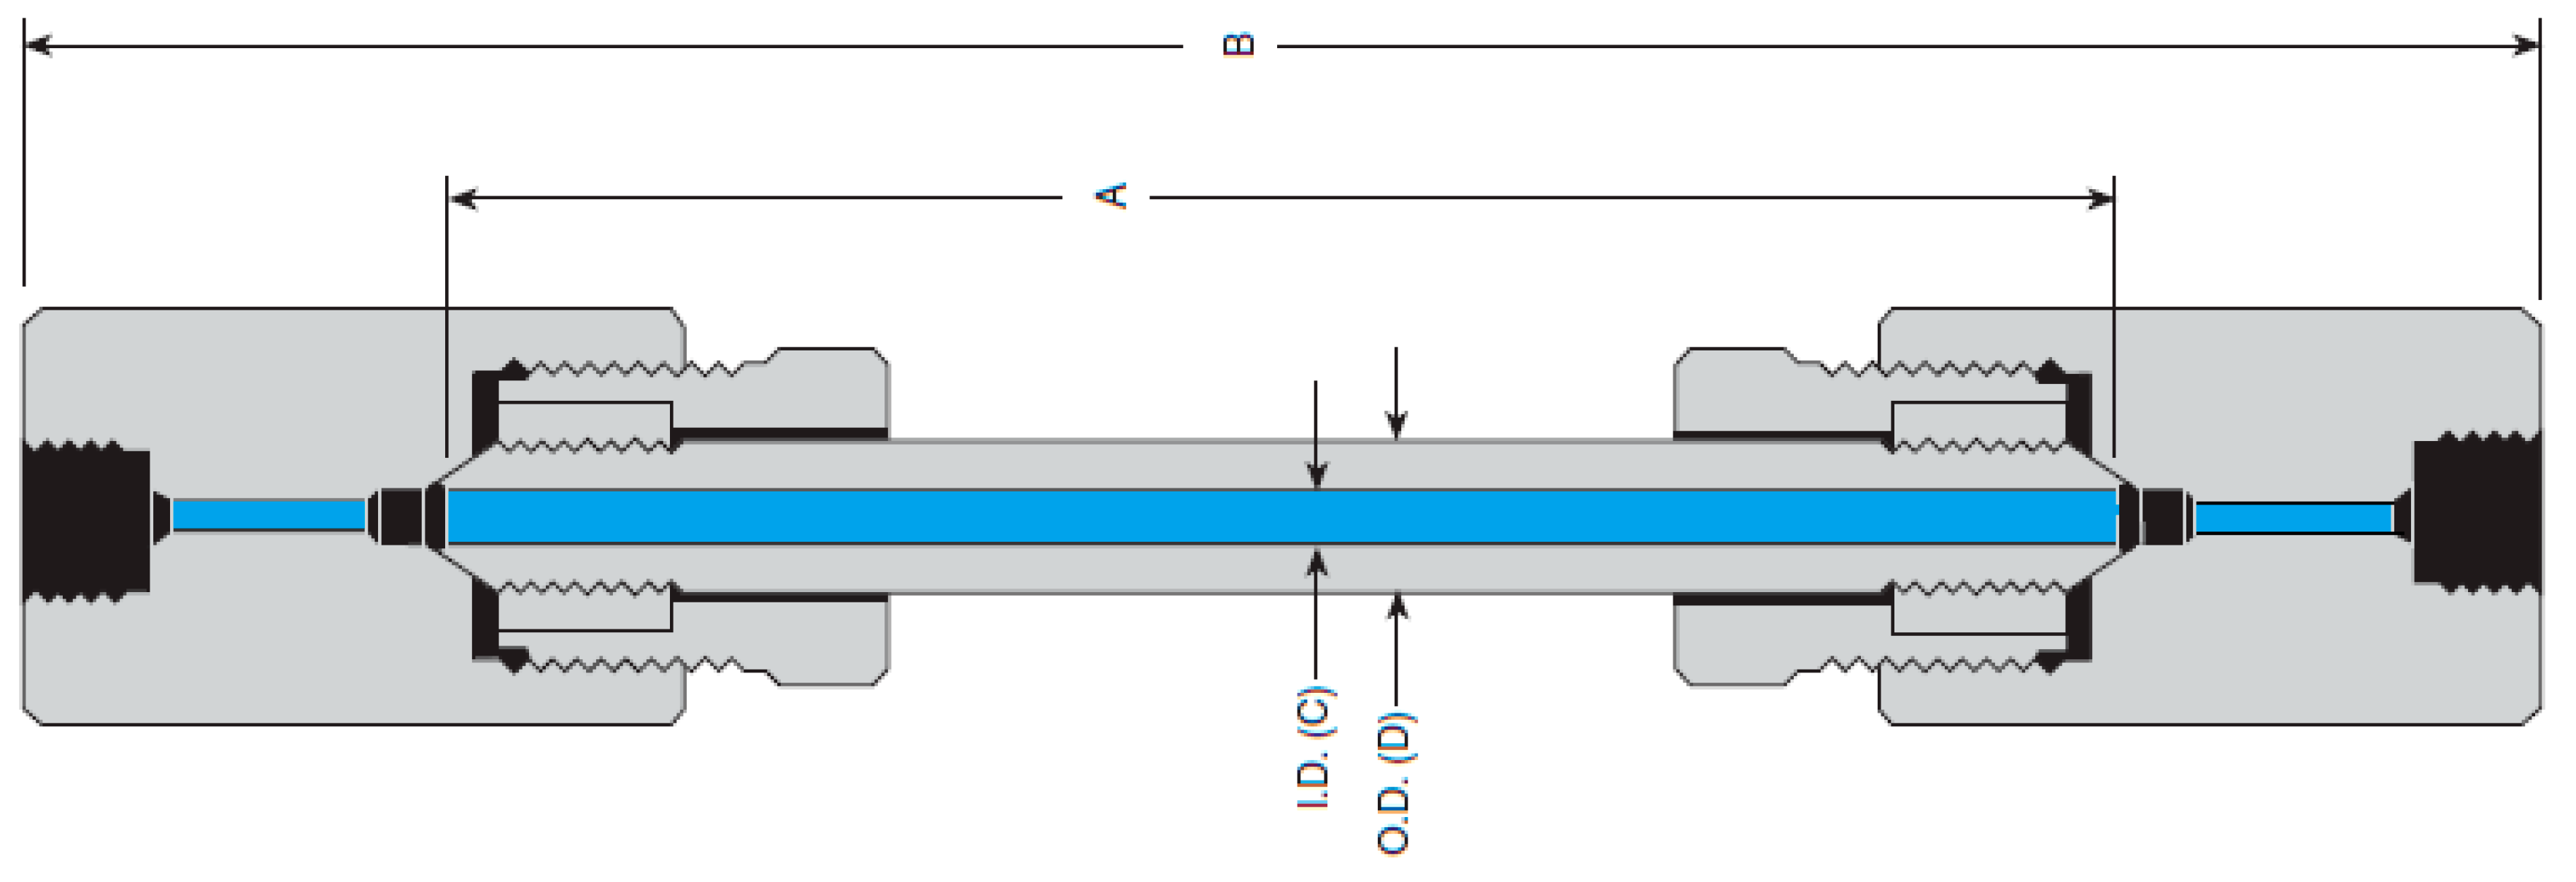
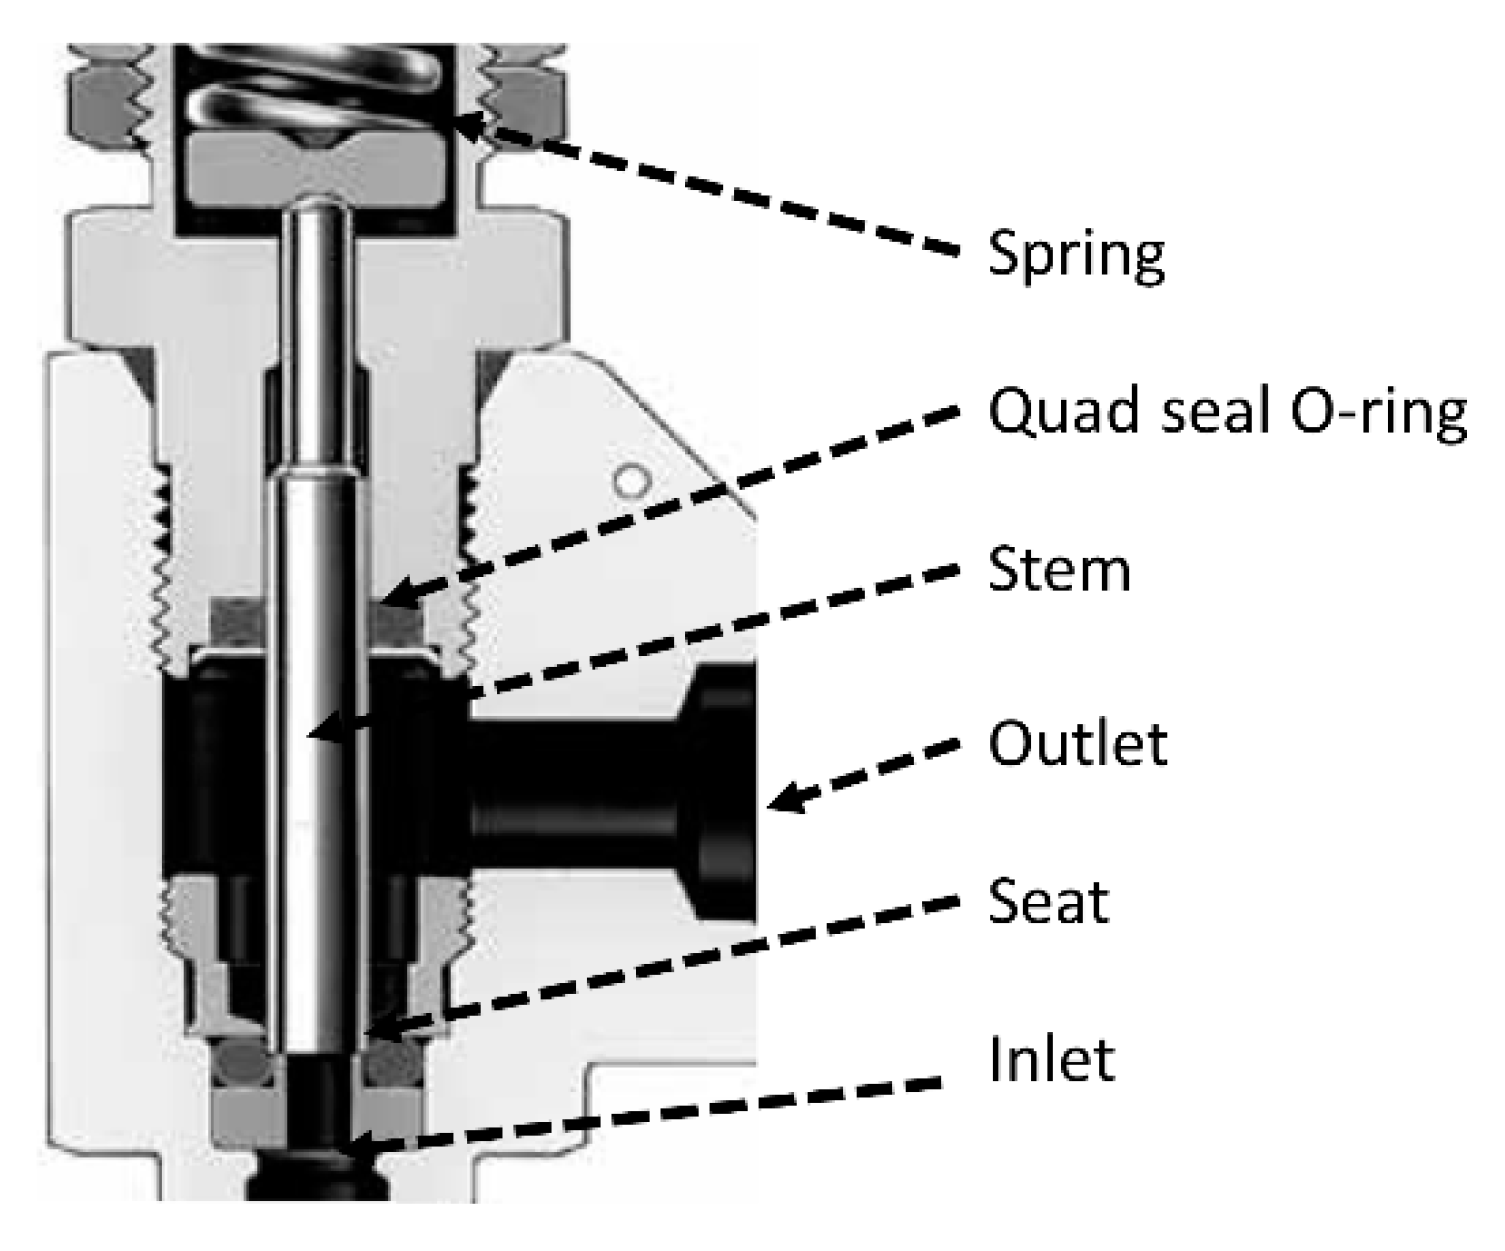
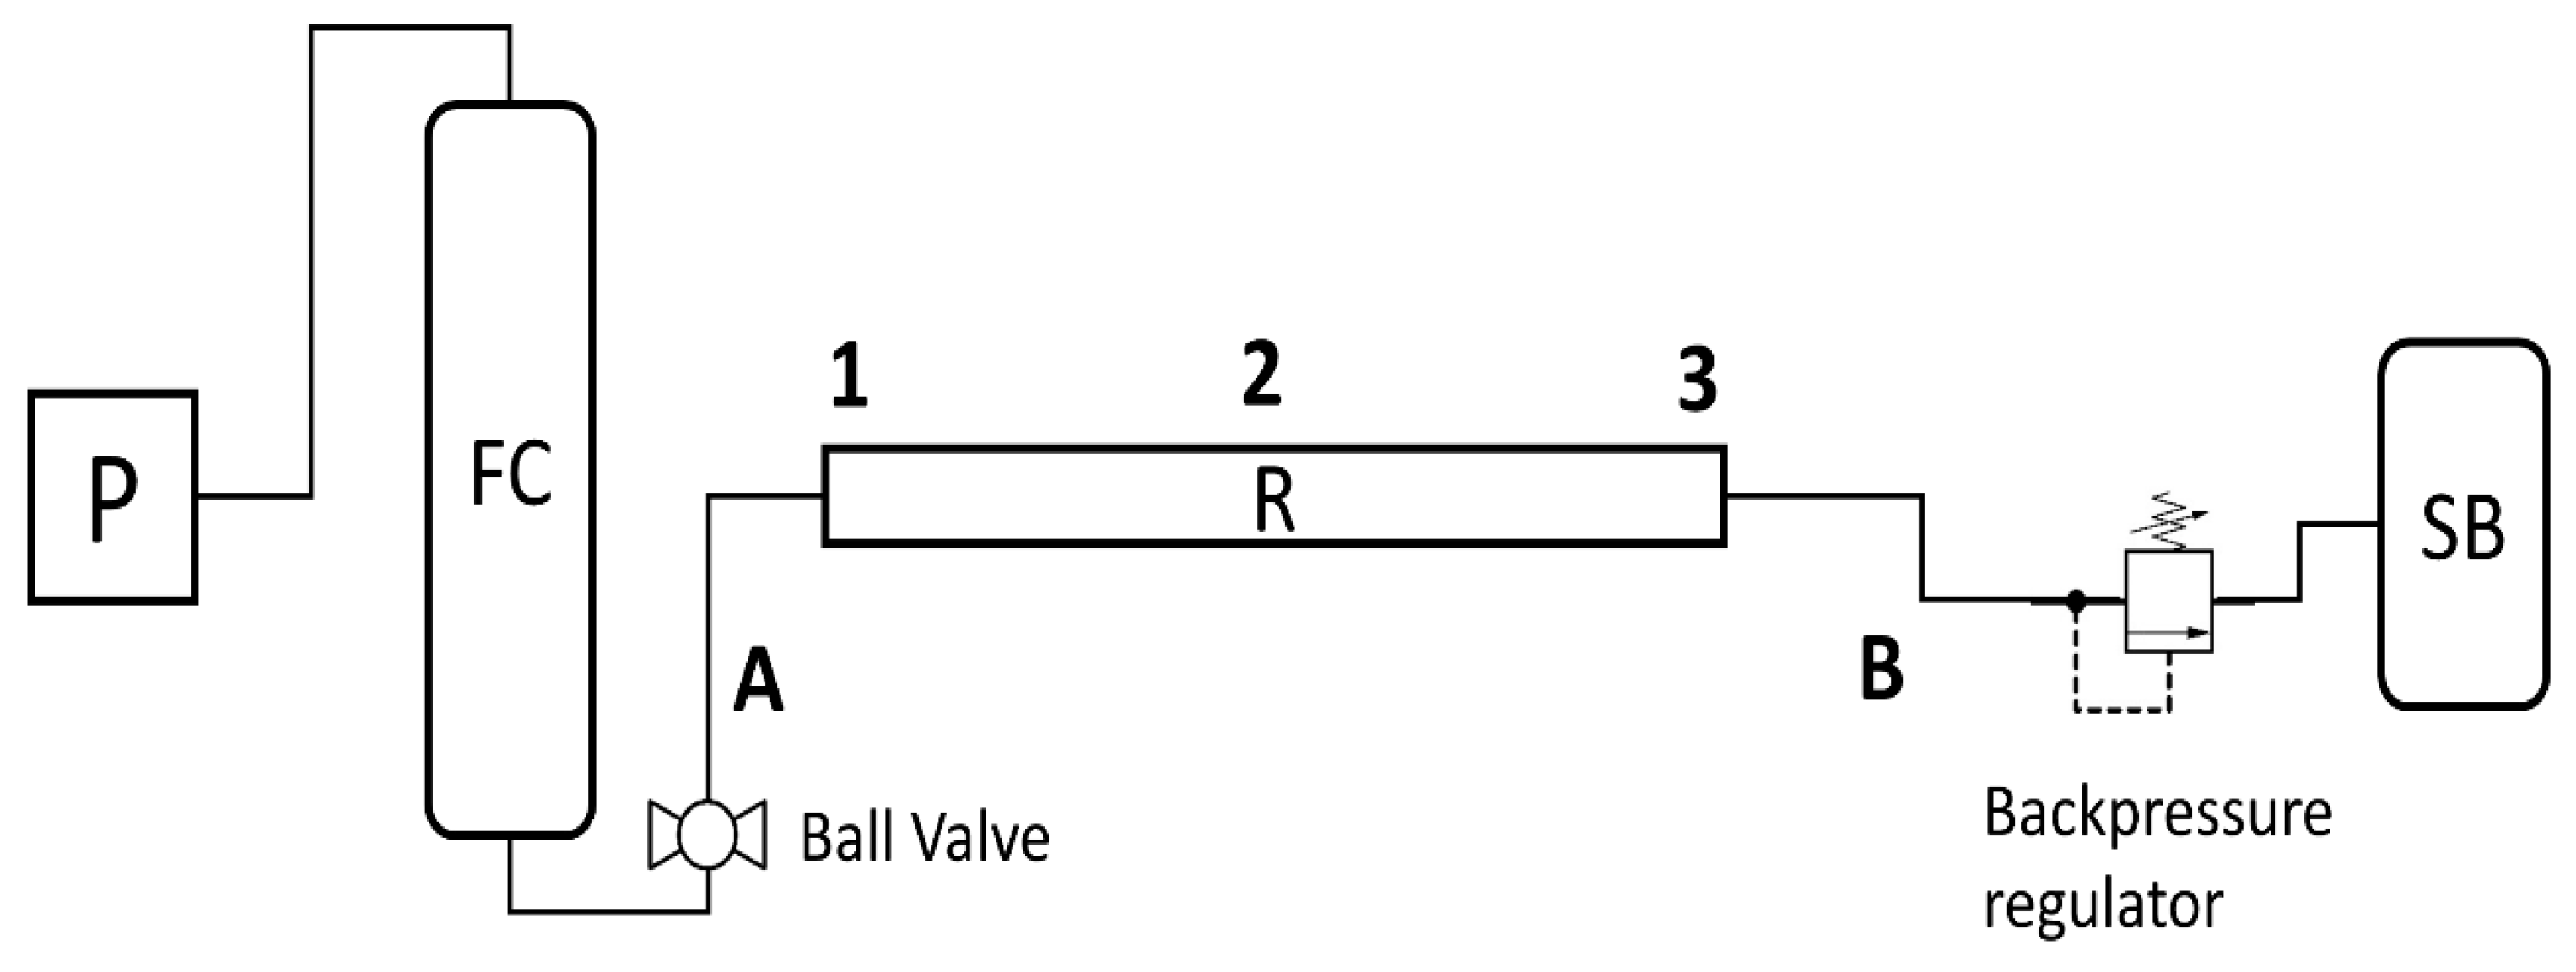
2.1. Experimental Setup

SCWG of any industrial feedstock can be subject to clogging. When this occurs, the flow to the reactor can stop for a variable time, and the pressure upstream could increase. Because of this increased pressure, the plugging wall at the entrance of the reactor could be partially or totally broken (this does not happen always), allowing for a sudden injection of biomass stream into the reactor. This phenomenon is the one targeted, and it was simulated by utilizing water and then dynamically comparing it with the behavior of a sucrose solution in similar conditions. The sudden injection of fluid by fast removal of the plugging wall was simulated by employing a ball valve, as described in detail later in this section. The system consists of a high-pressure pump, feed cylinders, a tubular reactor, a condensing section, and a collecting unit.
The reactor used in this research was provided by a US company named High-Pressure Company. In order to comply with the safety requirements, the model had to pass a series of tests before being sold. The equipment has a particular system that enables it to be locked and avoid leakage. For safety reasons and to avoid extra possibilities of leakage and pressure drop, there are no embodiments that could allow for the temperature to be measured into the reactor. The temperature should be measured on the external wall. The wall is thermally insulated by a ceramic fiber insulation that contains the heating system. This system is described below.
A drawing of the reactor is reported in Figure 1, and Table 1 summarizes the wall material properties. The specifications are a capacity of 81 mL, an internal diameter (I.D.) of 1.43 cm (point C), and an outside diameter (O.D.) of 2.54 cm (point D). In reference to Figure 1, the length A is 50.8 cm while the length B is 58.42 cm. The reactor wall material is Inconel-625®.
The pump used to inject water through a stepwise method was a WellChrom® Pneumatic Pump K-1900 from Knauer. The pump has a maximum flow rate of 750 mL/min at 30 MPa. The system is equipped with cylinders (Swagelok, Stockholm, Sweden) otherwise used to store and inject biomass feedstock into the reactor. This is done to allow for more flexibility on the type of biomass used. The system of using feeding cylinders allows for a continuous operation of the reactor [41]. The cylinder material is stainless steel 316 L, and they have a maximum pressure tolerance of 40 MPa. The experimental setup had two cylinders with a capacity of 500 mL each.
It was preferred to use a manual adjustment of the relief valve (Figure 2) since this allows for better control. If automated, the valve would respond inappropriately if a rise in pressure were detected due to a formed plugging. This is because the software is unable to recognize a clog or pressure variation due to other reasons.
Since the relief valve used as a backpressure regulator influences the dynamic mass flow of the reactor feedstock, some additional information is added here. The minimum reseal pressures are given by the manufacturer as a percentage of the set pressure and given in Table 2 [42].
The heating system constitutes two semi-cylindrical heating modules made of Fibrothal. They have metallic heating elements and ceramic fiber insulation. The company that provided this system was Kanthal. The power of the heating system is 2600 W, and to reduce thermal stress on the reactor walls, the heating rate of the reactor was 140 °C/hour.
The thermocouples used to monitor temperature values at the outlet walls of the reactor were K-type. They can perform measurements between −200 °C and 1260 °C with a sensitivity of 41 μV/°C.
Thermocouples were positioned on the reactor′s outer wall using custom-made ducts; temperatures are measured along the reactor right after the inlet, at the middle, and right before the outlet. Piping and fittings were provided by the company Swagelok (Stockholm, Sweden); the pipes have an internal diameter of 3 mm and an outside diameter of 6 mm with a working pressure of 420 bar. A relief valve R3A from Swagelok was positioned after the cooling section of the system and before the outlet gas sampling section.
Since the pressure used was in the range of 250 bar, the minimum reseal pressure was estimated as more than 95% of the set pressure. The digital pressure sensor used was a Trafag model 8251.84.2517 with an accuracy of ± 0.5% of maximum reading. Figure 3 shows a simplified version of the system used to support the description of the methods.
Before starting with trials, the system was tested for any leaks or pressure drops since those could affect the results and jeopardize the operational safety of the system. The following procedure was performed for the experiments. The pump filled the system constituted by a feed cylinder, tubing, a reactor, and a backpressure regulator set at 250 bar pressure. The reactor was heated to the test temperatures, which were, in this case, 510 °C and 610 °C. When the test conditions were reached, the experiments could start. Water was injected through a stepwise injection method employing the high-pressure pump. The pump is volumetric and designed with a double piston. Pressurized air is used to run it, and therefore no electrical connections are needed. If different values of flow rates are needed, there is the possibility of changing the pump head. For this purpose, four types of pump heads can be utilized (100 mL, 250 mL, 500 mL, 1000 mL). For the experiments provided here, the 250 mL type was used.
To run the experiments, the pressure for the pump was maintained at values higher than the setpoint; in this case, 260 bar over a 250 bar set pressure for the SCWG tests. Regarding Figure 3, the ball valve sited before the reactor was first kept closed. The stepwise injection was carried out by opening and closing the valve at intervals of 20 s. Because the pump is volumetric with a double piston, the check valve opens twice during a total revolution of the pump outlet. This can be verified during the operations since opening and closing the valve is done to complete a total revolution before closing. Pressure and temperature were recorded for 15 min with a sampling frequency of 2 Hz.

2.2. Operational Conditions of SCWG

Our investigations on SCWG of diverse feedstock groups focused on temperatures between 500 °C and 700 °C [16,22,30]. From these studies, it was acknowledged that the maximum yield of hydrogen was achieved at 600 °C by the effect of using a reactor formed of Inconel-625®. It was also noticed that higher temperatures are not always favorable when it comes to syngas yields since there could be reactions of re-polymerization. In addition, at higher temperatures, when a sudden injection of mass occurs in the reactor, the effect of metal contraction due to thermal cooling is larger. The expansion of matter due to a sharp decrease of density is also faster. These effects provide more probability for reactor opening and rupture. With reactor opening, it is meant that the inlet mass from the reactor exits from an opening made on the locking bolt because of thermal stress or breakage. This is possible since the sealing cone walls pull away, leaving cleavage for the mass to go out of the system. This is shown schematically in Figure 4.
When the sudden injection of mass was simulated, these factors were considered and, after several trials on how to operate the simulation, the temperatures of 510 °C and 610 °C were chosen. These are the two setpoint temperatures used here. Temperatures were recorded at the inlet, middle point, and outlet of the reactor, and the overall pressure was also recorded, as shown in Figure 5 and Figure 6.
As shown in Figure 5 and Figure 6, the temperature varied between points 1, 2, and 3, as represented in Figure 3. However, the temperature at the center of the reactor was maintained near the setpoint temperature. This parameter was adjusted continuously using a temperature control system. It must be acknowledged that the programmed rise in temperature was set at 140 °C/hour and maintained at this value during the experiment, which was set to prevent thermal stress on the reactor material. The thermocouple aimed at giving the signal to the controller was positioned at the center of the reactor. This explains the motivation for having a temperature at the center precisely near the set point. A wattmeter was used to measure the power consumption of the heating system. The estimation of energy consumption was based on the current flow to the heating element and can be considered roughly the same throughout each feed injection.
The temperature gradient between points 1 and 3 can be attributed to the low heat transfer rate of the heating element. The lower temperature at the inlet with respect to the outlet of the reactor indicated that the system was unable to regain the temperature drop owing to the large heat consumption that the fresh feed requires to reach thermalization. The observed gradient of temperatures in the second section of the reactor, corresponding to points 2 and 3, was much higher in the experiments done at 510 °C, which can be explained by the specific heat capacity evolution of supercritical water. As can be noticed from Figure 7, in the near-supercritical region, the specific heat capacity was abruptly raised. This suggests that it is beneficial to avoid this region when operating the process. The heat capacity of supercritical water was 40 to 60% lower around 610 °C than at 510 °C, whereas thermal conductivity and viscosity differed less than 5% [43]. Another plausible factor that could explain the lower reactor temperature gradient at 610 °C is possible variabilities in the mixing patterns, which is a motivation for future research.
Because of the stepwise feeding operation, the pressure suddenly varied within the reactor inlet; this simulated a situation when plugging occurred at the reactor inlet and a partial rupture (or total) of the plugging wall (clog) took place. In previous works of our group on SCWG of black liquor pellets [22,31], we verified that the deposition of inorganics and plugging take place mainly within the reactor inlet.
Because of a sudden mass entrance at a lower temperature and a much higher density than the inlet mass, the temperature and pressures within the reactor decreased abruptly. Around supercritical conditions, water density changed steeply [43,44], generating fluctuations that dominated the fluid mechanics of the system to a much greater extent compared to the reactivity changes in the biomass. It is worth noting that the molar proportion of water is much higher than any other gas since reactors in continuous operation usually work at partial conversions. In addition, the impact of the gaseous components on density is relatively low. The supercritical water density range is ten times higher than that of the most probable gaseous products [43], such as H2, CO, CO2, or CH4.

3. Results and Discussion

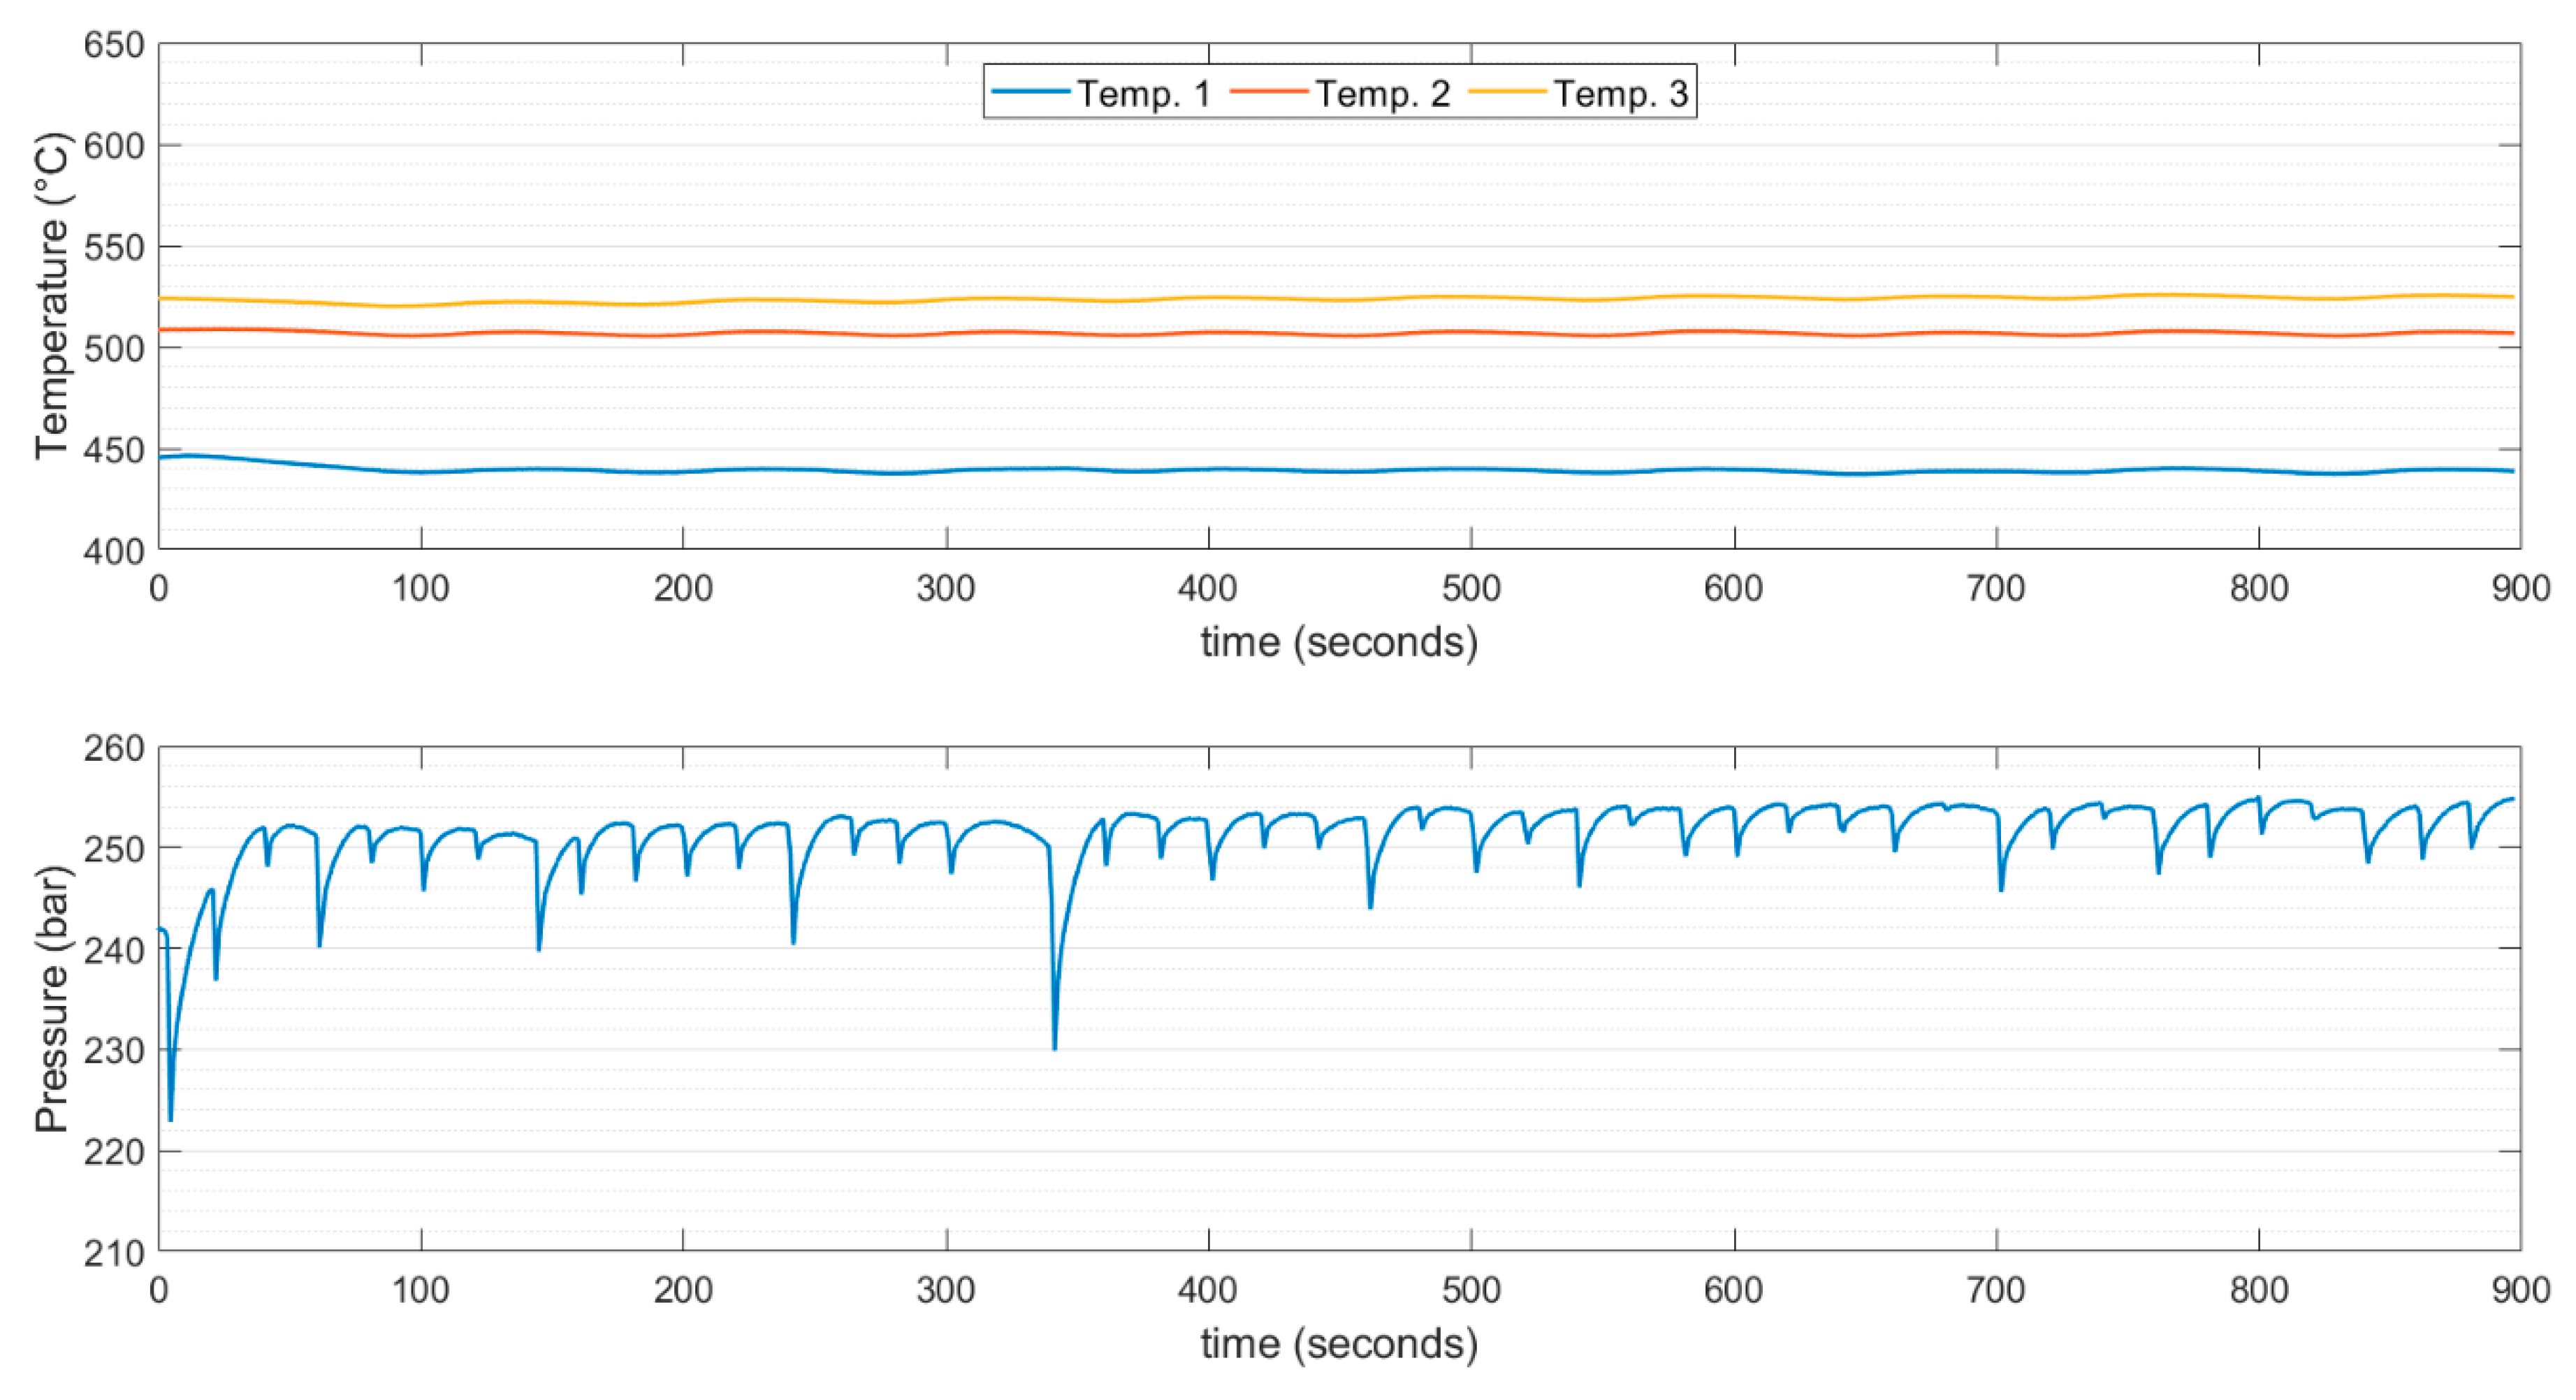
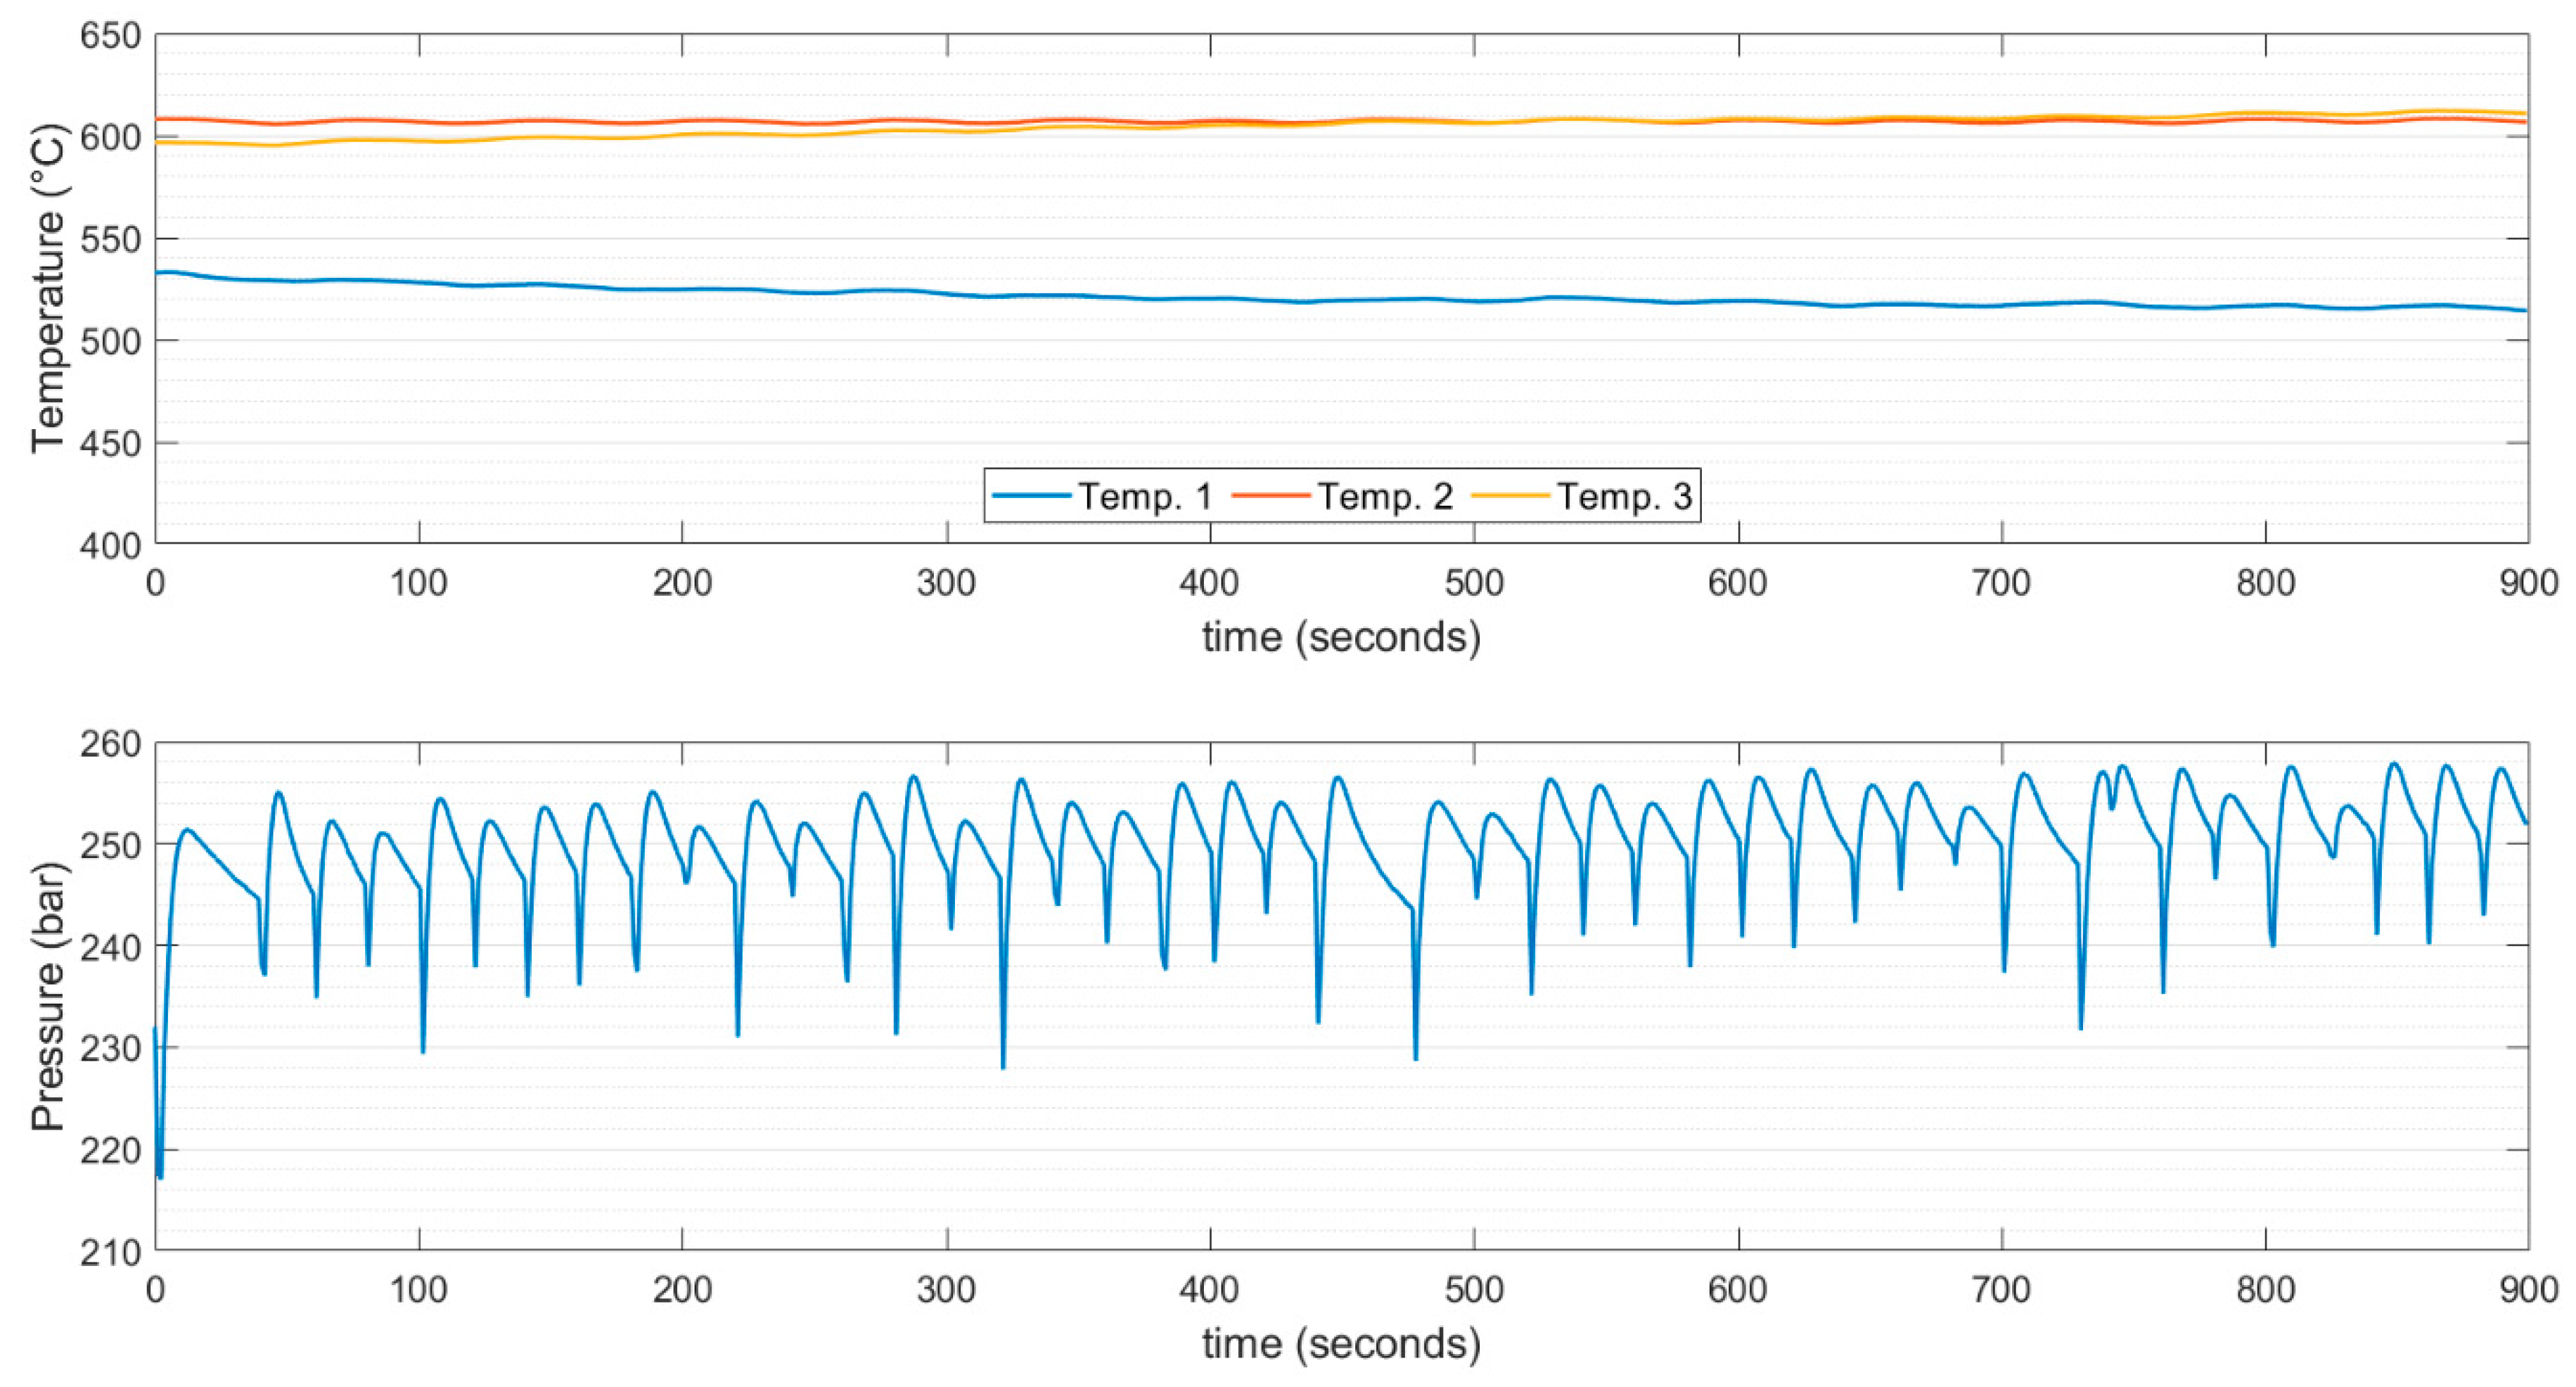
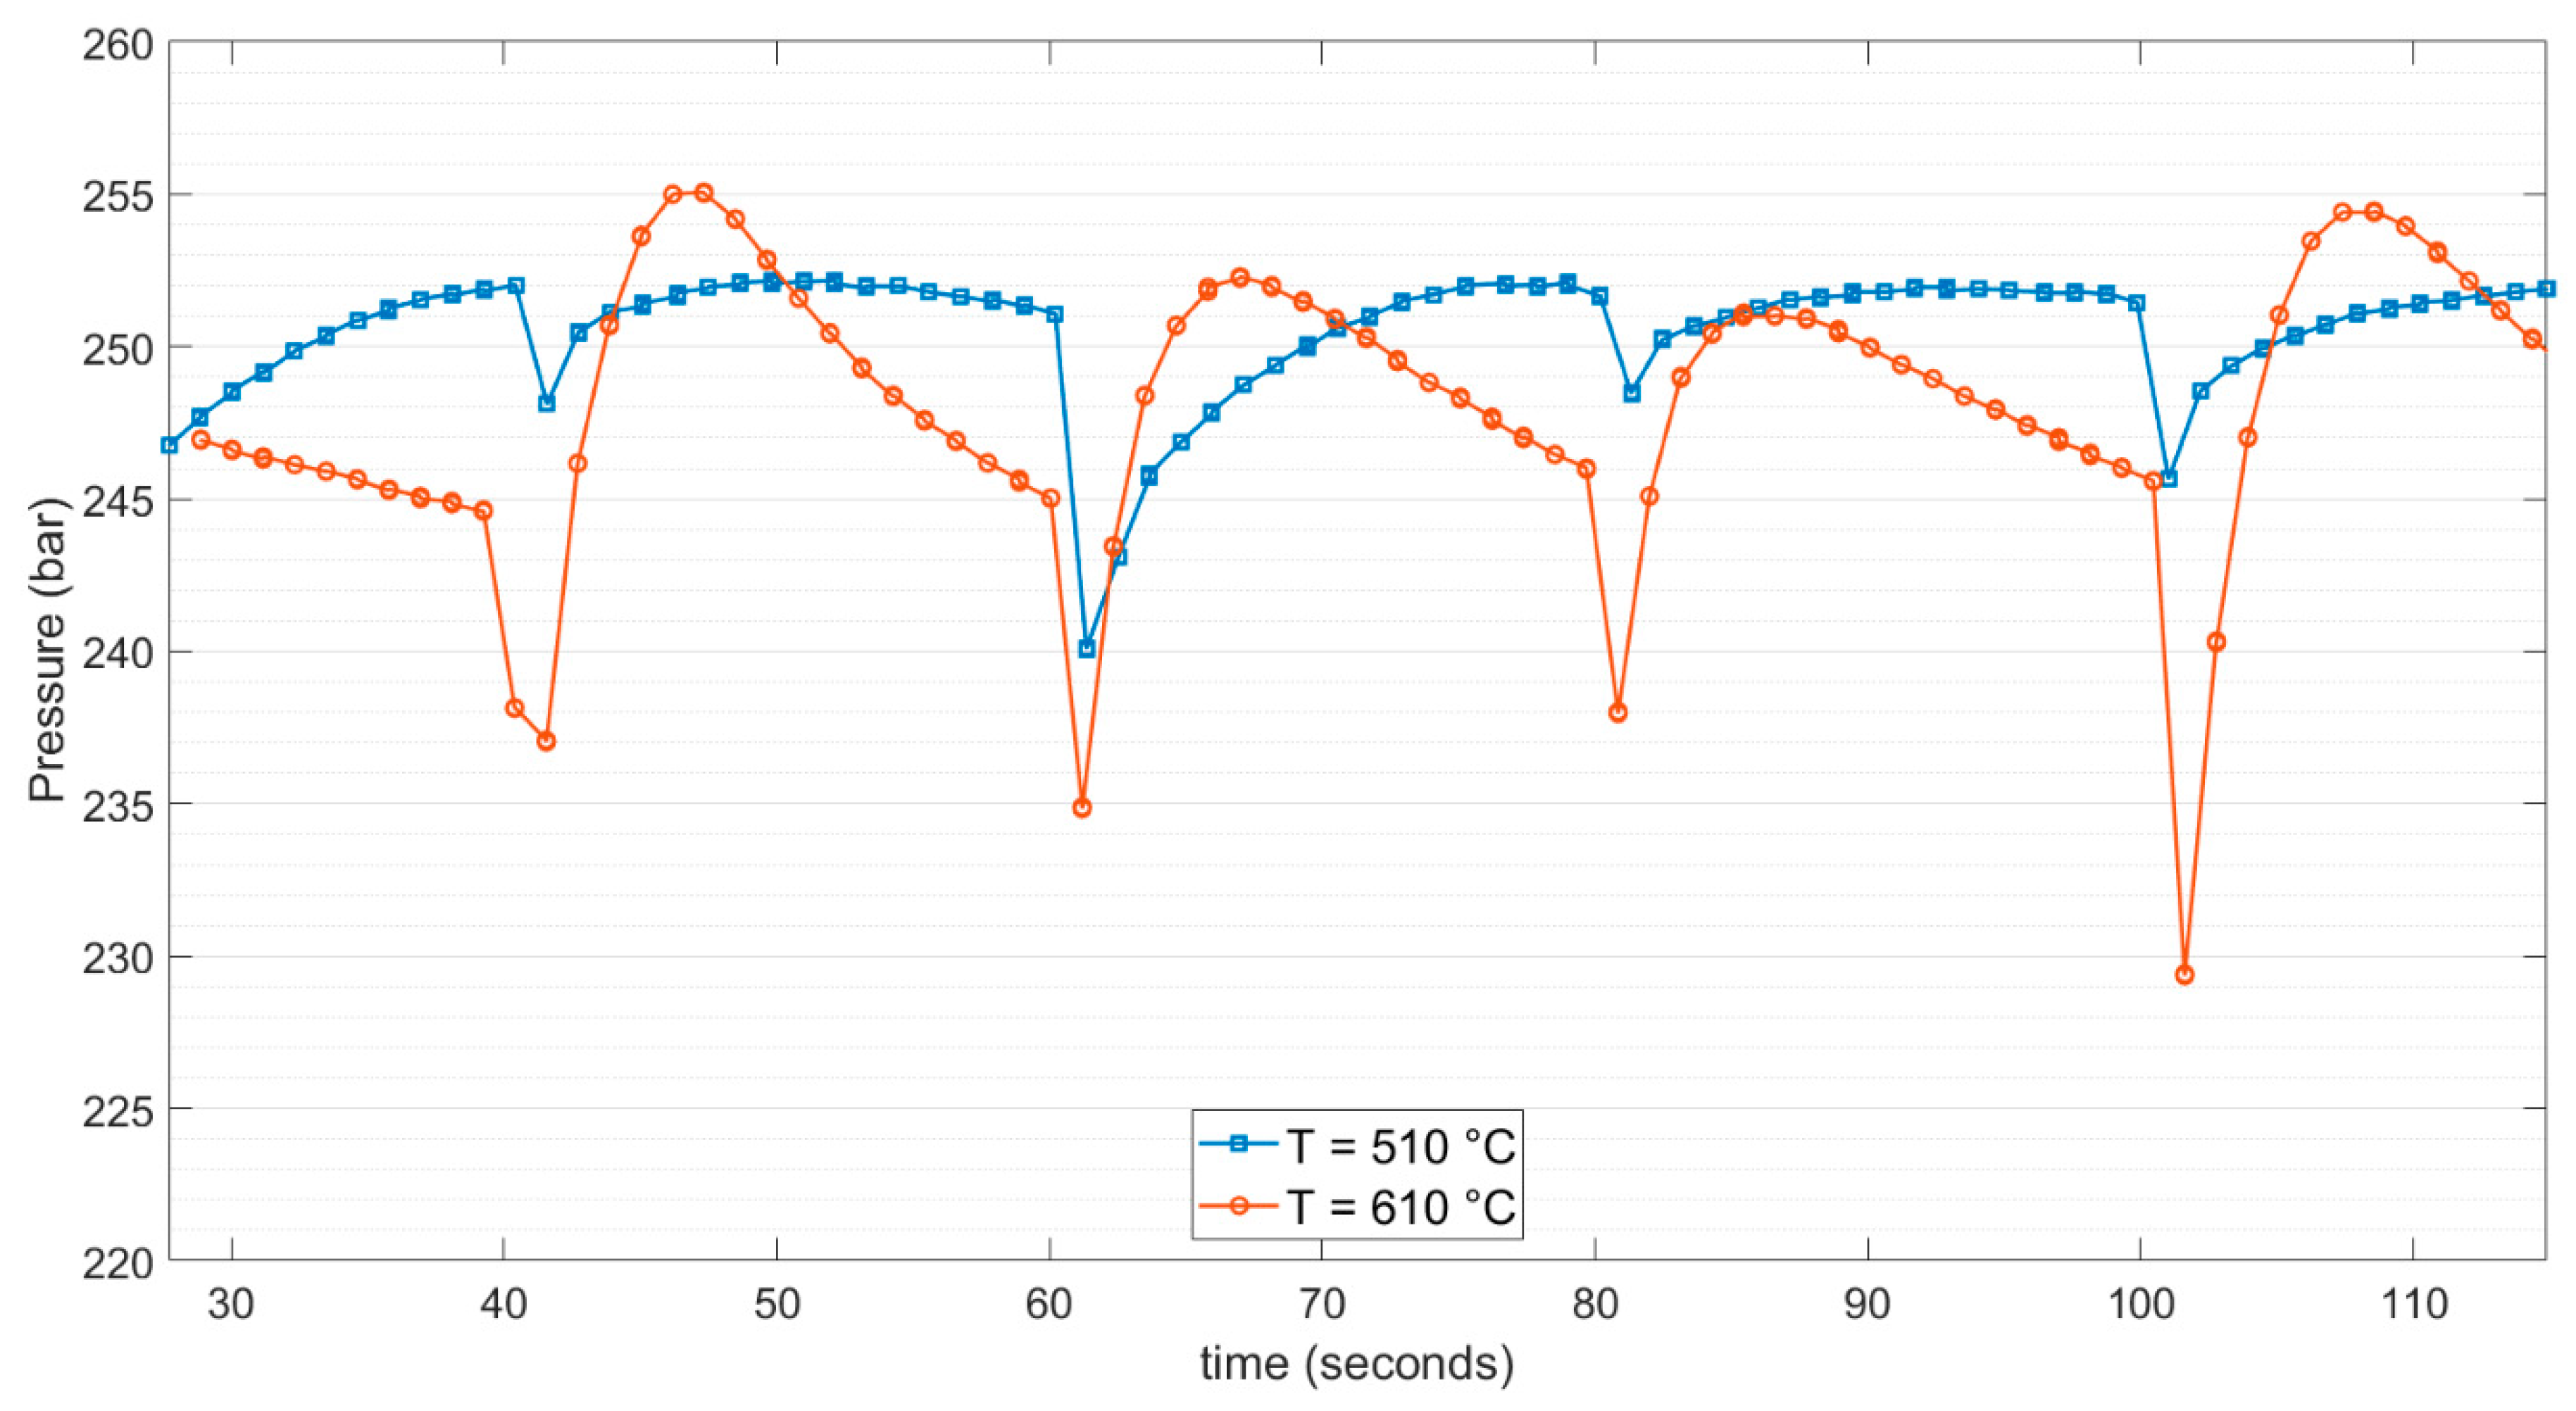
3.1. Pressure Fluctuations

Since the pressure went below the setpoint pressure, certain additional mass could come from the tubing at the reactor outlet from the cooling section (section B in Figure 3); however, this amount was estimated to be very low from a mass balance.
m o u t = ( ρ 1 ρ 2 ) V t
where ρ 1 and ρ 2 are the density of the medium before and after the feeding and inside the reactor, and V t is the volume of the tubing after the reactor and at the condensation section. This means that the theoretical amount of water entering the reactor from section B was around 0.3% of the total mass injected on average. Therefore, this value was neglected for this study. A comparison of pressure recordings within the experimental trials with supercritical water is given in Figure 8.
The sudden drop in pressure within the reactor occurred due to mixing the cooler feedstock with the mass already present in the reactor. At this stage, the heat transfer from the walls of the reactor could be neglected. The mass entering the reactor can be approximated by Equation (2):
m i n = ( ρ 1 ρ 2 ) V
where V is the volume of the reactor, ρ 1 is the density of water at the lower pressure, and ρ 2 is the density of water at higher temperatures and pressures. Figure 9 and Figure 10 correspond to the two nearest points of the plots where the sudden pressure drop occurred. The mass inlet flow at each injection step at both temperatures was evaluated and is demonstrated in Figure 9 and Figure 10.
Once the mass of water enters and is mixed with the existing mass in the reactor, heat transfer from the reactor wall plays a major role. In this framework, the specific heat capacity of water should be taken into account. Disparities in density change with pressure and temperature [43] explain that mass entrance is lower at a higher setpoint temperature, although the pressure spikes at 610 °C were higher than at 510 °C. Density variation within the operational window of the experiments carried out at 510 °C was observed closer to the critical point and thus higher than the variability of density around 610 °C. These parameters and their variations were considered when deciding on the process operation of SCWG.

3.2. Pressure Fluctuations in the Presence of Biomass

The following case is reported here to demonstrate one example of plugging and sudden mass injection into a SCWG reactor that took place when a feedstock was used at steady-state mass flow. The example presented took place when we used a sucrose concentration of 2.3% and a mass flow of 8.5 normal ml/min.
As shown in Figure 11, when there was an accumulation of pressure, the temperature at the reactor inlet increased. This was recorded at the outer wall of the reactor with some delay in comparison to the pressure recovery after the response of the relief valve. When the plug was released, an abrupt pressure drop occurred, and this was a slightly different case than what was demonstrated during the stepwise water injection. As a matter of fact, in this case, the pressure dropped even below the supercritical point. The inlet mass flow dropped, and the heat transfer then played a major role.
Even if the temperature were measured at the outer wall of the reactor, the temperature had a sensible drop at the inlet, where the time to bring the temperature at stable values on the outer wall was in the range of minutes. This drop was not noticed on the other thermocouples. The temperature at the reactor inlet was indeed affected by the temperature of the feedstock and should be considered when designing experiments.
Figure 12 shows a comparison of pressure drops due to simulated clogging for the case of water only and the sucrose solution. For improved visualization, both minima of pressure were synchronized. It can be noticed that the increase in pressure in the sucrose-water system was not as fast as the water-only system, and this was because the medium consumed a high amount of energy due to the abrupt change in heat capacity that occurred by state change from near-critical to supercritical, as was mentioned in Section 2.2 and illustrated in Figure 7.

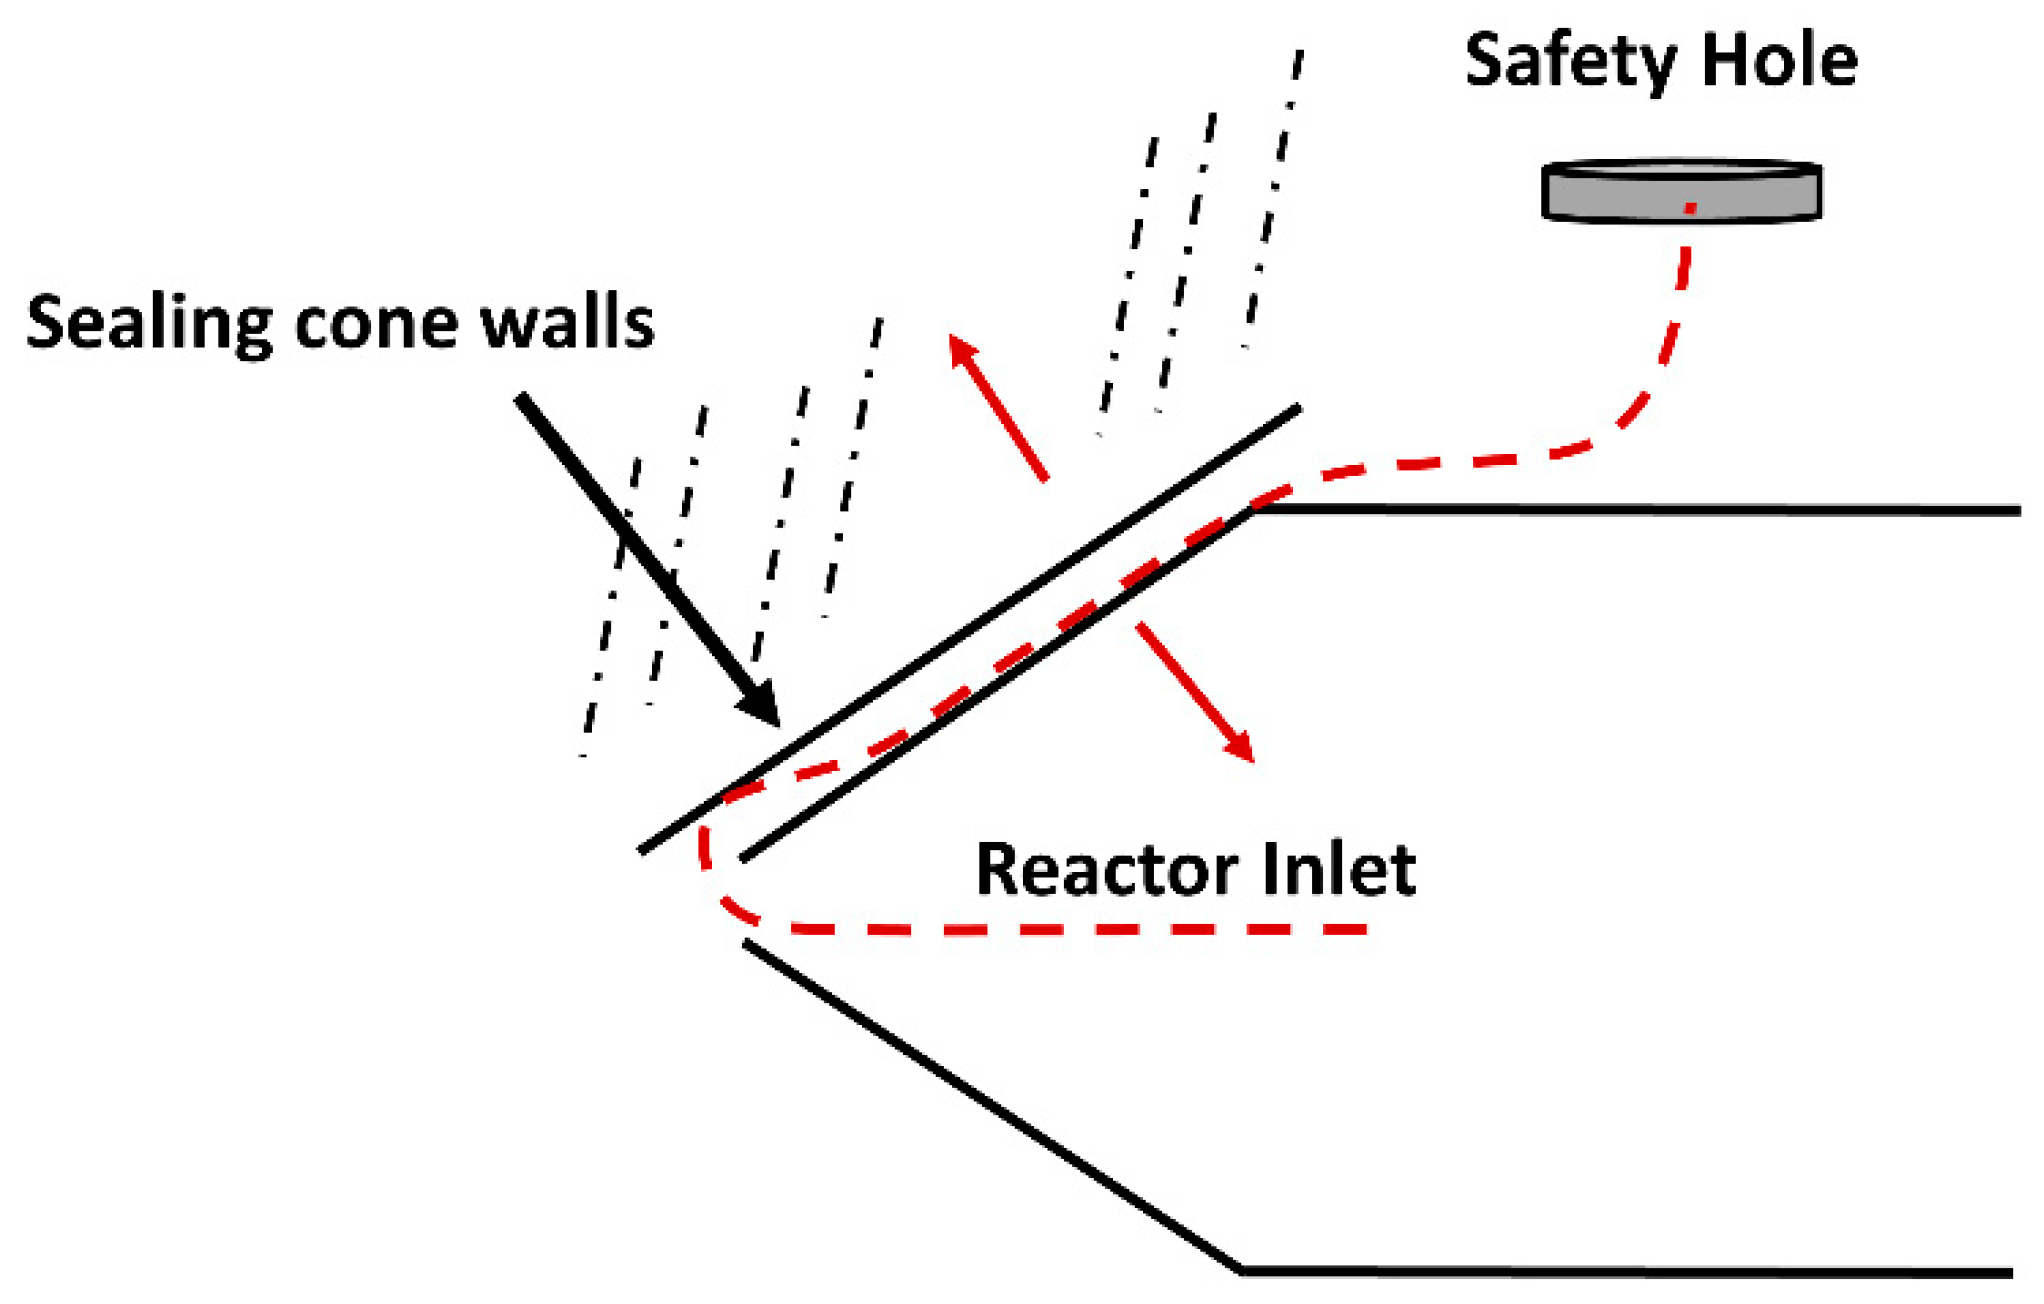
3.3. Safety Considerations and Improvement Opportunities

As a last remark, it must be acknowledged that at supercritical conditions, a sudden inlet of a relatively large quantity of material can provoke serious stress for the reactor. This is a situation that is never stressed enough in literature and quite difficult to test. Because of a sudden inlet of mass, the variation of pressure is quite drastic within a few seconds. From the experiments done, it was noticed that most of the variation took place at a quite precise time at each injection step. On average, 3.46 s elapsed between the largest drop in pressure and the largest rise in pressure per unit time. This means that within the reactor, we had a potential power (at steady-state) of
P V = ( 2.5 × 10 7   Pa ) × ( 81 × 10 6   m 3 ) 3.46   s = 585   W .
When considering the pressure variation at its maximum value recorded during experiments at 600 °C, we had:
Δ P V Δ t = ( 3.7 × 10 6   Pa ) × ( 81 × 10 6   m 3 ) 3.49   s = 85.87   W
These data are valuable if further calculations have to be done to evaluate the stress influence on the metal and structure of the reactor setup.
Pressure and temperature fluctuations were transduced into plastic deformation stress at the reactor wall, which generated microscopic defects within the material, independently of their resistance [45]. The repetitive strain produced deteriorating micro defects irreversibly. A so-called ductile fracture occurs when a highly localized plastic strain eventually triggers through-wall-depth flaws due to the propagation of material failures. Burst occurs when the propagation of material failures is prone to happen at operational values of stress or a spike in exceptionally high internal pressure is produced. Due to the ductile fracture complexity, many simplifications are needed to achieve a reasonable prediction of burst pressure (defined as the internal pressure that causes a pipe to burst or fracture). Otherwise, it is necessary to resort to numerical methods requiring experimental validation to make them reliable [46].
Pressure bursts in flawless steel follow a rather simple dimensionless nonlinear regression concerning the tube diameter to thickness ratio, shown below:
P b u r s t σ U T S = a · ( D ε ) b
where P b u r s t is the burst pressure, σ U T S is the ultimate tensile strength of the material, D is the outer tube diameter, and ε is the wall thickness. A recent study [47] covered with high precision a wide range of stainless steel materials, including our reactors, a = 2.3824 and b = −1.035.
The previous expression describes the rupture pressure in a scenario with no defects: the maximum pressure that a new reactor can withstand. In a reactor that has been in use for a long time, it is necessary to consider the presence of microfractures; otherwise, the prediction of the rupture may be improperly estimated [48]. In a conservative approach used in nuclear plants since the 1990s, burst pressure is a function of the material resistance, the schedule of the tubular reactor, and the preexisting material defects. Following the experimental work of Hernalsteen [48] on the pressure burst of Inconel cracked tubing with intentionally caused fractures of a specified length λ, where various curves of a dimensionless burst pressure P * = P b u r s t / ( σ U T S + σ Y o u n g ) as a function of normalized fracture lengths (λ/ D e ε ) were reported, we translated the curves to data and correlated it to show to which extent the burst pressure of the system could be overestimated. The lower-bound correlation is as follows:
P * = [ 0.45 0.42 log 10 ( λ / D e ε ) ] · ε / D e
A new reactor can stand up to five times the operational pressures of the process under study without major deformations. According to Equation (5), even minimal fractures could reduce the resistance to burst compared to the flawless reactor material.
A failure due to fatigue consists of the initiation of a defect, called crack, and its propagation, called creep crack growth (CCG), which ultimately could lead to a major structural disruption. CCG arises within the reactor wall due to pressure and thermal fluctuations during continuous operation. Crack growth and propagation rate depend on the load exerted towards the reactor wall and are considered within elastic conditions.
The CCG rate ( λ ˙ ) can be correlated by a log-log linear relationship (Equation (6)) to the stress intensity factor (K), defined in Equation (7).
λ ˙ = α K β
K = σ Y λ
where σ is the hoop stress due to the pressure gradient on the inner wall surface [49] of a thick-walled cylindrical tube of internal diameter D i and outer diameter D e subjected to an external pressure p e and internal pressure p i (Equation (8)):
σ = P i D i 2 P e D e 2 D e 2 D i 2 + 4 ( P i P e ) D e 2 D i 2 ( D e 2 D i 2 ) ( D e + D i ) 2
For practical reasons, the geometric factor Y can be considered equal to 1 [50,51]. Combining Equations (6) and (7), a first-order nonlinear ordinary differential equation is obtained (Equation (9)) with an exact solution, shown in Equation (10):
λ t = α σ β λ β / 2  
λ ( t ) = ( ( 1 β 2 ) α σ β t + λ o 1 β 2 ) 1 β 2
where λ o is the initial fracture length. The parameter β mainly depends on the fracture mechanism, driven by intermetallic microstructure at the grain surface. Below 750 °C, the γ″ phase is predominant [52,53], and β can be considered the same within the temperatures explored in this work.
From CCG rate measurements recently published by Zhang et al. (2018) [54] for Inconel 625 at 650 °C, we determined that β = 7.5 and α = 2.2 × 10 22   MPa 7.5 m 2.25 s 1 (squared correlation coefficient = 0.9958).
The thermal dependency of the CCG rate can be described by the Arrhenius law (Equation (10)) for crystalline solids [55].
l n ( λ ˙ ( T 2 ) λ ˙ ( T 1 ) ) = E a , λ 8.314     J / mol · K     ( 1 T 2 + 1 T 1 )
where T is the temperature expressed in Kelvin. Crack depth X-ray measurements at different temperatures revealed the activation energy of CCG ( E a , λ ) to be within the range of 85–105 kJ/mol for stainless steel alloys [56]. Even though Inconel 650 is one of the most resistant alloys [57,58], it is reasonable to choose for safety purposes the lowest activation energy to estimate the evolution of flaws at the reactor wall during the continuous operation under SCWG conditions. By combining the power law of Equation (6), the time dependency of λ obtained in Equation (10), and the Arrhenius law in Equation (11), the creep CCG rate of the reactor walls can be fairly estimated at any temperature within the operating window of SCWG.
Combining Equations (5) and (10) allows a time evolution of the critical burst pressure of a cylindrical vessel (Equation (12)) subjected to continuous stress to be determined.
P b u r s t = ( σ U T S + σ Y o u n g ) · [ 0.45 0.42 ( 1 β 2 ) · log 10 ( ( ( 1 β 2 ) α σ β t + λ o 1 β 2 ) / D e ε ) ] · ε D e
Time-to-burst can be estimated if the tribological parameters of the reactor wall material and the size of the initial fractures or the gaps between connection joints are known. In this context, the reactor could operate without failure for more than a decade if surface flaws are smaller than 1 µm. Despite the wall-to-diameter ratio being high, ε D e = 0.22 , which is far from industrially relevant scales, a continuous thick-walled reactor can be considered a cost-effective option for being more compact than batch while withstanding duty over long operation periods. Considering the joint gaps as the main source of burst incidents, an exploratory analysis of λ o the parameter value was carried out, and it was found that joint gaps of 30 microns appear safe to operate over several months of duty. Values of λ o over 60 microns lead to a rapid decline in the structural integrity of the reactor.
The aforementioned approximations are global, so they don′t consider the effect of local thermal gradients. Estimations of time-to-burst should be supported by periodic monitoring of the integrity of the reactor wall material. The periodic monitoring of accumulated defects on the reaction vessel (for example, X-ray tomography [59,60]) will greatly improve the SCWG process reliability regarding safety and maintenance.
Activation energies for corrosion in supercritical water were also determined for Inconel 625, 142 kJ/mol [56], which is among the highest registered among stainless steel alloys. Since SCWG generates a reductive environment, risks concerning corrosion appear to be much lower than the material′s fatigue due to pressure and thermal fluctuations. The design of reinforcements at anchor locations, pressure control systems, and especially the improvement of the inlet composition, focusing on reducing insoluble components, such as inorganic salts, on preventing major pressure fluctuations, is recommended for de-risking scale-up initiatives.

4. Conclusions

Supercritical water gasification of biomass is currently limited to small scales due to the challenges of complicated process kinetics, salt corrosion and plugging, and wet biomass feed handling, especially in continuous mode. A better understanding of the continuous process is required to address these issues within the supercritical water medium, which dominates the fluid dynamics of the system.
Safety is indeed one of the most important issues in process design and operations, if not the most important. Understanding how operational issues could affect the safety and the working life of the equipment is necessary. It gives convenient results that could be utilized successfully to implement safety solutions, risk analysis, economic evaluations, and reactor design. In supercritical water gasification of biomass, safety is not an option that can be underestimated. The stress factors on the reactor parts are related to diverse parameters such as thermal conditions, operation time, and clogging. These are issues that are taking place even when salts and inorganics are not present within the reactor, and therefore there is a need to study this in detail. In addition to stress-related factors derived from fluid dynamics and thermal variations, corrosion is also considered in this process. The study presented here underlines, with evidence, the necessity to have a constant mass flow in SCWG of biomass. This is highly advisable since the difference in density and other properties between water at normal conditions and supercritical water can lead to pressure and temperature-related stress.
The present study gives a practical method for simulating sudden feedstock injections when plugging is formed, and the formed clog is released due to pressure accumulation upstream to the reactor. However, the goal of the present study was not focused mainly on giving a practical method to test this dynamic behavior but rather on obtaining valuable data that could be utilized efficiently to perform more reliable performance predictions and economic analyses.
Expansion and subsequent gasification of a relatively large quantity of feedstock injected into the reactor, for instance, when a clog is released, could be particularly harmful when the biomass concentration used is large. The study underlines that plugging can be a dangerous issue when feedstock has a high biomass concentration. Nevertheless, the limitation of this method is that it does not allow complete plugging with diverse concentrations of biomass to be tested. These types of tests could give a very reliable outcome on possible risks deriving from using feedstock at higher concentrations.
The results shown in this study underline the necessity of having this kind of information on the heat transfer and fluid dynamics mechanisms occurring during plugging in SCWG. The results obtained can be used further for accurate mathematical modeling of the heat transfer phenomena and how different concentrations affect the reaction kinetics and the dynamics of the SCWG.
The experiments provide insightful results that could be used to train process control devices and software to identify this type of operational failure that hinders SCWG efficiency and safety. In addition, we provide arguments that point to the use of thicker-walled reactors, which could be necessary despite higher costs. We understand that this kind of result raises awareness of the safety aspect of SCWG, and we suggest the engagement of industrial tomography in maintenance costs.

Author Contributions

C.D.B. contributed to the experiments conducted, the conceptualization of the article, the writing of the text, and the supervision of the work; G.S. contributed in terms of article writing, editing, and formal analysis; A.M. had a major contribution in terms of experimental work, research, and formal analysis. All authors have read and agreed to the published version of the manuscript.

Funding

This research was funded by Högskolestiftelsen i Österbotten (grant number: 28600122K1) and the Harry Schaumans Foundation (grant number: 28002257F1).

Acknowledgments

The Högskolestiftelsen i Österbotten and the Harry Schaumans Foundation are greatly acknowledged for financing this work.

Conflicts of Interest

The authors declare no conflict of interest.

Nomenclature

SymbolPhysical SignificanceRangeUnits
aBurst pressure to wall thickness relation parameter, preexponential2.3824-
bBurst pressure to wall thickness relation parameter, exponent−1.035-
D e Reactor external diameter2.54cm
D i Reactor internal diameter1.43cm
E a , λ Creep crack growth activation energy85–105 kJ/mol
KStress intensity factor1–60MPa m1/2
P b u r s t Burst pressure70–150MPa
P i Reactor internal pressure220–260Bar
P e External pressure1Bar
P * Lower bound critical burst pressure50–200MPa
TReactor temperature420–650°C
VReactor volume81.6cm3
YGeometric factor1-
  α Crack growth rate to stress factor relation parameter, preexponential 2.2 × 10 22   MPa 7.5 m 2.25 s 1
β Crack growth rate to stress factor relation parameter, exponent7.5-
γ″Grain intermetallic structure--
ε Reactor wall thickness5.5mm
λ Material fracture width10−5–10−1mm
λ o Material initial fracture width10−5–10−2mm
λ ˙ Creep crack growth rate10−9–10−4mm/s
σ Hoop stress5–130MPa
σ U T S Ultimate tensile strength20–440MPa
σ Y o u n g Young modulus710–745MPa

References

  1. Organization of the Petroleum Exporting Countries. World Oil Outlook 2040; OPEC: Vienna, Austria, 2018; ISBN 978-3-9503936-6-8. [Google Scholar]
  2. Strezov, V.; Cho, H.H. Environmental Impact Assessment from Direct Emissions of Australian Thermal Power Generation Technologies. J. Clean. Prod. 2020, 270, 122515. [Google Scholar] [CrossRef]
  3. De Blasio, C. Fundamentals of Biofuels Engineering and Technology; Green Energy and Technology; Springer International Publishing: Berlin/Heidelberg, Germany, 2019; ISBN 978-3-030-11598-2. [Google Scholar]
  4. Kan, T.; Strezov, V.; Evans, T.J. Lignocellulosic Biomass Pyrolysis: A Review of Product Properties and Effects of Pyrolysis Parameters. Renew. Sustain. Energy Rev. 2016, 57, 1126–1140. [Google Scholar] [CrossRef]
  5. European Commission; Directorate General for Research and Innovation. Food 2030 Pathways for Action: Research and Innovation Policy as a Driver for Sustainable, Healthy and Inclusive Food Systems; European Commission: Brussels, Belgium, 2020. [Google Scholar]
  6. Outlook for Biogas and Biomethane: Prospects for Organic Growth—Analysis. 2020. Available online: https://www.iea.org/reports/outlook-for-biogas-and-biomethane-prospects-for-organic-growth (accessed on 3 May 2021).
  7. Zeynali, R.; Khojastehpour, M.; Ebrahimi-Nik, M. Effect of Ultrasonic Pre-Treatment on Biogas Yield and Specific Energy in Anaerobic Digestion of Fruit and Vegetable Wholesale Market Wastes. Sustain. Environ. Res. 2017, 27, 259–264. [Google Scholar] [CrossRef]
  8. Starr, F.; Cormos, C. Materials Challenges and Gasifier Choices in IGCC Processes for Clean and Efficient Energy Conversion. Mater. Res. Innov. 2011, 15, 428–446. [Google Scholar] [CrossRef]
  9. Sansaniwal, S.K.; Rosen, M.A.; Tyagi, S.K. Global Challenges in the Sustainable Development of Biomass Gasification: An Overview. Renew. Sustain. Energy Rev. 2017, 80, 23–43. [Google Scholar] [CrossRef]
  10. Singh Siwal, S.; Zhang, Q.; Sun, C.; Thakur, S.; Kumar Gupta, V.; Kumar Thakur, V. Energy Production from Steam Gasification Processes and Parameters That Contemplate in Biomass Gasifier—A Review. Bioresour. Technol. 2020, 297, 122481. [Google Scholar] [CrossRef]
  11. Yakaboylu, O.; Harinck, J.; Smit, K.G.; De Jong, W. Supercritical Water Gasification of Biomass: A Literature and Technology Overview. Energies 2015, 8, 859–894. [Google Scholar] [CrossRef]
  12. Cormos, A.-M.; Cormos, C.-C. Investigation of Hydrogen and Power Co-Generation Based on Direct Coal Chemical Looping Systems. Int. J. Hydrog. Energy 2014, 39, 2067–2077. [Google Scholar] [CrossRef]
  13. Cao, C.; Guo, L.; Chen, Y.; Guo, S.; Lu, Y. Hydrogen Production from Supercritical Water Gasification of Alkaline Wheat Straw Pulping Black Liquor in Continuous Flow System. Int. J. Hydrog. Energy 2011, 36, 13528–13535. [Google Scholar] [CrossRef]
  14. Sricharoenchaikul, V. Assessment of Black Liquor Gasification in Supercritical Water. Bioresour. Technol. 2009, 100, 638–643. [Google Scholar] [CrossRef] [PubMed]
  15. Barner, H.E.; Huang, C.Y.; Johnson, T.; Jacobs, G.; Martch, M.A.; Killilea, W.R. Supercritical Water Oxidation: An Emerging Technology. J. Hazard. Mater. 1992, 31, 1–17. [Google Scholar] [CrossRef]
  16. Özdenkçi, K.; De Blasio, C.; Sarwar, G.; Melin, K.; Koskinen, J.; Alopaeus, V. Techno-Economic Feasibility of Supercritical Water Gasification of Black Liquor. Energy 2019, 116284. [Google Scholar] [CrossRef]
  17. Cao, C.; Zhang, Y.; Li, L.; Wei, W.; Wang, G.; Bian, C. Supercritical Water Gasification of Black Liquor with Wheat Straw as the Supplementary Energy Resource. Int. J. Hydrog. Energy 2019, 44, 15737–15745. [Google Scholar] [CrossRef]
  18. Kouisni, L.; Gagné, A.; Maki, K.; Holt-Hindle, P.; Paleologou, M. LignoForce System for the Recovery of Lignin from Black Liquor: Feedstock Options, Odor Profile, and Product Characterization. ACS Sustain. Chem. Eng. 2016, 4, 5152–5159. [Google Scholar] [CrossRef]
  19. Janković, B. The Comparative Kinetic Analysis of Acetocell and Lignoboost® Lignin Pyrolysis: The Estimation of the Distributed Reactivity Models. Bioresour. Technol. 2011, 102, 9763–9771. [Google Scholar] [CrossRef]
  20. Hoffmann, A.; Nong, J.P.; Porzel, A.; Bremer, M.; Fischer, S. Modification of Lignoboost Kraft Lignin from Softwoods with Dihydroxybenzenes. React. Funct. Polym. 2019, 142, 112–118. [Google Scholar] [CrossRef]
  21. Lösönen, P. Statistics Finland. 2017. Available online: https://www.stat.fi/til/salatuo/2017/salatuo_2017_2018-11-01_tau_001_en.html (accessed on 21 October 2019).
  22. De Blasio, C.; Lucca, G.; Özdenkci, K.; Mulas, M.; Lundqvist, K.; Koskinen, J.; Santarelli, M.; Westerlund, T.; Järvinen, M. A Study on Supercritical Water Gasification of Black Liquor Conducted in Stainless Steel and Nickel-Chromium-Molybdenum Reactors. J. Chem. Technol. Biotechnol. 2015, 91, 2664–2678. [Google Scholar] [CrossRef] [Green Version]
  23. Bajpai, P. Chapter 4—Combustion of Black Liquor. In Pulp and Paper Industry; Bajpai, P., Ed.; Elsevier: Amsterdam, The Netherlands, 2017; pp. 67–100. ISBN 978-0-12-811103-1. [Google Scholar]
  24. Dahlquist, E.; Naqvi, M.; Thorin, E.; Yan, J.; Kyprianidis, K.; Hartwell, P. Experimental and Numerical Investigation of Pellet and Black Liquor Gasification for Polygeneration Plant. Appl. Energy 2017, 204, 1055–1064. [Google Scholar] [CrossRef]
  25. Bach-Oller, A.; Kirtania, K.; Furusjö, E.; Umeki, K. Co-Gasification of Black Liquor and Pyrolysis Oil at High Temperature: Part 2. Fuel Conversion. Fuel 2017, 197, 240–247. [Google Scholar] [CrossRef]
  26. Peng, C.; Zhang, G.; Yue, J.; Xu, G. Pyrolysis of Black Liquor for Phenols and Impact of Its Inherent Alkali. Fuel Process. Technol. 2014, 127, 149–156. [Google Scholar] [CrossRef]
  27. Al-Kaabi, Z.; Pradhan, R.; Thevathasan, N.; Gordon, A.; Chiang, Y.W.; Dutta, A. Bio-Carbon Production by Oxidation and Hydrothermal Carbonization of Paper Recycling Black Liquor. J. Clean. Prod. 2019, 213, 332–341. [Google Scholar] [CrossRef]
  28. Carvalho, L.; Lundgren, J.; Wetterlund, E.; Wolf, J.; Furusjö, E. Methanol Production via Black Liquor Co-Gasification with Expanded Raw Material Base—Techno-Economic Assessment. Appl. Energy 2018, 225, 570–584. [Google Scholar] [CrossRef]
  29. Hirose, T.; Shiba, K.; Enoeda, M.; Akiba, M. Corrosion and Stress Corrosion Cracking of Ferritic/Martensitic Steel in Super Critical Pressurized Water. J. Nucl. Mater. 2007, 367–370, 1185–1189. [Google Scholar] [CrossRef]
  30. Özdenkçi, K.; De Blasio, C.; Muddassar, H.R.; Melin, K.; Oinas, P.; Koskinen, J.; Sarwar, G.; Järvinen, M. A Novel Biorefinery Integration Concept for Lignocellulosic Biomass. Energy Convers. Manag. 2017, 149, 974–987. [Google Scholar] [CrossRef] [Green Version]
  31. De Blasio, C.; De Gisi, S.; Molino, A.; Simonetti, M.; Santarelli, M.; Björklund-Sänkiaho, M. Concerning Operational Aspects in Supercritical Water Gasification of Kraft Black Liquor. Renewable Energy 2019, 130, 891–901. [Google Scholar] [CrossRef]
  32. Lee, C.S.; Conradie, A.V.; Lester, E. Review of Supercritical Water Gasification with Lignocellulosic Real Biomass as the Feedstocks: Process Parameters, Biomass Composition, Catalyst Development, Reactor Design and Its Challenges. Chem. Eng. J. 2021, 415, 128837. [Google Scholar] [CrossRef]
  33. Larsson, A.; Kuba, M.; Berdugo Vilches, T.; Seemann, M.; Hofbauer, H.; Thunman, H. Steam Gasification of Biomass—Typical Gas Quality and Operational Strategies Derived from Industrial-Scale Plants. Fuel Process. Technol. 2021, 212, 106609. [Google Scholar] [CrossRef]
  34. Heidenreich, S.; Müller, M.; Foscolo, P.U. Chapter 6—New and Improved Gasification Concepts. In Advanced Biomass Gasification; Heidenreich, S., Müller, M., Foscolo, P.U., Eds.; Academic Press: Cambridge, MA, USA, 2016; pp. 98–114. ISBN 978-0-12-804296-0. [Google Scholar]
  35. Pinkard, B.R.; Gorman, D.J.; Tiwari, K.; Rasmussen, E.G.; Kramlich, J.C.; Reinhall, P.G.; Novosselov, I.V. Supercritical Water Gasification: Practical Design Strategies and Operational Challenges for Lab-Scale, Continuous Flow Reactors. Heliyon 2019, 5, e01269. [Google Scholar] [CrossRef] [Green Version]
  36. Peterson, A.A.; Vogel, F.; Lachance, R.P.; Fröling, M.; Michael, J.; Antal, J.; Tester, J.W. Thermochemical Biofuel Production in Hydrothermal Media: A Review of Sub- and Supercritical Water Technologies. Energy Environ. Sci. 2008, 1, 32–65. [Google Scholar] [CrossRef]
  37. Kruse, A. Supercritical Water Gasification. Biofuels Bioprod. Biorefin. 2008, 2, 415–437. [Google Scholar] [CrossRef]
  38. Fang, Z.; Sato, T.; Smith, R.L.; Inomata, H.; Arai, K.; Kozinski, J.A. Reaction Chemistry and Phase Behavior of Lignin in High-Temperature and Supercritical Water. Bioresour. Technol. 2008, 99, 3424–3430. [Google Scholar] [CrossRef]
  39. Yoshida, T.; Matsumura, Y. Reactor Development for Supercritical Water Gasification of 4.9 Wt% Glucose Solution at 673 K by Using Computational Fluid Dynamics. Ind. Eng. Chem. Res. 2009, 48, 8381–8386. [Google Scholar] [CrossRef]
  40. Davis, J.R. Nickel, Cobalt, and Their Alloys; ASM International, Ed.; ASM specialty handbook; ASM International: Materials Park, OH, USA, 2000; ISBN 978-0-87170-685-0. [Google Scholar]
  41. Okolie, J.A.; Rana, R.; Nanda, S.; Dalai, A.K.; Kozinski, J.A. Supercritical Water Gasification of Biomass: A State-of-the-Art Review of Process Parameters, Reaction Mechanisms and Catalysis. Sustain. Energy Fuels 2019, 3, 578–598. [Google Scholar] [CrossRef]
  42. Swagelok. Proportional Relief Valves; Swagelok Company: Solon, OH, USA, 2017. [Google Scholar]
  43. NIST Standard Reference Database 69: NIST Chemistry WebBook Thermophysical Properties of Fluid Systems. Available online: https://webbook.nist.gov/chemistry/fluid/ (accessed on 5 May 2021).
  44. Wagner, W.; Kretzschmar, H.-J. International Steam Tables—Properties of Water and Steam Based on the Industrial Formulation IAPWS-IF97, 2nd ed.; Springer: Berlin/Heidelberg, Germany, 2008; ISBN 978-3-540-21419-9. [Google Scholar]
  45. Brünig, M.; Gerke, S.; Hagenbrock, V. Micro-Mechanical Studies on the Effect of the Stress Triaxiality and the Lode Parameter on Ductile Damage. Int. J. Plast. 2013, 50, 49–65. [Google Scholar] [CrossRef]
  46. Chen, Z.; Butcher, C. Averaging Methods for Computational Micromechanics. In Micromechanics Modelling of Ductile Fracture; Solid Mechanics and Its Applications; Springer: Dordrecht, The Netherlands, 2013; Volume 195, pp. 25–74. ISBN 978-94-007-6097-4. [Google Scholar]
  47. Oh, D.H.; Race, J.; Oterkus, S.; Chang, E. A New Methodology for the Prediction of Burst Pressure for API 5L X Grade Flawless Pipelines. Ocean Eng. 2020, 212, 107602. [Google Scholar] [CrossRef]
  48. Hernalsteen, P. The Influence of Testing Conditions on Burst-Pressure Assessment for Inconel Tubing. Int. J. Press. Vessel. Pip. 1992, 52, 41–57. [Google Scholar] [CrossRef] [Green Version]
  49. Bai, Y.; Bai, Q. Subsea Engineering Handbook, 2nd ed.; Gulf Professional Publishing: Cambridge, MA, USA, 2019; ISBN 978-0-12-812622-6. [Google Scholar]
  50. ASTM International, E08 Committee. ASTM E1820-20e1, Test Method for Measurement of Fracture Toughness; ASTM International: West Conshohocken, PA, USA, 2020. [Google Scholar]
  51. ASTM International, E08 Committee. ASTM E1457-19e1, Standard Test Method for Measurement of Creep Crack Growth Times in Metals; ASTM International: West Conshohocken, PA, USA, 2019. [Google Scholar]
  52. Liu, X.; Fan, J.; Zhang, P.; Xie, J.; Chen, F.; Liu, D.; Yuan, R.; Tang, B.; Kou, H.; Li, J. Temperature Dependence of Deformation Behavior, Microstructure Evolution and Fracture Mechanism of Inconel 625 Superalloy. J. Alloys Compd. 2021, 159342. [Google Scholar] [CrossRef]
  53. Suave, L.M.; Cormier, J.; Villechaise, P.; Soula, A.; Hervier, Z.; Bertheau, D.; Laigo, J. Microstructural Evolutions During Thermal Aging of Alloy 625: Impact of Temperature and Forming Process. Metall. Mater. Trans. A 2014, 45, 2963–2982. [Google Scholar] [CrossRef]
  54. Zhang, Y.-C. Experimental Investigation and Numerical Prediction on Creep Crack Growth Behavior of the Solution Treated Inconel 625 Superalloy. Eng. Fract. Mech. 2018, 199, 327–342. [Google Scholar] [CrossRef]
  55. Liu, Y.; Li, M.; Ren, X.; Xiao, Z.; Zhang, X.; Huang, Y. Flow Stress Prediction of Hastelloy C-276 Alloy Using Modified Zerilli−Armstrong, Johnson−Cook and Arrhenius-Type Constitutive Models. Trans. Nonferrous Metals Soc. China 2020, 30, 3031–3042. [Google Scholar] [CrossRef]
  56. Konings, R.J.M.; Stoller, R.E. Comprehensive Nuclear Materials; Elsevier: Amsterdam, The Netherlands, 2020; ISBN 978-0-08-102866-7. [Google Scholar]
  57. Allen, T.R.; Chen, Y.; Ren, X.; Sridharan, K.; Tan, L.; Was, G.S.; West, E.; Guzonas, D. Material Performance in Supercritical Water. In Comprehensive Nuclear Materials; Elsevier: Amsterdam, The Netherlands, 2012; pp. 292–338. ISBN 978-0-08-102866-7. [Google Scholar]
  58. Ampornrat, P.; Gupta, G.; Was, G.S. Tensile and Stress Corrosion Cracking Behavior of Ferritic–Martensitic Steels in Supercritical Water. J. Nucl. Mater. 2009, 395, 30–36. [Google Scholar] [CrossRef]
  59. Kirkland, C.M.; Norton, D.; Firth, O.; Eldring, J.; Cunningham, A.B.; Gerlach, R.; Phillips, A.J. Visualizing MICP with X-Ray μ-CT to Enhance Cement Defect Sealing. Int. J. Greenh. Gas Control 2019, 86, 93–100. [Google Scholar] [CrossRef]
  60. Jha, N.K.; Lebedev, M.; Iglauer, S.; Sangwai, J.S.; Sarmadivaleh, M. In Situ Wettability Investigation of Aging of Sandstone Surface in Alkane via X-ray Microtomography. Energies 2020, 13, 5594. [Google Scholar] [CrossRef]
Figure 1. Reactor specifications. Adapted from HiP Company.
Energies 14 02863 g001
Figure 2. Relief valve used for manual adjustment of pressure.
Energies 14 02863 g002
Figure 3. Schematics of the experimental procedure. Feed cylinder (FC), ball valve, inlet section (A), reactor (R), thermocouples (1; 2 and 3), outlet section (B), backpressure regulator, and sampling bag (SB).
Energies 14 02863 g003
Figure 4. Sealing method and safety system for the SCWG reactor.
Energies 14 02863 g004
Figure 5. Temperatures and pressure values, recorded for the duration of one experiment at a set point temperature of 510 °C.
Energies 14 02863 g005
Figure 6. Temperatures and pressure values, recorded for the duration of one experiment at a set point temperature of 610 °C.
Energies 14 02863 g006
Figure 7. Specific heat capacity of water at diverse pressures against temperature. Derived from the NIST Standard Steam Tables [43].
Energies 14 02863 g007
Figure 8. Comparison of pressure recordings within the system at different setpoint temperatures.
Energies 14 02863 g008
Figure 9. Inlet mass against injection steps at 510 °C setpoint temperature.
Energies 14 02863 g009
Figure 10. Inlet mass against injection steps at 610 °C setpoint temperature.
Energies 14 02863 g010
Figure 11. A more detailed representation of sudden pressure drops occurring during continuous operation and temperature recordings at the reactor inlet and outside wall.
Energies 14 02863 g011
Figure 12. Pressure-drop comparison of simulated clogging for sucrose solution and water-only experiments.
Energies 14 02863 g012
Table 1. Physical properties of the reactor wall [40].
PropertyValueUnit
Density (20 °C)8440kg/m3
Coeff. Of thermal expansion (538 °C)14µm/m·K
Specific heat (21 °C)410J/Kg·K
Thermal conductivity9.8W/m·K
Tensile strength (21 °C)8550Bar
Tensile strength (540 °C)7450Bar
Tensile strength (650 °C)7100Bar
Stress-rupture strength (650 °C; 100 h)4400Bar
Stress-rupture strength (650 °C; 1000 h)3700Bar
Maximum working pressure (21 °C)1360Bar
Maximum working pressure (650 °C)1130Bar
Table 2. Reseal and set pressure of relief valves. Swagelok.
SeriesTest Set Pressure (bar)Minimum Reseal Pressure as Percentage of Set Pressure, %
RL3, RL40.7–1.350
12.0–15.591
R3A, R46.8–13.750
58.5–68.984
Publisher’s Note: MDPI stays neutral with regard to jurisdictional claims in published maps and institutional affiliations.

