Abstract
In this study, an experiment is conducted to explore the potential to protect both the environment and resource shortage of soybean straw, for combustion in a tubular furnace. Then, the combustion characteristics, gas emissions, and energy consumption of soybean straw are analyzed at a combustion temperature range of 773–1173 K. The results show that the total emissions of CO and NOX are the largest at a temperature of 873 K. For NOX, the emission time is significantly improved at temperatures of 973–1173 K. At high temperatures, the reaction of NOX with CO and coke reduces the total emission of NOX. The average weight loss rate at combustion temperatures of 973, 1073, and 1173 K increased by 27.38%, 61.47% and 77.97%, respectively, relative to that of 873 K. However, the energy consumption increases with the increase in combustion temperature, resulting in unnecessary waste. To get an optimal characteristic between energy utilization and pollutant discharge, a temperature range of 873–973 K is determined as the appropriate temperature for burning soybean straw.
1. Introduction
Energy conservation and environmental improvement, common concerns of humankind, are very important to social development all the time [1], especially for energy consumption [2], energy conversion [3] and energy saving [4]. According to the statistics of the proven energy reserves in the world, oil could still be mined for 40.5 years, natural gas for 66.7 years, and coal for 164 years [1]. With the increase in the demand for energy, it is difficult to meet the demand for a single energy supply mode of fossil fuel [1,5]. Meanwhile, the environmental problems caused by fuel combustion need to be considered [6]. The establishment of a diversified energy supply system can alleviate energy shortage and environmental pollution. Therefore, many scholars turn to the development, utilization and transformation technology of renewable energy [7].
Biomass is popular around the world because of its wide distribution, great energy storage [8,9], and its renewable and environment-friendly characteristics [10,11,12]. Biomass is considered to be a potential renewable resource [8] and it is widely used in thermal energy production, power generation, and liquefaction and gasification to produce biofuels [13]. Over 400 million tons of biomass waste is generated in China each year [14]. Soybean is one of the most widely grown cereal crops, however, throw away or burn in the field is regarded as the common management of soybean straw [15]. For soybean straw occupying a lot of land resources, and generating many pollutants during combustion, this article explores the appropriate soybean straw combustion temperature to avoid wasting resources and polluting the atmosphere.
Combustion is the most direct biomass utilization technology; the transformation and utilization of 97% of the biomass material in the world are by means of combustion [16,17]. Razmjoo et al. [18] investigated the temperature of wet woody residue combustion in moving grate boilers that are directly related to the release of pollutants and affect the furnace efficiency. During the combustion process, CO is used to measure the combustion degree and combustion condition, and NOX are considered as primary environmental pollutants, resulting in acid rain [19,20] and global warming [21]. Ren et al. [22] researched NO formation during combustion of four typical kinds of straw (wheat straw, rice straw, cotton straw, and corn straw) and found that over 70% fuel-N converts into NO for cotton straw, while only 37% for wheat straw under the same conditions. These researches used soybean straw as the experimental material and also paid attention to the waste volume reduction rate and the combustion energy consumption. Through reasonable adjustment of combustion conditions, they could improve combustion efficiency, save energy and protect the environment.
Since there is a lack of sufficient research concerning the emission characteristics of soybean straw, it is very helpful to investigate the effect of temperature on CO and NOX emissions, volume reduction rate and power consumption (including the experiment preparation phase) to develop efficient processing technology. This paper compares pollutant discharge and energy consumption index in order to determine the recommended combustion temperature phase. An analytical method, which synthetically ranged over the criterion of completeness of combustion, pollutant discharge, reduction treatment, and energy consumption of combustion, provides a theoretical foundation for highly efficient and low pollution combustion of soybean straw.
2. Materials and Methods
2.1. Sample Preparation
The soybean straw used in the experiment was from Meizhou City, Guangdong Province, China. It was dried at 378 K for 24 h in a desiccator (Yike Instrument and Equipment Co., Ltd. 101 A. Chengdu, China); the material was ground and screened into powder with a particle size of 80 meshes. The powder was packed into a sealing bag and saved in a drying basin on standby. Elementary analysis (based on the dry basis) and proximate analysis (based on the wet basis) were based on the ASTM D5373 standard and the E0870—82R98E01 standard, respectively; results are shown in Table 1.

Table 1.
The ultimate and proximate analysis of soybean straw.
2.2. Apparatus and Methods
As shown in Figure 1, the combustion characteristics of soybean straw at different temperatures were investigated in a tubular furnace (Yahua Furnace CO., LTD. SK2-4-13, Wuhan, China). The inner combustion chamber of the furnace was a quartz tube, and the temperature was detected by a thermocouple. The experimental combustion temperature was set to 773, 873, 973, 1073 and 1173 K, adjusted by an intelligent temperature controller with a deviation value of 1.5 K. Air at a flow rate of 0.1 m3/h was passed for 15 min before the start of the experiment to stabilize the gas flow in the reaction chamber. Each time 0.1 g soybean straw powder was placed in a porcelain boat (45 mm in length), measured by electronic balance with a resolution of 0.1 mg, and sent into the high-temperature zone by an iron hook. The flue gas generated by the reaction was analyzed by a flue gas analyzer (Leshi Alliance Technology CO., LTD, ECOM-J2KNIB, Beijing, China), the data acquisition time was 1 s, and the result was recorded by a computer. The remaining part of the flue gas was collected by a gas bag for further investigation and the rest was discharged, after treatment to a harmless state by the effluent gas treatment system. The solid residues in the porcelain boat were weighed with an electronic balance.
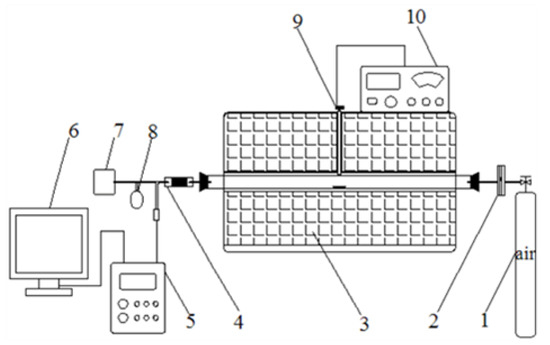
Figure 1.
The diagram of experimental apparatus: 1. gas bottle; 2. flowmeter; 3. tubular furnace; 4. filter; 5. flue gas tester; 6. computer; 7. effluent gas treatment system; 8. gas collecting bag; 9. thermocouple; 10. temperature controller.
2.3. Calculation Method
2.3.1. Volatile Material Residence Time in the Tubular Furnace
The value of is 1.5 m, is 0.07 m and is 0.1 m3/h as the tube furnace specifications and experimental project setup; then the value can be obtained as 9.69 s.
2.3.2. Volume Reduction Rate
2.3.3. Energy Consumption and Proportion
3. Results and Discussions
3.1. CO Emission
Figure 2 shows the CO emission concentration regularity under different temperatures. The peak concentration of CO rises first and then decreases, indicating that CO has undergone a strong formation reaction, which is closely related to temperature. The maximum peak concentration of CO was 3215 ppmv, which was 200 times as large as the minimum (16 ppmv).
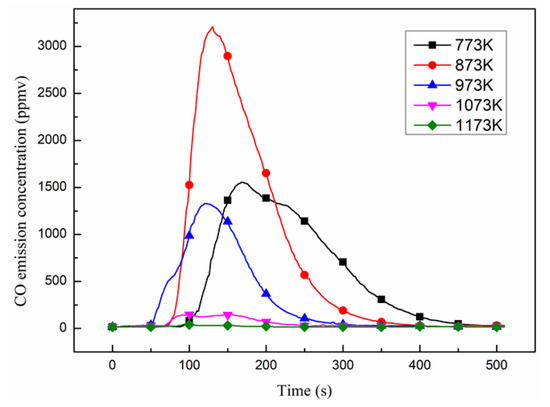
Figure 2.
The effect of combustion temperature on CO emission.
The total CO emissions at different temperatures are shown in Figure 3. The slope of the curve shows that the CO overflow rate increased at first, then decreased, with a maximum value of 127.5 ppmv/s at 873 K. However, the total emission also first increased and then decreased just like the variation tendency found in the literature [20,23]. Total emission arrived at 873 K, with its peak value as 354,570 ppmv, which was 194.61 times as large as the minimum (1822 ppmv). This may be because 873 K is an excess temperature from incomplete combustion to complete combustion, whereas, CO can hardly overflow at 1173 K, indicating that soybean straw burned to a complete state.
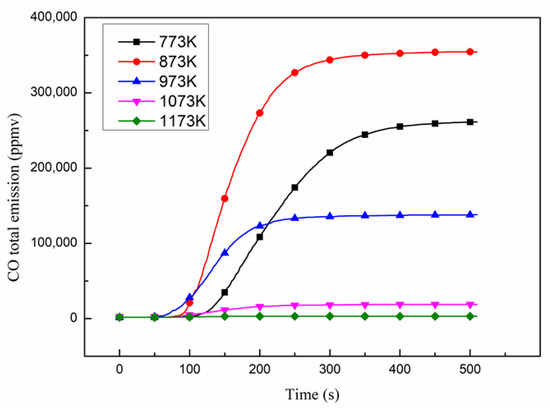
Figure 3.
The effect of combustion temperature on CO total emission.
The effects of temperature on the important parameters of CO emission are shown in Table 2. In order to obtain an exact value, the residence time of CO in the tubular furnace ( = 9.69 s) should be subtracted. The time CO stays in the filter bank and the time for signal conversion and transmission should be ignored due to their small values.
Table 2.
The effect of combustion temperature on CO emission.
As seen from Table 2, the output time of CO is brought forward with a rise of temperature, and the maximum extent is about 7 s. It is made clear that volatile overflowed more easily. It should be on this account that the output of volatile is in close relation to heat flux [24]. From the point of view of heat transport, with higher combustion temperature, the material has a larger thermal gradient and heat flux from inside to outside, and its temperature rose more rapidly to improve the material drying degree and volatile precipitation. From the point of view of mass transfer, under low-temperature levels, pyrolysis plays a major role in the initial stage of combustion, whereas a large amount of coke formed by incomplete pyrolysis in the outer layer of material, which will have reactions with the overflow of volatile and even block the volatile [25]. In addition, the CO reached its maximum emission level at 221 s. As the temperature increases, CO emissions gradually stabilize at lower emission levels, because in the state of high heat flux density, volatiles are easily emitted and completely burned [26]. It can also be seen that the average overflow rate of CO increased first after declining; a tendency also noted in the research of Tang [27]. The maximum average emission rate (808.95 ppmv/s) was 113 times as large as the minimum rate (7.16 ppmv/s). In this paper, the average overflow rate of CO reached its peak value at 873 K, indicating once again that 873 K was the excessive temperature from incomplete combustion to complete combustion.
3.2. Volume Reduction Rate
The volume reduction rate and average weight loss rate of soybean straw under different temperature levels are shown in Figure 4 and Figure 5, respectively. As the temperature rose, their values increased. The weight loss was mainly carried out at temperatures below 873 K, which matched up to the research of cellulosic material combustion [23]. It might be owed to devolatilization of lignocellulose and fixed carbon combustion [28], for the volatile and fixed carbon can reach up to 83.81% of material proximate analysis. When the temperature was higher than 873 K, the volume reduction was relatively small, and the increasing range of volume reduction rate was only 2.31%.
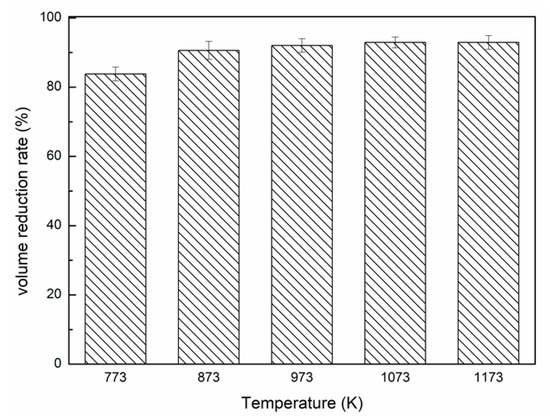
Figure 4.
The effect of combustion temperature on the volume reduction rate.
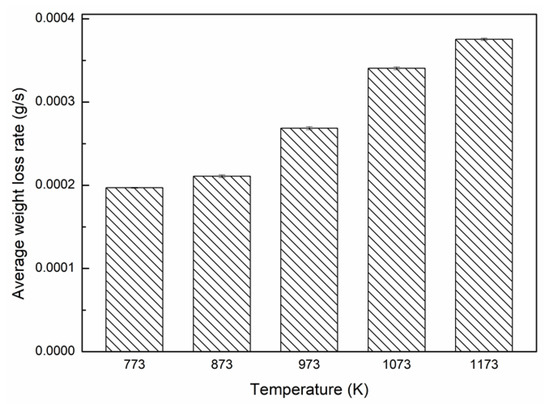
Figure 5.
The effect of combustion temperature on the average weight loss rate.
From 873 to 1173 K, the weight loss can be related to the reduction reaction of semicoke with CO2 [28,29] and degradation of minerals [30]. However, the average weight loss rate rose as the combustion temperature increased, indicating that high temperature is quite advantageous to rapid volume reduction of material. Moreover, 873 K was the inflection temperature of the average weight loss rate. The average weight loss rate at 973, 1073, and 1173 K increased by 27.38%, 61.47% and 77.97%, respectively, relative to that of 873 K; it stood to reason that complete combustion could promote volatile to separate out, cause the flammable substance to break down, and raise the combustion efficiency [31].
3.3. NOX Emission
Figure 6 shows the NOX emission concentration under different temperatures. As shown in the figure, the NOX peak concentration increased as temperature rose, and the time to reach peak concentration shortened. The most conspicuous difference occurred between 873 and 973 K; within that range the peak concentration increased 63.75%, and the time to reach peak concentration was reduced by 143 s. Combined with the analysis of CO emission, it is clear that NOX formation has a strong relation to combustion temperature and combustion state [32,33,34].
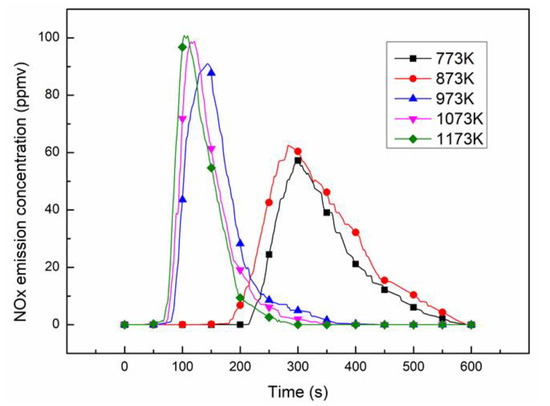
Figure 6.
The effect of combustion temperature on NOX emission concentration.
NOX total emission, under different temperature levels, is shown in Figure 7. The occurrence time of NOX advances with the increase of temperature. After the temperature is higher than 873 K, there is a large span advance. When the temperature was 973, 1073, and 1173 K, the output time was moved forward by 102, 110, and 119 s, respectively, compared to 873 K. It seems that NOX formation could be related to combustion temperature [35]. However, the total emission of NOX increased first and reduced afterward, reaching its peak value (10,875 ppmv) at 873 K, increasing to about 46.11% of the total emission (7443 ppmv) at 1173 K; according to previous studies, possibly because at high temperature the catalysis of alkaline earth metal oxide reduces the NOX [36,37]. On the other hand, the reaction between NOX and CO is shown in Equations (10) and (11). The main products are N2 and N2O. The products in the high-temperature range are mainly N2 [26,38]. At the same time, a large amount of volatiles will overflow at high temperatures. A large number of carbon pore structures are produced, which makes NOX more likely to contact coke [39,40], and the reaction Equation (12) consumes some NOX, resulting in a reduction in the total amount of NOX.
CO + 2NO = CO2 + N2O
3C + 4NO = CO2 + 2CO + 2N2
2CO + 2NO = 2CO2 + N2
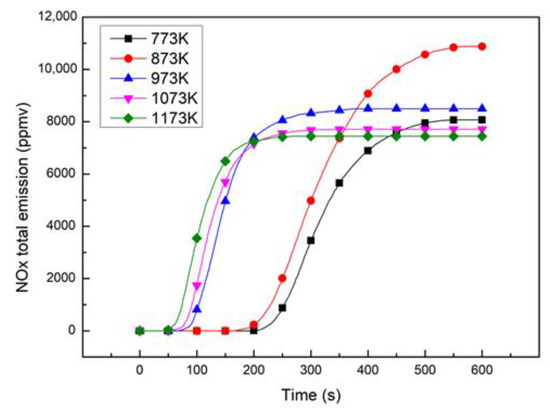
Figure 7.
The effect of combustion temperature on NOX total emission.
3.4. Power Consumption
Energy consumption can be regarded as an important index [41,42,43]. The effect of combustion temperature on power consumption is shown in Table 3. As shown in the table, when the temperature rose, the time of the experiment test expanded, and the maximum range was 58.315%. The cause was that when the set combustion temperature was higher, more heating-up time was required [44]. It was the efficient cause of the increased power consumption; the maximum (1.709 kWh) was 4.222 times as high as the minimum (0.405 kWh). However, during the experiment, the energy consumption cost from the heating period accounts for more than half of the total power consumption. With the continuous improvement of the temperature, the proportion of can reach 88.456%. This may be due to the small amount of experimental materials used, resulting in low power consumption cost during combustion. It is apparent that the power consumption during experiment preparation cannot be ignored, and it has a high impact on energy loss analysis of the experiment.
Table 3.
The effect of combustion temperature on power consumption.
3.5. Optimum Combustion Temperature
The CO, NOX and volume reduction rate increment of unit power consumption in different combustion temperatures are shown in Figure 8, Figure 9 and Figure 10.
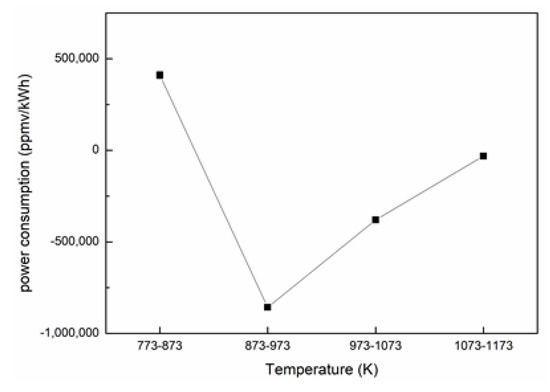
Figure 8.
CO increment of unit power consumption in different temperature phases.
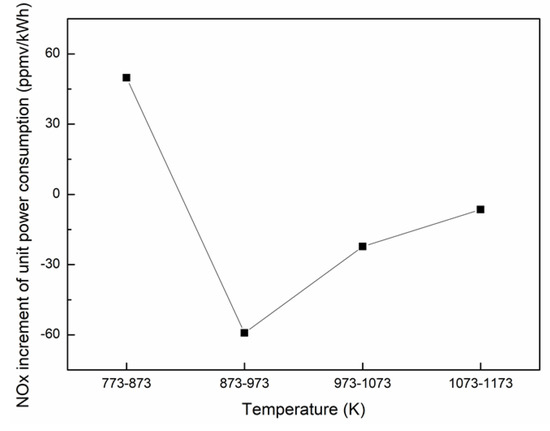
Figure 9.
NOX increment of unit power consumption in different temperature phases.
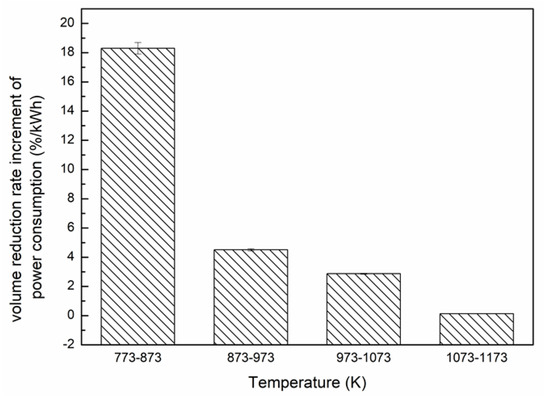
Figure 10.
Volume reduction rate increment of unit power consumption in different temperature phases.
In the range 773–873 K, the total emission of CO and NOX increased as energy input; the increments were 411046.1 and 49.8 ppmv/kWh, respectively. It seems that this temperature stage is inadvisable because it consumes more energy and produces more pollutants synchronously. However, during each temperature stage which was higher than 873 K, the total emission of unit power consumption of CO and NOX decreased, and the maximum decrements (857023.6 and 59.2 ppmv/kWh, respectively) were carried out in 873–973 K, indicating that in this temperature stage combustion ran to its complete state, and NOX emission reduced quickly at the same time. It is of great benefit to save energy and protect the environment.
As seen in Figure 10, the volume reduction rate increment of unit power consumption during 773–873 K had a maximum value of 18.304%/kWh. However, when the experiment entered the next three temperature stages of 873–973, 973–1073, and 1073–1173 K, the relevant value sharply declined to 4.504%, 2.871% and 0.127%/kWh, respectively. It meant that when the temperature was higher than 873 K, the material volume lessens little with the power input. Therefore, a temperature higher than 873 K should be selected in order to reduce the volume to a large extent.
According to the analysis, it seems that the temperature stage of 873–973 K is of great benefit to lower CO and NOX emission, and the residual mass remained basically stable. So 873–973 K seems to be propitious to high efficiency and low emission combustion of soybean straw.
4. Conclusions
An experimental investigation on soybean straw combustion was performed to determine a balance of temperature impact on both energy consumption and environmental protection. Then, the emission and combustion characteristics of soybean straw were compared at different temperatures. Results show that the pollutants such as CO and NOX from soybean straw combustion at 873 K are higher than other temperatures. CO reached its maximum total emission as 354,570 ppmv at 873 K, which was 195 times as large as it was at 1173 K. The NOX at 873 K had its maximum total emission 10,875 ppmv, which was 53.018% higher than the minimum of 7107 ppmv at 1173 K. The volume reduction rate at 1173 K was only 2.31% higher than that at 873 K. Furthermore, the time to reach the peak NOX emission concentration at 973 K was 143 s faster than at 873 K. The higher temperature keeps the soybean straw in a complete state of combustion, which avoids excessive CO and inhibits the generation of NOX. However, the additional energy consumption caused by the increased temperature needs to be considered in the test. All the power consumption during the temperature-rise period was over 60% of the total power consumption. Therefore, the soybean straw combustion temperature of 873–973 K is recommendable as a comprehensive consideration of energy consumption and environmental protection.
Author Contributions
Conceptualization, Q.X., W.P. and C.L.; data curation, W.P.; formal analysis, Q.X. and W.P.; funding acquisition, Q.X.; investigation, Q.X., W.P. and C.L.; methodology, Q.X., W.P. and C.L.; project administration, Q.X. and C.L.; resources, Q.X. and C.L.; supervision, Q.X. and C.L.; validation, Q.X. and W.P.; visualization, W.P.; writing—original draft preparation, Q.X. and W.P.; writing—review and editing, Q.X. and C.L. All authors have read and agreed to the published version of the manuscript.
Funding
This research was funded by the Science and Technology Planning Project of Shenzhen City of China, No. JCYJ 20170818111529172.
Conflicts of Interest
The authors declare no conflict of interest.
References
- Hossain, A.K.; Badr, O. Prospects of renewable energy utilisation for electricity generation in Bangladesh. Renew. Sustain. Energy Rev. 2007, 11, 1617–1649. [Google Scholar] [CrossRef]
- Lin, A.; Zheng, Q.; Jiang, Y.; Lin, X.; Zhang, H. Sensitivity of air/mist non-equilibrium phase transition cooling to transient characteristics in a compressor of gas turbine. Int. J. Heat Mass Transf. 2019, 137, 882–894. [Google Scholar] [CrossRef]
- Lin, A.; Zhou, J.; Fawzy, H.; Zhang, H.; Zheng, Q. Evaluation of mass injection cooling on flow and heat transfer characteristics for high-temperature inlet air in a MIPCC engine. Int. J. Heat Mass Transf. 2019, 135, 620–630. [Google Scholar] [CrossRef]
- Jiang, X.; Lin, A.; Ma, H.; Li, X.; Li, Y. Minimizing the thermal bridge through the columns in a refrigeration room. Appl. Eng. 2020, 165, 114565. [Google Scholar] [CrossRef]
- Klass, D.L. Chapter 4—Virgin Biomass Production. In Biomass for Renewable Energy, Fuels, and Chemicals; Klass, D.L., Ed.; Academic Press: San Diego, CA, USA, 1998; pp. 91–136. [Google Scholar]
- Du, Z.; Li, Y.; Wang, X.; Wan, Y.; Chen, Q.; Wang, C.; Lin, X.; Liu, Y.; Chen, P.; Ruan, R. Microwave-assisted pyrolysis of microalgae for biofuel production. Bioresour. Technol. 2011, 102, 4890–4896. [Google Scholar] [CrossRef]
- Haykiri-Acma, H.; Yaman, S.; Kucukbayrak, S. Effect of heating rate on the pyrolysis yields of rapeseed. Renew. Energy 2006, 31, 803–810. [Google Scholar] [CrossRef]
- Huber, G.W.; Iborra, S.; Corma, A. Synthesis of transportation fuels from biomass: Chemistry, catalysts, and engineering. Chem. Rev. 2006, 106, 4044–4098. [Google Scholar] [CrossRef]
- Gross, R.; Leach, M.; Bauen, A. Progress in renewable energy. Environ. Int. 2003, 29, 105–122. [Google Scholar] [CrossRef]
- Zou, S.; Wu, Y.; Yang, M.; Li, C.; Tong, J. Pyrolysis characteristics and kinetics of the marine microalgae Dunaliella tertiolecta using thermogravimetric analyzer. Bioresour. Technol. 2010, 101, 359–365. [Google Scholar]
- Ren, S.; Lei, H.; Wang, L.; Bu, Q.; Chen, S.; Wu, J.; Julson, J.; Ruan, R. Biofuel production and kinetics analysis for microwave pyrolysis of Douglas fir sawdust pellet. J. Anal. Appl. Pyrolysis 2012, 94, 163–169. [Google Scholar] [CrossRef]
- Sun, Z.; Shen, J.; Jin, B.; Wei, L. Combustion characteristics of cotton stalk in FBC. Biomass Bioenergy 2010, 34, 761–770. [Google Scholar] [CrossRef]
- Tonini, D.; Vadenbo, C.; Astrup, T.F. Priority of domestic biomass resources for energy: Importance of national environmental targets in a climate perspective. Energy 2017, 124, 295–309. [Google Scholar] [CrossRef]
- Wang, T.; Li, Y.; Zhi, D.; Lin, Y.; He, K.; Liu, B.; Mao, H. Assessment of combustion and emission behavior of corn straw biochar briquette fuels under different temperatures. J. Environ. Manag. 2019, 250, 109399. [Google Scholar] [CrossRef]
- Larsen, S.U.; Bruun, S.; Lindedam, J. Straw yield and saccharification potential for ethanol in cereal species and wheat cultivars. Biomass Bioenergy 2012, 45, 239–250. [Google Scholar] [CrossRef]
- Demirbas, A. Combustion of biomass. Energy Sources Part A-Recovery Util. Environ. Eff. 2007, 29, 549–561. [Google Scholar] [CrossRef]
- Demirbas, M.F. Biorefineries for biofuel upgrading: A critical review. Appl. Energy 2009, 86, S151–S161. [Google Scholar] [CrossRef]
- Razmjoo, N.; Sefidari, H.; Strand, M. Measurements of temperature and gas composition within the burning bed of wet woody residues in a 4MW moving grate boiler. Fuel Process. Technol. 2016, 152, 438–445. [Google Scholar] [CrossRef]
- Delfino, R.J. Epidemiologic evidence for asthma and exposure to air toxics: Linkages between occupational, indoor, and community air pollution research. Environ. Health Perspect. 2002, 110, 573–589. [Google Scholar] [CrossRef]
- Yang, B.; Peng, L.; Wang, Y.; Song, J. The characteristics of air pollutants from the combustion o biomass pellets. Energy Sources Part A-Recovery Util. Environ. Eff. 2018, 40, 351–357. [Google Scholar] [CrossRef]
- Peace, H.; Owen, B.; Raper, D.W. Identifying the contribution of different urban highway air pollution sources. Sci. Total Environ. 2004, 334, 347–357. [Google Scholar] [CrossRef]
- Ren, Q.; Zhao, C.; Duan, L.; Chen, X. NO formation during agricultural straw combustion. Bioresour. Technol. 2011, 102, 7211–7217. [Google Scholar] [CrossRef]
- Lai, Z.; Ma, X.; Tang, Y.; Lin, H.; Chen, Y. Thermogravimetric analyses of combustion of lignocellulosic materials in N-2/O-2 and CO2/O-2 atmospheres. Bioresour. Technol. 2012, 107, 444–450. [Google Scholar] [CrossRef]
- Lu, X.; Ji, L.; Ma, J.; Zhou, X.; Huang, Z. Combustion characteristics and influential factors of isooctane active-thermal atmosphere combustion assisted by two-stage reaction of n-heptane. Combust. Flame 2011, 158, 203–216. [Google Scholar] [CrossRef]
- Lv, P.M.; Xiong, Z.H.; Chang, J.; Wu, C.Z.; Chen, Y.; Zhu, J.X. An experimental study on biomass air-steam gasification in a fluidized bed. Bioresour. Technol. 2004, 95, 95–101. [Google Scholar] [CrossRef]
- Jin, Y.; Lu, L.; Ma, X.; Liu, H.; Chi, Y.; Yoshikawa, K. Effects of blending hydrothermally treated municipal solid waste with coal on co-combustion characteristics in a lab-scale fluidized bed reactor. Appl. Energy 2013, 102, 563–570. [Google Scholar] [CrossRef]
- Tang, Y.; Ma, X.; Lai, Z.; Zhou, D.; Chen, Y. Thermogravimetric characteristics and combustion emissions of rubbers and polyvinyl chloride in N-2/O-2 and CO2/O-2 atmospheres. Fuel 2013, 104, 508–514. [Google Scholar] [CrossRef]
- Fang, M.X.; Shen, D.K.; Li, Y.X.; Yu, C.J.; Luo, Z.Y.; Cen, K.F. Kinetic study on pyrolysis and combustion of wood under different oxygen concentrations by using TG-FTIR analysis. J. Anal. Appl. Pyrolysis 2006, 77, 22–27. [Google Scholar] [CrossRef]
- Betancur, M.; Daniel Martinez, J.; Murillo, R. Production of activated carbon by waste tire thermochemical degradation with CO2. J. Hazard. Mater. 2009, 168, 882–887. [Google Scholar] [CrossRef]
- Liao, Y.; Ma, X. Thermogravimetric analysis of the co-combustion of coal and paper mill sludge. Appl. Energy 2010, 87, 3526–3532. [Google Scholar]
- Sørum, L.; Grønli, M.G.; Hustad, J.E. Pyrolysis characteristics and kinetics of municipal solid wastes. Fuel 2001, 80, 1217–1227. [Google Scholar] [CrossRef]
- Park, K.K. A differential equation for vapor pressure as a function of temperature. Fluid Phase Equilibria 2010, 290, 158–165. [Google Scholar] [CrossRef]
- Youn, I.M.; Park, S.H.; Roh, H.G.; Lee, C.S. Investigation on the fuel spray and emission reduction characteristics for dimethyl ether (DME) fueled multi-cylinder diesel engine with common-rail injection system. Fuel Process. Technol. 2011, 92, 1280–1287. [Google Scholar] [CrossRef]
- Zhang, X.; Wang, Q. Emission characteristics of biomass combustion under oxyfuel conditions. Energy Sources Part A-Recovery Util. Environ. Eff. 2018, 40, 688–692. [Google Scholar] [CrossRef]
- Celikten, I. An experimental investigation of the effect of the injection pressure on engine performance and exhaust emission in indirect injection diesel engines. Appl. Therm. Eng. 2003, 23, 2051–2060. [Google Scholar] [CrossRef]
- Werther, J.; Saenger, M.; Hartge, E.U.; Ogada, T.; Siagi, Z. Combustion of agricultural residues. Prog. Energy Combust. Sci. 2000, 26, 1–27. [Google Scholar] [CrossRef]
- Yang, T.; Ji, Q.; Kai, X.; Meng, Y. Release and transformation of potassium during corn straw and coal co-combustion. Energy Sources Part A-Recovery Util. Environ. Eff. 2018, 40, 327–334. [Google Scholar] [CrossRef]
- Al Asfar, J.J.; AlShwawra, A.; Sakhrieh, A.; Hamdan, M.A. Combustion characteristics of solid waste biomass, oil shale, and coal. Energy Sources Part A-Recovery Util. Environ. Eff. 2018, 40, 335–342. [Google Scholar] [CrossRef]
- Biagini, E.; Tognotti, L. Comparison of devolatilization/char oxidation and direct oxidation of solid fuels at low heating rate. Energy Fuels 2006, 20, 986–992. [Google Scholar] [CrossRef]
- Muthuraman, M.; Namioka, T.; Yoshikawa, K. A comparative study on co-combustion performance of municipal solid waste and Indonesian coal with high ash Indian coal: A thermogravimetric analysis. Fuel Process. Technol. 2010, 91, 550–558. [Google Scholar] [CrossRef]
- Lin, A.; Sun, Y.; Zhang, H.; Lin, X.; Yang, L.; Zheng, Q. Fluctuating characteristics of air-mist mixture flow with conjugate wall-film motion in a compressor of gas turbine. Appl. Therm. Eng. 2018, 142, 779–792. [Google Scholar] [CrossRef]
- Jia, X.; Zhang, H.; Zheng, Q. Numerical investigation on the effect of hot running rim seal clearance on hot gas ingestion into rotor-stator system. Appl. Therm. Eng. 2019, 152, 79–91. [Google Scholar] [CrossRef]
- Lin, A.; Zheng, Q.; Fawzy, H.; Luo, M.; Zhou, J.; Zhang, H. Effect of water injection cooling on flow field characteristics in the cooling section of precooled turbine-based combined cycle engine. Int. J. Heat Mass Transf. 2019, 141, 615–626. [Google Scholar] [CrossRef]
- Akhtar, J.; Yaseen, A.; Munir, S. Effect of rice husk co-combustion with coal on gaseous emissions and combustion efficiency. Energy Sources Part A-Recovery Util. Environ. Eff. 2018, 40, 1010–1018. [Google Scholar] [CrossRef]


© 2020 by the authors. Licensee MDPI, Basel, Switzerland. This article is an open access article distributed under the terms and conditions of the Creative Commons Attribution (CC BY) license (http://creativecommons.org/licenses/by/4.0/).