Abstract
The electric breakdown at single and multiple protrusions in SF6 and CO2 is investigated at 0.4 and 0.6 MPa, respectively. Additionally, the breakdown fields at rough surfaces of two different areas were determined. From the measurements, breakdown probability distributions for single protrusions were determined and fitted by Weibull distributions. This allowed the determination of statistical enlargement laws for the 50% breakdown probability fields E50. Such enlargement laws describe, for example, the scaling of breakdown field with electrode area or number of protrusions. The predictions were compared to the experimental data, and both agreement and discrepancies were observed depending on polarity and number of protrusions and gas. Discharge predictions including first electron, streamer inception and crossing, as well as leader propagation, gave further insight to this. It was found that predictions from enlargement laws based on statistical processes may not describe the measured breakdown fields well and that relevant physical breakdown criteria must also be considered.
1. Introduction
Gaseous insulation is used in many high voltage applications as, for example, gas-insulated switchgear (GIS) and circuit breakers (CB) [1,2,3,4,5,6]. For compact insulation compressed gas in the pressure range of 0.13–1 MPa is used. In most applications today, SF6 is used; however, it is a strong greenhouse gas (e.g., [7,8]). Therefore, the search for alternative insulation gases has significantly increased during the last years. The most promising gas in HV switchgear applications for replacing SF6 is CO2, which is used in mixtures with low-additive concentrations of, e.g., O2, Perfluoroketones (PFK) or Perfluoronitriles (PFN) [8,9,10,11,12]. The additive concentrations are typically in the range of a few percent due to boiling point requirements. This will be referred to as CO2-based insulation.
Gaseous insulation strength depends on the critical field of the gas [2,5,6], the field at which ionization leads to multiplication of electrons within an avalanche. This is determined by the zero crossing of the effective ionization coefficient, which is specific for a gas. The slope of the effective ionization coefficient determines the sensitivity of the insulation system to the surface imperfections [13,14,15,16,17,18,19,20,21,22,23,24]. Thus, depending on the properties of the gases, the insulation performance is determined not only by the critical field of the gas but also by imperfections like surface roughness or particulate contamination. This is especially more pronounced at higher pressures of 0.7 to 1 MPa, which is the preferred pressure range for CO2-based insulation [25,26,27,28,29,30,31,32,33]. Since CO2 is the base gas in these mixtures, a good understanding of the insulation characteristics of CO2 at conditions of practical applications is needed.
Several investigations addressed the effect of electrode surface roughness and representations of those by single or multiple protrusions in SF6—see [14,16,17,18,21]. Single-protrusion models have shown reasonable agreement with measurements when taking into account the availability of a start electron for an avalanche, streamer inception and leader propagation [34,35,36,37,38]. Surface roughness and the effect of insulating coatings in SF6 have been investigated experimentally by [23,24].
CO2-based insulation is still less investigated than SF6, and investigations with fluorinated additives to CO2 just recently appeared. The effect of surface roughness and protrusions in pure CO2 was investigated by [29,30,31,32,33,36,37], respectively. Breakdown at surfaces in CO2-PFK and CO2-PFN mixtures is reviewed in [8,9,10]. The effect of surface roughness at pressures above 1 MPa was investigated, e.g., by [27,36]. Breakdown at single protrusions in CO2 was investigated by [37], showing that streamer propagation, in contrast to SF6, also plays an important role for the breakdown in practical configurations, like in the presence of particulate contamination.
Several investigations addressed the effect of enlargement laws, i.e., the reduction of the breakdown field by the size of the electrode area or volume and time laws—see [5,6,13,39]. A theoretical investigation on approximation of surface roughness by an array of multiple protrusions was done by [40]. In this investigation, the surface roughness was approximated by multiple protrusions of given length and with hemispherical tip. The influence of the distance between protrusions was also addressed. Application of discharge inception and breakdown criteria based on start electron, streamer inception and leader inception were used to estimate breakdown fields for such arrays.
The previous investigations have shown that there is still only limited understanding how to describe the surface roughness induced breakdown fields by single and multiple protrusions, especially when considering the surface area and time scaling effects. Therefore, measurements are still needed to characterize breakdown fields in practical applications as, e.g., shown in [5,27,29,34]. It would be desirable to have models for surface roughness or protrusion/particle induced breakdown which can, for arbitrary gases, electrode size and number of protrusions, describe the breakdown fields sufficiently reliable. The present investigation addresses this in a first step by measuring breakdown fields at single and multiple protrusions for short duration voltage waveform, which is similar to Lightning Impulse (LI) in standard testing according to IEC [6]. This procedure is similar to the theoretical study of [40]. Investigation of different gases in this study allows for understanding the differences between strongly attaching (SF6) and weakly attaching (CO2) gases. A novel test setup with a multiple protrusion array in a uniform background field is used and fill pressures of 0.4 MPa SF6 and 0.6 MPa CO2 are tested. The protrusion lengths are varied between 50 μm and 2 mm. The number of protrusions is varied between 1 and 100. Protrusions of small lengths of a few 10 to few 100 µm correspond to the surface roughness, whereas long protrusions of more than 500 µm correspond to particulate contamination or severe surface damages [35]. The effect of the number of protrusions, i.e., the statistical enlargement law, is addressed by scaling of the measured breakdown probability distributions using Weibull approximations—see [6,39,41,42]. This allows the validity of enlargement laws for such well-defined situations to be checked. Further insight is obtained by comparison to theoretical discharge inception and breakdown models based on start electron, streamer inception and streamer and leader propagation from [34,35,36,37,38]. Additionally, the surface area scaling is investigated experimentally on rough electrodes of similar surface structure. Results are interpreted with the findings from the protrusion arrays.
2. Test Setups
2.1. Test Circuit and Protrusion Setup
The experiments and the analysis were performed at Hitachi ABB Power Grids Research, Switzerland. The setup is shown schematically in Figure 1. It is a similar setup as used in previous investigations where the partial discharges and breakdown at a single protrusion was investigated [37,38]. In the present investigation, the plate electrode with the protrusion on the ground side was replaced by a plate with a protrusion array. The protrusion array plate had 20 × 20 holes of 1.2 mm diameter and 2 mm center to center spacing—see Figure 2a. The protrusions were at ground potential. When we refer to polarity in the following always the polarity of the protrusions is meant.
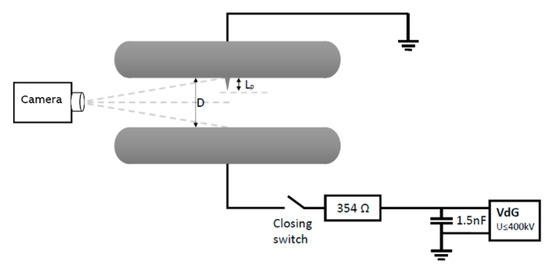
Figure 1.
Schematic setup with a single protrusion. The gap length was D = 10 or 15 mm. The load capacitance was charged via a Van de Graaf (VdG) DC source and switched via a resistor and closing switch onto the test gap. The discharges were observed by a high-resolution digital camera (Nikon D9000).
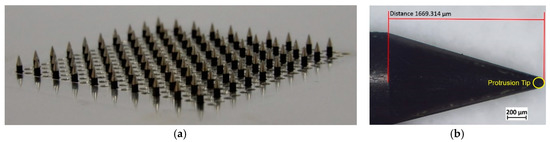
Figure 2.
Protrusion array. (a) Protrusion array with 100 protrusions. (b) Protrusion tip details.
In the shown case in Figure 2a, 100 protrusions were inserted, but also fewer protrusions were tested. The protrusions were fixed to a matching grid by a magnet on a table below the perforated plate. The matching grid was moved by a stepper motor (Thorlabs GmbH, Bergkirchen, Germany, Model ZFS13B) with high positioning accuracy (<1 µm). The setup was placed, as in previous experiments, in a GIS test vessel filled with 0.4 MPa SF6 or 0.6 MPa CO2. With the stepper motor the protrusion lengths could be adjusted from outside, i.e., without opening the GIS. The overall reproducibility of the length adjustment was experimentally determined to be better than 20 µm for a single protrusion. In experiments with several protrusions, the total variation of lengths was less than 100 µm.
The protrusions were made out of steel with diameter 1 mm and had a conical tip of 1.6–1.7 mm length and tip radius of 66 µm at its end, marked by the yellow circle—see Figure 2b. The spacing between the protrusions was usually 4 mm. Only for CO2 when using 20 protrusions also a spacing of 2 mm was tested. The protrusions were replaced regularly, typically after a few hundred tests. The effect of erosion was checked by repeating experiments in new and worn conditions. The differences in the breakdown voltages due to this were within the uncertainties of protrusion lengths adjustments, i.e., repeating experiments with the same protrusion in new condition led to a similar breakdown voltage as in worn condition.
The applied voltage was a stepped DC pulse, as used in [37,38], with a rise time of 200 ns and voltage application time of 15 s, typically. In experiments with multiple protrusions, the voltage dropped due to partial discharges after a few 10 µs; thus, we focused on early breakdowns in the time range from the voltage peak to 10 µs after the peak was reached. From the time to breakdown, this can be associated with standard lightning impulse (LI) breakdown.
The applied voltage peak was varied over a wide range in order to obtain breakdown and withstand values. Typically, at least 100 tests were done per case. Between the tests, a small bias voltage of 20 kV was applied for 2 s to remove remaining ions from the gap, which could influence the start electron statistics. Thus, in the present investigation we determine breakdown fields at protrusions which can be related to LI standard wave shape. For small protrusion size in the order of 100 µm, breakdown also occurred at the plate electrode, e.g., at dust particles. With a single-shot digital camera (see Figure 1), it was checked that only breakdowns that occurred at a protrusion were taken into consideration.
2.2. Electrodes with Surface Roughness
Two different electrode types were tested: a small plug-type contact of 19 mm diameter, as seen in Figure 3, and a larger Rogowski-shaped electrode of 120 mm diameter. The electrodes were placed against a plate electrode, as in setup 1 with a 10 mm gap. Both electrodes were made from stainless steel and were sandblasted with Corundum white grains, resulting in a surface roughness of Ra = 5–7 µm and Rz = 62–65 µm with the average roughness over the sampling length L of the contour z(x) and the mean peak-to-valley height over an assessment length consisting of various sampling sections with the maximum peak to valley height Rt,i within each section; see [43] for details. The surface roughness was determined by a non-contacting 3D profilometer Hyperion Compact from OPM. The effective area of the electrodes exposed to the electric field was about 240 and 6450 mm2, respectively. This effective field exposed area was determined from the location of the breakdown marks after test, as can be, e.g., judged from the photographs in Figure 3 for the plug-type contact. For the plug-type contact, the field enhancement factor was calculated to be 1.42.
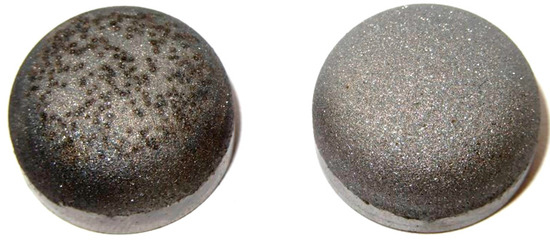
Figure 3.
Plug-type contact with diameter 19 and 10 mm length in new (right) and worn condition after test (left). The surface has a biradial shape with a radius of 5 mm at the side and 20 mm at the tip, respectively.
3. Evaluation Procedures
3.1. Breakdown Probability Distributions
From the recorded breakdown fields, the empirical cumulative breakdown probability distributions were determined by the Turnbull algorithm [44] and fitted with three-parameter Weibull distributions [41] as proposed in [6,42]. The zero crossing E0 of the Weibull distribution was set to the streamer inception field, calculated for each protrusion length as will be described below in Section 3.2.2. From the distributions, the 50% BD probability field E50 and the standard deviation σ was determined. Note that these values refer to the background field, i.e., E50 = U50/D with 50% breakdown probability voltage U50 and the gap length D. Generally, for the identical protrusions of m, the enlargement law based on the Weibull distributions generally follows from [6]
With the shape parameter γ and the 63% breakdown probability field E63. In the present case for γ and E63 the values from the fits to the empirical cumulative breakdown probability distributions were used. An example of the enlargement scaling is shown in Figure 4. With increasing number of protrusions, the breakdown probability distribution becomes steeper and shifts towards E0. Note, that such scaling is purely a statistical process and does not necessarily describe the scaling of any physical processes. This can be interpreted as follows: if the breakdown probability distribution follows the scaling from (1), it can be expected that the underlying processes are of statistical nature, e.g., by the availability of a first electron to start an avalanche. For electrodes with surface roughness, m is the ratio of the surface areas.
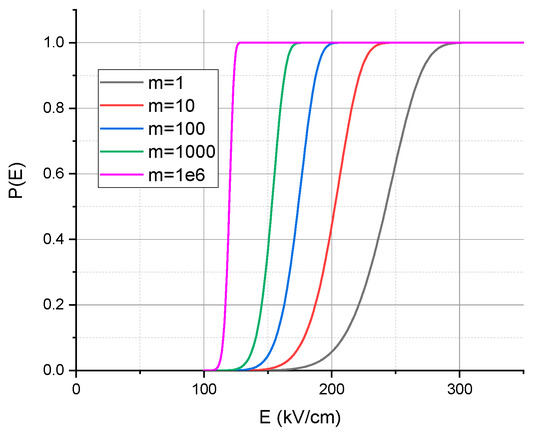
Figure 4.
Example of Weibull distributions for increasing number of protrusions m. In this example, E63 = 250 kV/cm, E0 = 100 kV/cm, γ = 7 was chosen arbitrarily.
3.2. Discharge Inception and Breakdown Models
In the following subsections, models for the description of first electron, streamer inception and leader propagation will be described. The models are the same as presented in [38] for SF6 and will only be briefly summarized here with the specific adaptions for CO2. For these models, the decay of the electric field at the protrusion and at the electrode surface is needed. The field enhancement in the axis of symmetry in front of a protrusion was calculated by a multipole approximation
with the protrusion length and radius l and r, respectively, as used in [36]. Eb is the undisturbed background field. It was checked by 3D electric field calculations with COMSOL for some cases that this approximation was sufficiently precise for the present purpose. With r = 100 µm as assumed protrusion radius, average deviations in the field decay were within 10%. The formula is only correct until l = r, i.e., l = 100 µm. Therefore, predictions will only be shown for 100 μm length and higher. For rough surfaces l/r = 1 with l = 20 µm as a typical peak height of roughness structures was assumed. This is similar to the approach of [14]. The chosen length is deduced from the measured Rz by assuming l = Rz/3. Note that Rz describes the average difference between highest peaks and lowest valleys of the surface.
3.2.1. First Electron
The electric field needed for a start electron at positive polarity in SF6 can be estimated from the volume where the electric field is above the critical field and where an electron can be detached from a negative ion in the available time of voltage application, i.e., in the present case within 10 μs—see [38] for details of the model. All parameters for SF6 were taken from [34].
At negative polarity, a start electron is assumed to be delivered from the electrode surface. For SF6, this could be described reasonably well by using the Fowler–Nordheim (FN) equation in [34], which gives the electron production rate emitted from a surface area at given electric field. The statistical time lag at negative polarity is then
where Φ ≈ 4.5 eV is the work function for steel, e the elementary charge, a field enhancement factor at to the protrusion tip (see also (2)) and due to micro-surface roughness and Aeff the effective electron emitting area. For SF6 values for and were taken from the fits in [34] with and m2. From this, the necessary electric field for a start electron within the available time can be deduced.
For CO2, the same approach and models as for SF6 were used but with CO2 specific adaptions and empirical approximations for the relevant parameters. For the statistical time lags, the field dependence of the electron detachment rate, the equilibrium negative ion concentration and the parameters in the FN equation were adapted to experimental data from [37]. At positive polarity, best agreement, within a large scatter, was achieved by empirically using an equilibrium concentration of 104 ions/m3 at 0.1 MPa in the pressure-dependent ion concentration, as given in [38], and a field dependence of the electron detachment rate coefficient of
with the critical electric field of CO2 at pressure p, with [37]. To our knowledge, no experimental data are available to verify this scaling of the electron detachment rate. At negative polarity, the field enhancement parameter in (3) was set to and the effective area needed to be set to Aeff = 10−24 m2 to achieve best agreement with the experimental data. Such small value for Aeff is probably not realistic, but one has to consider the simplicity of the FN equation. The approximations have to be seen, therefore, just as physically motivated fits to the experimental data which are valid in the given parameter range of protrusions up to a 4.5 mm length. Examples for statistical time lags for negative and positive polarity with the data from [37] are shown in Figure 5. For surface roughness, values from the rod plane experiment in [37] are used. The field enhancement factor at the surface of the rod (=Esurface/(1/D)) of the rod in these experiments was about 17. The background field in the plots is the undisturbed electric field U/D without field enhancement by a protrusion or by the rod.
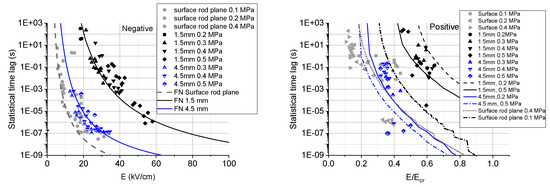
Figure 5.
Statistical time lags in CO2 at negative (left) and positive (right) polarity vs. background electric field for technical surface roughness and protrusions with 1.5 and 4.5 mm lengths. The curves are the model predictions and the symbols result from measurements given in [37]. For the technical surface roughness estimates, a 20-μm hemispherical protrusion on the surface was assumed [36]. Note that, for positive polarity, the electric field is normalized to the critical field Ecr, which yields a less scattered representation for the different pressures used.
3.2.2. Streamer Inception
Streamer inception fields were calculated using the semi-empirical approach in [38]
With the ionization integral parameter K = 10.5 and 13 for SF6 [45] and CO2 [37], respectively. The effective ionization coefficient was taken from [38] for SF6 and [37] for CO2. The integration is done along the axis of symmetry starting from the protrusion tip at z = 0 where the electric field is above the critical field, up to the distance z = lcr, where the field has dropped to the critical field.
3.2.3. Streamer Crossing and Spark Transition
Streamer crossing followed by spark transition is only relevant for CO2, since in SF6 this occurs at the critical field, which is much higher than leader propagation fields [38]. In [37], it was shown that streamer crossing for long duration voltage application times of several 100 μs is approximately sufficient for breakdown in the pressure range investigated here. In case of short-duration voltage application time, a higher field than that necessary for streamer crossing is needed to allow for the spark transition within the short available time of 10 µs, since the heating processes in the streamer channel need a sufficient electric field and time. This field increase was estimated from [46] to roughly 35% compared to the streamer crossing field, which is based on the breakdown voltage ratio for short and long duration waveforms.
3.2.4. Leader Propagation and Breakdown
As shown in [35,38], leader propagation through the gap can be associated with breakdown. Leader inception and propagation was calculated using the previous model from [35] for SF6. In this model, the streamer corona charge at the protrusion tip or a propagating leader is calculated and fed into the streamer or leader channel. This leads to stepped heating followed by stepwise leader propagation through the gap. Crossing 90% of the gap distance was defined as sufficient for breakdown. For CO2, the same model but with adapted thermodynamic properties of mass density, enthalpy, velocity of sound and effective ionization coefficients [47] from our own, in-house-developed solver were used.
4. Results
4.1. Protrusions with SF6
The results for the single protrusions in SF6 are shown in Figure 6 for positive and negative polarity. The E50 background fields are normalized to the critical field, which eases the interpretations and comparison between different gases. In agreement with [38], the breakdown values for positive polarity are slightly lower than those at negative polarity. Only for protrusion length of 200 µm or less the differences between the polarities are within the scatter. At such small lengths, many breakdowns also happened away from the protrusions, which were, however, not considered for the determination of E50, as mentioned above. The decrease of the normalized E50 breakdown field with increasing protrusion length is reasonably described by the prediction for leader breakdown, which occurs significantly below the critical field. Streamer inception and the first electron criterion are fulfilled at lower fields, such that leader breakdown is expected to be the decisive criterion. Only for very small lengths below 250 µm and positive polarity, the first electron criterion might require slightly higher fields than the leader breakdown. This is, however, within the uncertainties of the predictions. We can also observe a higher scatter for positive polarity compared to negative polarity.
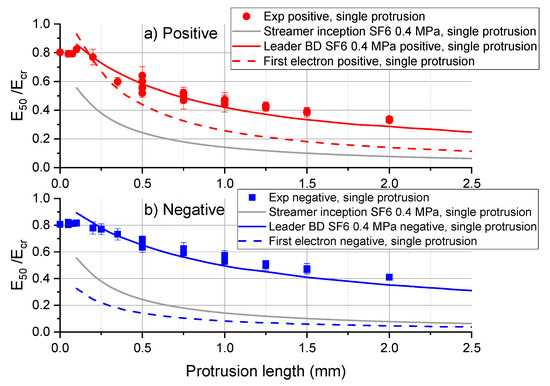
Figure 6.
Normalized breakdown fields E50/Ecr vs. protrusion length L for SF6 and single protrusion at 0.4 MPa at (a) positive and (b) negative polarities.
Using 20 protrusions—see full symbols in Figure 7—lowers the normalized E50 breakdown fields significantly. For comparison, the experimental results and predictions for single protrusions are also shown. The difference between positive and negative polarity in the figure seems more pronounced than for single protrusions. The experimental breakdown fields are now lower than the predictions for leader breakdown for a single protrusion. The enlargement law predictions from (1) are shown by the black dash-dotted curves and agree for both polarities with the experimental results. Thus, the lowering of the experimental breakdown fields for 20 protrusions is well described by the enlargement law based on the breakdown probability distributions of single protrusions.
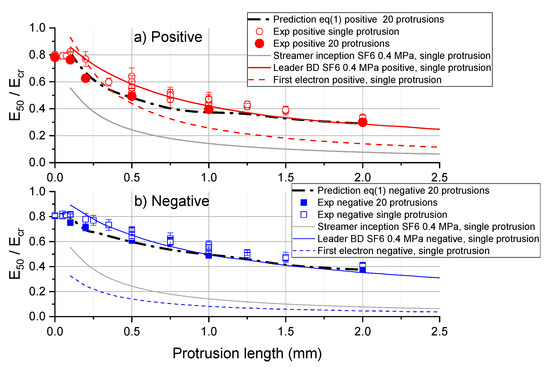
Figure 7.
Normalized breakdown fields E50/Ecr vs. protrusion length L for SF6 and 20 protrusions. Not all protrusion lengths could be measured when using multiple protrusions at (a) positive and (b) negative polarities.
For 100 protrusions this is different at positive polarity—see Figure 8a. There is no further lowering of the breakdown fields when using 100 instead of 20 protrusions and the prediction of the enlargement law (1) is significantly lower than the measurement. There seems to be a lower limit which is not further exceeded when using a larger number of protrusions. This is not the case for negative polarity—see Figure 8b—where we see a good agreement of the enlargement law predictions with the experimental results for 100 protrusions.
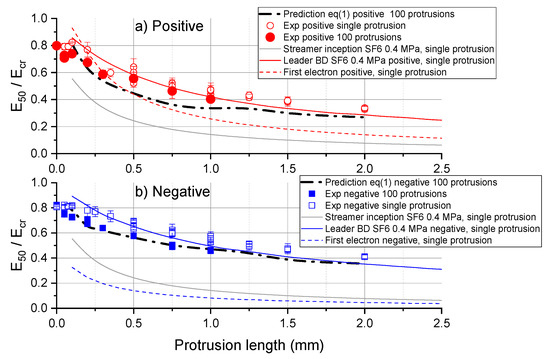
Figure 8.
Normalized breakdown fields E50/Ecr vs. protrusion length L for SF6 and 100 protrusions. Not all protrusion lengths could be measured when using multiple protrusions at (a) positive and (b) negative polarities.
Typical partial discharge images, which were taken at breakdown events, are shown in Figure 9. It can be seen that many discharges happened in parallel, i.e., simultaneously within 10 μs. These discharges could be observed in case of breakdown since the discharge channels are illuminated by the strong light emission from the breakdown spark channel occurring elsewhere in the gap. These images are, therefore, similar to a Shadowgraphs or Schlieren images [48]. The discharge channels have the typical signature of leader channels [35], which confirms the interpretation from leader breakdown predictions, i.e., the breakdown is determined by leader propagation. The negative leader channels (Figure 9c) are thicker and less structured than positive leader channels (Figure 9b); this observation is in agreement with the expectation from [49].
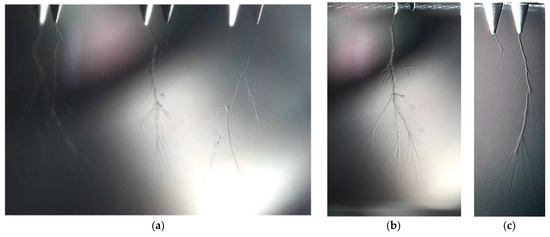
Figure 9.
Images of partial discharges and breakdown in SF6 at 0.4 MPa for (a) 2 mm length at positive polarity at 130 kV/cm, (b) 0.5 mm length at positive polarity at 188 kV/cm and (c) 1 mm length at negative polarity at 187 kV/cm. Note the different length scales of the images, which can be judged by the protrusion lengths.
4.2. Protrusions with CO2
Results for single protrusions in CO2 are shown in Figure 10. The figure shows the experimental normalized E50 breakdown values and predictions for first electron, streamer inception and leader breakdown and the background fields for streamer crossing and spark transition of negative streamers. The complete range where streamer crossing and spark transition is expected at negative polarity is indicated by the cyan colored area in the figure. For positive streamers we expect streamer crossing only at the critical field [37], which is, therefore, probably not relevant in the present case, since this needs fields higher than the leader breakdown criterion.
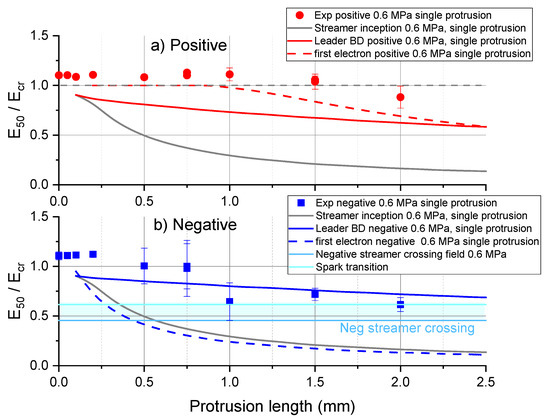
Figure 10.
Normalized breakdown fields E50/Ecr vs. protrusion length L for CO2 and single protrusion at 0.6 MPa at (a) positive and (b) negative polarities.
For protrusion lengths below 1.5 mm with positive polarity, the breakdown happens at or slightly above the critical background field—see Figure 10a. The leader BD predictions do not explain this. Probably this can be explained by the first electron criterion (red dashed curve). At or above the critical field, avalanches can start everywhere in the gap, which is in agreement with the experiment. Many breakdowns did not occur at the protrusion but in other locations of the gap in this case. There was also a larger scatter in the breakdown fields, which is reflected in the error bars of the experimental breakdown values, especially at negative polarity.
At negative polarity, experimental E50 values are close to the leader breakdown predictions for protrusions larger than 1 mm—see Figure 10b. An additional possibility for breakdown at negative polarity might be streamer crossing and transition to spark. Therefore, at negative polarity both mechanisms might be decisive for breakdown. From the partial discharge images—see Figure 11—this could not be decided unambiguously. For smaller protrusions, breakdown occurs at the critical field. As for positive polarity, breakdowns often occurred at the plate electrodes and not at the protrusion for smaller protrusion lengths.
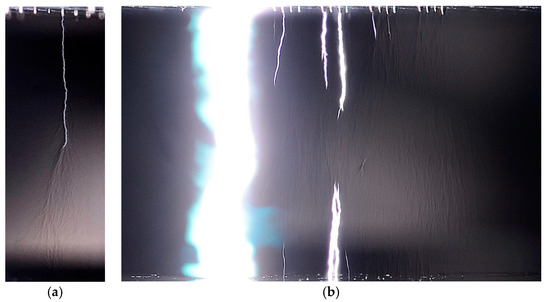
Figure 11.
Images of partial discharges and breakdown in CO2 at 0.6 MPa for (a) positive polarity at 115 kV/cm with 100-μm protrusions and (b) negative polarity at 139 kV/cm with 200-μm protrusions.
Using 20 protrusions, see Figure 12, the measured breakdown fields decrease at both polarities compared to the results from the single protrusion experiments. For positive polarity, this is in agreement with the prediction from the enlargement law (1)—see Figure 12a. Note that predictions for the enlargement law were not possible for small protrusion lengths due to the limited amount of data and large uncertainties of the breakdown probability distributions. The measured breakdown values are for the positive polarity at the first electron prediction for single protrusions but still higher than the leader breakdown predictions. For negative polarity, a lowering of E50 values is observed mainly below 1 mm protrusion length—see Figure 12b. The measured breakdown fields below 0.5-mm protrusion length coincide with the first electron and streamer inception prediction. Interestingly, for protrusion lengths of 1 mm and more, no significant decrease of the E50 values for 20 protrusions compared to single protrusions is observed. The breakdown fields are at the expected spark transition level, which is assumed to be independent of protrusion length.
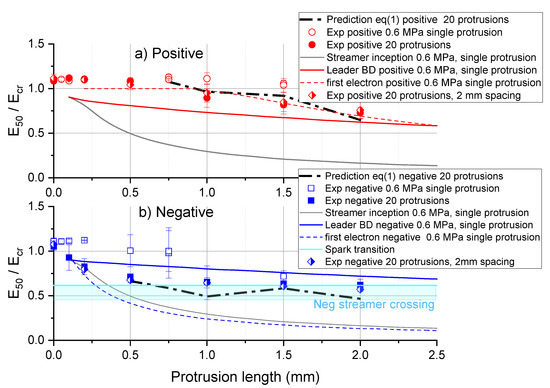
Figure 12.
Normalized breakdown fields E50/Ecr vs. protrusion length L for CO2 and 20 protrusions at (a) positive and (b) negative polarities.
As mentioned in Section 2.1, also a smaller spacing of 2 mm between the protrusions was tested with 20 protrusions for CO2. These results were not significantly different from the usual spacing of 4 mm—see Figure 12. Only a small reduction of less than 6% in field maximum was expected from the comparison of electric field calculations when using the smaller spacing (not shown in Figure 12), which is similar to the experimental uncertainties.
For 100 protrusions and positive polarity—see Figure 13a—the measured breakdown fields drop to the leader breakdown predictions for protrusions of 0.5 mm length and more. This is not predicted by the enlargement law, which results only in a moderate reduction. For smaller protrusions, the breakdown fields are still significantly higher than the leader breakdown prediction, probably due to the lack of a first electron. For larger protrusions of 1 mm and more, the positive breakdown fields are now similar or even lower than the negative ones, as would be expected from the leader breakdown criterion.
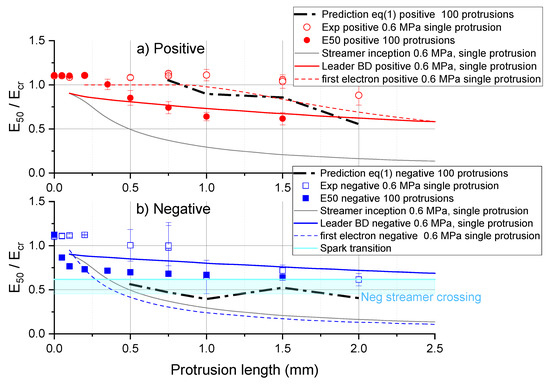
Figure 13.
Normalized breakdown fields E50/Ecr vs. protrusion length L for CO2 and 100 protrusions at (a) positive and (b) negative polarities. Not all protrusion lengths could be measured when using multiple protrusions.
For 100 protrusions and negative polarity—see Figure 13b—the breakdown values drop significantly only for small protrusions below 0.5 mm lengths, compared to the previous case of 20 protrusions. For 250 μm and below, they are probably determined by streamer inception. Above 250 µm protrusion length, there is only a small drop of breakdown fields with increasing protrusion length. It seems that a saturation is reached, which is probably not due to the first electron criterion, but due to streamer crossing followed by spark transition. The enlargement law predictions are now significantly lower than the measurements.
Images of partial discharges and breakdown in CO2 are shown in Figure 11. Local channel illuminations indicated local channel heating could be clearly observed, which might be during leader propagation but also for a streamer to spark transition. Similarly to SF6, discharges occurred simultaneously in the time window of 10 μs. Weak density variations in the non-luminous regions indicate some channel heating also in these regions. Interestingly, breakdowns from the bottom plate electrode could also be observed.
4.3. Electrodes with Surface Roughness
The results from the electrodes with surface roughness are shown in Figure 14 and Figure 15 for SF6 and CO2, respectively. Note that for the E50 evaluation the electric field at the surface of the electrodes was used, since the fields are weakly non-uniform in the case of the small surface. Again, the E50 breakdown field is normalized to the critical field. For comparison calculations for first electron, streamer inception and breakdown are shown for a single protrusion in the figures. Increasing the area in SF6 at positive polarity led to a significant lowering of the E50 breakdown fields at positive, but negligible decrease at negative polarity—see Figure 14a. This can be understood by the streamer inception and first electron criterion. At positive polarity, the experimental breakdown field drops roughly to the predicted streamer inception field for large areas. This can probably be explained by a sufficiently high number of sites for discharge inception for large electrode areas, i.e., there is a high likelihood for a first electron at a small surface protrusion. Then, the streamer inception becomes a sufficient breakdown criterion. For small areas a first electron is probably lacking, and the breakdown field becomes even higher than the critical field. In the predictions for a single protrusion a first electron is only available at the critical field, i.e., probably these predictions are still too optimistic. The prediction from the enlargement law (solid arrow) for increasing area reproduces qualitatively the decrease of breakdown field with increasing surface area. However, it predicts for large areas the breakdown at the critical field and not at the streamer inception field. Using (1) to predict the breakdown field scaling from large to small area would quite underestimate the measured breakdown field (dashed arrow). Thus, at positive polarity, the enlargement law predictions do not agree well with the experiments.
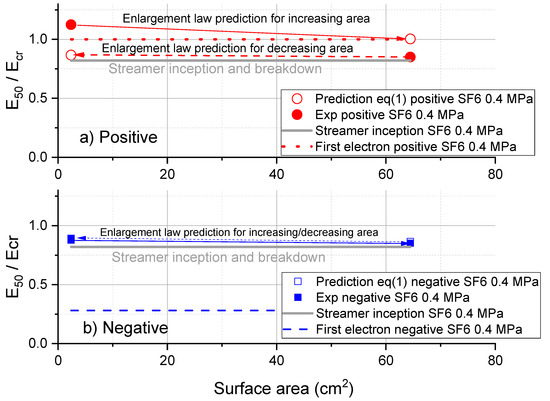
Figure 14.
Normalized breakdown fields E50/Ecr vs. effective surface area in SF6 at 0.4 MPa at (a) positive and (b) negative polarities. Calculations for first electron, streamer inception and breakdown at a single hemispherical protrusion of 20 μm height are shown for comparison.
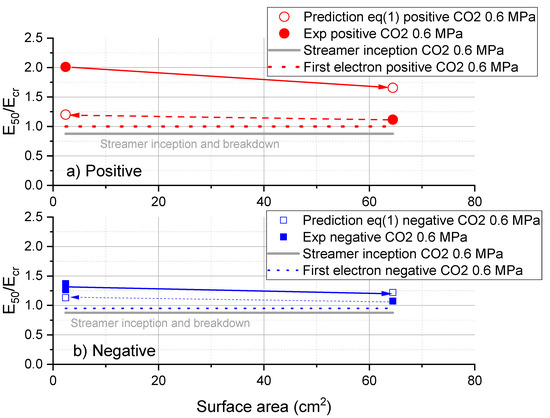
Figure 15.
Normalized breakdown fields E50/Ecr vs. effective surface area in CO2 at 0.6 MPa at (a) positive and (b) negative polarities. Calculations for first electron, streamer inception and breakdown at a single hemispherical protrusion of 20 μm height are shown for comparison.
At negative polarity, this is different—see Figure 14b. Here, the predictions in both directions, i.e., from small to large electrode, or vice versa, give the correct breakdown fields. Note that the experimental breakdown field is in this case again approximately at the predicted streamer inception field. This is plausible, since at negative polarity there is no lack of a first electron (see dashed line in Figure 14b) and breakdown occurs for small and large electrode roughly at similar fields, which is at streamer inception. Note that streamer inception is independent of polarity, i.e., for large areas, the breakdown fields are similar for both polarities.
In CO2, the observations are similar—see Figure 15. At positive polarity (Figure 15a), experimental breakdown fields drop for large electrodes to close to the critical field, which is slightly higher than the predicted streamer inception and breakdown field. This discrepancy is probably still within the accuracy of the predictions. Only for small area and positive polarity there is probably again a lack of a first electron which leads to an increase of E50 in the experiments. Note that this lack of first electron is not predicted by the model. Due to the strongly non-linear field dependence of (4), at the critical field, a first electron is always predicted. Probably the model is not sufficiently precise for CO2 and small protrusions. At negative polarity in CO2 (Figure 15b), there is a slightly more pronounced area effect than for SF6. Again, the breakdown happens for large areas close to the critical field, which is only slightly above the first electron criterion prediction—see dashed horizontal line in Figure 15b. Thus, there is possibly also a lack of first electron for small areas at negative polarity, which is, however, much less pronounced than at positive polarity. The discrepancies can be probably explained by the simplicity of the model for the first electron.
Images of partial discharges and breakdown are shown in Figure 16 and Figure 17 for both gases used. For CO2, there are again discharges from the plate electrode, similarly to the protrusion results—see Figure 16. Arrested discharges could also be observed at breakdown for SF6—see Figure 17. This shows that there is a competition between various discharge channels.
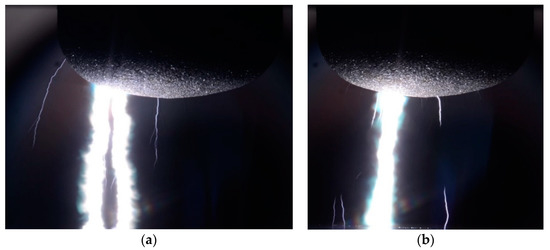
Figure 16.
Images of partial discharges and breakdown in CO2 at the small surface. (a) Positive polarity at a surface field of 322 kV/cm and (b) Negative polarity at 235 kV/cm surface field.
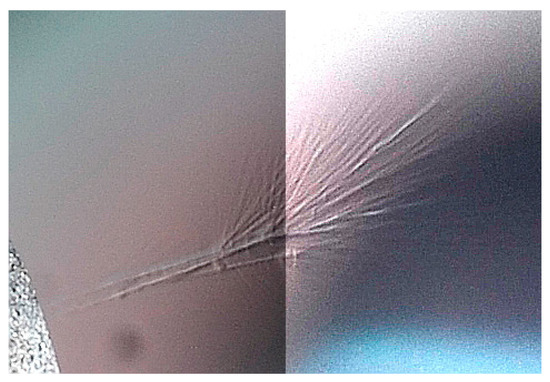
Figure 17.
Images of partial discharges in SF6 at 0.4 MPa, negative polarity at a surface field of 375 kV/cm. The picture is edited with different brightness on the two halves to better show the structures of the partial discharge.
5. Discussion
The results at multiple protrusions have shown that the experimental breakdown E50 values can be interpreted by the predictions of the various physical processes as first electron, streamer inception and leader propagation for a single protrusion. In SF6, breakdown will only occur if all criteria are fulfilled. This is also valid in CO2. However, error bars were much larger for the CO2 experiments, resulting in larger uncertainties of the interpretations. In CO2, streamer crossing and spark transition is a possible mechanism for breakdown at negative polarity, additionally to the leader breakdown, which is dominant at positive polarity. Similarly, this was found in [37]. In CO2, breakdowns at protrusions occur much closer to the critical field, which is also reflected in the predictions. This is likely due to the lower slope of the effective ionization coefficient in CO2, which is only a weakly electron attaching gas and, therefore, needs relatively higher fields for streamer and leader inception compared to the critical field than in SF6 [50]. This leads to lower sensitivity to surface roughness or protrusions in case of CO2 compared to SF6.
Increasing the number of protrusions and comparing the resulting E50 breakdown fields with predictions from the enlargement law (1) leads to reasonable agreement for SF6 at negative polarity. This indicates that the statistical processes for a single protrusion, resulting in the measured breakdown probability distribution, can be scaled according to the enlargement law without reaching other, e.g., physical limitations at the tested number of protrusions. This can be possibly understood by the very low first electron and streamer inception fields, i.e., these criteria are not limiting the scaling of the breakdown fields and the statistical scatter is probably mainly due to leader transition and propagation. This is different at positive polarity in SF6. Whereas, the reduction of breakdown field with 20 protrusions is still well described by the enlargement law, we see a significant discrepancy using 100 protrusions. This is possibly produced by the availability of a first electron which needs a certain minimum field and can, therefore, not be described by statistical phenomena alone—see [34,38]. Thus, if the field is below a certain threshold using a large number of protrusions cannot compensate for the necessary field for creating the first electron in the critical volume. Note that the first electron depends on the size of the critical volume, which increases with the number of protrusions, but also strongly non-linearly on the applied electric field within the critical volume—see (4). Additionally, in CO2, limits for the reduction of breakdown field with increasing number of protrusions can be seen. At negative polarity, such a limitation is the streamer inception criterion for small protrusions of 250 µm and smaller. For larger protrusions there is a lower limit which could be explained by streamer crossing and spark transition, but possibly also by the leader mechanism. This could not be determined unambiguously so far and would need more detailed optical diagnostic investigations. At positive polarity in CO2, a reasonable agreement with the enlargement law is seen for 20 protrusions, which is similar to SF6. For 100 protrusions and positive polarity the experimental breakdown fields drop to the predicted leader breakdown field. This drop is underpredicted by the enlargement law, which indicates that the breakdown probability distributions for single protrusions does not include all the relevant phenomena with sufficient precision in this case.
For rough surfaces, we investigated the case of very small protrusions in the range of only a few 10 µm in height. We used here the approach of Pedersen [14] to approximate surface roughness by hemispherical protrusions. Thus, this case has similarities to the protrusion array, only that the number of protrusions is probably much higher than in the case of the protrusion array. A detailed surface structural analysis was not done in the present case but unpublished investigations on a similar surface has shown that we can expect one protrusion of 20 μm height per mm2 as an order of magnitude. For the small surface of 240 mm2 we can expect, therefore, about 240 protrusions very roughly. For the larger area this was increased by more than a factor 20 to investigate the enlargement law in a more realistic situation. Thus, for the larger surface we can expect as an order of magnitude about 6450 protrusions of a 20-µm size. For negative polarity and SF6, the area scaling due to this increase is satisfactorily described. This indicates that the probability distributions at negative polarity in SF6 describe well the statistical phenomena. In this case, we do not expect a lack of a first electron and the statistical processes of the breakdown like streamer inception and leader transitions are probably decisive for the breakdown statistical scatter. In CO2 and negative polarity, the reduction of breakdown field with increasing area is less well described by the enlargement law. Here, the statistical scatter of the first electron is also probably important. This is similar at positive polarity, where the breakdown fields in the experiments drop roughly to the streamer inception fields for large surfaces and the enlargement laws underpredict this. Possibly, statistical phenomena of the first electron do not follow a simple enlargement law scaling. This needs further investigations.
The investigation showed that enlargement laws cannot be applied without caution. The physical processes which might limit the scaling of statistical distributions, e.g., first electron or streamer inception, must be taken into account. Additionally, the enlargement law is sensitive to the precise shape of breakdown probability distributions, which might lead to insufficient accuracy if the distributions are not determined with sufficient precision. Finally, underlying physical processes might not follow a simple enlargement law scaling, e.g., due to strongly non-linear effects like for the first electron criterion. This is especially the case if various physical processes are involved.
In the present investigation, the lower limit of the Weibull distribution E0 was set to the streamer inception values, which can be regarded as a minimum requirement for breakdown. As can be seen from the figures, in none of the cases this was reached with multiple protrusions. Only for rough surfaces and large area it was approached, i.e., in this case it influenced significantly the enlargement law. The satisfactory agreement for this case might indicate that this assumption for E0 was justified.
The breakdown images have revealed some further information showing especially many discharges occurring in parallel during breakdown events on the short time scale of only a few microseconds. These discharges could bridge the gap or remain arrested in the gap. This shows that a first electron was not lacking in such cases, in agreement with the model predictions. Thus, at breakdown electrons were not only available at one protrusion but also at other sites. Interestingly, in CO2 also discharges from the bottom plate could be sometimes observed at negative polarity, similar to a return stroke in lightning. This was not observed in SF6. Possibly, this is linked to a different breakdown mechanism, which might be of streamer to spark transition type in this case.
6. Conclusions
Breakdown experiments on multiple protrusions and on artificially roughed surfaces were done in uniform and weakly uniform background fields with SF6 and CO2 at 0.4 and 0.6 MPa, respectively. The voltage waveform was a stepped DC pulse with time to breakdown within 10 μs, which is comparable to that of standard lightning impulse (LI). With the multiple protrusion array, the number of protrusions and the lengths of the protrusions was varied in the ranges of 1–100 and 0.05–2 mm, respectively. For the roughened surfaces, a mean peak-to-valley roughness (Rz) of 62 … 65 μm was realized, and two different surface areas were tested. From the breakdown experiments, Weibull breakdown probability distributions were deduced and 50% breakdown probability fields and the standard deviation σ of the distributions were determined. Enlargement law scaling predictions according to (1) were done to predict the effect of changing the number of protrusions or surface area. These predictions were compared to the experiments. Additionally, calculations by physical models, describing first electron, streamer inception and breakdown by leader propagation or streamer-to-spark transition at single protrusions were done for interpretation of the experimental results. The interpretations were supported by optical observation of the discharges.
The following main observations were obtained: In SF6, breakdown fields are well below the critical field, even for protrusions below 1 mm length, whereas for CO2 breakdown occurs closer to the critical field. The breakdown fields can be interpreted and roughly described by the physical models, taking into account the uncertainties of the experiments and of the models. In SF6 the leader propagation criterion is decisive for breakdown at both polarities for single protrusions. Increasing the number of the protrusions to 20 lowers the breakdown field for both gases in agreement with the predictions from the enlargement laws, compared to the single protrusion. No significant effect on the protrusions spacing was seen in CO2 with 20 protrusions. Discrepancies with the enlargement law scaling were observed for both gases in some cases when increasing the number of protrusions to 100. The results show that enlargement laws cannot be generally applied without considering the various physical processes which influence breakdown, i.e., the availability of a first electron, streamer and leader inception and propagation and spark transition. The decisive breakdown criteria depend on the gas, the protrusion lengths and polarity of the applied voltage, which leads to different minimum limiting fields which cannot be exceeded by an enlargement law. Additionally, the various physical processes will not scale in the same way when using an enlargement law. All this limits the accuracy of an enlargement law scaling. This is confirmed by the results from the rough surfaces. At positive polarity the breakdown fields dropped for SF6 and CO2 approximately to the streamer inception field, when increasing the surface from 240 to 6450 mm2, i.e., there is a physical limit for breakdown which is reached for sufficiently large surfaces. This decrease was underpredicted by the enlargement law. At negative polarity and SF6, only a very small enlargement effect is seen in the experiments, in agreement with the predictions. In CO2 and negative polarity, there is a more pronounced effect of the surface area, which is still much smaller than for positive polarity, however. Again, this decrease is underpredicted by the enlargement law. The effect of the protrusion spacing was investigated only in CO2 with 20 protrusions. No significant effect within the experimental scatter was seen.
Author Contributions
Conceptualization, M.S. and O.C.F.; methodology, M.S., D.O. and O.C.F.; software, D.O. and O.C.F.; validation, M.S., F.M. and K.N.; formal analysis, O.C.F.; investigation, O.C.F.; resources, M.S. and D.O.; data curation, O.C.F.; writing—original draft preparation, M.S. and O.C.F.; writing—review and editing, M.S., O.C.F., K.N. and F.M.; visualization, O.C.F. and M.S.; supervision, M.S., F.M. and K.N.; project administration, O.C.F. All authors have read and agreed to the published version of the manuscript.
Funding
This research received no external funding.
Acknowledgments
The authors would like to thank Filip Halak for assisting with experimental work and Anders Ulfsnes for performing field calculations in COMSOL during their internships at Hitachi ABB Power Grids Research, Switzerland.
Conflicts of Interest
The authors declare no conflict of interest.
References
- Ryan, H.M.; Jones, G.R. SF6 Switchgear; Peter Pelegrinus Ltd.: London, UK, 1989. [Google Scholar]
- Arora, R.; Mosch, W. High Voltage and Electrical Insulation Engineering; Wiley-IEEE Press: Piscataway, NJ, USA, 2011; ISBN 978-0-470-60961-3. [Google Scholar]
- IEC 62271-1 Ed. 1.0 2007-10 International Standard: High-Voltage Switchgear and Controlgear; Part 1: Common Specifications; International Electrotechnical Commission: Geneva, Switzerland, 2007.
- IEEE C37.06-2009.09.11: AC High-Voltage Circuit Breakers Rated on a Symmetrical Current Basis-Preferred Ratings and Related Required Capabilities for Voltages above 1000 V; IEEE: New York, NY, USA, 2009.
- Mosch, W.; Hauschild, W. Hochspannungsisolierungen Mit Schwefelhexafluorid; VEB Verlag Technik: Berlin, Germany, 1979. [Google Scholar]
- Kuechler, A. High Voltage Engineering: Fundamentals-Technology-Applications; Springer Vieweg: Heidelberg, Germany, 2017; ISBN 978-3-642-11992-7. [Google Scholar] [CrossRef]
- United Nations Framework Convention on Climate Change. 2014. Available online: https://unfccc.int/ghg_data/items/3825.php (accessed on 4 April 2018).
- Seeger, M.; Smeets, R.; Yan, J.; Ito, H.; Claessens, M.; Dullni, E.; Franck, C.M.; Gentils, F.; Hartmann, W.; Kieffel, Y.; et al. Recent development and interrupting performance with SF6 alternative gases. Electra 2017, 291, 26–29. [Google Scholar]
- Tian, S.; Zhang, X.; Cressault, Y.; Hu, J.; Wang, B.; Xiao, S.; Li, Y.; Kabbaj, N. Research status of replacement gases for in power industry. AIP Adv. 2020, 10, 050702. [Google Scholar] [CrossRef]
- Li, X.; Zhao, H.; Murphy, A.B. SF6-alternative gases for application in gas-insulated switchgear. J. Phys. D Appl. Phys. 2018, 51, 153001. [Google Scholar] [CrossRef]
- Seeger, M. Perspectives on research on high voltage gas circuit breakers. Plasma Chem. Plasma Process. 2015, 35, 527–541. [Google Scholar] [CrossRef]
- Rabie, M.; Franck, C.M. Assessment of Eco-friendly Gases for Electrical Insulation to Replace the Most Potent Industrial Greenhouse Gas SF6. Environ. Sci. Technol. 2018, 52, 369–380. [Google Scholar] [CrossRef]
- Nitta, T.; Yamada, N.; Fujiwara, Y. Area effect of electrical breakdown in compressed SF6. IEEE Trans. Power Appar. Syst. 1974, 2, 623–629. [Google Scholar] [CrossRef]
- Pedersen, A. Limitations of breakdown voltages in SF6 caused by electrode surface roughness. In Proceedings of the Conference on Electrical Insulation & Dielectric Phenomena-Annual Report 1974, Downingtown, PA, USA, 21–23 October 1974; IEEE: New York, NY, USA, 1974; pp. 457–464. [Google Scholar]
- Pedersen, A.; Karlsson, P.W.; Bregnsbo, E.; Nielsen, T.M. Anomalous breakdown in uniform field gaps in SF6. IEEE Trans. Power Appar. Syst. 1974, 6, 1820–1826. [Google Scholar] [CrossRef]
- Berger, S. Onset or breakdown voltage reduction by electrode surface roughness in air and SF6. IEEE Trans. Power Appar. Syst. 1976, 95, 1073–1079. [Google Scholar] [CrossRef]
- McAllister, I.W. A multiple protrusion model for surface roughness effects in compressed SF6. Elektrotechnische Z. A 1978, 99, 283–284. [Google Scholar]
- Crichton, B.H.; Lee, D.I.; Tedford, D.J. Prebreakdown in Compressed SF6 and SF6/N2 Mixtures in Projection Perturbed Uniform Fields. In Proceedings of the 4th International Conference on Gas Discharges, Swansea, UK, 7–10 September 1976; pp. 199–202. [Google Scholar]
- Bortnik, I.; Ierusalimov, M.; Borin, V.; Varivodov, V.; Vertikov, V.; Ilenko, O.; Kuz’mina, Y. Evaluation of the requirements on the surface finish of electrodes in SF6 insulation. Electr. Technol. USSR 1985, 4, 43–49. [Google Scholar]
- Oiu, Y.; Li, R.; Kuffel, E.; Liu, M. Effect of electrode surface roughness on breakdown of SF6 gas insulation. In Proceedings of the Conference Record of the 1988 IEEE International Symposium on Electrical Insulation, Cambridge, MA, USA, 5–8 June 1988; IEEE: New York, NY, USA, 1988; pp. 93–96. [Google Scholar] [CrossRef]
- Li, R.; Qiu, Y. A new multi-ridge model for electrode surface roughness effect in SF6. In Proceedings of the Second International Conference on Properties and Applications of Dielectric Materials, Beijing, China, 12–16 September 1988; pp. 105–108. [Google Scholar] [CrossRef]
- El-Makkawy, S.M. Electrode surface roughness initiated breakdown in compressed SF6 gas. In Proceedings of the Electrical Insulation and Dielectric Phenomena, IEEE 1994 Annual Report, Arlington, TX, USA, 23–26 October 1994; pp. 948–953. [Google Scholar] [CrossRef]
- Lederle, C.; Kindersberger, J. The influence of surface roughness and coating on the impulse breakdown voltage in SF6. In Proceedings of the 17th Annual Meeting of the IEEE Lasers and Electro-Optics Society, LEOS 2004, Boulder, CO, USA, 20 October 2004; pp. 522–525. [Google Scholar] [CrossRef]
- Lederle, C.; Kindersberger, J. The influence of surface roughness and dielectric coating on ac and dc breakdown voltage in SF6. In Proceedings of the 14th International Symposium on High Voltage Engineering, Beijing, China, 25–29 August 2005; pp. 1–6. [Google Scholar]
- Shiiki, M.; Sato, M.; Hanai, M.; Suzuki, K. Dielectric performance of CO2 gas compared with N2 gas. In Gaseous Dielectrics IX; Christophorou, L.G., Olthoff, J.K., Eds.; Springer: Boston, MA, USA, 2001; pp. 365–370. [Google Scholar] [CrossRef]
- Uchii, T.; Hoshina, Y.; Mori, T.; Kawano, H.; Nakamoto, T.; Mizoguchi, H. Investigations on SF6-free gas circuit breaker adopting CO2 gas as an alternative arc-quenching and insulating medium. In Gaseous Dielectrics X; Christophorou, L.G., Olthoff, J.K., Vassiliou, P., Eds.; Springer: Boston, MA, USA, 2004; pp. 205–210. [Google Scholar] [CrossRef]
- Juhre, K.; Kynast, E. High pressure N2, N2/CO2 and CO2 gas insulation in comparison to SF6 in GIS applications. In Proceedings of the XIVth International Symposium on High Voltage Engineering, Beijing, China, 25–28 August 2005. [Google Scholar]
- Meijer, S.; Smit, J.J.; Girodet, A. Comparison of the breakdown strength of N2, CO2 and SF6 using the extended up-and-down method. In Proceedings of the 2006 IEEE 8th International Conference on Properties applications of Dielectric Materials, Bali, Indonesia, 26–30 June 2006; pp. 653–656. [Google Scholar] [CrossRef]
- Okabe, S.; Goshima, H.; Tanimura, A.; Tsuru, S.; Yaegashi, Y.; Fujie, E.; Okubo, H. Fundamental insulation characteristic of high-pressure CO2 gas under actual equipment conditions. IEEE Trans. Dielectr. Electr. Insul. 2007, 14, 83–90. [Google Scholar] [CrossRef]
- Hikita, M.; Ohtsuka, S.; Yokoyama, N.; Okabe, S.; Kaneko, S. Effect of electrode surface roughness and dielectric coating on breakdown characteristics of high pressure CO2 and N2 in a quasi-uniform electric field. IEEE Trans. Dielectr. Electr. Insul. 2008, 15, 243–250. [Google Scholar] [CrossRef]
- Ka, S.; Inami, K.; Hama, H.; Ueta, G.; Wada, J.; Okabe, S. Lightning impulse and ac breakdown characteristics of CO2 gas under quasi-uniform electric field using real-size gas-insulated switchgear model. In Proceedings of the 18th International Symposium on High Voltage Engineering, Seoul, Korea, 25 August 2013; pp. 1549–1553. [Google Scholar]
- Yoshida, T.; Ka, S.; Shimizu, Y.; Inami, K.; Hama, H.; Ueta, G.; Wada, J.; Okabe, S. Metallic particle motion and its sparkover property at AC voltages in N2, CO2, dry air and SF6. In Proceedings of the 9th International Workshop on High Voltage Engineering (IWHV 2014), Okinawa, Japan, 7–8 November 2014. [Google Scholar]
- Yoshida, T.; Shimizu, Y.; Inami, K.; Hama, H.; Ueta, G.; Wada, J.; Okabe, S. Partial discharge and breakdown properties in N2, CO2, dry air and SF6 initiated by metallic particles fixed on high voltage conductor and attached on spacer surface at ac voltages. In Proceedings of the 20th International Symposium on High Voltage Engineering, Buenos Aires, Argentina, 28 August–1 September 2017. [Google Scholar]
- Bujotzek, M.; Seeger, M. Parameter dependence of gaseous insulation in SF6. IEEE Trans. Dielectr. Electr. Insul. 2013, 20, 845–855. [Google Scholar] [CrossRef]
- Seeger, M.; Niemeyer, L.; Bujotzek, M. Leader propagation in uniform background fields in SF6. J. Phys. D Appl. Phys. 2009, 42, 185205. [Google Scholar] [CrossRef]
- Seeger, M.; Stoller, P.; Garyfallos, A. Breakdown fields in synthetic air, CO2, a CO2/O2 mixture, and CF4. IEEE Trans. Dielectr. Electr. Insul. 2017, 24, 1582–1591. [Google Scholar] [CrossRef]
- Seeger, M.; Avaheden, J.; Pancheshnyi, S.; Votteler, T. Streamer parameters and breakdown in CO2. J. Phys. D Appl. Phys. 2017, 50, 1–15. [Google Scholar] [CrossRef]
- Seeger, M.; Niemeyer, L.; Bujotzek, M. Partial discharges and breakdown at protrusions in uniform background fields in SF6. J. Phys. D Appl. Phys. 2008, 41, 185204. [Google Scholar] [CrossRef]
- Hauschild, W.; Mosch, W. Statistical Techniques for High-Voltage Engineering; Peter Peregrinus on Behalf of the Institution of Electrical Engineers: London, UK, 1992; Volume 13, ISBN 978-0863412059. [Google Scholar]
- Dunz, T.; Fruth, B.; Niemeyer, L.; Ullrich, L.; Diederich, K.; Hassig, M. Electrical field on rough electrode surfaces and its influence on the statistical properties of SF6 breakdown. In Proceedings of the 6th International Symposium of High Voltage Engineering, ISH, New Orleans, LA, USA, 28 August–1 September 1989. [Google Scholar]
- Weibull, W. A statistical distribution function of wide applicability. Trans. Am. Soc. Mech. Eng. 1951, 32, 293–297. [Google Scholar]
- Kiyan, T.; Ihara, T.; Kameda, S.; Furusato, T.; Hara, M.; Akiyama, H. Weibull Statistical Analysis of Pulsed Breakdown Voltages in High-Pressure Carbon Dioxide Including Supercritical Phase. IEEE Trans. Plasma Sci. 2011, 39, 1729–1735. [Google Scholar] [CrossRef]
- Whitehouse, D.J. Surfaces and Their Measurement; Kogan Page Science: London, UK, 2002; ISBN 978-1-903996-01-0. [Google Scholar] [CrossRef]
- Turnbull, B.W. Nonparametric estimation of survivorship function with doubly censored data. J. Am. Stat. Assoc. 1974, 69, 169–173. [Google Scholar] [CrossRef]
- Zaengl, W.S.; Petcharaks, K. Application of Streamer Breakdown Criterion for Inhomogeneous Fields in Dry Air and SF6. In Gaseous Dielectrics VII; Christophoru, L.G., James, D.R., Eds.; Springer: Bosten, MA, USA, 1994; pp. 153–159. [Google Scholar]
- Naidis, G.V. Simulation of streamer-to-spark transition in short non-uniform air gaps. J. Phys. D Appl. Phys. 1999, 32, 2649–2654. [Google Scholar] [CrossRef]
- Seeger, M.; Votteler, T.; Pancheshnyi, S.; Carstensen, J.; Garyfallos, A.; Schwinne, M. Breakdown in CO2/O2 and CO2/O2/C2F4 mixtures at elevated temperatures in the range 1000–4000 K. Plasma Phys. Technol. 2019, 6, 39–42. [Google Scholar] [CrossRef]
- Ono, R.; Oda, T. Visualization of Streamer Channels and Shock Waves Generated by Positive Pulsed Corona Discharge Using Laser Schlieren Method. J. Appl. Phys. 2004, 43, 321–327. [Google Scholar] [CrossRef]
- Bujotzek, M.; Seeger, M.; Schmidt, F.; Koch, M.; Franck, C. Experimental investigation of streamer radius and length in SF6. J. Phys. D Appl. Phys. 2015, 48, 245201. [Google Scholar] [CrossRef]
- Seeger, M. Electric breakdown in high voltage gas circuit breakers. In Proceedings of the 22nd International Conference on Gas Discharges and Their application, Novi Sad, Serbia, 7 September 2018. [Google Scholar]


© 2020 by the authors. Licensee MDPI, Basel, Switzerland. This article is an open access article distributed under the terms and conditions of the Creative Commons Attribution (CC BY) license (http://creativecommons.org/licenses/by/4.0/).