Abstract
Following the recent development trend in the struggle for cleaning the earth’s environment, solar is the one of most promising area that can partially be used as a replaceable energy from non-renewable fuel sources. As such, it plays a significant role in protecting the environment from global warming. As solar power does not emit harmful gases into the atmosphere, its production, distribution, setup, and operation are vital should the production remain constant. Even solar energy waste emissions are small; when compared to current energy sources, the amount of harmful gases is negligible. This paper presented an integrated approach for site of solar plants by using data envelopment analysis (DEA) and Fuzzy Analytical Network Process (FANP). Furthermore, these integrated methodologies, incorporated with the most relevant parameters of requirements for solar plants, are introduced. First, the paper considers an integrated hierarchical DEA and FANP model for the optimal geographical location of solar plants in Mekong Delta Region, Vietnam. Using the proposed model for implementation would allow the renewable energy policy makers to select and control the optimal location for allocating and constructing a solar energy power plant in Vietnam. This is the preferred strategy for location optimization problems associated with solar plant units in Vietnam and around the world.
1. Introduction
Energy has been a fundamental driver of global economies in order maintain development in almost any industry. It is compulsory that the sources of energy must be maintained and continue developing to meet the demand. With fossil fuel continuing to be proven to be detrimental to the environment, solar energy is continuing to become a modern, growing, and potential source of renewable energy. According to the International Energy Agency (IEA) in 2015, the consumption of fossil fuels coming from coal, oil, and natural gas accounts for 81.6% of the total energy consumption amongst the 38 leading countries. From the same data, wind, and solar energy only accounts for 1.5% of the energy consumption [1]. As also shown in Figure 1, solar energy has the highest development compared to other renewable energies such as hydropower, onshore and offshore wind energy, and bioenergy [2]. According to NASA’s physics and astronomy calculations, solar energy is still available for about 6.5 billion years before the sun fades away, which means that the energy source can be utilized for a longer and more durable time before it is projected to deplete [3].
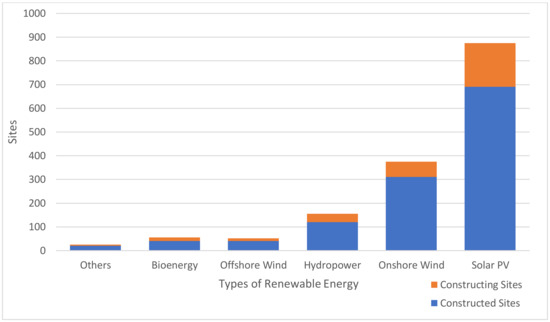
Figure 1.
Comparison of different renewable energy sources [4].
Solar energy takes the direct sun rays from the sun and transforms them into usable energy consumed for many purposes. The major limitations of solar energy include geographical conditions, high dependency on technology development, large installation area with a high initial cost. Additionally, with such limitations come additional, big environmental changes where modifications could leave an impact on local ecosystems should the development a plant be initialized with the trend of sustainable development, and maintaining the balance of the triple bottom line of environmental, social, and economical elements must be considered [5].
Solar energy is still not a popular energy source amongst the economic and social development of the provinces in the Mekong Delta region, Vietnam. However, according to Vietnam Academy of Science and Technology (VAST), Vietnam is one of the potential countries for solar energy development when looking at the data for the amount of sun rays the world receives annually, shown in Figure 2 with a second highest overall evaluation of 4–5 Kwh/m2/day [6].
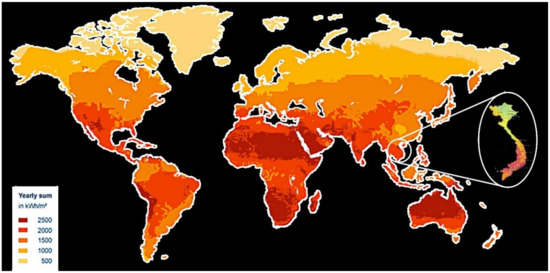
Figure 2.
Average amount of potential solar energy output [6].
In fact, if more than 50% [7] of the energy supply for a national electricity system is imported from other countries, the risk of energy unavailability will be extremely high. Once that supply is depleted or affected by natural disasters, accidents, armed conflicts, sabotage, policy changes or strikes within coal mines, energy security will be directly affected. Besides, the coal transportation from a remote area to the electric production factory, which is done mainly by sea, also has many potential implications for the environment, social security, and economy. The pollution of dust, noise, and ash accumulation from the operation of coal-fired power plants can cause frustration in the local community and sow the seeds for protests, creating long-term instability in terms of social security [8]. Located in the tropical and monsoon region, with an abundant solar energy, the Mekong Delta of Vietnam is entering a period of strong solar power development. Solar energy has been selected as one of the major alternative renewable energy sources in the energy development strategy of the Mekong Delta region. Solar Radiation Maps of Vietnam is shown in Figure 3.
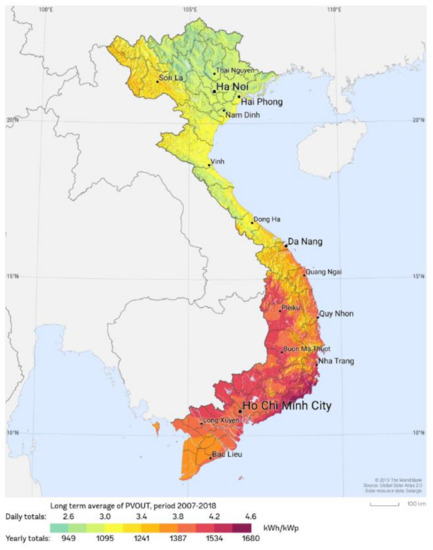
Figure 3.
Solar Radiation Maps of Vietnam [9].
Currently, there is very little research for developing a solar power plant in Vietnamese Mekong Delta region. Determining an optimal location, which is sustainable and satisfies the triple bottom line concepts, is essential for the growth of the country’s power supply and alleviates the environmental damage from fossil fuel consumption by promoting a renewable alternative energy supply. Therefore, this problem is tackled as a Multi-Criteria Decision Making (MCDM) problem that requires both quantitative and qualitative information to be considered. The MCDM problem is commonly defined as determining an optimal decision based on a finite set of available decision alternatives with multiple, and potentially conflicting, criteria.
As mentioned, the purpose of this paper is now to propose a suitable MCDM methodology for localizing and selecting an optimal area in Vietnam in developing a solar power plant. In the next section, the literature will be presented to discuss the first stage of the paper. Discussions and results’ analysis are explained towards the end of the paper.
2. Literature Review
Nowadays, there are many researchers applied MCDM models to any fields of sciences. A. Kengpol et al. [10] initially conducted a study on proposing a solar power plant location to avoid flooding in Thailand using geographical information system (GIS) to determine an optimum site condition. Upon the study, a number of geographical conditions had to be considered which developed into an MCDM problem of ranking the priorities amongst the conditions using Fuzzy Analytic Hierarchy Process (FAHP) and the Technique of Order Preference by Similarity to Ideal Solution (TOPSIS).
A. Azadeh et al. [11] integrated a hierarchical model for solar plants’ location selection by data envelopment analysis (DEA), principal component analysis (PCA) and numerical taxonomy (NT). Anuchit Thongpun et al. [12] focused on a building location selection approach for locating a solar power plant in Thailand based on DEA models. A. Azadeh et al. [13] applied an artificial neural network (ANN) and fuzzy data envelopment analysis (FDEA) for location optimization of solar plants with uncertainty and complexity.
Amy H. I. Lee et al. [14] integrated MCDM model to set the assurance region (AR) of the quantitative factors, and the AR is incorporated into data envelopment analysis (DEA), additionally adopting a fuzzy analytic hierarchy process (FAHP) for the location of a PV solar plant. Adnan Sozen et al. [15] presented an approach for the location of solar plants by data envelopment analysis (DEA). Ali Azadeh et al. [16] presented an integrated fuzzy DEA model for decision making on wind plant locations. Shinya Yokota et al. [17] applied data envelopment analysis (DEA) for the optimal allocation of mega-solar.
Chabuk et al. [18] discussed two MCDM methods to propose two alternative landfill sites for each area in the studied location, which were AHP and Ratio Scale Weighting (RSW), using multiple environmental factors as criteria for evaluation. The methods successfully proposed a geographical map that addressed the suitable locations throughout the studied sector. Chakraborty et al. [19] also proposed multiple MCDM methods including AHP for assigning criteria weights; Grey Rational Analysis (GRA), Multi Objective Optimization on the Basis of Ratio Analysis (MOORA), Elimination of Choice Translating Reality (ELECTRE II), and Operational Competitiveness Rating Analysis (OCRA) for ranking the results of each location alternative; and Spearman’s rank correlation coefficient, Kendall’s rank correlation coefficient, agreement between the top three ranked alternatives were used to compare each ranking methodology with another; finally, the REGIME was used for the final evaluation of each methodology after all the applied evaluating methodologies were calculated. With a huge comparison study between the methods, the author was able to utilize which methodology was most suitable for choosing the most suitable supplier.
Amy H. I. Lee et al. [20] proposed MCDM model to decide the most suitable photovoltaic solar plant allocation by using the interpretive structural modeling (ISM), the Serbian VlseKriterijumska OptimizacijaI Kompromisno Resenje (VIKOR), meaning multi-criteria optimization with a compromise solution, fuzzy analytic network process (FANP). A. Azadeh et al. [21] integrated hierarchical Data Envelopment Analysis for the location optimization of wind plants in Iran. This model would enable the energy policy makers to select the best possible location for construction of a wind power plant with the lowest possible cost. Lei Fang et al. [22] applied the DEA model and goal programming to evaluate the relative efficiency of each potential location.
Chia-Nan Wang et al. [9] proposed a similar MCDM approach to determine a solar power plant location for the entire country of Vietnam using the methods of DEA, FAHP, and TOPSIS to evaluate qualitative and quantitative criteria. Ehsan Dehghani et al. [23] evaluated different areas for solar plants according to a set of social, geographical, and technical criteria through a data envelopment analysis (DEA) model. In this study, the DEA model considers both information of the efficient and anti-efficient frontiers to raise discrimination power in DEA analysis. Ali Mostafaeipour et al. [24] applied Data Envelopment Analysis (DEA) methodology to prioritize cities for installing the solar-hydrogen power plant so that one candidate location was selected for each city. A. Azadeh et al. [25] presented a technical and economic research for allocation of solar plants by using multivariable methods namely, Data Envelopment Analysis (DEA) and Principle Component Analysis (PCA). A hybrid model for the allocation of solar plants was presented by the utilization of most related parameters to solar plants and an integrated DEA-PCA approach. Seong Kon Lee et al. [26] proposed a hybrid model including a fuzzy Analytic Hierarchy Process (AHP)/Data Envelopment Analysis (DEA) for efficiently allocating energy R&D resources in the case of energy technologies against high oil prices.
As the literature review shows, the amount of studies that apply the MCDM approach to various fields of science and engineering has increased in number in recent years. Location selection is one of the fields where the MCDM model has been employed, especially in the renewable energy sector, where decision makers must evaluate both qualitative and quantitative factors. Although some studies have reviewed the applications of MCDM approaches in solar power plant location selection, very few works have focused on this problem in a fuzzy environment. This is a reason why we proposed a fuzzy MCDM model in this study.
3. Methodology
3.1. Basic Theory
3.1.1. Fuzzy Set
A fuzzy set is used to address the issues that exist in an uncertain environment. It was proposed by Zadeh when attempting to solve multiple criteria decision-making problems. If the set is a triangular fuzzy number (TFN), each value of the membership function is in the range [0, 1]:
Each value of membership, which includes the left (the lowest value to evaluate) and right (the highest value to evaluate) representatives, of a TFN is shown below:
A triangular fuzzy number can be described as in Figure 4.
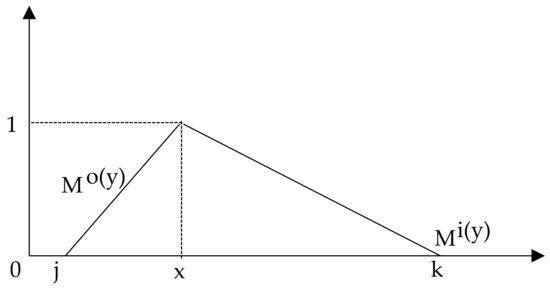
Figure 4.
A triangular fuzzy number (TFN).
3.1.2. Fuzzy Analytic Network Process
Different to the AHP model, a strict hierarchical structure is not required for the ANP model. ANP models allow control elements, that can be controlled by attribute clusters or difference levels. When the elements are at the same level, they can present multiple control factors. A systematic approach in the interaction or feedback between factors is explained using the degree of interaction and interdependence between factors.
Using the rating scale of expert as the basis and data, the decision maker will pair each factor where the weight of each factor is matrixed and determined for the ANP model.
The AHP model then uses a quantitative pair comparison with a priority ratio of 1–9 to set the priority level for each level of the system, where 1 is the lowest priority and 9 is the highest priority. Meanwhile, the ANP model allows making complex relationships between criteria and their rank in the system. The 1–9 scale of the AHP model is shown in Table 1.

Table 1.
The 1–9 scale [6].
The display and goals in the pairwise comparison process, which were considered disadvantages of ANP, were overcome with the development of the FANP model. The FANP model uses a set of values to incorporate decision makers in an uncertain environment, while a crisp value is presented in the ANP model. The Saaty’s model is used to convert the values for the fuzzy prioritization model to easily fix the conversion values, where Oab = () is a TFN with the core , the support [], and the TFN, as shown in Figure 5.
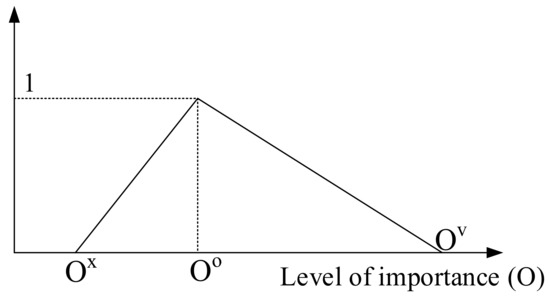
Figure 5.
A triangular fuzzy number (TFN).
Table 2 presents the 1–9 fuzzy conversion scale.
Table 2.
The 1–9 fuzzy conversion scale.
At the reverse level to Oab, expressing the non-preference is also shown by a TFN: (1/, 1/). Using the fuzzy Saaty’s matrix, the weights of the criteria can be determined into four steps that are used to input the data:
- Using Equations (2)–(4), the fuzzy synthetic extensions calculation can be transformed into TNT.Let a = 1, 2, …, n, in which a and b specifically are TFN (Ox, Oo, Ov) and (Nx, N0, Nv) where x is the minimum value, o is the average value, and v is the maximum value;
- Using relationships with the fuzzy valued for addressing the weight of criteria. In order to determine certain fuzzy extensions, they are calculated by using the minimum fuzzy extension of valued relation ≤ at [5] with weights Qa calculated as followswhere a, b = 1, 2, …., n;
- Standardize the weights. If the decision maker expects to obtain the total weights in one matrix equal to 1, final weights qi are solved by (7)where a, b = 1, 2, …, n;
- An evaluation of a Saaty’s matrix is used to test for its consistency. The matrix of the weights and criteria are consistent and sufficient if inequality of the Consistency Ratio (CR) from Equation (8) is defined as follows using the Consistency Index (CI) and Random Index (RI):
3.2. Data Envelopment Analysis Model
3.2.1. Charnes–Cooper–Rhodes model (CCR model)
The CCR model, as the fundamental model for the DEA model, is defined as follows:
The defined constraints ensure that the ratio of virtual output to virtual input cannot exceed 1 per decision making unit (DMU). The objective is to obtain a rate of weighted output for every weighted inputs. Subject to the constraints, the optimal goal value ξ* can only reach a maximum of 1.
DMU0 is CCR’s efficient if . The result must include a minimum of 1 optima a* > 0 and c* > 0. In addition, the fractional program can be defined as a linear programming problem (LP) as follows:
The linear program (10) provides an equal result to the fractional program (9). The linear program from the Farrell model (10) has a variable ξ and a nonnegative vector α as:
The model (3) provides a feasible solution, ξ , in which the optimal solution is affected when is not higher than 1. A specific DMU is provided when the optimal solution, is calculated. For each DMUe, the process will repeat for every e = 1, 2, …, n. When < 1, the DMUs are inefficient. If , the DMUs then are classified as boundary units. By invoking a linear program, we can prevent weakly efficient points d as follows:
For this situation, we clarify that the optimal solution, is not affected by the results from and .
For both (1) ξ and (2) = DMU0 achieves 100% accuracy and efficiency. For both (1) and (2) and for d or g in optimal options, the performance of DMU0 is weakly efficient. Thus, following the development procedure to solve the problem is as follows:
In this case, and variables are first used to transform the inequalities into equivalent equations. For (13), it is the same in terms of methods as when we solve (3) by minimizing in the first stage and then fixing 𝜉 as in (4), where the slacks’ variables provide the highest values but the previously determined value of is not affected. The objective is converted from maximum to minimum, as in (9), to obtain the following:
If the non-Archimedean value and the 𝜀 > 0 are displayed, the input models are similar to models (10) and (13) as follows:
and:
A dual multiplier model of the CCR input-oriented (CCR-I) is expressed as:
A dual multiplier model of the CCR output-oriented (CCR-O) is also expressed as:
3.2.2. Banker Charnes Cooper Model (BCC Model)
The input-oriented BBC model (BCC-I) was introduced by Banker et al., in which the efficiency of DMU0 is assessed by solving the following LP (19):
By invoking a linear program, we can prevent the weakly efficient points as in the following:
The first multiplicative form to the solve problem is as follows:
A second multiplier form of the linear program is expressed as:
As mentioned in Formula (14), in this case Z and u are vectors, and the scalar may be positive or negative or zero. The dual program for the equivalent BCC fractional program (12) can be obtained as follows:
A BCC-efficient solution is a solution where if an optimal solution, DMU0, as solved in this two phase processes for model satisfies and has no slack values where = 0. Otherwise, the model would be considered as BCC-inefficient.
The improved activity, , also can be claimed as BCC efficient. A DMU, which is a minimized input value for any input item, or a maximized output value for any output item, is BCC-efficient.
The output-oriented BCC model (BCC-O) is defined as the following:
A multiplier form of the linear program (24) can be expressed as [25]:
In the envelopment model, the Z0 is the scalar combined with . Conclusively, the equivalent fractional programming formulation for the BCC model was achieved by the authors (25):
3.2.3. Slacks Based Measure Model (SBM Model)
The SBM model was developed by Tone, which has three elements, input-oriented, output-oriented. Input-Oriented SBM (SBM-I-C).
The following model can be defined as the Input-oriented SBM under constant-returns-to-scale-assumption:
4. Case Study
Solar power in Vietnam belongs to the emerging energy industry group, which is engaged in the development of the world’s renewable energy sources, the import of science and technology, and meets the demand for developing power sources. When large hydropower sources are fully exploited, small hydroelectricity will not guarantee benefits compared to the environmental damage. Vietnam, on the other hand, has great potential for solar and wind power, due to its proximity to the equator and the existence of dry, sunny regions like the southern central provinces. The study results are shown in Figure 6. Therefore, solar power, together with wind power, is being encouraged to develop by the State of Vietnam, reflected in the Prime Minister’s Decision No. 2068/QD-TTg of 25 November 2015, approving the Renewable Energy Development Strategy. Vietnam’s electricity generation until 2030, with a vision of 2050, ensures the development of electricity sources when stopping nuclear power projects and reducing fossil-fired thermal power plants.
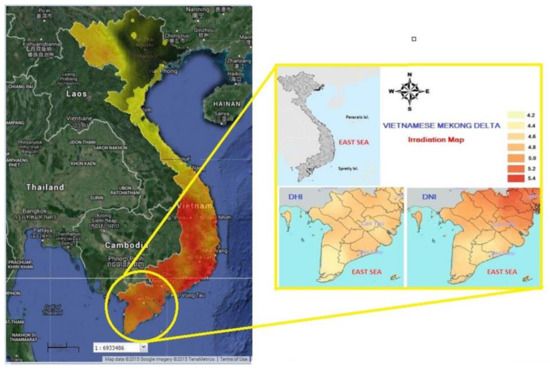
Figure 6.
Irradiation Map of Mekong Delta, Vietnam [27].
With the growth of economic sectors in general and agriculture, the demand for electricity in the Mekong Delta provinces is increasing. However, fossil fuel for electricity generation is declining, so the development of renewable energy is one of the sustainable solutions for the Mekong Delta to have electricity to ensure domestic living and economic development.
In this research, the authors present an integrated approach for the site of solar plants in Mekong Delta, Vietnam, by using data envelopment analysis (DEA) and Fuzzy Analytical Network Process (FANP). In the first stage, DEA model is applied to select some potential location, then FANP model is used for ranking these potential locations. The authors collected data from thirteen locations in Mekong Delta, Vietnam, which can invest in solar power plants, as shown in Table 3.
Table 3.
List of the 13 locations identified in Mekong Delta, Viet Nam.
DEA model is a quantitative technique that determines the relative effectiveness of multiple inputs and outputs decision makers. Halasah et al. [28] employed life-cycle assessment to evaluate the energy-related impacts of PV systems at different scales of integration. The input parameters included panel efficiency, temperature coefficient, shading losses, ground cover ratio and latitude, and the input data included hourly solar radiation, wind speed and temperature. Wang and Amy [9,14] using DEA model for ranking potential location for building solar power plant. In their research, the output data included sunshine hour and elevation. Due to the information accessibility of various sites and the importance of various factors, we select two inputs and two outputs for the quantitative factors. The two inputs are temperature (I1) and wind speed (I2). The two outputs are sunshine hours (O1) and elevation (O2) [14,20]. The definition of the inputs and outputs are defined in Table 4 [20]. Raw data of inputs and outputs of DMUs are demonstrated in Figure 7.
Table 4.
Definition of inputs and outputs.
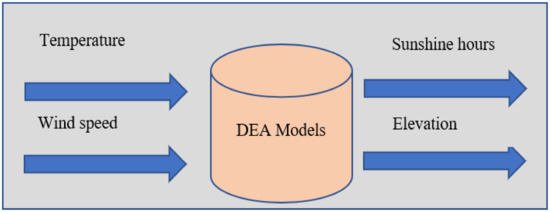
Figure 7.
Inputs and outputs of DEA models.
For applied DEA model, some additional data about 13 locations in Mekong Delta, Vietnam are show in Table 5.
Table 5.
Raw data of DEA model.
To select some potential sites in Mekong Delta, Vietnam, there are several DEA models, including SBM-I-C; CCR-I; BCC-O; CCR-O and BCC-I, applied in this step. The results of the DEA models are shown in Table 6.
Table 6.
Ranking results from some DEA models.
As the results in Table 6 show that there are seven DMUs that are potential locations for building a solar power plant in Mekong Delta, Vietnam including DEL01, DEL03, DEL05, DEL09 and DEL11. These DMUs will be evaluated in the next step of this research by using the FANP model.
In the final stage, all the potential locations will be ranked by the FANP model. Some criteria affecting the location selection are shown in Figure 8.
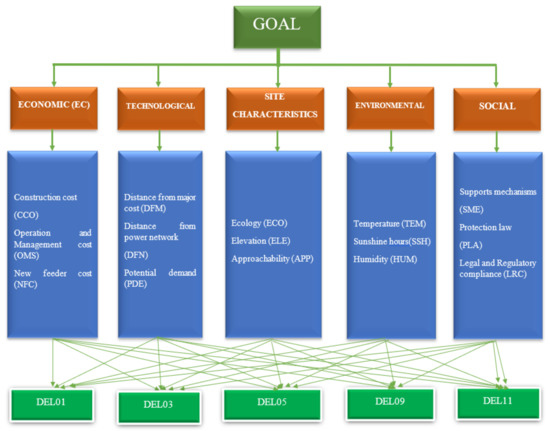
Figure 8.
Main criteria and sub-criteria in Fuzzy Analytical Network Process (FANP) model.
Fuzzy comparison matrix of EC from the FANP model is shown in Table 7.
Table 7.
Fuzzy comparison matrices for Economic factor (EC).
The fuzzy numbers were converted to real numbers by using the TFN. During the defuzzification, the authors obtain the coefficients α = 0.5 and β = 0.5. In this, α represents the uncertain environment conditions, and β represents whether the attitude of the evaluator is fair.
f0.5(LEL,SL) = (5 − 4) × 0.5 + 4 = 4.5
f0.5(USL,SL) = 6 − (6 − 5) × 0.5 = 5.5
The remaining calculations for other criteria are similar to the above calculation. The real number priority when comparing the main criteria pairs is shown in Table 8.
Table 8.
Real number priority.
The following are used for calculating the maximum individual value:
P1 = (1 × 6 × 2 × 4)1/4 = 2.63
P2 = (1/5 × 1 × 1/4 × 3)1/4 = 0.62
P3 = (1/2 × 4 × 1 × 5)1/4 = 1.78
P4 = (1/4 × 1/3 × 1/5 × 1)1/4 = 0.36
Based on the number of main criteria, the authors get n = 5; λmax and CI are calculated as follows:
To calculate CR value, we get RI = 0.9 with n = 4.
As CR = ≤ 0.1, we do not need to re-evaluate.
5. Discussion
There have been many studies presenting MCDM models using fuzzy set theory to evaluate and select the location of a renewable energy plant, particularly solar energy. However, the literature review shows that most of these studies only use economic, or technological, or site characteristics, or environmental or social standards to assess potential locations. There are few studies that simultaneously use economic, technological, site characteristics, environmental and social factor standards in the process of location selection. In addition, there seems to be no research on developing an MCDM model to choose a location for a solar power plant in the Mekong Delta.
This is a reason the author proposed an MCDM model including data envelopment analysis (DEA) and fuzzy analytical network process (FANP) for solar power plant location selection in Mekong Delta, Vietnam in this work. In the first step, some potential location is selected from 13 location in Mekong Delta by using the DEA model. Then, the FANP model is applied for rank potential sites. In a renewable energy project, location decision is the most importance activity; location decision is always a multicriteria decision making factor, as the decision maker must consider both quantitative and qualitative factors. In any renewable energy project, location decision is a very important decision, decision maker must consider qualitative and quantitative factors. Thus, solar power plant location selection is a multicriteria decision making (MCDM). For selection optimal location, the proposed model considered five main factors: economic factors (construction cost, operation and management cost, new feeder cost), technological factors (distance from major road, distance from power network, potential demand), site characteristics factors (ecology, elevation, approachability), environmental factors (temperature, sunshine hours, humidity) and social factors (supports mechanisms, protection law and legal regulatory compliance) As per the results shown in Table 9, Ben Tre (DEL03) is the optimal solution for investing solar power plants in Mekong Delta, Vietnam.
Table 9.
Final ranking from the FANP model.
6. Conclusions
Facing energy demand challenges to ensure sustainable economic growth, especially the exhaustion of fossil fuels, environmental pollution, and climate change. Incentive policies to take advantage of renewable energy supply opportunities in Vietnam. This approach to taking advantage of this new energy source not only contributes to timely supply of the energy needs of the society but also helps to save electricity and reduce environmental pollution.
However, when considering investing in solar power plants, decision makers must consider many qualitative and quantitative factors including economic, technological, site characteristics, environmental and social factors. Therefore, this problem is tackled as a Multi-Criteria Decision Making (MCDM) problem that requires that both quantitative and qualitative information are considered. This paper presented an integrated approach for site of solar plants by data envelopment analysis (DEA) and Fuzzy Analytical Network Process (FANP). Furthermore, this integrated approach, incorporating the most relevant parameters of solar plants, is introduced.
The contributions of this research include a fuzzy multicriteria decision-making (F-MCDM) approach for solar power plant site selection in Vietnam. This research also utilizes the evolution of a new approach that is flexible and practical for the decision-maker and provides useful guidelines for solar power plant location selection in many countries around the world.
For further studies regarding this topic, the study can be expanded to other MCDM approaches such as VIKOR, ELECTRE I, ELECTRE III.
Author Contributions
Conceptualization, C.-N.W., T.P.H., V.T.N. and S.T.H.; Data curation, V.T.H.V., T.P.H. and V.T.N.; Formal analysis, C.-N.W., V.T.H.V., T.P.H., V.T.N. and S.T.H.; Funding acquisition, C.-N.W. and V.T.H.V.; Investigation, C.-N.W., T.P.H., V.T.N. and S.T.H.; Methodology, C.-N.W., V.T.H.V., T.P.H. and V.T.N.; Project administration, V.T.H.V., T.P.H. and V.T.N.; Resources, V.T.N.; Visualization, T.P.H. and S.T.H.; Writing—original draft, V.T.H.V., T.P.H.,V.T.N. and S.T.H.; Writing—review and editing, C.-N.W., V.T.H.V. and V.T.N. All authors have read and agreed to the published version of the manuscript.
Funding
This research received no external funding.
Conflicts of Interest
The authors declare no conflict of interest.
References
- Renewable Capacity Growth between 2019 and 2024 by Technology. Available online: https://www.iea.org/data-and-statistics/charts/renewable-capacity-growth-between-2019-and-2024-by-technology (accessed on 22 March 2020).
- Ưu Khuyết Điểm Của Năng Lượng Mặt Trời. Available online: https://www.iea.org/data-and-statistics/charts/renewable-capacity-growth-between-2019-and-2024-by-technology (accessed on 10 March 2020).
- World Summit Outcome, Resolution A/60/1, adopted by the General Assembly on 15 September 2005. Available online: https://www.un.org/en/development/desa/population/migration/generalassembly/docs/globalcompact/A_RES_60_1.pdf (accessed on 5 March 2020).
- MRC Strategic Environmental Assessment (SEA) of Hydropower on the Mê Công Mainstream. Available online: http://www.mrcmekong.org/assets/Publications/Consultations/SEA-Hydropower/SEA-FR-summary-13oct.pdf (accessed on 5 March 2020).
- Đồng Bằng Sông Cửu Long Trước Nguy Cơ Lớn Từ Nhiệt điện Than. Available online: https://www.thiennhien.net/2018/06/22/dong-bang-song-cuu-long-truoc-nguy-co-lon-tu-nhiet-dien-than (accessed on 22 March 2020).
- Gorjian, S.; Hashjin, T.T.; Ghobadian, B. Estimation of mean monthly and hourly global solar radiation on surfaces tracking the sun: Case study: Tehran. In Proceedings of the Second Iranian Conference on Renewable Energy and Distributed Generation, Tehran, Iran, 6–8 March 2012; pp. 172–177. [Google Scholar]
- Điện Mặt Trời Phát Triển Mạnh Ở Đồng Bằng Sông Cửu Long. Available online: http://ceid.gov.vn/dien-mat-troi-phat-trien-manh-o-dong-bang-song-cuu-long (accessed on 22 March 2020).
- Gloal Solar Atlas. Available online: https://globalsolaratlas.info/map?c=-29.22889,-1.40625,2 (accessed on 22 March 2020).
- Wang, C.N.; Nguyen, V.T.; Thai, H.T.N.; Duong, D.H. Multi-Criteria Decision Making (MCDM) Approaches for Solar Power Plant Location Selection in Viet Nam. Energies 2018, 11, 1504. [Google Scholar] [CrossRef]
- Kengpol, A.; Rontlaong, P.; Tuominen, M. A decision support system for selection of solar power plant locations by applying fuzzy ahp and topsis: An empirical study. J. Softw. Eng. Appl. 2013, 6, 470–481. [Google Scholar] [CrossRef]
- Azadeh, A.; Ghaderi, S.F.; Maghsoudi, A. Location optimization of solar plants by an integrated hierarchical DEA PCA approach. Energy Policy 2008, 36, 3993–4004. [Google Scholar] [CrossRef]
- Thongpun, A.; Nasomwart, S.; Peesiri, P.; Nananukul, N. Decision support model for solar plant site selection. In Proceedings of the 2017 IEEE International Conference on Smart Grid and Smart Cities (ICSGSC), Singapore, 23–26 July 2017; pp. 50–54. [Google Scholar]
- Azadeh, A.; Sheikhalishahi, M.; Asadzadeh, S.M. A flexible neural network-fuzzy data envelopment analysis approach for location optimization of solar plants with uncertainty and complexity. Renew. Energy 2011, 36, 3394–3401. [Google Scholar] [CrossRef]
- Lee, A.H.I.; Kang, H.-Y.; Lin, C.-Y.; Shen, K.-C. An integrated decision-making model for the location of a pv solar plant. Sustainability 2015, 7, 13522–13541. [Google Scholar] [CrossRef]
- Sozen, A.; Mirzapour, A.; Çakir, M.T. Selection of the best location for solar plants in Turkey. J. Energy S. Afr. 2015, 26, 52–63. [Google Scholar] [CrossRef]
- Azadeh, A.; Rahimi-Golkhandan, A.; Moghaddam, M. Location optimization of wind power generation–transmission systems under uncertainty using hierarchical fuzzy DEA: A case study. Renew. Sustain. Energy Rev. 2014, 30, 877–885. [Google Scholar] [CrossRef]
- Yokota, S.; Kumano, T. Mega solar optimal allocation using data envelopment analysis. Electr. Eng. Jpn. 2013, 183, 24–32. [Google Scholar] [CrossRef]
- Chabuk, A.; Al-Ansari, N.; Hussain, H.M. Landfill sites selection using MCDM and comparing method of change detection for Babylon Governorate. Environ. Sci. Pollut. Res. 2019, 26, 35325–35339. [Google Scholar] [CrossRef] [PubMed]
- Chakraborty, R.; Ray, A.; Dan, P. Multi criteria decision making methods for location selection of distribution centers. Int. J. Ind. Eng. Comput. 2013, 4, 491–504. [Google Scholar] [CrossRef]
- Lee, A.H.; Kang, H.Y.; Liou, Y.J. A hybrid multiple-criteria decision-making approach for photovoltaic solar plant location selection. Sustainability 2017, 9, 184. [Google Scholar] [CrossRef]
- Azadeh, A.; Ghaderi, S.F.; Nasrollahi, M.R. Location optimization of wind plants in Iran by an integrated hierarchical data envelopment analysis. Renew. Energy 2011, 36, 1621–1631. [Google Scholar] [CrossRef]
- Fang, L.; Li, H. Multi-criteria decision analysis for efficient location-allocation problem combining DEA and goal programming. RAIRO Oper. Res. 2015, 49, 753–772. [Google Scholar] [CrossRef]
- Dehghani, E.; Jabalameli, M.S.; Pishvaee, M.S.; Jabarzadeh, A. Integrating information of the efficient and anti-efficient frontiers in DEA analysis to assess location of solar plants: A case study in Iran. J. Ind. Syst. Eng. 2018, 11, 163–179. [Google Scholar]
- Mostafaeipour, A.; Sedaghat, A.; Qolipour, M.; Rezaei, M.; Arabnia, H.R.; Saidi-Mehrabad, M.; Alavi, O. Localization of solar-hydrogen power plants in the province of Kerman. Adv. Energy Res. 2017, 5, 179. [Google Scholar]
- Azadeh, A.; Ghaderi, S.F.; Maghsoudi, A. Location optimization of solar plants by an integrated multivariable DEA-PCA method. In Proceedings of the 2006 IEEE International Conference on Industrial Technology, Mumbai, India, 15–17 December 2006; pp. 1867–1872. [Google Scholar]
- Lee, S.K.; Mogi, G.; Hui, K.S. A fuzzy analytic hierarchy process (AHP)/data envelopment analysis (DEA) hybrid model for efficiently allocating energy R&D resources: In the case of energy technologies against high oil prices. Renew. Sustain. Energy Rev. 2013, 21, 347–355. [Google Scholar]
- Tuan, L.A. An overview of the renewable energy potentials in the Mekong river Delta, Vietnam. Can Tho Univ. J. Sci. 2016, 4, 70–79. [Google Scholar]
- Halasah, S.A.; Pearlmutter, D.; Feuermann, D. Field installation versus local integration of photovoltaic systems and their effect on energy evaluation metrics. Energ. Pol. 2013, 52, 462–471. [Google Scholar] [CrossRef]
- Radziemska, E. The effect of temperature on the power drop in crystalline silicon solar cells. Renew. Energy 2003, 28, 1–12. [Google Scholar] [CrossRef]
- Solar Panel Temperature Affects Output—Here’s What You Need to Know. Available online: http://www.solar-facts-and-advice.com/solar-panel-temperature.html (accessed on 5 March 2020).
- Guide to Meteorological Instruments and Methods of Observation. Available online: http://www.wmo.int/pages/prog/gcos/documents/gruanmanuals/CIMO/CIMO_Guide-7th_Edition2008.pdf (accessed on 5 March 2020).
- Panjwani, M.; Narejo, D. Effect of altitude on the efficiency of solar panel. Int. J. Eng. Res. Gen. Sci. 2014, 2, 461–463. [Google Scholar]


© 2020 by the authors. Licensee MDPI, Basel, Switzerland. This article is an open access article distributed under the terms and conditions of the Creative Commons Attribution (CC BY) license (http://creativecommons.org/licenses/by/4.0/).