Abstract
Among the main causes of outdoor insulation failures is their poor specifications in terms of leakage distances. This happens when the selected criteria are unable to cope with all the stresses imposed by the changes in environmental pollutions. Therefore, it is important for utilities to fully understand the actual pollution characteristics of the service environment in which the insulators are operating. In this paper, the pollution severity and performance of some 13.2 kV ceramic insulators, sampled in different areas of a Canadian aluminum factory, are assessed. The investigations were performed taking into account the influence of air humidity. Various characteristics were investigated to assess the pollution levels of the insulators, such as equivalent salt deposit density (ESDD) and non-soluble deposit density (NSDD), surface resistance, and leakage current characteristics (density, 3rd harmonic amplitude, and phase). It was witnessed that the insulators, collected around the factory, were much more polluted in comparison to the initial expectation. The pollution level should not be considered static due to the environmental parameters’ dynamics. Lessons to learn: the reliability of an electrical grid is dependent on components whose own reliability is strongly affected by external factors, of which there is often a poor awareness. If care is not taken to re-evaluate the post-installation pollution levels of the insulators, the light may simply turn out!
1. Introduction
Outdoor insulators are essential hardware of the power delivery system. They are a basic requirement of open-air outdoor switchgears, and a failure of them means a failure in the system. These essential hardware are found in the transmission and distribution of electricity from power stations to substations, where the voltage is stepped down and distributed to commercial and residential consumers. Due to the remoteness of power plants, the energy is generally transported over long distances using high voltage (HV) overhead transmission lines supported by pylons. Insulators provide the mechanical means by which high voltage transmission lines (composed of bare conductors) are suspended from transmission structures (pylons), while also providing the required electrical insulation [1,2]. These important hardware are exposed to various electrical and environmental stresses that affect their performance and increase their premature aging and degradation. When insulators fail, either in their mechanical or electrical role, the consequences are power outages and, in some cases, additional equipment and structure damages. Reducing the risk of failure through proper installation, inspection, and assessment practices is the focus of ongoing research and utilities engineer training. The reduction in the performance of outdoor insulators occurs mainly by the pollution accumulation at the insulating surfaces. Surface discharges are precursors of flashover. Outdoor insulators are exposed to various pollution sources (sea salts, domestic pollution, dirt, and chemical residues in the industrial areas) [3,4]. Insulator pollution can lead to flashover. In polluted areas, overhead lines may see their reliability and performance decline due to pollution insulators. When the contaminated insulating surface is wet, it becomes a conductive electrolyte. The leakage currents then increase on the insulating surface with potential flashover [5]. Identification of the factors causing insulation surface pollution, pollution severity assessment, and tackling its unfavorable effects have an important role in increasing the grid reliability. This is highly remarkable, particularly in environments with high dynamics (wind, pollution, humidity, etc.). Significant differences within the seriousness of pollution between sites can be assessed through equivalent salt deposit density (ESDD), non-soluble deposit density (NSDD), and the leakage current measurements. One of the major problems faced by this factory is the pollution of ceramic insulators installed on the 13.2 kV distribution grid. The interaction between the air transporting dust and the insulators creates a pollution layer on the insulator’s surface. Once this layer is moistened, the withstand voltage drops considerably, causing the insulator to flashover. The concomitant power outages are not acceptable because they lead to huge financial losses and loss of control of the production process cycle. Since the insulators were initially designed considering a light pollution level, it is suspected that the environmental parameters dynamics resulting from the factory’s production have affected the type and amount of particle accumulation. In this paper, seven service-aged 13.2 kV ceramic insulators, surrounding a Canadian aluminum plant, are collected to examine the severity of the pollution. The assessment was conducted through the leakage current and the ESDD and NSDD (non-soluble deposit density) measurements. The results are useful for assessing the insulation performance in the different areas and to propose an updated pollution severity map.
2. Background on Insulators
Generally, insulators are made based on porcelain or tempered glass. They are composed of a wet mixture of four primary materials: feldspar, flint, ball clay, and talc [6]. The mixture is molded and heated at a temperature of 1200 °C–1400 °C, and then glazed. The excellent dielectric strength of porcelain, which is around 1.574–11.02 kV/mm, and its relative permittivity (between 5.1 and 5.9) allow improving the resistance to materials’ aging due to electrical and environmental stresses [7]. The Achilles heel of porcelain insulators is, essentially, their hydrophobic surfaces [8]. Later on, polymer insulators were introduced because of their excellent performance against pollution. Polymer insulators are of two types: in resin or composite.
Composite insulators are used extensively for the levels of voltage distribution and high voltage transmission lines [1,9]. In contaminated environments, the leakage current at their level is much lower than that of ceramic insulators [10]. However, a composite insulator has some disadvantages: brittle fractures, erosion, tracking, and chemical changes on the surface due to weathering are the main reasons for failures [1].
A significant cause of both service interruptions and flashovers is due to polluted insulators. Their surface is mostly responsible. There are two types: hydrophilic (ceramic insulators) or hydrophobic (polymer insulators) [3,4]. The pollution flashover process for ceramic insulators can be seen in [5]. Pollution sources can be found in Table 1 [6].

Table 1.
Typical sources of pollution.
In non-ceramic and porcelain insulators, the contamination process is the same, but non-ceramic insulators collect less pollution than ceramic insulators [6,11]. Recently, with nanotechnology and nanoscience, new materials with innovative properties have been proposed for several applications [12,13,14]. A wide range of such monitoring devices and techniques has been developed over the years. The most widely used ones are [3]: directional dust deposit gauge, NaCl, ESDD, environmental monitoring (air sampling, climate measurements), NSDD, surface conductance, insulator flashover stress, surge counting, and leakage current measurement. New diagnostic tools have emerged [1].
3. Experimental Arrangement
The insulators shown in Figure 1 were sampled from different locations around the Rio Tinto’s factory in Saguenay (Canada). Three methods were used to assess the pollution level of the insulators: ESDD, NSDD, and the leakage current.
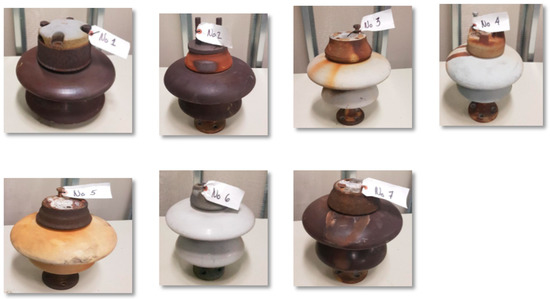
Figure 1.
Samples of 13.2 kV ceramic insulators investigated in the study.
3.1. ESDD and NSDD Assessment
The assessment of the pollution of a site is possible by measuring both ESDD and NSDD on insulators generally in service. The measurements were made under standard IEC TS 60815-1 [4]. The probe of the YOKOGAWA Model SC 72 was used to measure the conductivities. These conductivities at different temperatures were corrected at 20 °C. The ESDD and NSDD were calculated according to IEC TS 60815-1 [4].
3.2. Leakage Current Measurement
The pollution of insulators can be assessed by measuring the leakage current to avoid any possible breakdowns [15]. Figure 2 and Figure 3 show the measuring circuit and the leakage current test device, respectively. The high voltage (HV) AC source was connected to the insulator via a capacitive voltage divider. The circuit consisted of a 380 V/100 kV–10 kVA testing transformer, whose primary winding was connected to the autotransformer integrated in a semi-automatic or manual automatic control system. This later adjusted the voltage at the desired value. The system included a data acquisition that collected the main electrical characteristics. was a power resistor (500 Ω, 500 W), connected between the insulator and the ground that measured the leakage current. The voltage was measured via a capacitive divider.
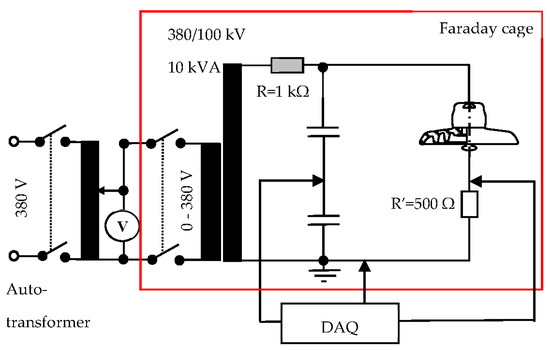
Figure 2.
Schematic configuration of the leakage current-measuring circuit.
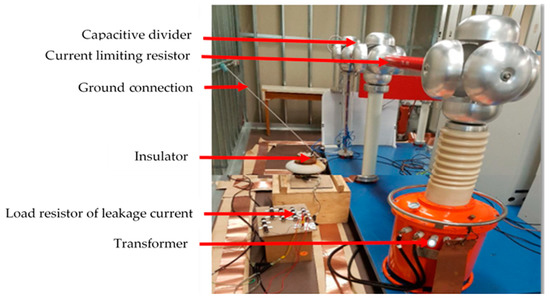
Figure 3.
An overview of the experimental setup.
In order to evaluate the impact of humidification, the insulator samples were stored in a chamber where the relative air humidity was controlled by a water and glycerin mixture. The humidification concept can be found in the literature [16].
4. Results and Discussion
4.1. Leakage Current Assessment
Figure 4 shows the comparison of the measured leakage current on the humidified and non-humidified polluted insulators. The applied voltage was 7.62 ± 6% kV. From this figure, it can be observed that the leakage current increased with the relative humidity. This confirms the important role played by moisture on the leakage current flowing at the surface of polluted insulators.
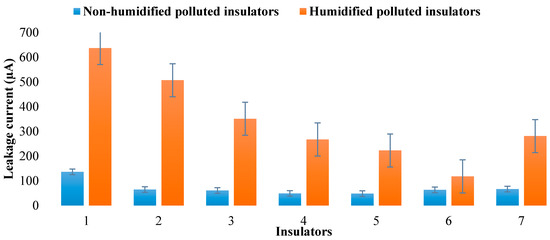
Figure 4.
Leakage current on the humidified and the non-humidified polluted insulators.
In order to better explain the effect of humidification on the polluted insulators and the high values of the leakage current measured after humidification, the surface resistance of the non-humidified and humidified insulators was computed (Figure 5). This figure expresses the result differently for the sake of readers more familiar with viewing resistance. The results show that the non-humidified insulators have a very high surface resistance.
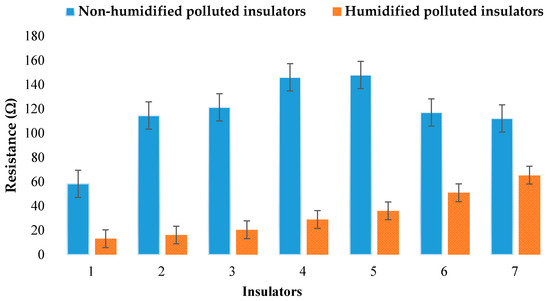
Figure 5.
Resistance of non-humidified and humidified polluted insulators.
The leakage current density of the non-humidified and humidified polluted insulators is shown in Figure 6. It can be seen that the leakage current density of these insulators after humidification was much higher than that of non-humidified insulators. This increase can be explained by the fact that, due to contamination on the surface, the insulator can retain more moisture, thus increasing the leakage current. Moisture is a naturally occurring phenomenon and on a macro level will vary with the location and weather. High relative air humidity is very stressful to the insulator.
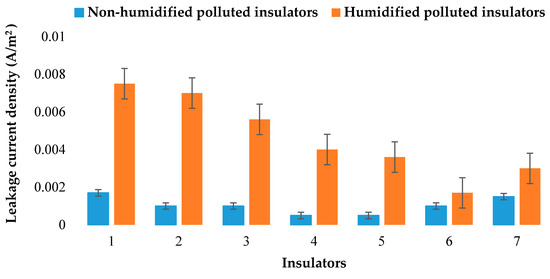
Figure 6.
Leakage current density of non-humidified and humidified polluted insulators.
4.2. Phase Difference between Leakage Current and Applied Voltage
It is a well-known fact that the electric field distribution is greatly influenced by the pollution layer’s characteristics (conductivity and thickness) [3]. With increasing pollution layer conductivity, the electric field intensity increases with a concomitant increase in the leakage current. In order to highlight the capacitive nature of these insulators, the calculation of the phase shifts between the measured leakage current and the applied voltage was performed for the humidified and the non-humidified polluted insulators (Figure 7). From the analysis of these results, it appears that the waveform of the leakage current had a phase shift of about 90° with respect to the applied voltage. This shows the dominance of the capacitive effect of these different non-humidified polluted insulators. The results clearly show that the phase shift between the applied voltage and the measured leakage current had decreased substantially for all humidified polluted insulators but did not tend toward zero (this is based on subtracting complex current in dry conditions from wet conditions and seeing the resulting phase, which lies between 35° and 64°, not near 0°).
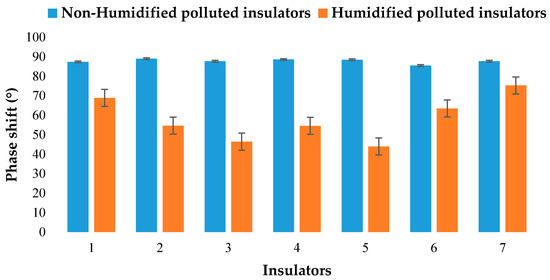
Figure 7.
Comparison of phase shifts between non-humidified and humidified polluted insulators.
4.3. Harmonic Analysis
Polluted and humidified insulators circulate a leakage current on their surface leading, under certain conditions, to a flashover. Odd order harmonics in general, and in particular the 3rd and 5th, have adverse effects on the electrical network [17]. Indeed, by analyzing the leakage current harmonics, through the ratio of the 3rd/5th harmonic, it possible to predict the functional conditions of and occurrences of flashover in ceramic insulators. Furthermore, by analyzing the values of the leakage current and the harmonic components of clean insulators under normal operating conditions, it is observed that in all insulators, the 5th harmonic value of the leakage current is greater than the 3rd. Therefore, this criterion can be used to detect abnormal operating conditions in polluted insulators. For medium and severe pollution with fog and humidity, the value of the 3rd harmonic becomes larger than that of the 5th harmonic. The increase in the 3rd harmonic is faster and greater than that of the 5th harmonic with the imminence of the flashover. As a result, the condition of the insulator becomes critical and the probability of flashover occurrence increases. In this case, the ratio of the 3rd to the 5th harmonic is greater than one [17,18]. The harmonics measured during the various tests carried out on the non-humidified and humidified insulators are presented in Figure 8. In order to assess the effect of humidification on the polluted insulators, the 1st, 3rd, and 5th harmonics were measured, and the results are shown in Figure 8. After humidification, the harmonic of the leakage current was also computed in order to establish the ratio of the 3rd and 5th harmonics presented in Figure 9.
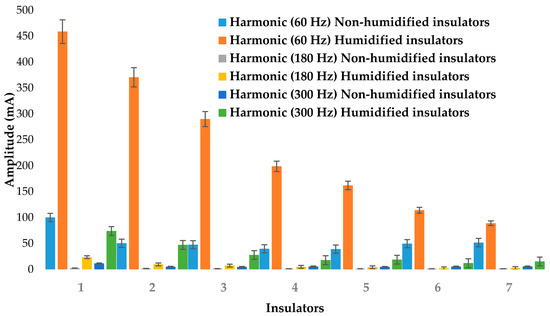
Figure 8.
Leakage current harmonics of non-humidified and humidified polluted insulators.
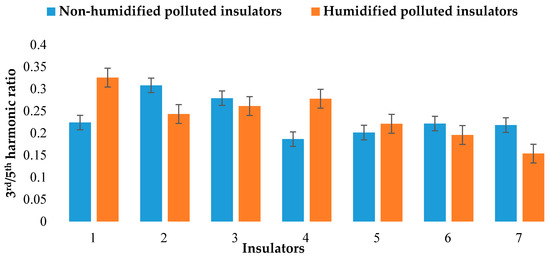
Figure 9.
The 3rd/5th harmonic ratio of non-humidified and humidified polluted insulators.
From Figure 8, it can be seen that the 5th harmonic was greater than the 3rd one for all insulators. This allows deducing that these insulators, although in polluted conditions, are in normal operation. In real life conditions, adverse external conditions (such as rain, dew or fog) may wet the contaminated surface of insulators, hence increasing the levels of leakage current. The received samples must therefore be submitted to humidification to resume testing. This will make it possible to compare different results of the leakage current recorded and to draw accurate conclusions. It can be seen from Figure 9 that the amplitude of the 5th harmonic was always higher than the 3rd one. This indicates the non-imminence of flashover, because the ratio of the 3rd to the 5th harmonic was below one in this case (Figure 10). However, the 1st, 3rd, and 5th harmonics are higher than the harmonics measured on the non-humidified polluted insulators. The 3rd harmonic is mainly related to the electric discharge activities (corona, creepage, and so on), and it can be used to detect sensitively initial discharge voltage and discharge intensity of the samples. For better comparison, the 3rd harmonic of the non-humidified and humidified polluted insulators are accommodated on the same graph (Figure 10).
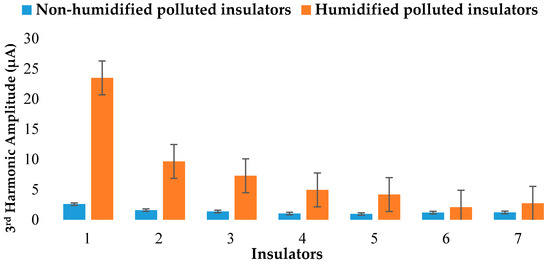
Figure 10.
3rd harmonic of non-humidified and humidified polluted insulators.
From this figure, it can be seen that the 3rd harmonic increased when insulators were humidified. These results are in agreement with the investigations reported in the literature [19].
4.4. Pollution Level Assessment
The salinity, ESDD, and NSDD results for the insulators tested are shown in Table 2. The low values of salinity indicate that the contamination contained low levels of sodium chloride, but in large part, other contaminants [20,21]. To determine the pollution site severity (SPS), different limits are standardized by IEC [4], as shown in Table 3. Comparing the results in Table 2 with the IEC 60815 standard allows the determination of the pollution levels of the different insulators that are presented in Table 4.
Table 2.
Values of calculated salinity, equivalent salt deposit density (ESDD) and non-soluble deposit density (NSDD).
Table 3.
IEC Pollution Severity [4].
Table 4.
Pollution level of the tested insulators.
It can be seen that the insulators suffered from light to very high pollution levels. The results indicate that the area where these insulators are located has a high level of pollution, with an equivalent salt deposit of 0.2125 mg/cm2. This pollution should be attributed to the local environmental parameters dynamics, which provides different pollutant sources and amounts [22]. From the surrounding air analyses, it was found that the contaminants that may have been deposited on the surface of the insulators could have been: aluminum process bath mixes: artificial cryolite, trisodium hexafluoroaluminate, electrolytic bath with or without lithium, crushed electrolytic bath, electrolytic casting bath, enriched alumina (recycled) dry scrubbers, re-circulated alumina, fluorinated alumina, charged alumina, calcined alumina, dusts of anode butts (shot blasting machine), or solid tars-tailings of anode furnace ducts.
These results are in agreement with the recommendations described in the IEC standard, which mentions that [4]: “In the same environment, different types of insulators and even differently oriented accumulate pollution at different rates. Also, some insulators can be more efficient than others due to changes in the nature of the pollutant.”
5. Conclusions
Seven service-aged 13.2 kV ceramic insulators, located in the surroundings of a Canadian aluminum plant, were collected for a post-pollution severity assessment. Various characteristics, such as ESDD, NSDD, and the leakage current, were investigated to assess the pollution level of the insulators. From these investigations, the main conclusions can be summarized as follows:
- The 1st, 3rd, and 5th harmonic components may allow monitoring the entire development trend of the leakage current.
- A number of observations by other published papers have been re-confirmed in this paper; the theoretical premises and expectations that the leakage current increases with the insulator’s humidification is verified.
- The observed current is a combination of an increased conductive leakage plus a fairly steady capacitive part.
- The ESDD and NSDD assessments indicate that all the insulators, initially designed for light pollution level, are differently polluted. The pollution level should, therefore, not be considered static. These investigations have confirmed that the local environmental parameters dynamics should be considered for the grid reliability. Post-installation investigations are recommended whenever the surrounding insulator’s area undergo changes (construction, habitation, changes in factory processes, etc.).
Author Contributions
This work was p under the supervision of I.F., who designed this research and gave the whole guidance. E.H., F.M. and K.M.L.Y. performed the experimental investigations. J.S.N. and A.B. collected all the data, carried out calculations, result display and analysis and wrote the manuscript. The final draft of paper was thoroughly reviewed by I.F. All authors have read and agreed to the published version of the manuscript.
Funding
This research was funded by Natural Science and Engineering Research Council (NSERC) grant number 513476-17.
Acknowledgments
The authors gratefully acknowledge the cooperation of Rio Tinto, Saguenay branch in Canada, for allowing the investigations and authorizing the publication of this manuscript.
Conflicts of Interest
The authors declare no conflict of interest.
References
- Papailiou, K.O. Overhead Lines. In CIGRE Green Books; CIGRE: Paris, France, 2017. [Google Scholar]
- EPRI. EPRI AC Transmission Line Reference Book—200 kV and Above, 3rd ed.; EPRI: Palo Alto, CA, USA, 2005. [Google Scholar]
- CIGRE Working Group 33-04, TF 01. Polluted insulators: A review of current knowledge. CIGRE Rep. 2000, 158, 128–129. [Google Scholar]
- IEC TS 60815-1. Selection and Dimensioning of High-voltage Insulators Intended for Use in Polluted Conditions-Part 1: Definitions, Information and General Principles, 1st ed.; International Electrotechnical Commission: Geneva, Switzerland, 2008. [Google Scholar]
- Gençoglu, M.T.; Cebeci, M. The pollution flashover on high voltage insulators. Electr. Power Syst. Res. 2008, 78, 1914–1921. [Google Scholar] [CrossRef]
- Grigsby, L.L. Electric Power Generation, Transmission and Distribution, 3rd ed.; CRC Press: Boca Raton, FL, USA, 2012. [Google Scholar]
- Mishra, A.P.; Gorur, R.S.; Venkataraman, S. Evaluation of porcelain and toughened glass suspension insulators removed from service. IEEE Trans. Dielectr. Electr. Insul. 2008, 15, 467–475. [Google Scholar] [CrossRef]
- Braini, S.M. Coatings for Outdoor High Voltage Insulators. Ph.D. Thesis, School of Engineering Cardiff, Cardiff University, Wales, UK, 2013. [Google Scholar]
- Papailiou, K.O.; Schmuck, F. Silicone Composite Insulators Materials, Design, Applications; Springer: Berlin/Heidelberg, Germany, 2013. [Google Scholar]
- EPRI. Review for the State of the Art and Application of Polymer Materials Insulation used in Distribution Class. (12–46 kV class) Substations; EPRI: Palo Alto, CA, USA, 2003. [Google Scholar]
- Imakoma, T.; Suzuki, Y.; Fujii, O.; Kawamura, S. Electrical and mechanical characteristics of non-ceramic phase-to-phase spacers and akimbo insulator assemblies. In Proceedings of the SEE Conference, Paris, France, 7–8 June 1994. [Google Scholar]
- Contreras, J.E.; Rodríguez, E.A. Nanostructured insulators–A review of nanotechnology concepts for outdoor ceramic insulators. Ceram. Int. 2017, 43, 8545–8550. [Google Scholar] [CrossRef]
- Dave, V.; Dubey, P.; Gupta, H.O.; Chandra, R. Nanotechnology for outdoor high voltage insulator: An experimental Investigation. Int. J. Chemtech Res. 2013, 5, 666–670. [Google Scholar]
- Portella, K.F.; Mengarda, P.; Bragança, P.M.; Ribeiro, S.; Santos de Melo, J.; Pedreira, C.D.; Pianaro, S.; Mazur, M.M. Nanostructured titanium film deposited by pulsed plasma magnetron sputtering (Pdms) on a high voltage ceramic insulator for outdoor use. Mat. Res. 2015, 18, 853–859. [Google Scholar] [CrossRef][Green Version]
- Li, J.Y.; Sun, C.X.; Sima, W.X.; Yang, Q.J. Stage pre-warning based on leakage current characteristics before contamination flashover of porcelain and glass insulators. IET Gener. Transm. Distrib. 2009, 3, 605–615. [Google Scholar] [CrossRef]
- Fofana, I.; Borsi, H.; Gockenbach, E. Fundamental Investigations on Some Transformer Liquids under Various Outdoor Conditions. Trans. Dielectr. Electr. Insul. 2001, 8, 1–8. [Google Scholar] [CrossRef]
- Palangar, M.F.; Mirzaie, M. Detection of Critical Conditions in Ceramic Insulators Based on Harmonic Analysis of Leakage Current. Electr. Power Compon. Syst. 2016, 44, 18541–18864. [Google Scholar] [CrossRef]
- Ahmadi-Joneidi, I.; Shayegani-Akmal, A.A.; Mohseni, H. Leakage current analysis of polymeric insulators under uniform and non-uniform pollution conditions. IET Gener. Transm. Distrib. 2017, 11, 2947–2957. [Google Scholar] [CrossRef]
- Zheng, Q.; Liu, S.; Yang, S.; Lei, J.; Peng, X.; Lin, C. Influence of insoluble substance hygroscopicity on insulator leakage current. In Proceedings of the International Conference on High Voltage Engineering and Application (ICHVE), Chengdu, China, 19–22 September 2016. [Google Scholar]
- Hussain, M.M.; Chaudhary, M.A.; Razaq, A. Mechanism of Saline Deposition and Surface Flashover on High-Voltage Insulators near Shoreline: Mathematical Models and Experimental Validations. Energies 2019, 12, 3685. [Google Scholar] [CrossRef]
- Vosloo, W.L. A Comparison of the Performance of High-Voltage Insulator Materials in a Severely Polluted Coastal Environment. Ph.D. Thesis, University of Stellenbosch, Stellenbosch, South Africa, 2002. [Google Scholar]
- Chen, S.; Zhang, Z. Dynamic pollution prediction model of insulators based on atmospheric environmental parameters. Energies 2020, 13, 3066. [Google Scholar] [CrossRef]


© 2020 by the authors. Licensee MDPI, Basel, Switzerland. This article is an open access article distributed under the terms and conditions of the Creative Commons Attribution (CC BY) license (http://creativecommons.org/licenses/by/4.0/).