Abstract
This paper explores a way to apply Item Response Theory (IRT), one of the popular statistical methodologies in measurement and psychometrics, to evaluate Financial Transmission Rights (FTR) paths in the U.S. electricity market. FTR is an energy derivative product to hedge congestion cost risks inherent in constrained transmission lines. In New England, with about 1200 pricing locations, the theoretical combinations of FTR paths amount to 1.4 million in prevailing flows alone. With capital constraints, it is imperative that FTR market participants build the capability to evaluate FTR paths to bid on. IRT provides a framework of how well tests work, and how individual items work on tests, estimating respondents’ latent abilities, and individual item parameters. IRT is utilized to analyze historical electricity data of 2019 for a daily congestion cost of eight customer load zones and one hub in the U.S., New England, for the evaluation of FTR paths. In the analysis, an item represents an FTR path, while item difficulty, item discrimination, and a latent trait variable for the path correspond to the path profitability, risk level, and daily congestion ability, respectively. This paper explores the experimental procedures by which IRT, a psychometric tool, may also be applicable in complex energy markets, providing a consistent and standardized analytical framework to address the issues of selection and prioritization among multiple opportunities. FTR path evaluation is conducted in three steps to determine bid priority paths in FTR auctions: parameter significance tests, ranking on path profitability and risk level, and weighting scores of individual rankings on the two criteria.
1. Introduction
Financial Transmission Rights (FTR) is an energy derivative that allows market participants to receive an annual or monthly share of congestion cost revenues collected in settled electricity prices, or locational marginal price (LMP), by Independent System Operators (ISO) [1,2]. The ISO is a third-party organization to ensure electric systems reliability in generation resources and transmission lines. Congestion cost at a pricing location is a price difference between the least expensive electricity available in the ISO region and more expensive options due to transmission system constraints.
FTR holders are paid a congestion cost difference (credit) settled on a transmission path when it is positive (prevailing flow FTR) and must pay the difference (charge) when negative (counterflow FTR). The above FTR is called the FTR Obligation, compared to the FTR Option where FTR Option holders do not have to pay the difference even when the settled value is negative [1]. As of April 2020, FTR Option products are not available in ISO New England (ISO-NE) in the U.S., but exist in other electric markets, such as the Pennsylvania–New Jersey–Maryland Interconnection LLC (PJM Interconnection).
As FTR values are derived from the pairs of pricing locations in an electric market, the possible combinations of FTR paths could be very large, providing multiple FTR bidding opportunities for market participants. For example, ISO New England has an existing generating capacity of 31,200 MW from 1976 generators in its six member states, with a generation mix of natural gas (40%), nuclear (25%), net imports (19%), renewable (9%), and hydro (7%) [3]. According to the Day-Ahead Energy Market Hourly LMP Report for 14 April 2020 published by the ISO-NE, the total number of pricing locations in the region is 1192, comprising 1125 network nodes, 32 hub nodes, 20 demand response locations, 8 load zones, 6 external nodes, and 1 hub. The total pricing locations could theoretically be translated into 1.4 million FTR paths in the ISO auction for prevailing flows, and when added by counterflows, the total number could be doubled.
There are two types of FTR market participants: hedgers and speculators. Hedging participants, with electricity supply obligations, want to hedge against congestion costs by purchasing FTRs on the paths from their supply sources to their customer load zones, while speculating participants, without any physical supply obligations, may purchase FTRs to arbitrage differences between expected and actual settled values of FTR paths [1]. With such numerous choices of potential FTR paths available, FTR market participants need to reasonably evaluate which FTR paths to bid in the auctions, subject to their limited capital budgets. Consistent and standardized methodology is crucial in evaluating interested paths, in terms of profitability and risks associated with the paths.
Item Response Theory (IRT) is one of the most influential methods in the field of educational and psychological measurement, to understand the behaviors of individual test items or variables [4]. IRT models provide information about item parameters and latent traits of test respondents, helping gain insights and assessments about their performance as well as the items. It is also useful for test development, item analysis, equating, item banking, and computer aided test (CAT) [5]. As a group of statistical models with probabilistic and stochastic procedures, IRT connects the pattern of responses to a group of items to predict a latent trait/ability, and then, converts discrete item responses into the levels or locations of probability estimates which respondents possess underlying the latent trait [6,7].
The most basic model is the One-Parameter Logistic model (1PL), or the Rasch model named after Georg Rasch, a Danish mathematician. In the model, the probability of correct response (denoted as Xi = 1) to each item (labeled i) is a function of the item’s difficulty level (labeled bi) and the respondent’s trait level (labeled θ), with a mathematical expression as in Equation (1) [7]:
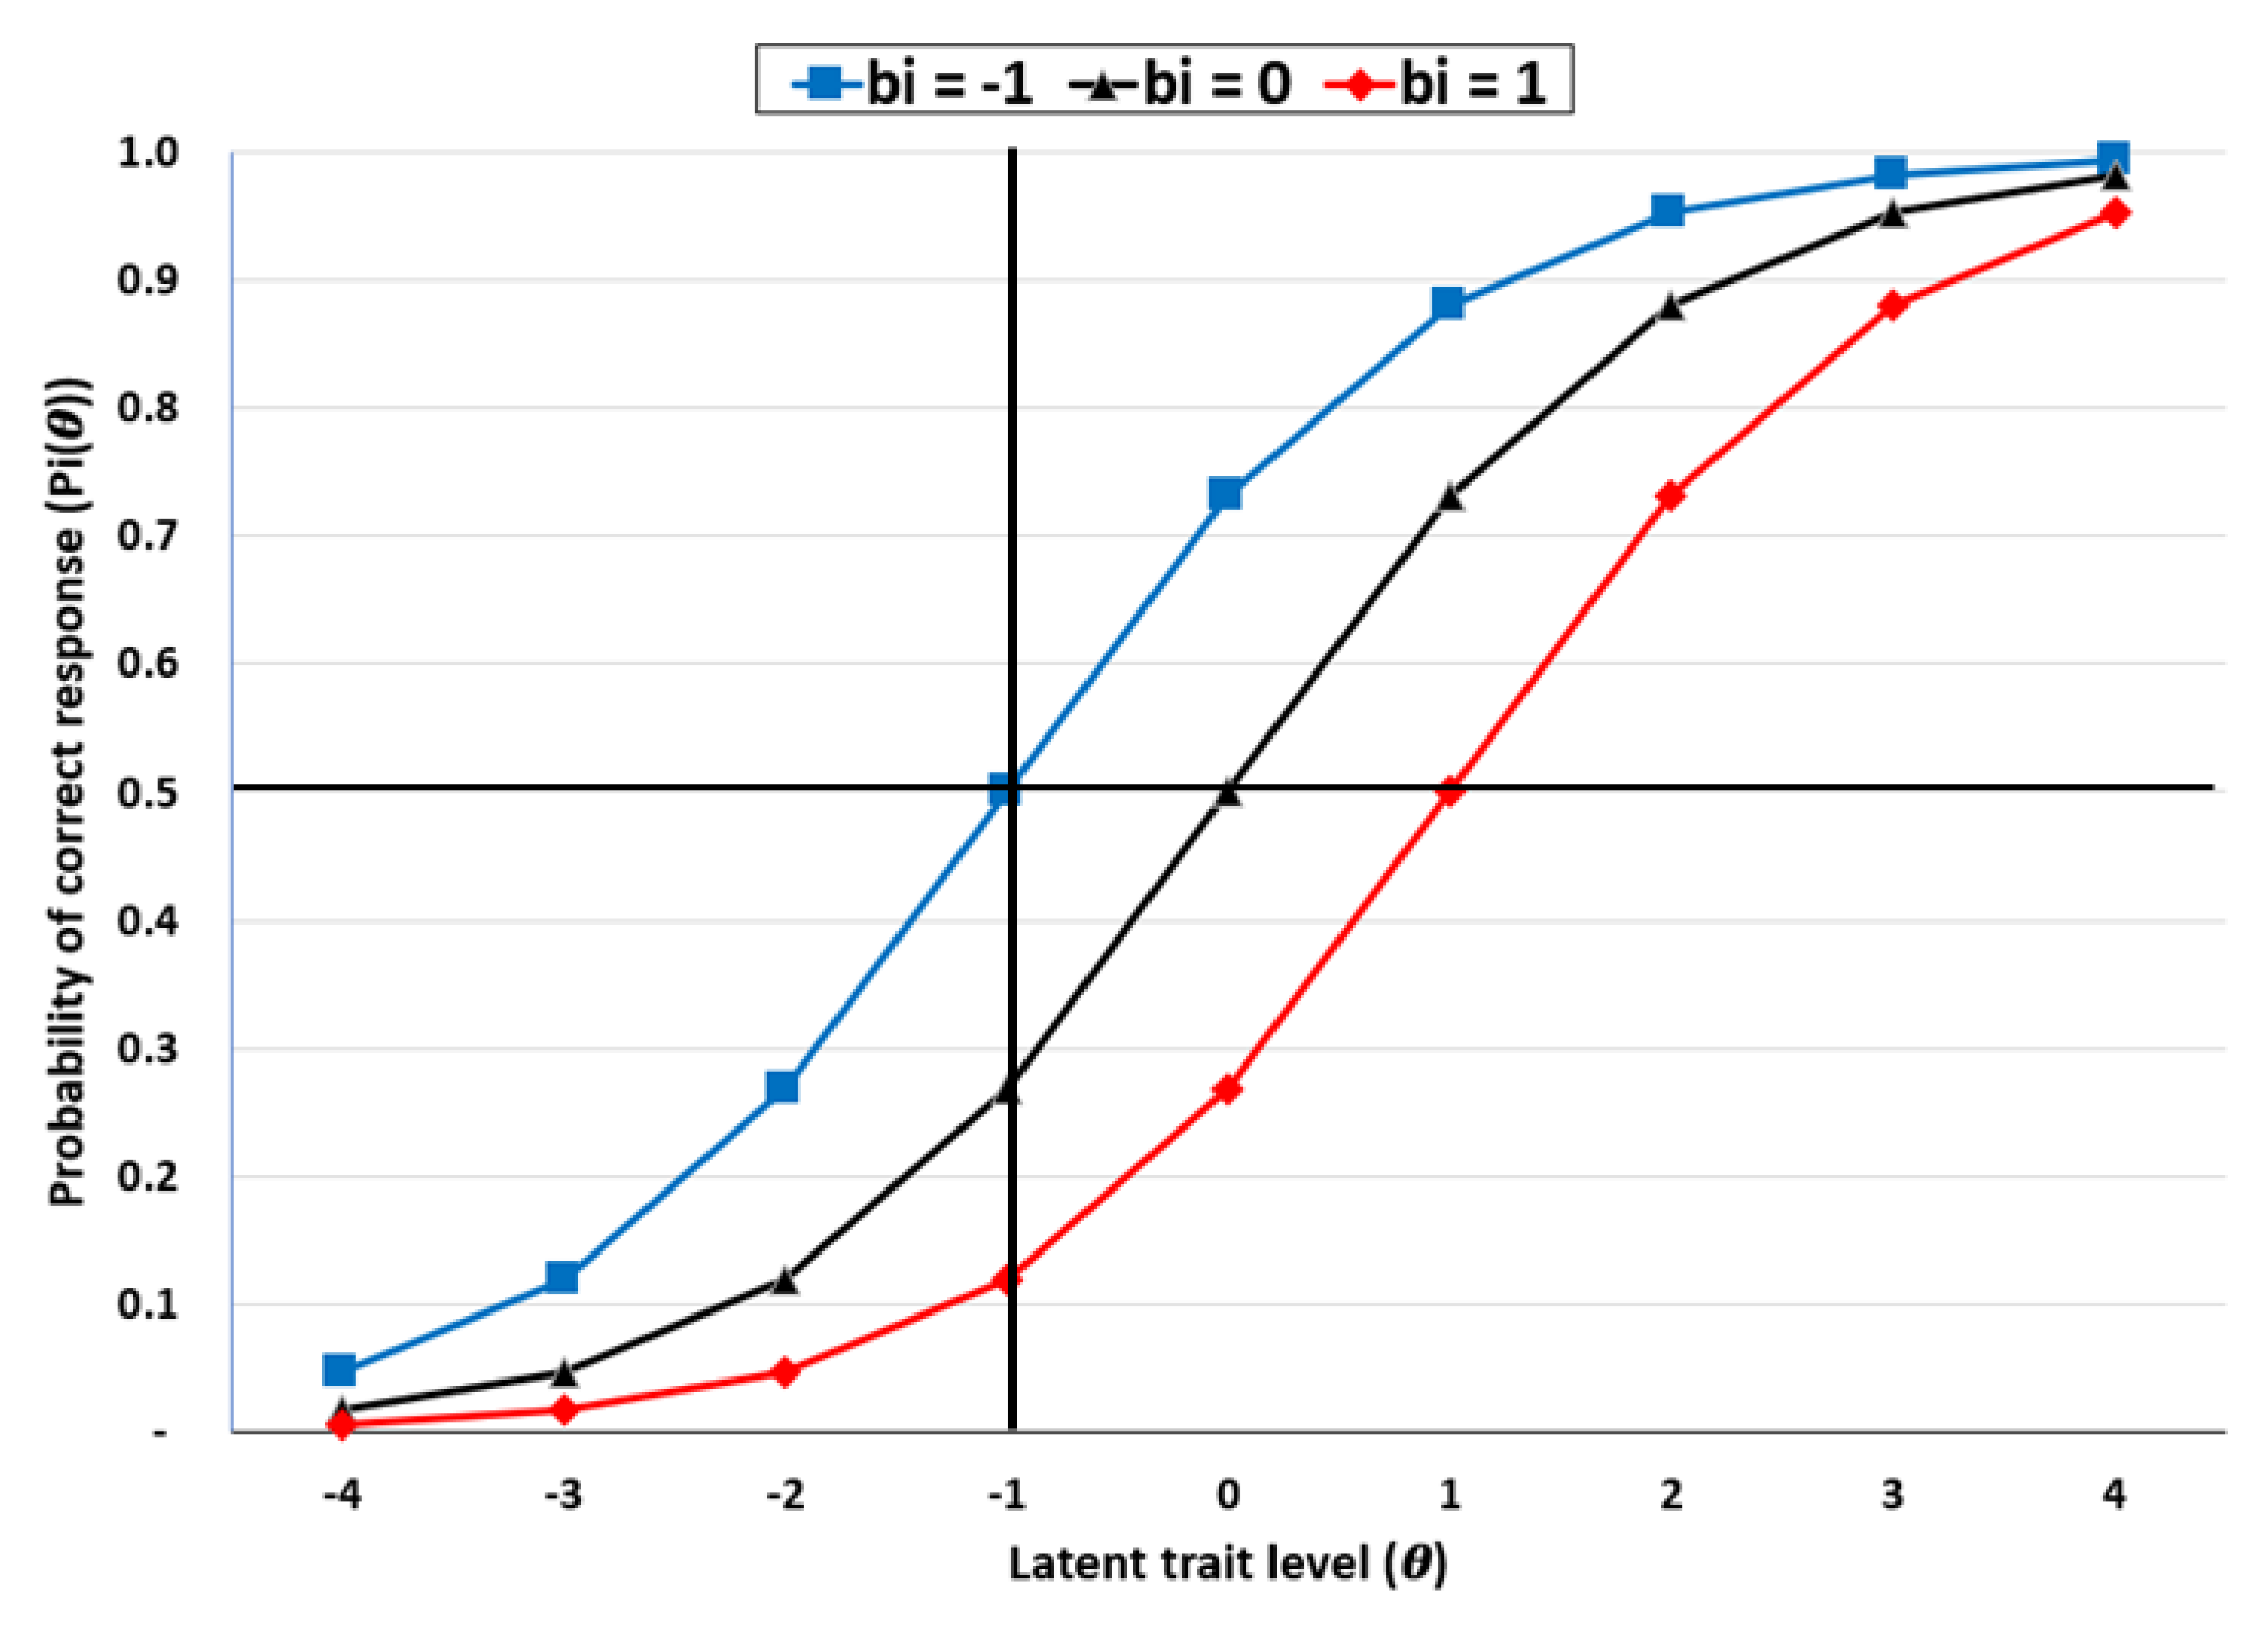
In the Equation (1), Xi = 1 indicates that a respondent endorsed an item i or provided a correct response. A horizontal line at Pi(θ) = 0.5 on the y-axis in Figure 1 denotes a mid-probability of the correct response to item i being correct. That is, it indicates that the respondent has 50% chance of providing a correct response to the item. The difficulty coefficient (bi) of an item are the value of a latent trait level (θ) on the x-axis which is an intersection point between the mid-probability, shown on the horizontal line, and an individual characteristic curve (ICC) of the item. Figure 1 illustrates three items in Rasch 1PL model, with the values of difficulty coefficients with bi = −1, 0, and 1. Both the latent trait level (θ) and difficulty coefficient (bi) are on the same z-score metric, with the latent trait level (θ) typically in the range of [−2, 2] [6].
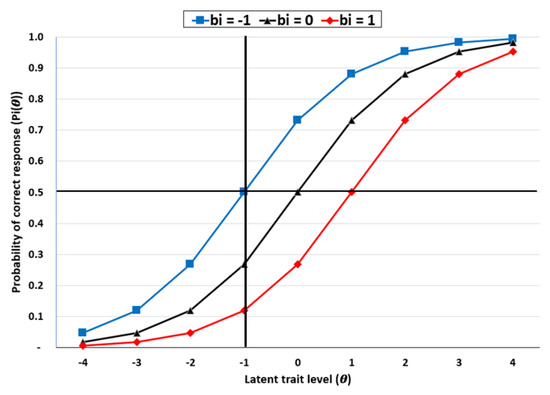
Figure 1.
Item characteristic curves, Item Response Theory (IRT) 1PL model.
IRT models are logistic regression models to predict dichotomous, or binary, outcomes, with a monotonically increasing S-shaped curve, called the Item Characteristic Curves (ICCs) [8]. ICCs display the relationship between a latent trait level and the probability of correct response. Figure 1 illustrates three ICCs of probability of correct response (Pi (θ)), with assumptions of three items’ difficulty parameters of −1, 0, and 1, respectively, given a range of the latent trait levels [−4, 4]. This paper will use the term latent trait and ability interchangeably in describing the IRT and its application to FTR path evaluation in the U.S. electricity market.
The ICCs in Figure 1 may be interpreted such that an item is more difficult to the right of the chart, and easier to the left of the chart, and that low Pi(θ) of the item implies highly unlikeliness of providing correct responses at a given latent trait level [7]. For example, in Figure 1 at the level of −1 for the latent trait (θ), the probability of correct response varies with each of the three items, 50%, 27%, and 12% as indicated on a vertical line on the Figure 1.
While IRT is popular in the psychometrics discipline, there have been several studies on the applications of the IRT theory in the fields of health behavior research [6,7], as well as in financial literacy measurement [9]. The Two-Parameter Logistic model (2PL) is an extension of the Rasch 1PL model, with additional parameter of an item’s discrimination parameter. Item discrimination represents how well an item differentiates among respondents on the latent trait continuum, e.g., differentiating respondents of different ability levels. The IRT 2PL model and ICCs will be discussed in greater detail later in this study.
In summary, the IRT 2PL model provides analytical advantages in terms of parameter parsimony, easier parameter interpretation, distinguishability among multiple items, and visual presentation. The parameters, difficulty (bi) and differentiation (ai), may be derived from historical data observation, and the magnitude of the parameters may be used to easily interpret how difficult or different each item is relative to other items. The parameters also provide a foundation to build the probability function of a right response (Pi (θ) or Pi(Xi = 1|θ) in visual presentation of ICCs on a level of latent trait variable (θ). When there are multiple opportunities available in the marketplace, essential decision-making factors involve estimation and comparison of their return and risk profiles. With such capability, IRT may be applied to FTR markets, where the astonishing number of paths are available, 1.4 million paths in U.S. New England ISO alone, and a consistent and standardized evaluation model is required for FTR participants to understand return and risk profiles of path they are interested in.
This paper is the first experiment to apply IRT, particularly the IRT 2PL model, to the U.S. energy market, in evaluating and selecting the FTR paths to bid in market auctions. This paper is organized as follows: Section 2. Literature Review; Section 3. Data and Methodology; Section 4. Results and Discussion; and Section 5. Conclusion and Implications.
2. Literature Review
2.1. Financial Transmission Rights
The first FTR auction took place in 1999, in the PJM Interconnection in the U.S. In the auctions, ISOs have a goal of maximizing FTR revenues, subject to the constraints of transmission capacity and contingencies [10]. Electric suppliers calculate FTR values of the paths to bid, based on their own forecasts of future LMP prices in the interested locations. The FTR calculation may have analytical frameworks of game theoretic models, with multiple participants, or network contingencies in the ISO systems [11,12].
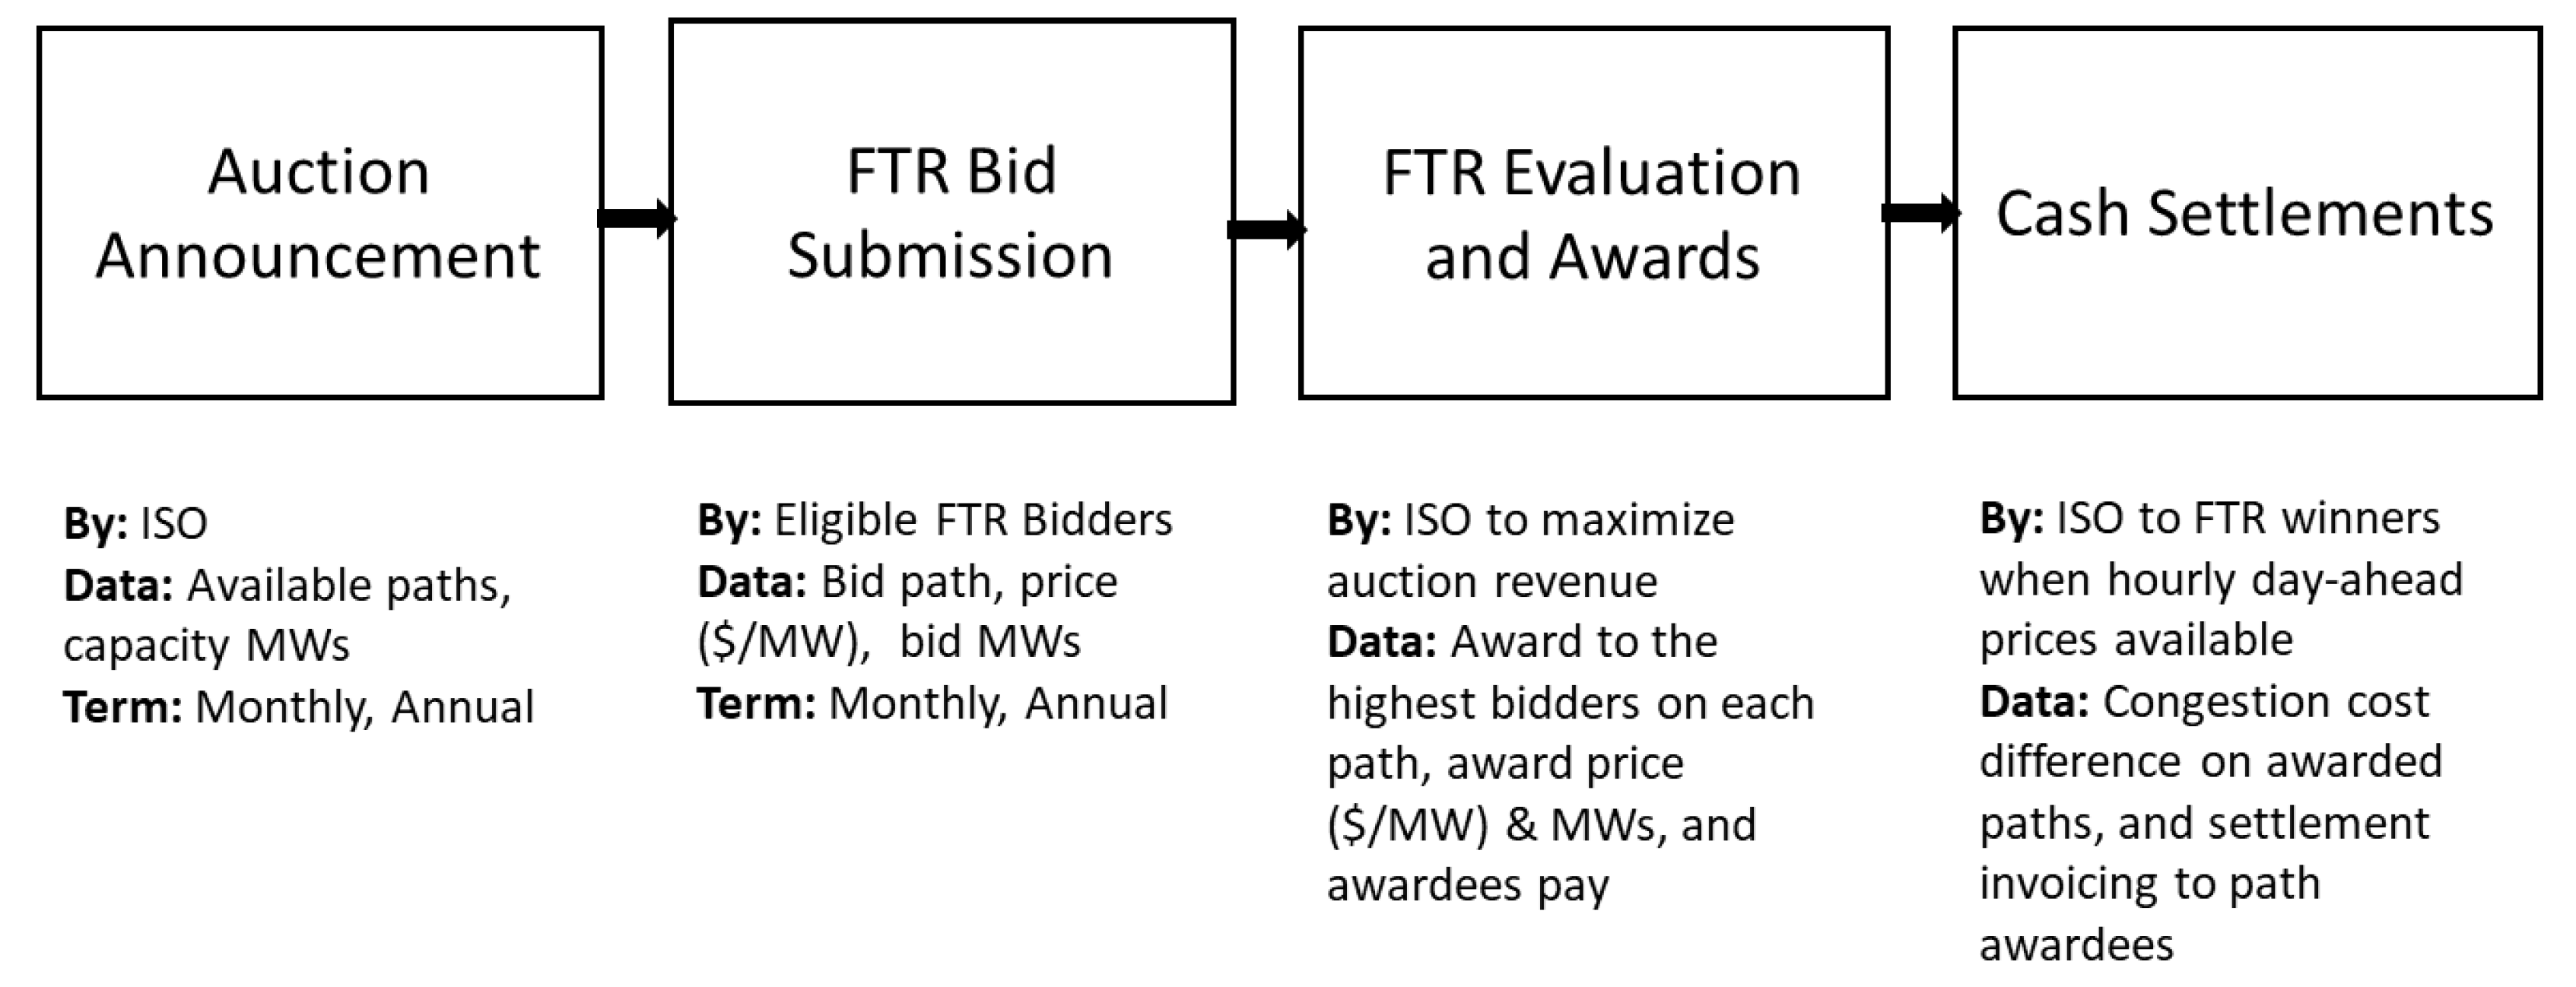
FTRs are defined in U.S. Dollar ($) per mega-watts (MWs), from a source (receipt, inject) pricing point to a sink (delivery, withdrawal) pricing point on a transmission line path. In New England, FTR products are offered in monthly and annual auctions, for two categories, onpeak hours (weekdays hours ending 0800–2300) and offpeak hours (weekdays hours ending 2400–0700, and 24 h on weekends and NERC holidays). Available pricing locations in ISO-NE include generator nodes, external nodes, hub (specified set of predefined pricing nodes), load zones (aggregate of pricing nodes in a specific area), and DRR (demand response resources) aggregate zones [13]. Figure 2 presents a flow chart that summarizes typical FTR auction procedures involving several entities in terms of exchanging data and information [13].

Figure 2.
Financial Transmission Rights (FTR) auction flow chart.
FTR auction results in ISO-NE provide the magnitude of the auctions and major FTR participants [14]. For the April 2020 auction, a total of 5625 FTR paths were cleared, with onpeak at 2719 and offpeak at 2906, on a total of 25,586 MWs. There was a total of 28 FTR winners, with the top five companies accounting for 71% of total MWs cleared: NextEra Energy Marketing, Vitol, MAG Energy Solutions, Exelon Generation, Transgrid Midwest. In the annual FTR auction for 2020, the number of cleared FTR paths was 3348 (onpeak 1593 and offpeak 1755), on a total of 17,514 MWs, onpeak and offpeak combined. The top five participants accounted for 75% of total MWs cleared: Vitol, Mercuria Energy America, Castleton Commodities Merchant, Citigroup Energy, NextEra Energy Marketing.
ISO operates the wholesale electricity market that consists of two markets, Day-Ahead Market (DAM) and Real Time Market (RTM). DAM is a forward sport market, where DAM LMP are settled in day-ahead auctions. Generators submit offers, and customer loads submit bids to the ISO with hourly MWs for each hour of the next day. The ISO calculates a nodal price, or a locational marginal price (LMP) of a location, based on all the submitted offers and bids, subject to the Lagrange multipliers, or constraints of active power balance and transmission [10].
Settled LMP is made up of three components, energy, congestion cost, and loss [15]. Congestion cost is created by binding constraints of transmission lines and generation resources in the auction, resulting in incremental cost for some points and different LMPs. FTR is the difference in the congestion cost component of the LMPs between two locations. RTM is a balancing market to DAM that addresses actual power systems and generated MWs. Energy sellers in DAM get paid real time prices for the MWs generated in real time over the MWs sold in day-ahead market with cleared DAM prices [16].
There is uncertainty in future LMPs that may be significantly different from the LMPs that FTR market participants expected when estimating the values of FTRs for bidding. In this context, FTR holders may face the risks of liability at the time of LMP settles, due to counterflows on the awarded paths, unexpected outages, severe economic congestions, and transmission losses [17]. Load serving utilities (LSE) or suppliers to retail customers are exposed to major risks of LMP, comprising energy (fuel), transmission constraint cost at a given time, and line losses. The transmission constraint cost may be called a transmission opportunity cost, or difference between the clearing LMPs on a given path [18]. Other reliability services costs include capacity for adequate resources, and ancillary services to maintain the electric systems.
In this context, the biggest challenge for FTR participants is how to simulate market participants’ behavior [10], as well as to calculate expected FTR payoffs and financial risks associated with the FTR path [19]. A realistic view is that it is practically difficult to formulate all the electricity prices and market behaviors, given thousands of pricing nodes available in the ISO [11]. Due the complexity of predicting clearing LMPs and estimating the value of FTR derivative product, the research studies that addressed FTR bidding strategies usually involved simulation approaches or problem formulation with a limitation of two to four pricing nodes [10,19].
There have been some studies related to FTR from bidder and generator standpoints, but none of them addressed the question of how to evaluate and select FTR paths to bid among multiple choices. Hogan [18] also noted that the U.S. energy market design has been successful with bid-based LMP and FTRs, but still has remaining challenges with both theory and implementation.
Li and Shahidehpour [19] illustrated a three-bus system with four FTR bidders, subject to the ISO’s goal of maximizing auction revenues, as well as the impacts of transmission constraints, forecasted LMP differences, and bidder’s risk tolerance on FTR bidding strategies. Das et al. [12] experimented with a matrix-game model to analyze FTR bidding strategies. This study involved multiple FTR participants on a sample network, with assumptions that bidders have forecasts of LMPs, and assessed impacts of various bid prices.
From a power plant generator’s perspective, Liu and Wu [11] investigated an FTR position by exploring the interaction between generator’s bidding and transmission rights holding. The study suggested that transmission rights helped reconfigure a generator’s behavior in bidding their electricity into the ISO. Liu and Gross [20] proposed a way, based on simulation approaches, to integrate bi-lateral transaction with a centralized pool market, or ISO, for the efficient allocation of transmission services affecting FTR evaluations.
2.2. Item Response Theory in Psychometrics
IRT model has been developed as a new way of data analysis for categorical data to measure a latent trait variable (also called ability, denoted as θ), as well as to model the item responses (Xi) of respondents. The data may be dichotomous (binary) or polytomous [4,21]. Major assumptions in the IRT models include monotonicity of the latent trait variable and the probability of an item correct response, unidimensionality of measuring one single latent ability with a set of items, and local independence among the item responses.
There are basic IRT parameter logistic models: Rasch 1PL (1-parameter logistic model) and 2PL (2-parameter), depending on the number of parameters used in modeling for items, and a parameter of a single latent variable underlying the item responses of a respondent [21]. Two basic parameters in IRT are item difficulty (bi, location index), and item discrimination (ai, differentiation). A latent trait (ability, θ) parameter is a construct or a factor measured by the item responses.
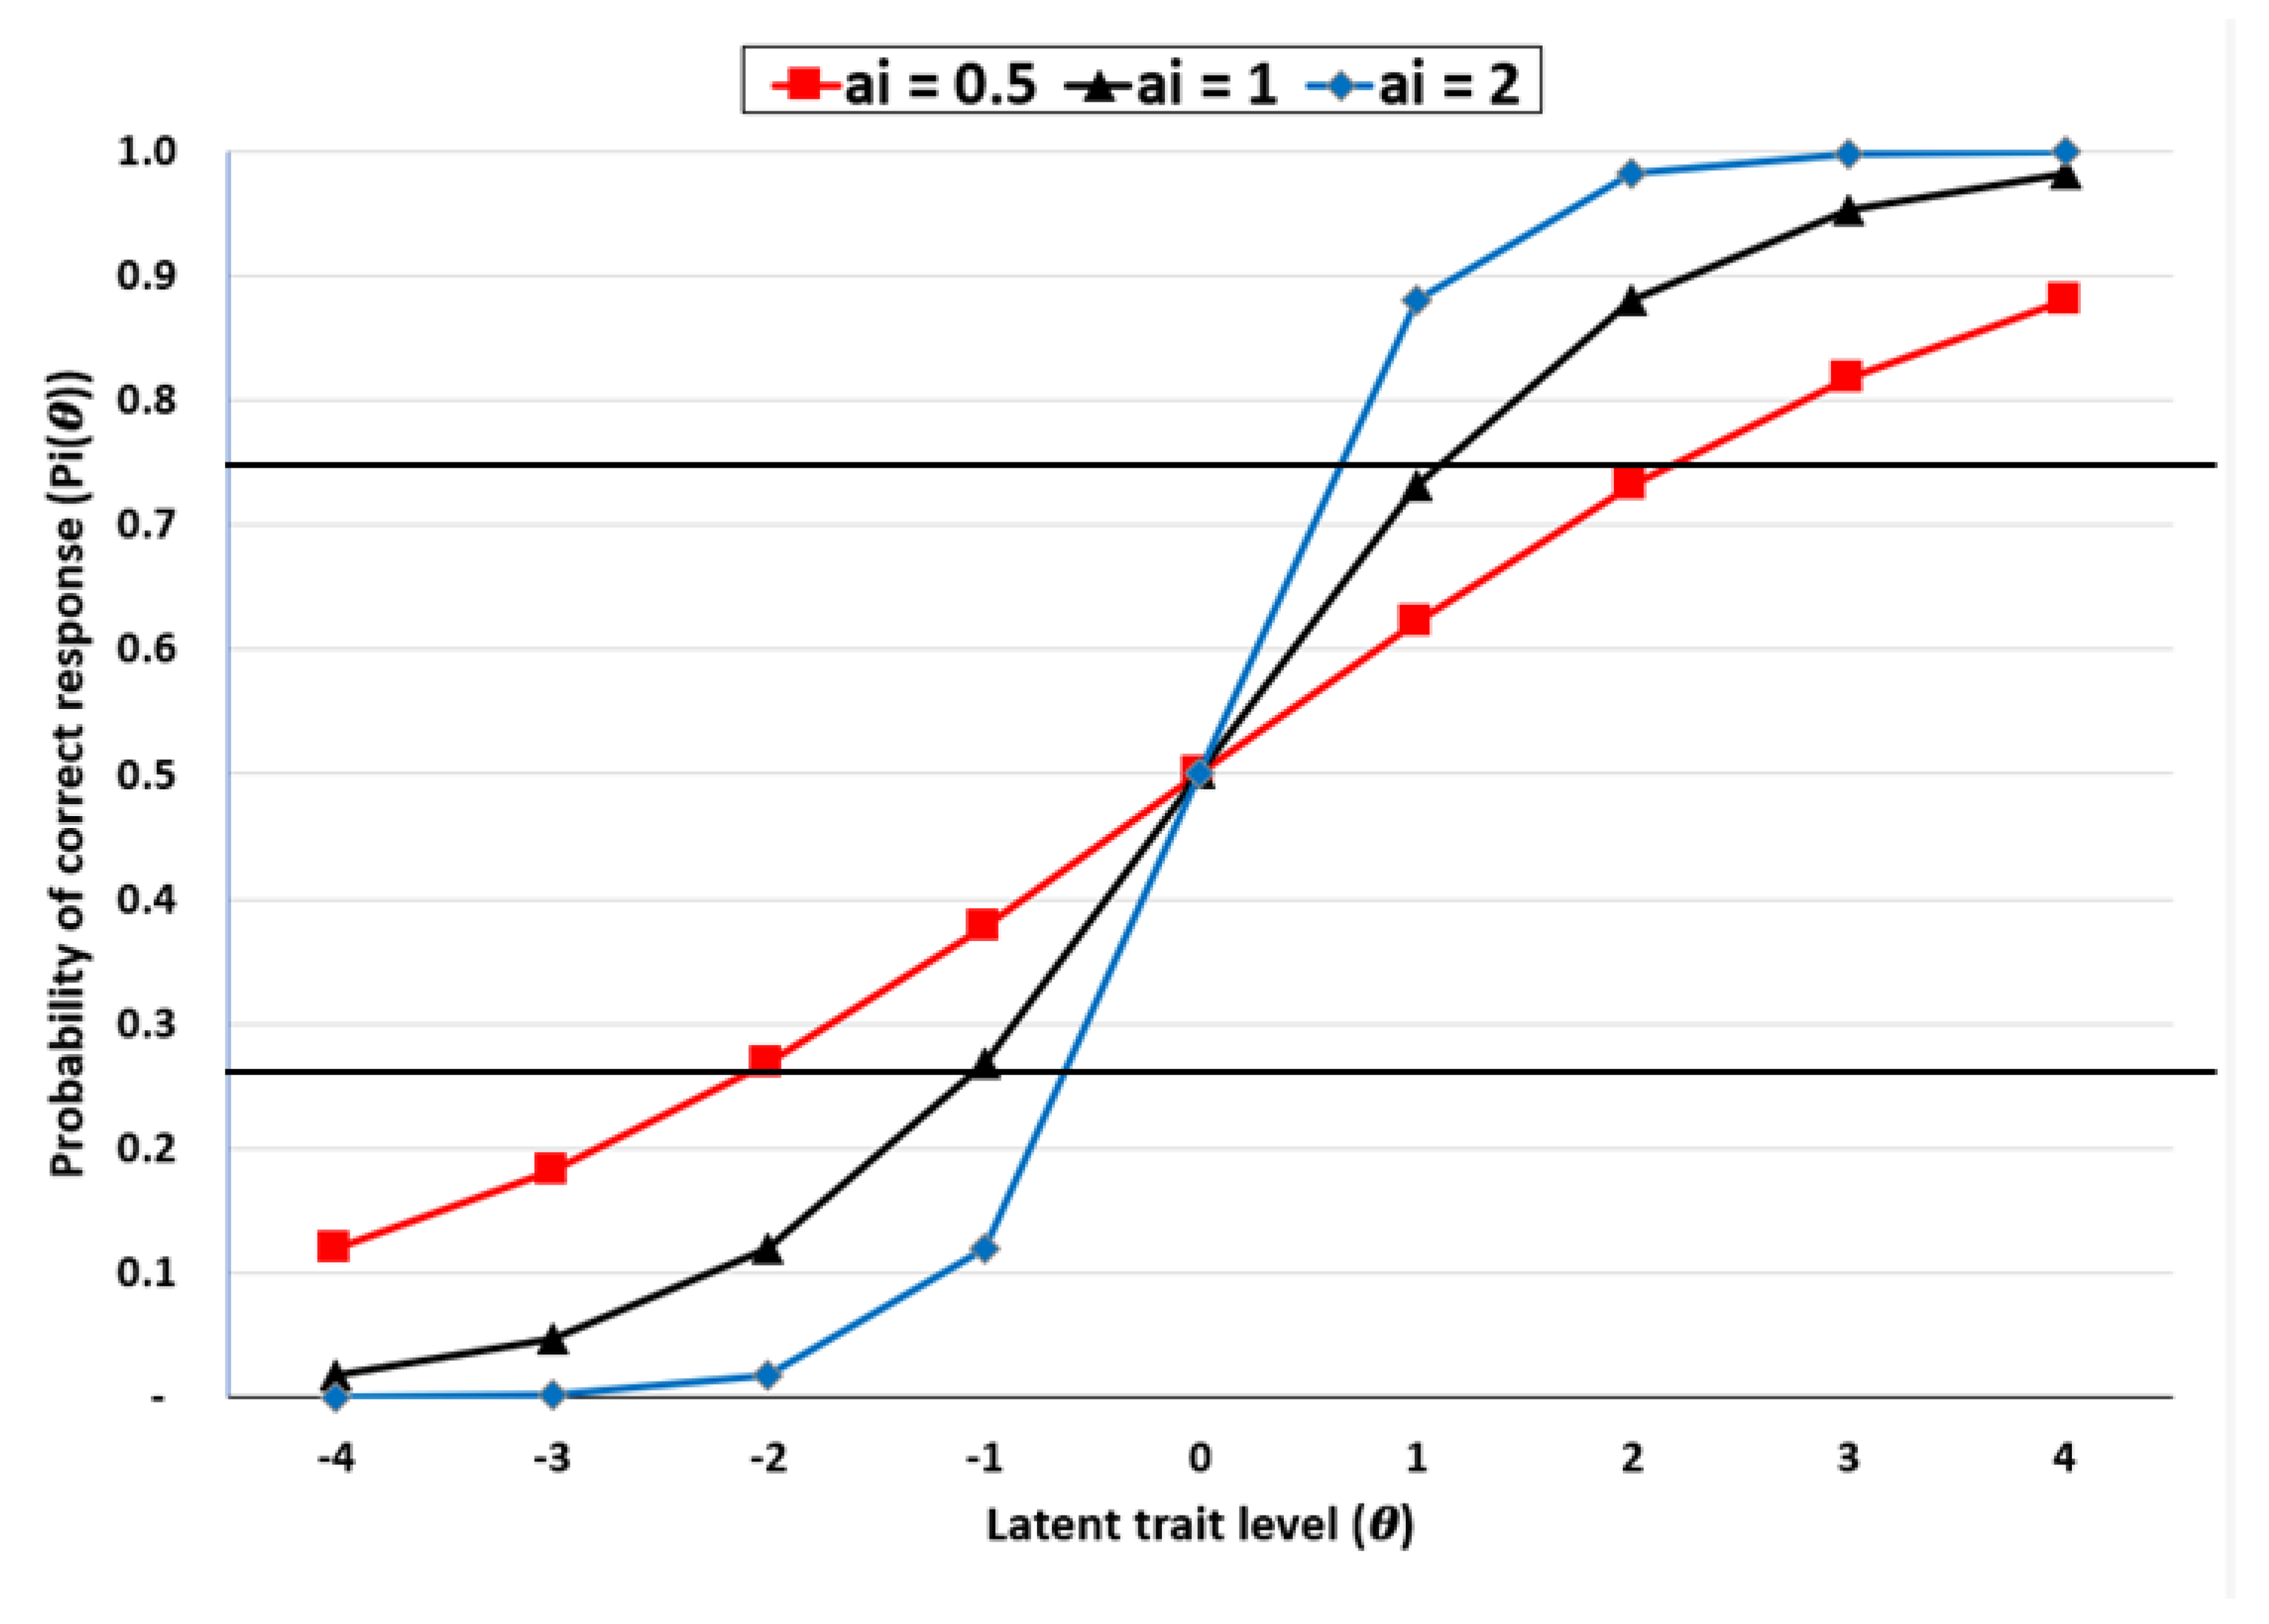
Further to the Rasch 1PL model described in Equation (1) and Figure 1, 2PL model is introduced here as an extension of 1PL. The IRT 2PL model has one more parameter, discrimination (ai), than the Rasch model, and may be interpreted in a way that the higher discrimination (ai) of an item is, the more discriminating the item is with a steeper slope on an ICC. Conversely, a flatter ICC of an item indicates the item is less likely to discriminate among respondents than other items. The discrimination coefficient (ai) typically takes the value of [−0.5, 2] [6].
The IRT 2PL model is expressed as in Equation (2):
where exp (e) is the constant 2.718, bi = difficulty parameter for an item i, ai = discrimination parameter for an item i, and θ = ability level.
Figure 3 presents an illustration of 2PL-based item characteristic curves (ICCs) for three items, built on Equation (2). It displays the impacts of varying discrimination coefficients of a = 0.5, 1, and 2 for three items, given a latent trait level, and the same difficulty coefficient (bi) of 0 for all items. Item discrimination parameter represents a slope on an inflection point of each ICC. As the discrimination coefficients (ai) describe a sharp distinction between respondents to each item, the corresponding latent trail levels (θ) also vary in a given range of probability of correct response (P(θ)) from 25% to 75%, as referenced in two horizontal lines. When discrimination coefficient (ai) = 0.5, the range of the trait (θ) is [−2.1, 2.1], at a = 1, the range is [−1.3, 1.3], and at a = 2 the range is narrower to [−0.8, 0.8]. The results indicate that a greater discrimination coefficient (ai) produces a tighter range of a latent trail level (θ) with a steeper slope, and more discrimination power among the respondents between lower and upper groups.
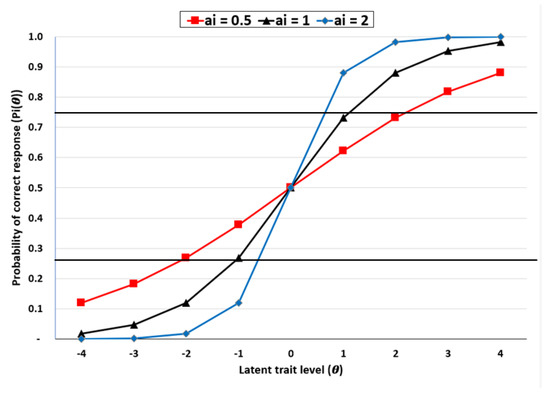
Figure 3.
Item characteristic curves, IRT 2PL model: difficulty coefficient b = 0 for all items.
While there are more advanced IRT models to add a feature of weighting scores in survey responses in education and psychology [22], there have been applications of IRT in other disciplines of health care and financial sectors. Hays et al. [6] experimented IRT models in health outcome measurements. Their study involved analysis of the 9-item measure from study participants in the HIV Cost and Services Utilization Study (HCSUS) [23]. The 9-items included physical functioning, including basic activities, instrumental activities, and mobility, in the past four weeks, and interpreted the difficulty parameter (bi) and discrimination parameter (ai) of each activity in terms of physical functioning level and distinction among the activities.
Warne et al. [7] introduced the IRT 2PL model to health behavior research on life-time substance-use data from the Adolescent Risk Health Behavior Questionnaire [24]. The study analyzed 1,360 responses on health behaviors related to 23 substance items, i.e., alcohol, tobacco, and other drug use, and interpreted difficulty parameter (bi) of each substance as the likelihood that a respondent had tried it. The difficulty parameters (bi) of the substances helped identify two groups of substances that respondents are likely to endorse. Himefarb [25] also introduced IRT models to chiropractic and health educators as a standard way of standardized assessments in their practice
In financial sector, Knoll and Houts [9] developed a measure of financial knowledge components in financial literacy by applying the IRT 2PL to narrow down the items from three national surveys: the ALP, a RAND-managed Internet-based panel, The Health and Retirement Study (HRS) conducted by the University of Michigan since 1992, and The National Survey (NS-NFCS) portion of the 2009 National Financial Capability Study. The study suggested that the index based on their selected twenty items would be useful to compare financial knowledge among programs and populations.
3. Data and Methodology
3.1. Data
Historical electricity price data is collected from the pricing reports of ISO New England Inc. (https://www.iso-ne.com/isoexpress/web/reports/pricing/-/tree/zone-info), where historical Standard Market Design (SMD) hourly data files are available for LMP by month and year. This paper used a file of 2019 SMD Hourly Data in the reports for analysis.
Each spreadsheet in the file has price information for eight zones and one hub, including hourly LMPs, the components of energy, congestion cost, and marginal loss, as well as hourly demand and weather. This research will use the DAM congestion costs because an FTR value is settled at the DAM. Besides, hourly prices will be broken down to two categories, onpeak and offpeak. Analysis focus will be on daily onpeak prices only, with onpeak hours being from hours ending 0800 to 2300 during weekdays, while offpeak hours include hours ending 2400 to 0700 during weekdays and all 24 h during weekends and NERC holidays.
3.2. Methodology
ISO New England has one internal hub and eight customer load zones in its six member states. The trading hub, called Massachusetts Hub (MassHub), is actively traded at electricity futures markets. Market hedging participants are interested in the FTRs between the MassHub, a liquid pricing point, and a customer zone that they are obligated to serve, while speculators look to capture any arbitrage opportunities associated with active pricing locations. In this context, this creates eight FTR paths, with Massachusetts Hub as a source pricing point and each of the eight customer zones as a sink pricing point. The number of Massachusetts Hub-related FTRs awarded in 2020 annual auction was significant at 276 (as a source), or 8% of total paths, and at 165 (as a sink), while the number for April 2020 auction was 332 (as a source), or 2% of total, and 313 (as a sink) (https://www.iso-ne.com/isoexpress/web/reports/auctions/-/tree/auction-results-ftr).
The eight customer load zones for analysis designated as sink points, are: northeastern Massachusetts (NEMA), Vermont (VT), New Hampshire (NH), Maine (ME), Rhode Island (RI), Southeast Massachusetts (SEMA), Connecticut (CT), and West/Central Massachusetts (WCMA), with Mass Hub being a source point. Figure 4 presents a map of the eight load zones, and hourly day-ahead LMP prices for the zones, Mass Hub, and import interface locations. (Sources: https://www.iso-ne.com/about/key-stats/maps-and-diagrams/ and https://www.iso-ne.com/isoexpress/web/charts).
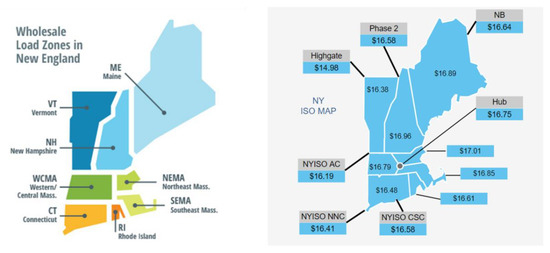
Figure 4.
Eight load zonal map (left); and hourly day-ahead LMP Prices for zones, hub, and import interface locations (right). Reprinted with permission from ISO New England.
The R-software package was used to build the IRT model, and the analysis package is “ltm” package, or Latent Trait Models under IRT Analyses, dated 17 April 2018. The detail and functions are available on https://cran.r-project.org/web/packages/ltm/ltm.pdf.
In this study, an item (i), or a variable in IRT, is an FTR path for analysis to evaluate the profitability and risk levels of the FTR path relative to other candidate paths. Hourly FTR path values for each path during each of onpeak hours are first calculated as the difference between congestion costs at Massachusetts Hub and each of customer delivery zones, and then summarized as average FTR values for each of the onpeak days in 2019. When the average daily FTR values on each path is positive, it is coded as 1, else 0, to build a dichotomous variable as an item response (Xi).
The binary FTR value (Xi) of 1 in this analysis represents positive profitability of an FTR path on an onpeak day. Analysis will begin with data summary statistics of the eight FTR paths in binary format (0, 1), or from Mass Hub to each customer load zone. Each onpeak date is treated as an individual respondent identifier (ID) in this analysis. In 2019, there were 255 onpeak days, resulting in 255 IDs, and daily binary items (FTR profitability) of all the eight FTR paths may be used to derive a latent trait variable (ability, θ). A latent trait (ability) will be labeled as congestion ability.
The IRT 2PL model, as specified in Equation (2), is used to estimate difficulty coefficient (bi), discrimination coefficient (ai), as well as to build the ICCs. The ICC, that is, Pi (θ) or Pi(Xi = 1|θ) derived from the Equation, will provide visual comparisons of path profitability and risk levels, based on the parameters (bi, ai) and congestion ability level (θ) in the range of [−4, 4].
Item difficulty coefficient (bi) will represent profitability in this paper for each FTR path, and be interpreted that the greater the coefficient, the lower profitability, or vice versa. The item discrimination coefficient (ai) will represent the risk level of an FTR path, translating into the level of differentiating among candidate FTR paths on different congestion levels. The greater the discrimination coefficient for an FTR path, the wider the FTR value distribution is, indicating riskiness itself of an FTR path. The two parameters will be compared among the paths, to evaluate and select bidding paths in FTR auctions. Congestion ability (θ) refers to an underlying latent trait measured by daily responses to each FTR path, and it may be interpreted as a daily congestion ability. The parameter would indicate how often congested transmission situation took place in daily electricity market, potentially resulting in creating more congestion cost difference or values on FTR paths.
4. Results and Discussion
4.1. Summary Statistics for Eight FTR Paths
Table 1 summarizes proportions of positive profits, or FTR profitability days, for eight FTR paths, from the Mass Hub to each customer load zone, during 255 onpeak days in 2019. Among the eight FTR paths, two FTR paths of MassHub_RI (0.2392 and MassHub_SEMA (0.2235) took the lead in FTR profitability days, with FTR paths of MassHub_VT (0.0392) and MassHub_WCMA (0.0431) at the bottom. Notably, standard deviations were also the greatest on the top two FTR paths with about 0.42, while the rest of FTR paths stayed in the range of 0.20 to 0.28. In other words, sink points in Rhode Island and Southeast Massachusetts, sourcing electricity from Massachusetts Hub, recorded profits at 23.9% and 22.4% of onpeak days in 2019, while the profitability distribution is wider than other zones, as indicated by their higher standard deviations.

Table 1.
Summary statistics of profitable onpeak days for FTR path in 2019.
4.2. IRT 2PL Model Results
Table 2 presents a summary of estimated coefficients of FTR profitability (difficulty, bi) and risk level (discrimination, ai), estimated by the IRT 2PL model. As a smaller difficulty coefficient on an FTR path represents the greater probability of profitability, the FTR paths, MassHub_RI (0.56) and MassHub_SEMA (0.61), showed the highest profitability among the eight candidate paths, with the least profitable paths of MassHub_VT (3.67) and MassHub_WCMA (3.32). These profitability results are consistent with the results of proportions of positive profits, as shown in Table 1. Item discrimination coefficient, a measure of risk level in this paper, is also the greatest on the two FTR paths, MassHub_RI (26.80) and MassHub_SEMA (26.25), implying higher risks than other paths. The two paths with the smallest discrimination coefficients were MassHub_VT (0.92) and MassHub_WCMA (1.00), implying the least risks among all the candidate paths.
Table 2.
2PL model—path difficulty (profitability) and discrimination (risk) coefficients.
The two zones of Rhode Island and Southeast Massachusetts, as sink points from Massachusetts Hub, recorded the highest profitability, and at the same time, the highest risk profiles, representing high-return, high-risk opportunities. On the other hand, the least risky sink zones, Vermont and West/Central Massachusetts, from Massachusetts Hub, did not necessarily display the highest profitability.
When parameters of difficulty (profitability, bi) and discrimination (risk level, ai) are estimated from IRT 2PL model, the estimates need to be tested if they are different from 0. This research designed the priority ranking system to evaluate FTR paths, after accounting for statistical significance of the two parameter estimates, FTR profitability (bi), and FTR path risk level (ai).
First, the p-value criteria of statistical significance at the 0.05 level, for difficulty and discrimination coefficients are compared. Two FTR paths, MassHub_RI and MassHub_SEMA, are not statistically significant at the 0.05 level, meaning that the difficult and discrimination estimates could be unreliably zero, and be excluded for further evaluation. Table 3 presents a summary of evaluation processes, after exclusion of two insignificant paths, to determine bidding priority among FTR paths.
Table 3.
Evaluation processes to determine bidding priority among FTR paths.
The second step is ranking the remaining six FTR paths with the difficulty and discrimination coefficients. The FTR paths are ranked by two individual categories, in the ascending order of the two individual coefficients, since the lower difficulty of an FTR path stands for higher profitability and lower discrimination for less risk level, as shown columns of “rank by (bi) and rank by (ai)” in Table 3. As an FTR auction bidder, more profitable and less risky paths are favorable target paths to bid on.
The third and last step is to obtain weighted scores of the two ranks of each path, in this example, 60% for profitability (difficulty, bi) and 40% for risk level (discrimination, ai), laying the foundation to determine FTR bidding priority for the candidate paths. As a result, the FTR bidding priority is set up in the ranking order of the paths: MassHub_ME, MassHub_NEMA, MassHub_NH, MassHub_WCMA, MassHub_VT, and MassHub_CT.
4.3. Item (Path) Characteristic Curves (ICCs)
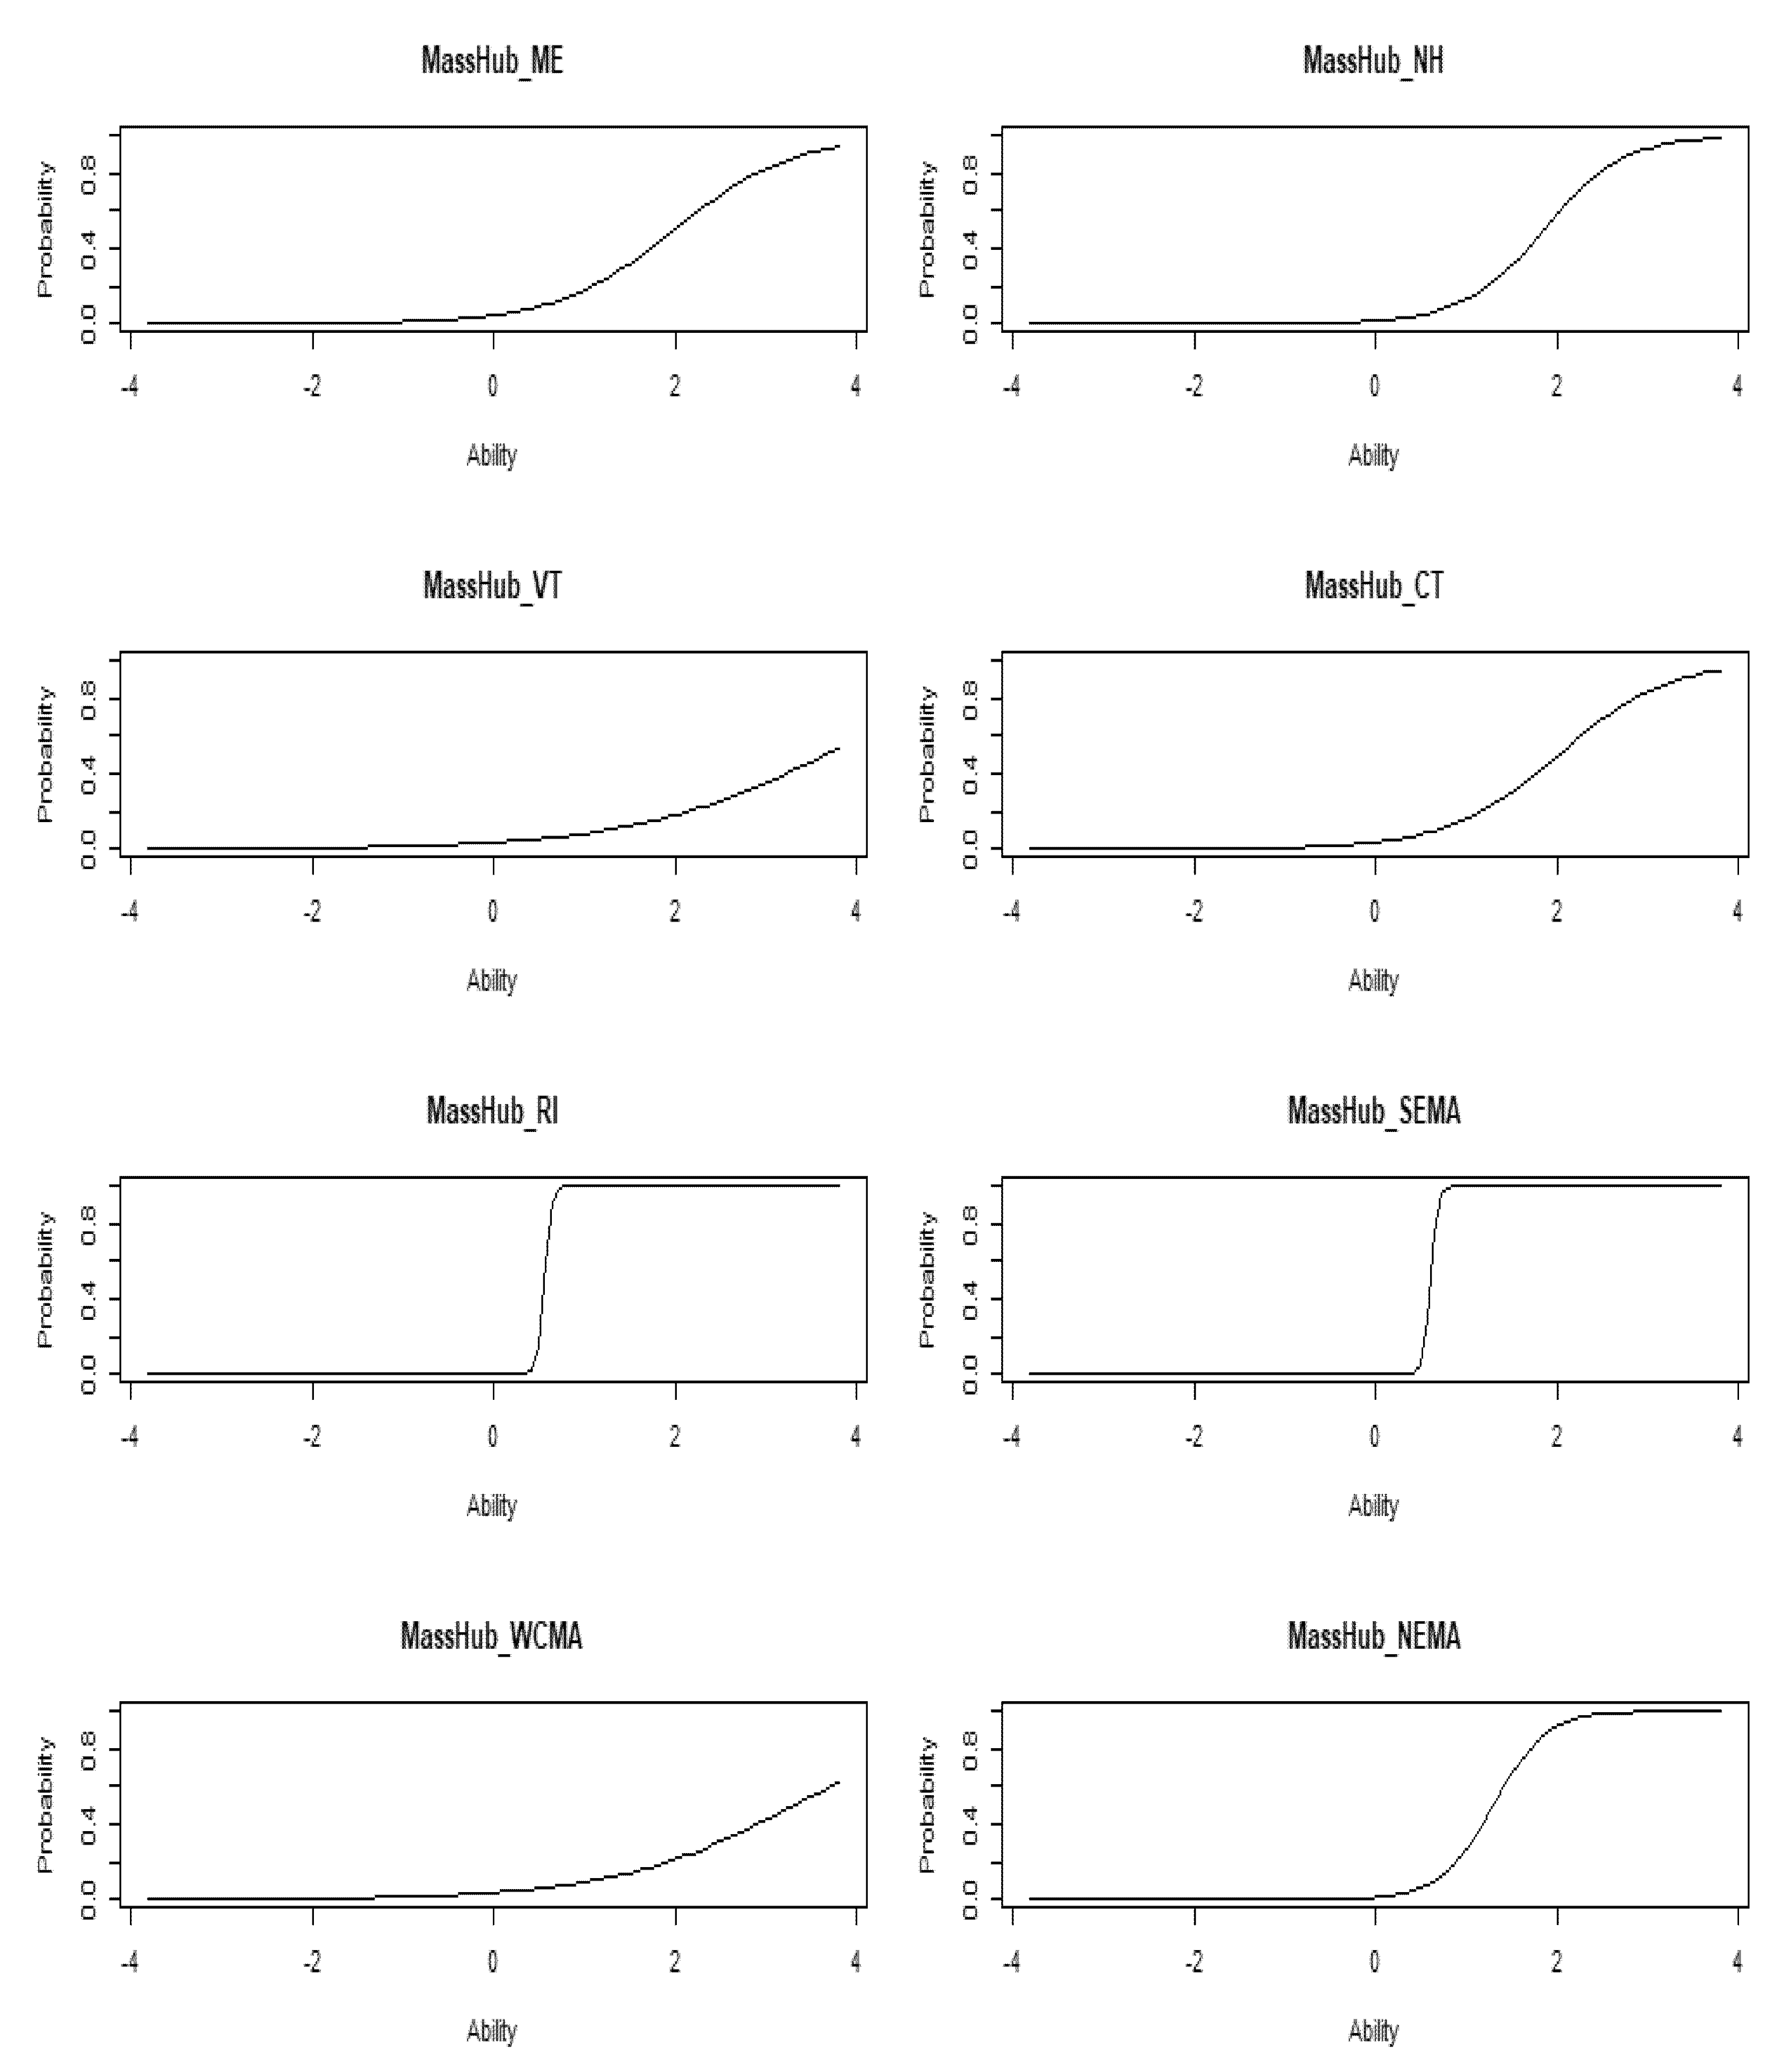
The FTR path profitability (item difficulty, bi) and risk level (discrimination, ai) in Table 2 and Table 3 may be translated and illustrated on graphical forms (ICCs), representing the probability of profitability (Pi (θ)) on the y-axis on a given congestion ability (θ) on the x-axis. Figure 5 presents ICCs for each of the eight FTR paths for discussion purpose, where FTR paths, MassHub_RI (ai = 26.80) and MassHub_SEMA (ai = 26.25), show steep slopes, indicating high risk levels, due to their higher discrimination coefficients. FTR paths, MassHub_VT (ai = 0.92) and MassHub_WCMA (ai = 1.00), show the smallest slopes, indicating the least discrimination, or the least risks among all the FTR paths.
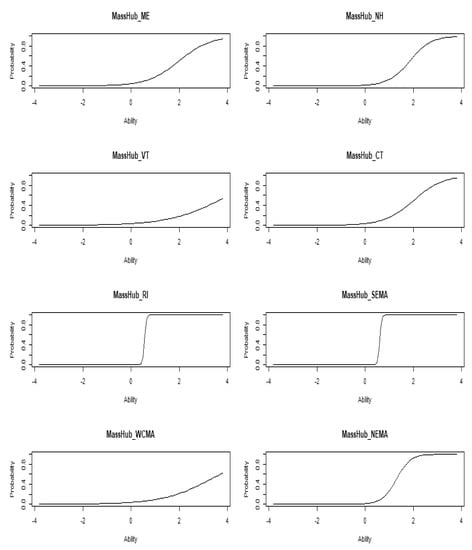
Figure 5.
Individual item characteristic curves: eight paths.
As the item (path) difficulty (bi) coefficients represent a scale on the x-axis of a latent trait variable (congestion ability θ) at a mid-probability (0.50) on the y-axis, their implication is that the further right an FTR path is, the less profitable (more difficult) it is. For example, the two FTR paths with the greatest difficulty coefficients are MassHub_VT (3.67) and MassHub_WCMA (3.32), as shown in Table 2 and Table 3, and Figure 5.
5. Conclusion and Implications
Financial Transmission Rights (FTR) is an energy derivative and financial instrument in electricity markets. Transmission system constraints are one of the risks for market participants, called congestion cost risk as part of LMP, particularly for those with supply obligations to serve customer loads from a different pricing location. The U.S. New England ISO, with six members states, has about 1200 pricing nodes, including load zones, hubs, and generating plant nodes. The number of the pricing nodes may be translated into 1.4 million potential FTR paths on prevailing flows only, which created tremendous opportunities for FTR bidders, as well as challenges of making decisions which paths to bid in FTR auctions. It is essential that FTR participants have a standardized and consistent model to evaluate those paths, given the complexity and magnitude of FTR path choices available to them.
Item response theory (IRT), a popular statistical model in psychometrics, measures information of an item (e.g., item difficulty and item discrimination) with a latent variable estimated by all the item responses. This paper examined a way to apply the IRT 2PL model to evaluate and select the FTR paths to bid in market auctions, with a historical price data for eight candidate paths in 2019 in U.S. New England. The parameters in IRT were defined in a way that an FTR path is an item, the FTR value (binary) for an item response, the difficulty parameter for path profitability, and the discrimination for its risk level.
This study selected eight FTR paths, with Massachusetts Hub as a source and eight load zones in six states as a sink, with several steps of evaluation. Balancing FTR profitability and risk level was prudently considered in the whole process of applying the IRT model. For each of the eight paths, the IRT 2PL model produced difficulty parameter (bi) for FTR path profitability and discrimination (ai) for risk level. As a first step, significance of the parameters for the candidate paths was calculated based on a p-value hurdle of 0.05. Two paths of MassHub_SEMA and MassHub_RI were removed for further consideration because their p-values of both profitability (bi) and discrimination (ai) were greater than 0.05. As a result, six remaining FTR paths were selected for second evaluation process, that is, ranking the paths based on two criteria of profitability (bi) and discrimination (ai). The two rankings of each path were finally evaluated with weighting factor of 60% and 40% each on profitability and discrimination, resulting in priority order among the paths. Results show that FTR paths of Mass_Maine and Mass_NEMA took the top two spots, followed by Mass_NH, Mass_WCMA, Mass_VT, and Mass_CT.
This experiment shows that the IRT model may provide a standardized analytical framework, with three parameters, in the evaluation of FTR paths, and may be implemented to address the path choice challenges for FTR participants. The model could also be useful and applicable in other energy markets, with proper definitions of terms for analysis and interpretation of estimated parameters. In this study, the lowest item difficulty coefficient of an FTR path was interpreted as a greatest profitability path, and the greatest item discrimination coefficients, or the steepest slope on the ICCs, as the riskiest path.
We note that there are a couple of limitations in this research. One limitation is that it has not developed rigorous interpretation and utilization of the latent trait variable (θ), or congestion ability, measured by the FTR path item (binary) responses (Xi), in the path evaluation process. Another limitation is that the paper focused on evaluation and selection aspect of FTR paths to bid under the analytical framework of item response theory (IRT). Future research may include topics of how to utilize the latent trait level (congestion ability) in the FTR path evaluation, and how to determine FTR bid prices for the auction under uncertainty of electric prices in future. Another extension of IRT applications may involve using more FTR paths for analysis, longer time horizons across multi-years, and testing results with other future time periods.
Author Contributions
Conceptualization, P.Y.J.; Data curation, P.Y.J.; Formal analysis, P.Y.J.; Investigation, P.Y.J.; Methodology, P.Y.J. and K.J.; Project administration, K.J. and M.G.B.; Resources, P.Y.J.; Software, P.Y.J.; Supervision, K.J. and M.G.B.; Validation, P.Y.J., K.J. and M.G.B.; Visualization, P.Y.J.; Writing – original draft, P.Y.J.; Writing – review & editing, P.Y.J., K.J. and M.G.B. All authors have read and agreed to the published version of the manuscript.
Funding
This research received no external funding.
Conflicts of Interest
The authors declare no conflict of interest.
References
- ISO New England Inc. Financial Transmission Rights (FTR). Available online: https://www.iso-ne.com/markets-operations/settlements/understand-bill/item-descriptions/ftr (accessed on 9 April 2020).
- Opgrand, J.J. The Role of Auction Revenue Rights in Markets for Financial Transmission Rights. Ph.D. Thesis, Purdue University, West Lafayette, Indiana, 2019. [Google Scholar]
- ISO New England Inc., “New England Power Grid State Profiles 2019–2020,” 2020. Available online: https://www.iso-ne.com/static-assets/documents/2020/02/ (accessed on 12 April 2020).
- De Ayala, R.J. The Theory and Practice of Item Response Theory; Guilford Publications: New York, NY, USA, 2013. [Google Scholar]
- Albano, T. Introduction to Educational and Psychological Measurement Using R; Tony Albano: Lincoln, NE, USA, 2018; pp. 145–162. [Google Scholar]
- Hays, R.D.; Morales, L.S.; Reise, S.P. Item Response Theory and Health Outcomes Measurement in the 21st Century. Med. Care 2000, 39 (Suppl. 9), II28–II42. [Google Scholar] [CrossRef]
- Warne, R.T.; McKyer, E.L.J.; Smith, M.L. An Introduction to Item Response Theory for Health Behavior Researchers. Am. J. Health Behav. 2012, 36, 31–43. [Google Scholar] [CrossRef]
- Columbia Mailman School of Public Health. Available online: https://www.mailman.columbia.edu/research/population-health-methods/item-response-theory (accessed on 23 April 2020).
- Knoll, M.A.Z.; Houts, C.R. The Financial Knowledge Scale: An Application of Item Response Theory to the Assessment of Financial Literacy. J. Consum. Aff. 2012, 46, 381–410. [Google Scholar] [CrossRef]
- Ziogos, N.P.; Tellidou, A.C.; Gountis, V.P.; Bakirtzis, A.G. A Reinforcement Learning Algorithm for Market Participants in FTR Auctions. In Proceedings of the 2007 IEEE Lausanne Power Tech, Lausanne, Switzerland, 1–5 July 2007. [Google Scholar]
- Liu, Y.; Wu, F.F. Transmission Rights and Generator’s Strategic Bidding in Electricity Markets. In Proceedings of the 2006 IEEE Power Engineering Society General Meeting, Montreal, Que., Canada, 18–22 June 2006; pp. 1–6. [Google Scholar]
- Das, T.K.; Rocha, P.; Babayigit, C. A matrix game model for analyzing FTR bidding strategies in deregulated electric power markets. Electr. Power Energy Syst. 2010, 32, 760–768. [Google Scholar] [CrossRef]
- ISO New England Inc. ISO New England Manual for Financial Transmission Rights Manual M-06. Available online: https://www.iso-ne.com/static-assets/documents/2018/10/ (accessed on 9 April 2020).
- ISO New England Inc. FTR Auction Results. Available online: https://www.iso-ne.com/isoexpress/web/reports/auctions/-/tree/auction-results-ftr (accessed on 12 April 2020).
- Baig, S.M.; Imran, K.; Rafique, M.N.; Khan, H.H. Combined Simulation of Auction Revenue Rights Allocation and Financial Transmission Rights Auction for Electricity Markets. In Proceedings of the 4th International Conference on Power Generation Systems and Renewable Energy Technologies (PGSRET), Islamabad, Pakistan, 10–12 September 2018. [Google Scholar]
- ISO New England Inc. Introduction to Wholesale Electricity Markets (WEM 101); ISO New England Inc.: Northampton, MA, USA, 2019. [Google Scholar]
- ISO New England Inc. Wholesale vs. Retail Electricity Costs. Available online: https://www.iso-ne.com/about/what-we-do/in-depth/wholesale-vs-retail-electricity-costs (accessed on 9 April 2020).
- Hogan, W.W. Electricity Market Design Interactions of Multiple Market. Available online: https://media.rff.org/documents/170914_PowerMarkets_WilliamHogan.pdf (accessed on 9 April 2020).
- Li, T.; Shahidehpour, M. Risk-Constrained FTR Bidding Strategy in Transmission Markets. IEEE Trans. Power Syst. 2005, 20, 1014–1021. [Google Scholar] [CrossRef]
- Liu, M.; Gross, G. Congestion rents and FTR evaluations in mixed-pool-bilateral systems. Int. J. Electr. Power Energy Syst. 2008, 30, 447–454. [Google Scholar] [CrossRef]
- Baker, F.B.; Kim, S.-H. The Basics of Item Response Theory Using R; Springer: New York, NY, USA, 2017. [Google Scholar]
- Camilli, G. IRT Scoring and Test Blueprint Fidelity. Appl. Psychol. Meas. 2018, 42, 393–400. [Google Scholar] [CrossRef] [PubMed]
- Hays, R.D.; Spritzer, K.; McCaffrey, D.F.; Cleary, P.; Collins, R.L.; Sherbourne, C.D.; Wu, A.W.; Bozzette, S.A.; Shapiro, M.F.; Cunningham, W.; et al. The HIV Cost and Services Utilization Study (HCSUS) Measures of Health-Related Quality of Life; RAND: Santa Monica, CA, USA, 1998. [Google Scholar]
- Smith, M.L.; McKyer, E.L.J.; Larsen, R.A. Factor structure and psychometrics of the adolescent health risk behavior survey instrument. Am. J. Health Behav. 2010, 34, 328–339. [Google Scholar] [CrossRef] [PubMed]
- Himelfarb, I. A primer on standardized testing: History, measurement, classical test theory, item response theory, and equating. J. Chiropr. Educ. 2009, 33, 151–163. [Google Scholar] [CrossRef] [PubMed]

© 2020 by the authors. Licensee MDPI, Basel, Switzerland. This article is an open access article distributed under the terms and conditions of the Creative Commons Attribution (CC BY) license (http://creativecommons.org/licenses/by/4.0/).