Abstract
This paper compares the detection methods of static eccentricity in Interior Permanent Magnet Synchronous Machines (IPMSM). Four methods are discussed: The first method uses shift in the voltages in d–q plane to detect fault. The second method uses shift in peak of the incremental inductance curve for fault detection. The third method uses the combined information of harmonics present both in current and voltage to detect the fault. This makes the detection robust with respect to current controller bandwidth. Finally, the fourth method used for detection includes measuring vibrations using accelerometers. It is shown that all four methods detected static eccentricity. These methods are compared on the basis of utility of fault detection under online or offline conditions and under saturated conditions. For all four methods the machine was tested at healthy, 25% and 50% static eccentricity levels. Two-dimensional (2-D) Finite element analysis was used for simulating machine under healthy and faulty cases. The experiments were performed by controlling the machine using Labview Real-time.
1. Introduction
Stator core ovality or incorrect positioning of the rotor or stator at the commissioning stage can be one of the reasons of static eccentricity. Detection of static eccentricity in Permanent Magnet Synchronous Machines is important, because static eccentricity grows slowly with time and causes increase in unbalanced magnetic pull (UMP) and vibrations on the rotor. Therefore, it is useful that any eccentricity is detected before the machine is applied in operation.
Plenty of detection methods that use signal processing were proposed in [1,2,3,4,5,6]. However, to apply these method a high resolution signal is required. Authors in [7,8] developed single fault detection schemes. As different faults can cause similar effect on the fault signals therefore single fault detection schemes are not reliable. Therefore, there is a need of detection scheme that is capable of fault separation as well. In [9], it is shown that commanded voltages method is comparatively simple to implement, non-invasive and was used for fault separation. Therefore this detection method is unique for static eccentricity fault detection. Also, in [9] it is shown that under higher operating loads, detection is difficult, but this paper does not discuss the operating load required for maximum separation between healthy and faulty case. Incremental inductance method is proposed in [10,11] to detect static eccentricity under offline conditions based on the shift in the peak of the curve. The authors of [10] used d-axis current with ac injection to generate incremental inductance curve. The authors of [11] used a different method to generate the incremental inductance by applying current at different levels to the positive d-axis while the machine is running at a constant speed. However, the authors of [11] do not discuss the impact of difference in the levels of current on the incremental inductance curve. In the literature, voltage sub-harmonics in the machine are used for single fault detection. This method is known as machine voltage signature analysis (MVSA). However, it was shown in [12] that the magnitude of the sub-harmonics depends on the operating conditions. In [13,14], it is shown that the relation between number of poles and slots effects the appearance of sub-harmonics related to eccentricity faults. To compensate these problems, the authors of [15] used harmonics instead of sub-harmonics in the voltage signal, in current controlled machine, as an indicator for detection. However, harmonic content in the voltage signals depends on the bandwidth of the current controller.
In this work, a comparative study of existing methods commanded voltages, incremental inductance, harmonic extraction for voltages and currents, and vibration detection is presented. For commanded voltages technique, accuracy is improved by the appropriate selection of the operating point to achieve maximum separation between healthy and faulty case. For incremental inductance approach peak prominence was improved by selecting the appropriate current levels for voltage measurements. For MVSA, instead of using only voltage signal, the combined information of voltages and currents is used, as it is used in [16] for short-circuit faults. This information is extracted by using instantaneous active power (IAP). Healthy machine generates some sort of vibration and response depends on the environment and the structure it is coupled to [17,18]. The authors of [2,19,20,21,22,23] mixed eccentricity causes vibrations, and these vibration signals can also be used for fault detection. However, in case of static eccentricity, a special case of mixed eccentricity, a more specific expression of frequency is required which is shown in this work.
The paper is organized as follows. Section 2 discusses the theoretical background and detection techniques. Section 3 describes the fault signals used for this work. Section 4 and Section 5 discuss the numerical and experimental set up respectively. Section 6 presents the results. Section 7 discusses the utility of the detection methods, and finally Section 8 draws the conclusions from the results.
2. Theoretical Background and Detection Techniques
2.1. Static Eccentricity
Static eccentricity is a condition of uneven air gap between stator and rotor. In healthy conditions, the stator geometric center coincides with rotor geometric center and rotation axis. In static eccentric conditions, the rotation axis coincides with the rotor geometric center and is shifted from the stator geometric center. As reluctance is directly proportional to the air gap length, the flux in the lower air gap region increases and decreases in higher air gap region. The increase in flux is more than the decrease in the flux resulting in the net rise in flux compared to healthy case. Therefore, this increase in flux for faulty case can be used for fault detection. Severity of static eccentricity is given as follows,
where g is the air gap length and is the shift.
2.2. Commanded Voltages Method
Flux linkage increases due to static eccentricity at the same operating current. For the commanded voltages method, the machine is operated in constant torque mode, which is achieved by commanding specific currents. The machine is controlled by a voltage source inverter. The inverter achieves these commanded currents by applying voltages to the machine using high speed controller. As the eccentricity changes, the same current requires different voltages. The machine is controlled in a rotor aligned reference frame known as d–q frame. The transformed voltages from the abc reference frame to the d–q reference frame are and . Flux changes for the same current in case of static eccentricity is observed in voltages. The points in - plane should shift in top left direction for static eccentricity. The shift is unique, with respect to the fault type, as shown in [9]. Shift of points for different faults is shown in Figure 1.
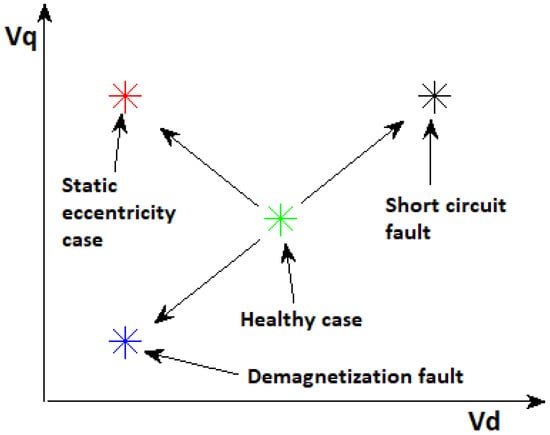
Figure 1.
Shift in under different faults [24].
2.3. Incremental Inductance Approach
2.3.1. Incremental Inductance Definition and Effect of Fault
Figure 2a shows the saturation curve of PMSM. This curve can be divided into three regions: linear region, knee region, and saturation region.
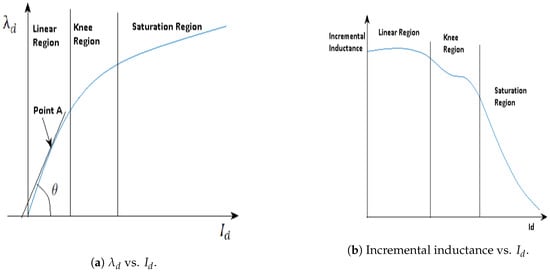
Figure 2.
Saturation and corresponding incremental inductance curve.
Incremental inductance is defined as the slope of this saturation curve. For point A in Figure 2a, the incremental inductance is given by
The incremental inductance curve corresponding to Figure 2a is shown in Figure 2b. In the saturation curve ( vs. ), the relation between d-axis flux () and d-axis current () for small values of is almost linear. This implies that the relationship between incremental inductance and is not essentially linear for the same range of current. However, in the knee region, the relation between and starts to change from linear to nonlinear. And in saturation region the relation between and is nonlinear [10]. The peak in the incremental inductance occurs when the machine starts to saturate, and the corresponding d-axis current is . In the case of static eccentricity the total flux linkage in the machine is higher compared to healthy machine for the same current. It means that the machine requires less current to saturate, which can be observed in the incremental inductance as a shift of the knee region peak to the left as shown in Figure 3. The amount of the shift depends on the severity of fault.
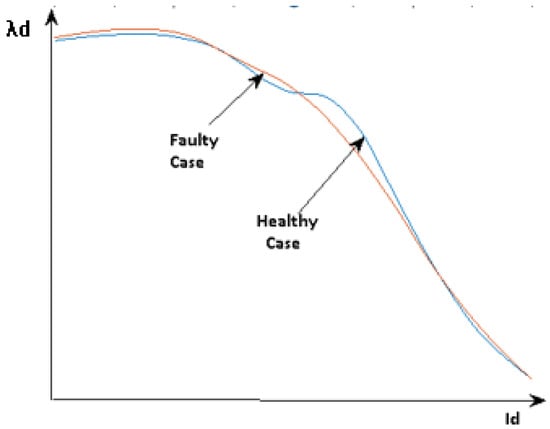
Figure 3.
Shift in peak of incremental inductance curve due to static eccentricity fault.
2.3.2. Methods to Calculate Incremental Inductance
Two methods for the generation of incremental inductance curve are as follows.
- Current injection in d-axis with constant rotation:The authors of [11] show the method of generation of incremental inductance curve by injecting d-axis current with increasing levels at constant speed operation. The steady state equations for the PMSM in d–q-axis reference frame are given asOnly d-axis current () is injected, and therefore . Therefore, Equation (4) reduces toUsing Equation (5), the saturation curve ( vs. ) is calculated. From the saturation curve, incremental inductance curve is calculated by taking the derivative of the curve.
- d-axis current injection with AC injection at standstill:Ref. [10] shows the method of generation of incremental inductance curve by injecting d-axis current with an AC component. In this method d-axis current increases the saturation level, whereas the AC component detects the incremental inductance. The incremental inductance can be detected from the fundamental component of AC signal in the d-axis as follows,where and are the fundamental components of AC signals in the motor and is the incremental inductance.
In this work current injection in d-axis with constant rotation was used to generate incremental inductance curve.
2.4. Harmonics in Voltage and Current Signals
This work expands on [15] to detect static eccentricity fault. In [15], harmonics in voltages were used for fault detection. However, the harmonic information in the voltages depends on the bandwidth of the current controller. To compensate this problem, the combined effect of the voltages and currents were used to extract harmonics for fault detection. The combined effect of voltage and current is calculated by choosing Instantaneous Active Power (IAP). The expression for IAP is given as
2.5. Detection Using Vibration Signals
Static eccentricity is detected by using vibration signals and analyzing the frequency that appear in the signals. The frequency that appear due to static eccentricity is calculated in the following derivation. Air gap flux is calculated from the product of permeance and magnetomotive force. Therefore, the following harmonics are present in air gap field [25].
- Fundamental
- Stator and rotor MMF harmonics
- Stator and rotor slot permeance harmonics
- Air gap eccentricity permeance harmonics
- Permeance harmonics due to saturation
Permeance of air gap due to stator slotting and smooth rotor:
Permeance of an air gap bounded by a interior permanent magnet rotor and smooth stator, in the rotor frame of reference, is given by
The resultant of these two permeances is given by
The following relation holds,
Substituting Equations (11) and (12) in Equation (10), the total MMF in the stator frame of reference is
In the presence of static eccentricity, the radial air gap length is a function of position only. Assuming a smooth stator and rotor the permeance is
Here, the magnitude of is given by [25]
As the severity of fault increases, the magnitude of also increases.
Saturation can be represented by a permeance with twice the number of poles and twice the frequency of fundamental, because the air gap becomes effectively larger in the regions of maximum flux density [26],
Combining all equations for permeance gives the following,
We assume current applied in the stator windings is pure sinusoidal. Then, the MMF from the stator windings is
Also, rotor windings produces MMF. The expression of the same, in the rotor reference frame, is
The total MMF from stator and rotor combined is
Substituting Equations (11) and (12) in Equation (20) gives total MMF in the stator frame of reference:
and are odd multiples of the electrical frequency, because is odd as well. Therefore, the general expression for frequencies that appears due to static eccentricity is calculated by using B and stress relation. Where B and stress are related from Maxwell’s stress tensor, as follows,
Therefore, frequencies that appear in oscillatory forces due to static eccentricity are
These frequencies are used for fault detection.
3. Fault Signals for Detection
This section discuss the signals used for fault detection for the methods proposed. Signals are generated such that the fault detection is more clear.
3.1. Commanded Voltages Method
The difference in the voltages between healthy and faulty cases is directly proportional to the difference in the flux linkages of healthy and faulty case. The difference between the flux linkages is significant in certain range of the current. The difference is maximum at the point shown in Figure 4. Therefore, for fault detection the machine should be operated as close as possible to point of maximum separation.
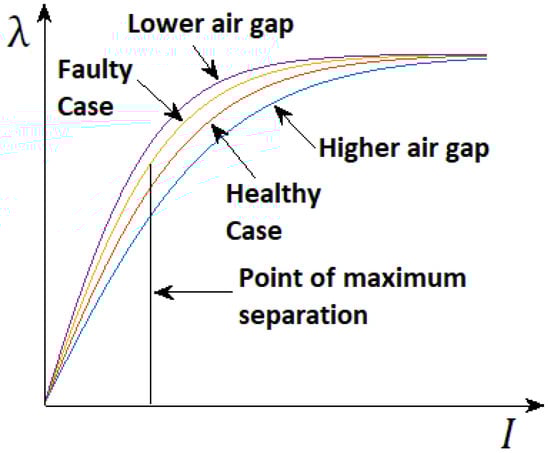
Figure 4.
Saturation curve under healthy and eccentric conditions.
3.2. Calculation of Incremental Inductance
Incremental inductance is generated by using DC current injection in the d-axis with constant rotation. The current is injected with increasing current levels and the q-axis voltage () is recorded at each level. The value of d-axis flux () is calculated from the q-axis voltage (). Finally, incremental inductance is calculated by taking the derivative of vs. curve given by
The difference in the two current levels is . Therefore, the above relation reduces to
where is the difference in the flux linkages at two different levels of current. and are shown in Figure 5.
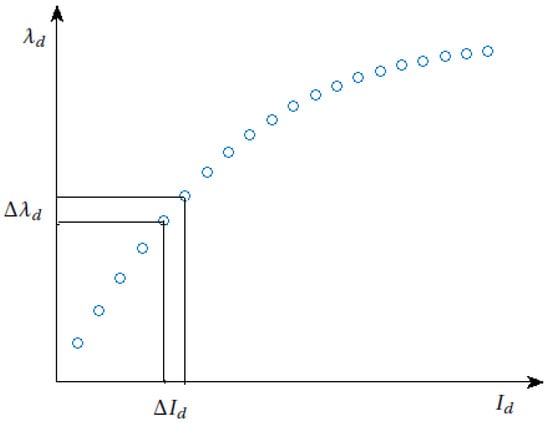
Figure 5.
Calculation for incremental inductance curve.
The difference in current levels is chosen such that there is a measurable difference in the q-axis voltages between two levels. The minimum difference in current levels is chosen once measurable difference in the voltages is recorded, because increased difference in current levels decreases peak prominence.
3.3. Harmonics in Voltage and Current Signals
The first 15 harmonics present in IAP (Instantaneous Active Power) are used for analysis for fault detection which was extracted using FFT (Fast Fourier Transform). The harmonic that shows the maximum separation between the healthy and faulty cases is used for analysis. The machine is operated at the same operating conditions as it is operated for commanded voltages method.
3.4. Vibration Signals for Analysis
The oscillating forces were calculated by using FEA model. First the magnitude of magnetic field density was calculated around the rotor. After that for an angle , as shown in Figure 6, radial stress was estimated using Equation (31).
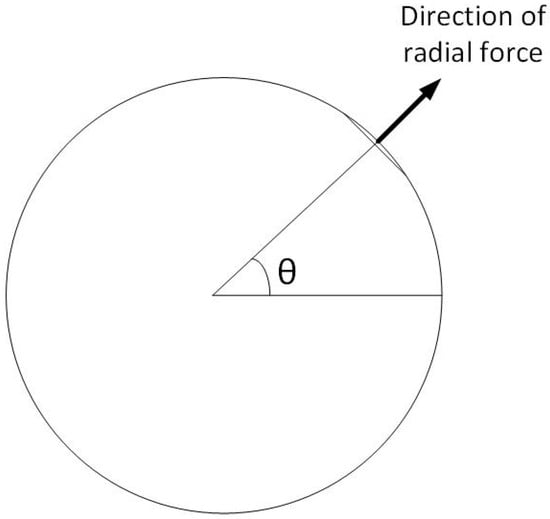
Figure 6.
Calculation of forces using finite element analysis (FEA) .
Then, the stress is calculated by taking projections in y and x-axis as follows
Net force at a given time can be calculated by integrating the forces over the periphery of the rotor.
Therefore, forces are estimated using flux density at different times. Once, forces are estimated, FFT is performed and results are analyzed.
To analyze the vibration signals the accelerometers were placed on both stator core and rotor bearing in the direction of static eccentricity (y-axis) and 90° apart from the direction of static eccentricity (x-axis). The arrangement of accelerometers on the rotor bearing and stator core is shown in Figure 7.
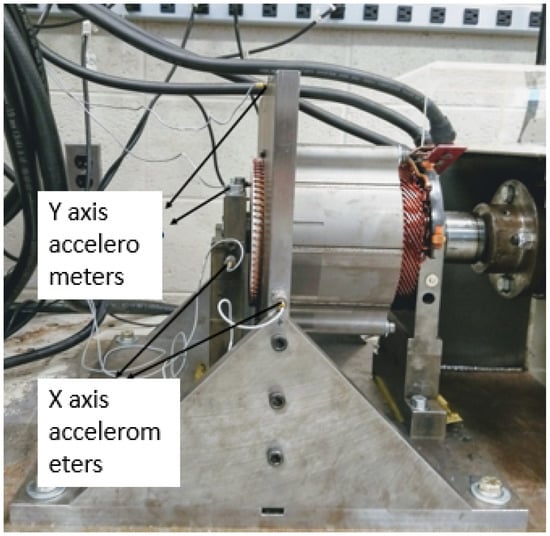
Figure 7.
Placement of accelerometers on stator and rotor bearing housing.
4. Numerical Set-Up and Fault Implementation
The machine used for 2-dimensional finite element analysis (2-D FEA) simulation is a distributed 8 pole winding IPMSM. The 2-D FEA model used for simulation is shown in Figure 8.
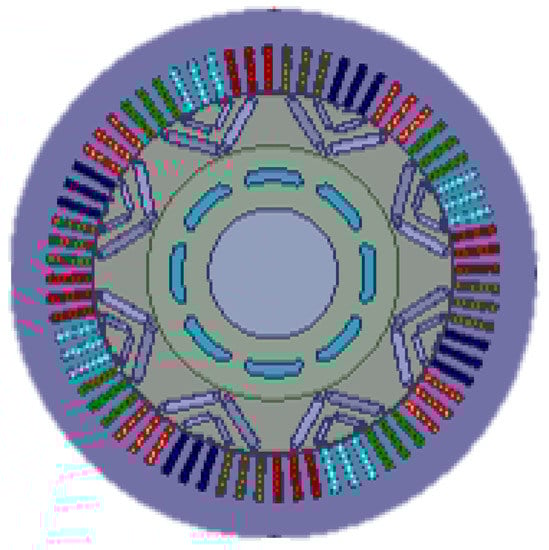
Figure 8.
Finite element model [24].
To implement static eccentricity, the stator is shifted and the amount of shift depends on the severity of the fault implemented.
5. Experimental Set Up and Fault Implementation
Figure 9 shows the experimental set up that constitutes dynamometer and tested machine. The dynamometer acts a load that is driven by the tested motor.
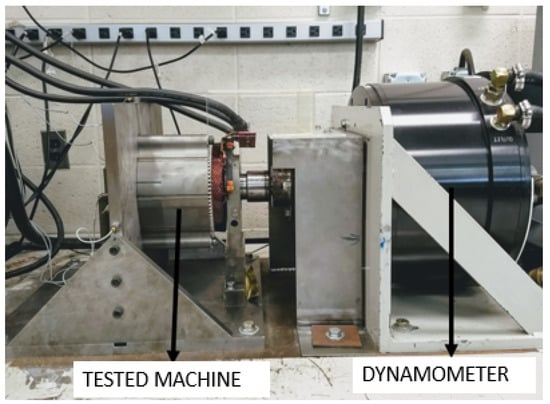
Figure 9.
Experimental set up [24].
Brass shims were used to implement static eccentricity underneath the bearing stand as shown in Figure 10. The machine was tested for three different of severities: healthy, 25%, and 50% static eccentricity, where the air gap length is 0.625 mm.
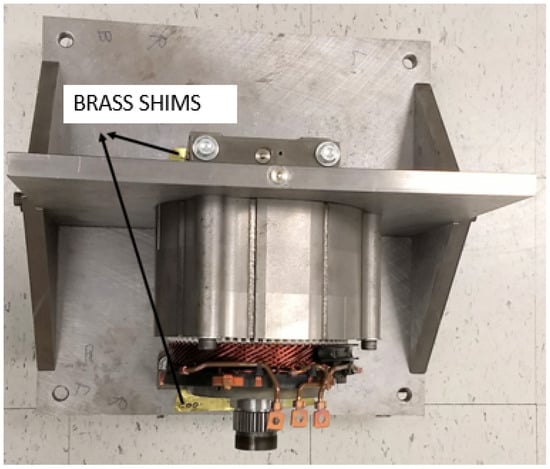
Figure 10.
Fault implementation [24].
6. Results
6.1. Commanded Voltages Method
This section discusses the results for the commanded voltages method.
6.1.1. Characterization Results
Characterization methods shown in [27,28] are used to find MTPA (maximum torque per ampere) points. The range of characterization was 0 A to 150 A in steps of 25 A. Characterization results from experiments are shown in Figure 11.
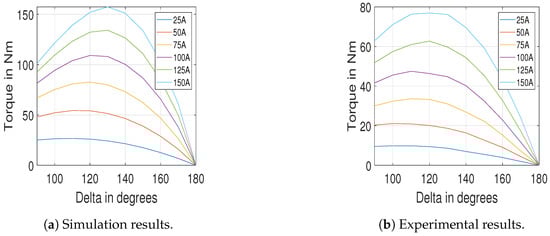
Figure 11.
Simulation results.
6.1.2. Operating Point Selection
Selection of operating point was based on maximum separation between healthy and 25% eccentric case. The machine was operated at different loads for healthy and 25% eccentric case, and the healthy and 25% eccentric case. The voltages are recorded and the difference is calculated as follows,
The load is increased in steps of 25A following MTPA criterion. The change in voltage () was observed to increase first and then decrease with increase in load. The explanation of the same is shown in Section 3.1. Variation of with load is shown in Figure 12.
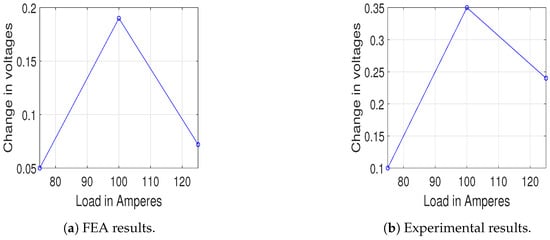
Figure 12.
Load vs. change in voltage [24].
Therefore, the point corresponding to 100 A is selected for operation. The machine was operated at
6.1.3. Voltages at Different Eccentricities
At the selected operating point shown in previous section the machine is operated for healthy, 25%, and 50% eccentric cases. As shown in Section 2.2 the points shifts in top left direction and the shift increases with increase in severity. The voltage shift with eccentricity fault is shown in Figure 13.
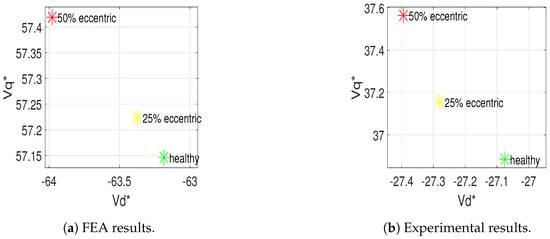
Figure 13.
Shift in Vd/Vq with eccentricity [24].
6.2. Incremental Inductance Method
The following section shows the results for the incremental inductance method.
6.2.1. Variation of Incremental Inductance Curve with Current Levels
To find the best difference in current levels for the generation of incremental inductance, the curve was generated by injecting current such that the difference in current levels is increased for different tests. The curve with the most significant peak was selected as the difference in the current levels is increased.
6.2.2. at Different Eccentricities
The value of was calculated from . Rise in flux for eccentric machine as compared to healthy machine was observed for the same current value. The variation of with under different severity is shown in Figure 14.
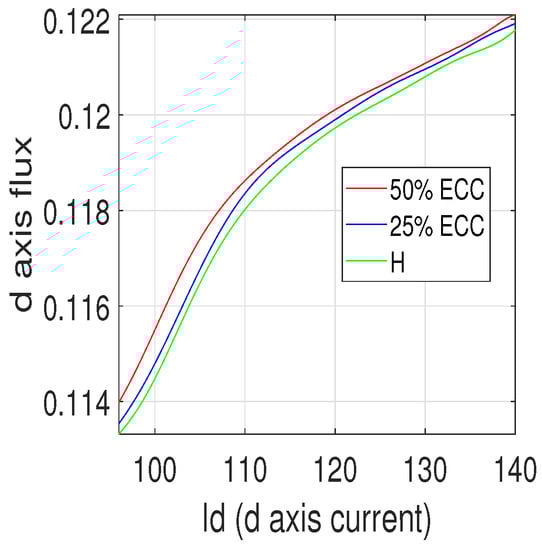
Figure 14.
Experimental results for vs. at different severities.
6.2.3. Incremental Inductance Curve
Incremental inductance was calculated by taking the derivative of the vs. curve. It is observed that the peak of the incremental inductance shifts more to the left with increase in severity of fault. Figure 15 shows the incremental inductance curves at different severities.
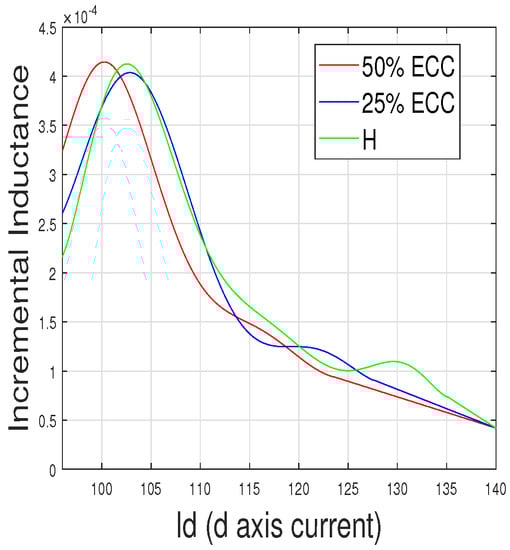
Figure 15.
Experimental results for Incremental Inductance curves vs. at different severities.
6.2.4. at Different Eccentricities
It was observed that there is decrease in with increase in eccentricity. The variation of with severity of eccentricity fault is shown in Figure 16.
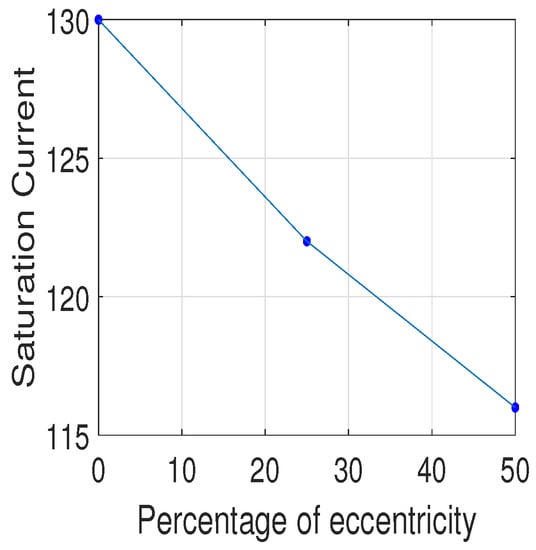
Figure 16.
Experimental result for with severity of fault.
6.3. Harmonic Extraction
Instantaneous active power (IAP) was calculated and analyzed for healthy, 25%, and 50% eccentric cases. It was observed that 6th harmonic shows the maximum variation out of first 15 harmonics. The magnitude of the same is shown in Table 1. Therefore, the magnitude of the 6th harmonic in the IAP is capable of detecting presence of static eccentricity for this machine.

Table 1.
Variation of magnitude 6th harmonic of Instantaneous Active Power (IAP) with eccentricity.
6.4. Vibrations and Oscillatory Forces
At the selected operating point, as shown in Section 6.1.2, the machine was operated. The oscillatory forces cause vibrations and these vibrations are measured by accelerometers (in m/s2). The vibration signals and oscillatory forces were analyzed using FFT. There is a rise of even harmonics in both vibration signals and oscillatory forces. Out of all the even harmonics 6th, 12th, and 18th harmonics are the most significant harmonics. Variation of oscillatory forces and vibration signals with eccentricity is shown in Figure 17.
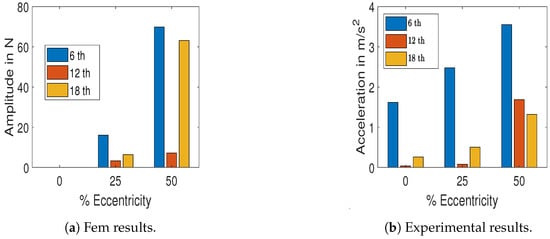
Figure 17.
Force and acceleration vs. eccentricity percentage.
7. Utility of the Detection Methods
This section explains the conditions under which the four stated methods are preferred over the other. The conditions used for comparison are mode of operation (offline or online) and saturation.
7.1. Mode of Operation
7.1.1. Commanded Voltages Method
It is shown in [24] that the separation between healthy and faulty case is maximum at a selected operating point, as under online conditions, the operating point cannot be controlled. Therefore, the commanded voltages method is not preferred under online operating conditions.
7.1.2. Incremental Inductance Method
All the methods that are used to generate incremental inductance, as shown in [10,11], are offline. Therefore, with the present methods, the incremental inductance method can only be implemented under offline conditions.
7.1.3. Harmonics in Voltage and Current Signals
Detection of static eccentricity under stationary conditions is straightforward and Fourier transform can be used to detect the fault as shown in [13,29]. However, when the machine operates under online conditions, both the speed and load vary. It has been shown in [12] that fault detection is difficult under low speed conditions. Based on this, it can be concluded that using harmonics fault detection is straightforward for offline conditions where operating conditions can be controlled. However, under online conditions, the fault detection depends is accurate under some operating points, depending on machine design.
7.1.4. Vibrations and Oscillatory Forces
Offline detection of static eccentricity using vibration signals is straightforward where both speed and load can be controlled [30] shows that vibration analysis can be used for fault detection and separation under online conditions. In this paper, the SE (static eccentricity) and DE (dynamic eccentricity) faults are detected for marine propulsion systems. Therefore, vibration signal monitoring can be used both online and offline for detection of static eccentricity.
7.2. Detection under Saturated Conditions
7.2.1. Commanded Voltages Method
The difference in flux linkage between healthy and faulty cases is reflected in the commanded voltages. However, this difference is significant in limited range of load. Section 3.1 shows that, under higher load conditions, the difference between the flux linkage of healthy and faulty machine is insignificant. Therefore, commanded voltages method is not expected to perform well under saturated conditions.
7.2.2. Incremental Inductance Method
Incremental inductance method use the peak, that appears in the knee region, to detect the fault. If the machine is close to or at saturation under no load condition then the whole incremental inductance curve can be generated by injecting negative d-axis current and therefore the fault is still detectable. Therefore, incremental inductance method is capable of fault detection under saturated conditions.
7.2.3. Harmonics in Voltage and Current Signals
The authors of [31] show that saturation includes additional harmonics, in the magnetic flux density, whereas the harmonics that are present in case of no saturation are retained. Therefore, the harmonics extraction detection scheme is capable of fault detection under saturated conditions.
7.2.4. Vibrations and Oscillatory Forces
Section 2.5 shows that saturation includes additional harmonics while retaining the harmonics that are present in case of no saturation. Therefore, presence of saturation does not effect the vibration detection method.
8. Conclusions
Four methods were described and tested for the detection of static eccentricity. The commanded voltages method is capable of detecting static eccentricity for healthy, 25%, and 50% eccentricity levels. This detection method requires constant speed operation and dynamometer as load. The incremental inductance method is capable of detecting static eccentricity for healthy, 25%, and 50% eccentricity levels. This detection method requires slow speed operation (500 RPM) with no load. Harmonics in Instantaneous Active Power (IAP) are capable of detecting static eccentricity for healthy, 25% and 50% eccentricity levels. This detection method requires constant speed operation and dynamometer as load. The vibration detection method is capable of detecting static eccentricity for healthy, 25%, and 50% eccentricity levels. This detection method requires constant speed operation and dynamometer as load. All these methods were compared with respect to the utility of the methods under different conditions and shown which method works under certain conditions. More research on nonuniform static eccentricity in the axial direction is required.
Author Contributions
A.A. and E.G.S. contributed to the design and implementation of the research, to the analysis of the results and to the writing of the manuscript.
Funding
This project was funded by General Motors, Warren, MI, USA.
Conflicts of Interest
The authors declare no conflict of interest.
Nomenclature
| Stator Resistance | |
| Electrical Speed | |
| d-axis voltage for healthy case | |
| q-axis voltage for healthy case | |
| d-axis voltage for faulty case | |
| q-axis voltage for faulty case | |
| Value of saturation current values for healthy case | |
| Value of saturation current values for faulty case | |
| 6th | harmonic of IAP for healthy case |
| 6th | harmonic of IAP for faulty case |
| magnitude of harmonic permeance wave due to stator slotting | |
| S | Number of stator slots |
| magnitude of harmonic permeance wave due to saturation | |
| magnitude of harmonic mmf wave due to stator windings | |
| magnitude of harmonic mmf wave due to stator windings | |
| magnitude of harmonic permeance wave due to rotor slotting | |
| Mechanical speed of rotor in rad/s | |
| p | Pole pairs |
| Rotor spatial distribution | |
| Stator spatial distribution | |
| magnitude of harmonic permeance wave due to static eccentricity | |
| g | Air gap length |
| Fraction of static eccentricity fault | |
| Frequency in oscillatory forces due to static eccentricity | |
| Electrical frequency in rad/s | |
| Radial stress | |
| Radial Magnetic Field intensity | |
| Tangential Magnetic Field intensity | |
| Magnitude of Magnetic Field intensity | |
| Permeability of free space | |
| Stress in x-axis at a given time t and position | |
| Stress in y-axis at a given time t and position | |
| Force in x-axis at a given time t | |
| Force in y-axis at a given time t | |
| Differential area chosen around rotor for force calculation |
References
- Rosero, J.; Romeral, J.L.; Cusido, J.; Ortega, J.A.; Garcia, A. Fault detection of eccentricity and bearing damage in a PMSM by means of wavelet transforms decomposition of the stator current. In Proceedings of the 2008 Twenty-Third Annual IEEE Applied Power Electronics Conference and Exposition, Austin, TX, USA, 24–28 February 2008; pp. 111–116. [Google Scholar] [CrossRef]
- Ebrahimi, B.M.; Faiz, J.; Roshtkhari, M.J. Static-, Dynamic-, and Mixed-Eccentricity Fault Diagnoses in Permanent-Magnet Synchronous Motors. IEEE Trans. Ind. Electron. 2009, 56, 4727–4739. [Google Scholar] [CrossRef]
- Ebrahimi, B.M.; Roshtkhari, M.J.; Faiz, J.; Khatami, S.V. Advanced Eccentricity Fault Recognition in Permanent Magnet Synchronous Motors Using Stator Current Signature Analysis. IEEE Trans. Ind. Electron. 2014, 61, 2041–2052. [Google Scholar] [CrossRef]
- Bruzzese, C.; Joksimovic, G.; Santini, E. Static eccentricity detection in synchronous generators by field current and stator Voltage Signature Analysis—Part II: Measurements. In Proceedings of the XIX International Conference on Electrical Machines—ICEM 2010, Rome, Italy, 6–8 September 2010; pp. 1–5. [Google Scholar] [CrossRef]
- Goktas, T.; Zafarani, M.; Akin, B. Discernment of Broken Magnet and Static Eccentricity Faults in Permanent Magnet Synchronous Motors. IEEE Trans. Energy Convers. 2016, 31, 578–587. [Google Scholar] [CrossRef]
- Bessous, N.; Sbaa, S.; Zouzou, S.E.; Bentrah, W.; Becer, Z.; Zarour, L. Application of new quantitative and qualitative study based on DWT method to diagnose the eccentricity fault in induction motors. In Proceedings of the 2017 5th International Conference on Electrical Engineering—Boumerdes (ICEE-B), Boumerdes, Algeria, 29–31 October 2017; pp. 1–6. [Google Scholar] [CrossRef]
- Cintron-Rivera, J.G.; Foster, S.N.; Strangas, E.G. Mitigation of Turn-to-Turn Faults in Fault Tolerant Permanent Magnet Synchronous Motors. IEEE Trans. Energy Convers. 2015, 30, 465–475. [Google Scholar] [CrossRef]
- Hao, L.; Nawrocki, S.; Tang, X. Modeling & analysis of weld short faults of bar-wound propulsion IPM machine part I: Turn short. In Proceedings of the 2011 IEEE Vehicle Power and Propulsion Conference; Chicago, IL, USA; pp. 1–6. [CrossRef]
- Haddad, R.Z.; Lopez, C.A.; Foster, S.N.; Strangas, E.G. A Voltage-Based Approach for Fault Detection and Separation in Permanent Magnet Synchronous Machines. IEEE Trans. Ind. Appl. 2017, 53, 5305–5314. [Google Scholar] [CrossRef]
- Hong, J.; Park, S.; Hyun, D.; Kang, T.; Lee, S.B.; Kral, C.; Haumer, A. Detection and Classification of Rotor Demagnetization and Eccentricity Faults for PM Synchronous Motors. IEEE Trans. Ind. Appl. 2012, 48, 923–932. [Google Scholar] [CrossRef]
- Haddad, R.Z.; Strangas, E.G. Detection of static eccentricity and turn-to-turn short circuit faults in permanent magnet synchronous AC machines. In Proceedings of the 2015 IEEE 10th International Symposium on Diagnostics for Electrical Machines, Power Electronics and Drives (SDEMPED), Guarda, Portugal, 4 September 2015; pp. 277–283. [Google Scholar] [CrossRef]
- Rajagopalan, S.; Aller, J.M.; Restrepo, J.A.; Habetler, T.G.; Harley, R.G. Detection of Rotor Faults in Brushless DC Motors Operating Under Nonstationary Conditions. IEEE Trans. Ind. Appl. 2006, 42, 1464–1477. [Google Scholar] [CrossRef]
- Nandi, S.; Toliyat, H.A. Detection of rotor slot and other eccentricity related harmonics in a three phase induction motor with different rotor cages. In Proceedings of the 1998 International Conference on Power Electronic Drives and Energy Systems for Industrial Growth, Perth, Australia, 1–3 December 1998; Volume 1, pp. 135–140. [Google Scholar] [CrossRef]
- Zhu, Z.Q.; Wu, L.J.; Mohd Jamil, M.L. Influence of Pole and Slot Number Combinations on Cogging Torque in Permanent-Magnet Machines With Static and Rotating Eccentricities. IEEE Trans. Ind. Appl. 2014, 50, 3265–3277. [Google Scholar] [CrossRef]
- Haddad, R.Z.; Strangas, E.G. Fault detection and classification in permanent magnet synchronous machines using Fast Fourier Transform and Linear Discriminant Analysis. In Proceedings of the 2013 9th IEEE International Symposium on Diagnostics for Electric Machines, Power Electronics and Drives (SDEMPED), Valencia, Spain, 27–30 August 2013; pp. 99–104. [Google Scholar] [CrossRef]
- Wang, B.; Wang, J.; Griffo, A.; Sen, B. Stator Turn Fault Detection by Second Harmonic in Instantaneous Power for a Triple-Redundant Fault-Tolerant PM Drive. IEEE Trans. Ind. Electron. 2018, 65, 7279–7289. [Google Scholar] [CrossRef]
- Ahsanullah, K.; Jeyasankar, E.; Vignesh, A.N.; Panda, S.K.; Shanmukha, R.; Nadarajan, S. Eccentricity fault analysis in PMSM based marine propulsion motors. In Proceedings of the 2017 20th International Conference on Electrical Machines and Systems (ICEMS), Sydney, Australia, 11–14 August 2017; pp. 1–6. [Google Scholar] [CrossRef]
- Jang, G.H.; Lieu, D.K. Vibration reduction in electric machine by interlocking of the magnets. IEEE Trans. Magn. 1993, 29, 1423–1426. [Google Scholar] [CrossRef]
- Dorrell, D.G.; Hsieh, M.; Guo, Y. Unbalanced Magnet Pull in Large Brushless Rare-Earth Permanent Magnet Motors With Rotor Eccentricity. IEEE Trans. Magn. 2009, 45, 4586–4589. [Google Scholar] [CrossRef]
- Calleecharan, Y.; Aidanpaa, J. Stability analysis of an hydropower generator subjected to unbalanced magnetic pull. IET Sci. Meas. Technol. 2011, 5, 231–243. [Google Scholar] [CrossRef]
- Ruf, A.; Schröder, M.; Putri, A.; Franck, D.; Hameyer, K. Analysis and determination of mechanical bearing load caused by unbalanced magnetic pull. In Proceedings of the 2014 17th International Conference on Electrical Machines and Systems (ICEMS), Zhejiang, China, 22–25 October 2014; pp. 8–14. [Google Scholar] [CrossRef]
- Maruthi, G.S.; Hegde, V. Mathematical analysis of unbalanced magnetic pull and detection of mixed air gap eccentricity in induction motor by vibration analysis using MEMS accelerometer. In Proceedings of the 2013 IEEE 1st International Conference on Condition Assessment Techniques in Electrical Systems (CATCON), Kolkata, India, 6–8 December 2013; pp. 207–212. [Google Scholar]
- Li, J.T.; Liu, Z.J.; Nay, L.H.A. Effect of radial magnetic forces in permanent magnet motors with rotor eccentricity. IEEE Trans. Magn. 2007, 43, 2525–2527. [Google Scholar] [CrossRef]
- Aggarwal, A.; Strangas, E.G.; Agapiou, J. Robust Voltage based Technique for Automatic Off-Line Detection of Static Eccentricity of PMSM. In Proceedings of the 2019 IEEE International Electric Machines Drives Conference (IEMDC), San Diego, CA, USA, 11–15 May 2019; pp. 351–358. [Google Scholar] [CrossRef]
- Cameron, J.R.; Thomson, W.T.; Dow, A.B. Vibration and current monitoring for detecting airgap eccentricity in large induction motors. IEE Proc. B Electr. Power Appl. 1986, 133, 155–163. [Google Scholar] [CrossRef]
- Heller, B.; Hamata, V. Harmonic Field Effects in Induction Machines; Elsevier Scientific Publishing Company: Amsterdam, The Netherlands, 1977. [Google Scholar]
- Rahman, K.M.; Hiti, S. Identification of machine parameters of a synchronous motor. In Proceedings of the 38th IAS Annual Meeting on Conference Record of the Industry Applications Conference, Salt Lake City, UT, USA, 12–16 October 2003; Volume 1, pp. 409–415. [Google Scholar] [CrossRef]
- Cintron-Rivera, J.G.; Babel, A.S.; Montalvo-Ortiz, E.E.; Foster, S.N.; Strangas, E.G. A simplified characterization method including saturation effects for permanent magnet Machines. In Proceedings of the 2012 XXth International Conference on Electrical Machines, Marseille, France, 2–5 September 2012; pp. 837–843. [Google Scholar] [CrossRef]
- Kliman, G.B.; Stein, J. Methods of Motor Current Signature Analysis. Electr. Mach. Power Syst. 1992, 20, 463–474. [Google Scholar] [CrossRef]
- Chin, R.; Kanninen, P. The Phenomenon of Magnetic Force: Estimating its Effects on Wind Turbine Generators. IEEE Ind. Appl. Mag. 2013, 19, 39–46. [Google Scholar] [CrossRef]
- Ebrahimi, B.M.; Faiz, J. Magnetic field and vibration monitoring in permanent magnet synchronous motors under eccentricity fault. IET Electr. Power Appl. 2012, 6, 35–45. [Google Scholar] [CrossRef]
© 2019 by the authors. Licensee MDPI, Basel, Switzerland. This article is an open access article distributed under the terms and conditions of the Creative Commons Attribution (CC BY) license (http://creativecommons.org/licenses/by/4.0/).