Abstract
The aerodynamic performance of the blade determines the power and load characteristics of a wind turbine. In this paper, numerical research of the active deformation of an airfoil with equal thickness camber line was carried out, which shows the great potential of this active flow control method to improve the flow field. The NACA0012 is taken as the reference airfoil, and the inflow wind speed is 9 m/s, the chord length of the airfoil is 0.4 m, and the Reynolds number is 2.5 × 10⁵. The influence factors, such as deformation amplitude and deformation frequency on the aerodynamic performance, were studied at different attack angles before and after stall. Studies have shown that: firstly, at different angles of attack, different deformation amplitudes and frequencies have great influence on the aerodynamic performance of the active deformed airfoil. The active deformation can improve the aerodynamic performance of the airfoil in different degrees in deep stall and light stall regions. Secondly, a suitable deformation amplitude and deformation frequency can improve the aerodynamic performance of airfoil stably and effectively in light stall, which occurs when the deformation amplitude equals to 0.02c and the deformation frequency is lower than 2 Hz, and the maximum lift-drag ratio can be increased by about 25%. Before stall, when the deformation frequency is 2 Hz and amplitude is 0.10c, the airfoil will have a negative drag coefficient in the process of deformation, and the airfoil will produce a thrust which is similar to the energy capture of the flapping foil. This is an unexpected discovery in our research.
1. Introduction
The research of the vertical axis wind turbine started late. In short, there have been three development peaks in history [1]. The energy acquisition mode of vertical axis wind turbine is as follows: under the action of wind, the blade generates aerodynamic force, which forms the torque to the shaft through the connection between the crossbeam and the shaft, making the wind wheel rotate. Therefore, the blade is the most important part of the straight blade vertical axis wind turbine [2,3,4].
The blade design of horizontal-axis and vertical-axis wind turbines usually refers to the more suitable airfoil profile of the aircraft. In order to improve the aerodynamic performance of the aircraft, the designers realize the efficient, safe and flexible flight of the aircraft by performing various active and passive controls on the wings. Most of these different control methods can be used for reference and to improve the aerodynamic performance of wind turbine blades. Human beings have always dreamed of flying as flexibly and freely as birds. Birds can adjust their wing flying posture according to their flying state in time to complete gliding, circling, attacking, and other actions with the best efficiency. With the continuous improvement of wind turbine design requirements for high aerodynamic performance, intelligent deformed wind turbine blades, which are as efficient and flexible as bird wings, have gradually become a research hotspot in academia and engineering. Mohamed et al. [5,6] carried out numerical simulation on the aerodynamic performance of the vertical axis wind turbine with flexible airfoil. During the rotation of vertical axis wind turbine, the leading edge and trailing edge of airfoil have certain deformation law according to the phase angle variation. By controlling the change of the vertical axis wind airfoil, it was found that the wind energy utilization of the vertical axis wind turbine with flexible airfoil is higher than that of the traditional fixed airfoil, and its aerodynamic performance has been greatly improved.
In order to meet different flight tasks or flight environments, people hope that the aircraft can deform along with the flight state through the wings or the airframe itself, so as to obtain higher flight efficiency and stronger maneuverability. With the continuous development of materials and automatic control technology, the deformed wing can be realized in a variety of ways such as with variable sweep, variable camber, variable wing surface area, and variable aspect ratio. Variable camber wing can effectively control the flow separation on the wing surface and greatly improve the aerodynamic performance of the aircraft. Kota [7] developed a variable geometry leading edge for high-performance SikorskySSC-A09 rotor blades by adopting a flexible mechanism. The variable geometry allows the blades to maintain an optimal shape so that the aerodynamic performance of the blades is optimal and the stall of the blades is delayed, thus improving their forward speed, maneuverability, and payload. Monner et al. [8] proposed that the seamless deformation of the wing leading edge has the potential to reduce fuselage noise and drag, and provided a new device that can only have seamless leading edge instead of A380 traditional droop leading edge to improve the aerodynamic efficiency of the wing. Bilgen et al. [9] have proposed a new design method of bi-directional variable curvature blade, using piezoelectric ceramic complex actuator (MFC), which is an efficient variable lift lifting device. Wildschek et al. [10] proposed the deformation trailing edge of all composite materials and showed that this multifunctional seamless deformation control surface is a promising method. Tomohiro et al. [11] used a corrugated structure at the trailing edge of the wing, and used chordal tension of connecting wires to control the flexible seamless deformation of the trailing edge of the wing. The aerodynamic performance of the wing under different trailing edge deflections was tested in a wind tunnel, which verified the superior performance of the wing in terms of lift coefficient along with the trailing edge deflection under this deformation method. Hao [12] developed a trailing edge variable camber wing model. The unsteady aerodynamic characteristics of the wing under different camber change rates were studied in a wind tunnel experimental platform, revealing the effect of the wing on flow suppression under unsteady motion. Liu [13] designed a wing with continuously variable camber and constant thickness at the base front and rear edges, and calculated and analyzed the flow field and aerodynamic performance of the airfoil under various deformation states. Chen [14] studied the change of aerodynamic characteristics of airfoil under the condition of changing thickness and camber through numerical simulation, and analyzed the influence of different deformation amplitude, deformation speed and deformation acceleration on unsteady aerodynamic coefficient. A kind of wing with adaptive camber angle was developed and tested under quasi-steady conditions. Yang [15] designed and manufactured an airfoil model with active camber deformation. The flow separation characteristics of wing with variable cambers under continuous quasi-steady deformation were discovered based on the wind tunnel experiment. In order to improve the aerodynamic performance of supercritical airfoil under different condition, a realizable design concept of continuous trailing edge variable camber adaptive wing (Active Compliant Trailing Edge, ACTE) was designed and developed [16]. NASA (National Aeronautics and Space Administration), AFRL (Air Force Research Laboratory), and FlexSys integrated the Adaptive Compliant Trailing Edge Flap into the Gulfstream III business jet. Through the flight test results, the flexible trailing edge can significantly improve the aerodynamic performance of the aircraft [17].
The above research on variable camber of airfoils has all focused on the design of airfoils, and the Reynolds number is relatively large in its corresponding numerical simulation and experiments. If the relevant research results and conclusions are directly applied to the design of deformed airfoils of vertical axis wind turbines, it will certainly not be applicable. Previous literature [18] has verified the feasibility of NACA0012 airfoil with variable camber around the center of maximum thickness based on the concept of rib rotation, and has successfully designed and developed a vertical axis wind turbine blade model that can realize reciprocating continuous smooth variable camber with only a single input shaft. At Reynolds number of 2.5 × 10⁵, quasi-steady force measurement and flow field display experiments are carried out on the developed blade model under different deformation. The research shows that the blade can improve the aerodynamic performance of the whole blade within the experimental angle of attack through deformation within the appropriate range of blade deformation. The literature [18] mainly focuses on quasi-steady experiments. For example, when the blade is applied to a vertical axis wind turbine, it is necessary to study the unsteady aerodynamic performance of the blade at different bending rate. Therefore, this paper mainly focuses on unsteady numerical simulation of deformed blades at Reynolds number in reference [18], i.e., Re = 2.5 × 10⁵. With NACA0012 as the reference airfoil, the influence of constant thickness chamber line active deformed movement on airfoil aerodynamic performance is studied at different angles of attack before and after stall, and the influence of different deformation amplitudes and deformation frequencies on airfoil aerodynamic performance is also studied. This is a kind of camber line deformation with simple harmonic form. The equal thickness deformation of the upper and lower airfoil surfaces is realized by the guidance of camber line. In this paper, only one direction of deformation is selected as the research object, that is, one deformation period is described as the original deformation of the airfoil to the maximum deformation amplitude, and then to the original shape. The above research results are helpful to study the dynamic characteristics of deformed blades.
Dynamic stall can be divided into light stall and deep stall. In addition to the general static stall characteristics, the light stall has the characteristics of strong viscous/inviscid interaction in unsteady separation. In this case, the boundary layer thickness is the order of airfoil thickness. The deep stall is a fully viscous phenomenon, with highly nonlinear pressure fluctuation and large eddy motion on the surface of the airfoil. In this case, the thickness of the boundary layer can reach the order of chord length. Both light stall and deep stall have a great influence on the force and moment of the airfoil and blade, thus, it is very important to study deeply in engineering.
In this paper, the unsteady aerodynamic performance of an airfoil with constant thickness and active camber for a given motion law is mainly studied by numerical simulation. Firstly, the reliability of the numerical simulation method in this paper is verified, and the method used in this paper is compared with the quasi-steady airfoil flow experiment and oscillating airfoil unsteady experiment respectively. Secondly, the influence of deformation frequency and deformation amplitude on the flow control effect of deformed airfoil at different stall angles of attack is discussed. By analyzing the flow field structures of deformed airfoils and rigid airfoils, the causes of aerodynamic performance changes after airfoil deformation are discussed.
2. Mathematical Model
2.1. Control Method for Equal Thickness Deformation of Airfoil
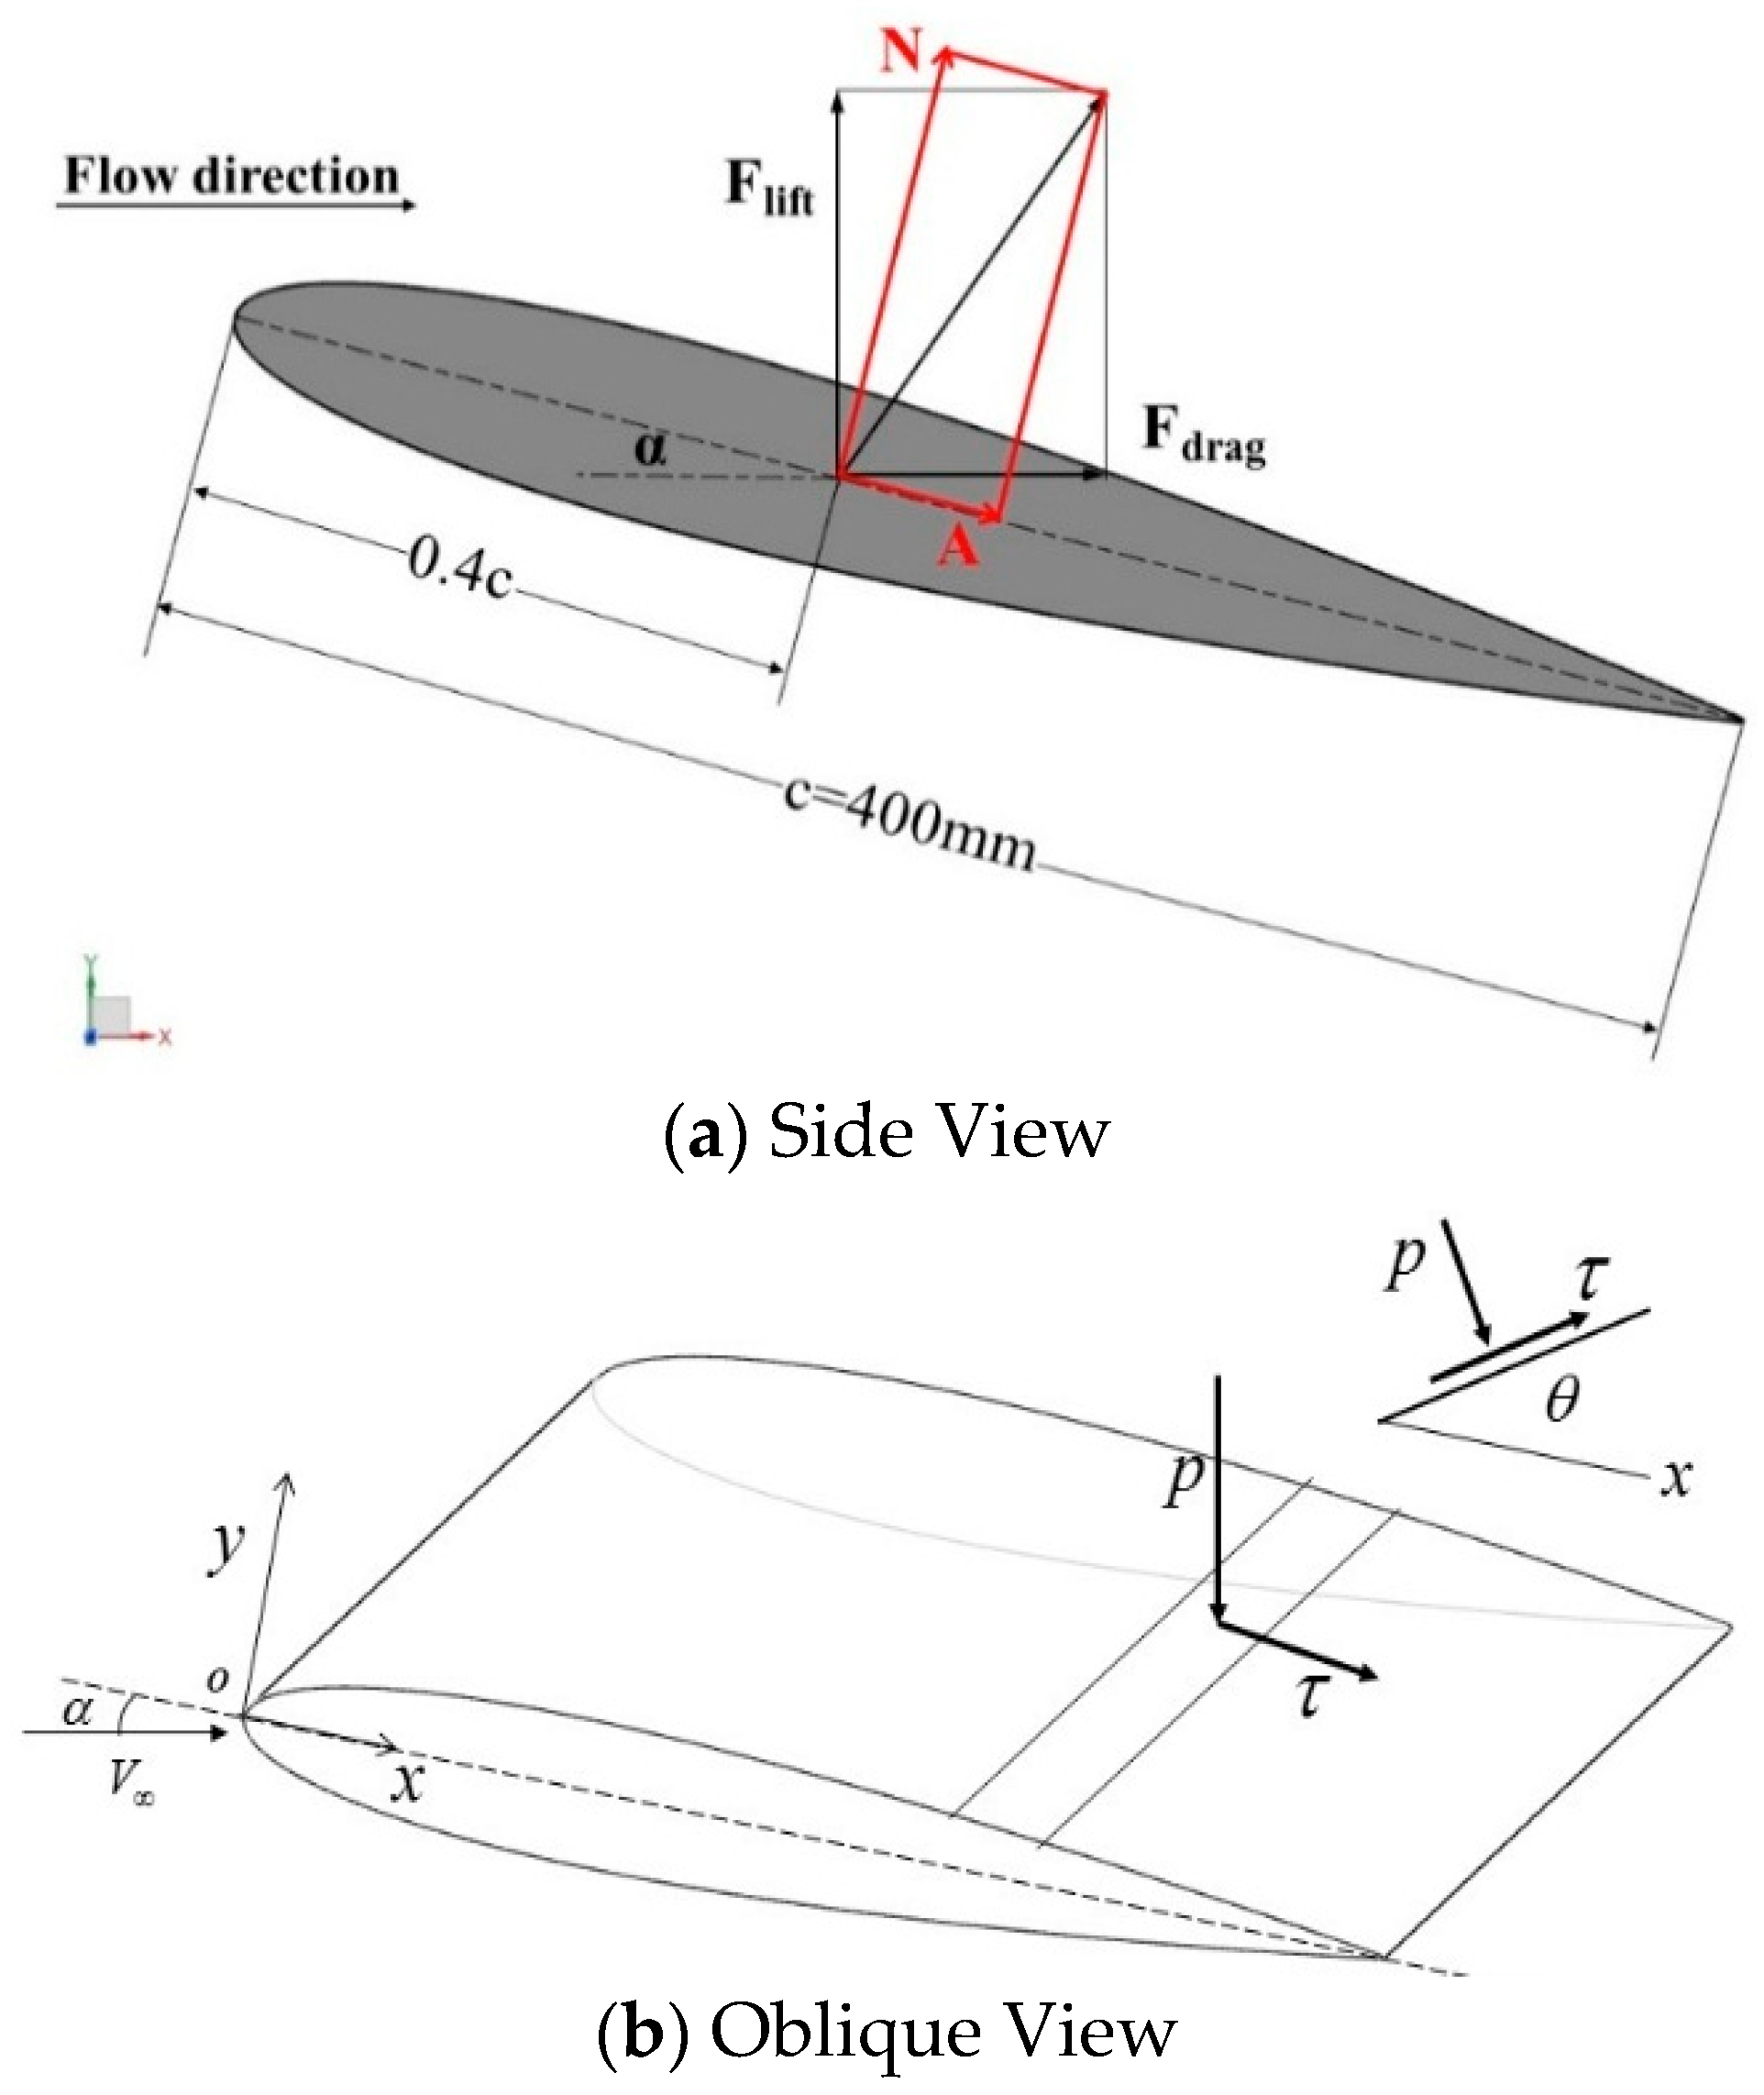
When air flows around the airfoil, the pressure p (direction perpendicular to the airfoil) and frictional shear stress τ (direction tangent to the airfoil) act on each point of the airfoil surface. The relationship is showed in Figure 1 and Equations (1) and (2). The two will jointly generate a resultant force R, the acting point of the resultant force is the pressure center, the component of the resultant force in the incoming flow direction is drag force Fd, and the component perpendicular to the incoming flow direction is lift force Fl, as shown in Equations (3) and (4).
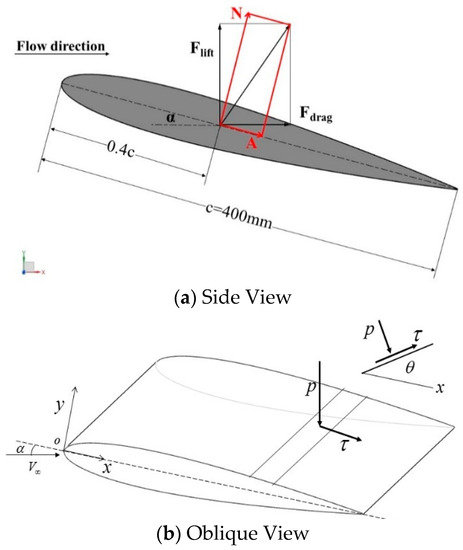
Figure 1.
Stress Analysis Diagram of Airfoil (Side View and Oblique View).
Therefore, the expressions of airfoil lift force and drag force are as follows:
The deformation of the airfoil is controlled by superimposing the chamber line on the reference airfoil by constructing a function; thus, the influence of different frequencies and different deformation amplitudes on the unsteady aerodynamic performance of the airfoil at different angles of attack can be further studied, as shown in Equation (5):
In the formula, expresses the deformation amount of the camber line in the airfoil, where x is the coordinate along the chord direction in the coordinate system, and the unit is m; is the deformation amplitude of the chamber line, in m; l is the maximum deformation position, in m; g(t) is a time-varying function.
Figure 2 is a schematic diagram of active deformation of the airfoil. In this paper, the maximum deformation position of the airfoil is 0.4c, and the amplitude of the deformation of the middle camber line is 0.020c, 0.05c, and 0.10c, respectively. In the figure, the corresponding green, blue, and red contours are showed. The original symmetrical airfoil is identified by black lines. is the maximum distance between the chamber line after the airfoil deformation and the camber line in the original symmetrical airfoil when the airfoil deformation reaches its maximum.

Figure 2.
Schematic Diagram of Active Deformation of Airfoil.
2.2. Calculation Methods and Grid Division
2.2.1. Basic Equations and Turbulence Models
Because the airfoil is at a high angle of attack, the flow field is considered to be unsteady, and the fluid can be considered incompressible as the incoming Mach number is low. The incompressible Reynolds average N-S equation is used as the governing equation:
where is time, refers to the cartesian coordinates, and represent components of time-averaged velocity and pulsation velocity, respectively, is time averaged pressure, is density, and is kinetic viscosity of working fluids.
The SST turbulence model is adopted in this paper. The SST turbulence model is a two-equation eddy viscosity model that combines the advantages of the model and the model. The Wilcox model is used in the near wall region, while the model is used in the free shear layer and at the edge of the boundary layer. Finally, these two models are transitively connected by blending functions. The transport equation for the turbulent kinetic energy of the SST turbulence model, is as follows:
The transport equation for ω, the specific turbulent dissipation rate (s−1) (or specific turbulent frequency), is:
The Reynolds stresses (kg·m−1·s−2) are computed using two-equation models:
where is the eddy viscosity, represents the mean rate of deformation (s−1), and is the Kronecker delta function.
In this paper, due to the complex deformation of airfoil, the grid distortion around the airfoil was large. In order to maintain better grid quality and save computing cost, a denser structured grid around the airfoil was built, and a sparse structured grid for the outer computing area was adopted, so that both the grid quality and the sufficiency of the computing area could be guaranteed. During the calculation, the UDF (User Defined Functions) in fluent was used to realize the deformation movement of the airfoil. The unstructured area around the airfoil was set as deforming, and the dynamic reconstruction in the calculation process was realized by giving appropriate control parameters.
For the moving grid in Fluent, the scalar on the moving boundary of any control body should follow the following conservation equation, as shown in the following formula:
where V is the control volume, is the density of the fluid, is the velocity of the fluid, is the velocity of the moving mesh, is the diffusion coefficient, and is the source term of the scalar .
In diffusion smoothing, the grid motion is obtained by solving the diffusion equation, as shown in the following formula:
where represents the movement speed of the mesh; is the diffusion coefficient, which is used to control the influence of boundary movement on the deformation of the internal mesh.
After the above formula is solved, the grid nodes can be updated with the following formula:
where indicates the location of the new node and represents the location of the old node.
2.2.2. Flow Field Grid
The whole structure grid was used in the simulation and Fluent was used as solver. The whole calculation domain is showed in the Figure 3. The calculation domain was divided into a dynamic grid region where the internal airfoil is deformed and an external static grid region. There are uniform grids of the same size and number between the two regions to reduce the error of interface flux transfer and ensure the continuity of parameters. The airfoil and flow field parameters are showed in Table 1.

Figure 3.
Grid Profile.

Table 1.
Airfoil Profile and Flow Field Parameters.
2.2.3. Calculation Conditions
The far field adopts the pressure far field boundary condition; the airfoil wall surface adopts the non-slip solid wall boundary condition, and was solved by the PISO (Pressure Implicit Split Operator) separation algorithm for solving pressure coupling equation. The UDF calls the macro of grid changes to continuously change the contour of the deformable airfoil. At the same time, two grid reconstruction methods (fairing method and local reconstruction method) were used to reconstruct the grid in the deformation area, which ensured higher grid quality during the airfoil deformation process. The simulation specific parameter settings are shown in Table 2.

Table 2.
Numerical Set Up for Simulation.
3. Reliability Verification of Numerical Simulation
3.1. Independence Verification
3.1.1. Mesh Independence Study
500 grid nodes are arranged on the airfoil surface, and 250 are, respectively, arranged on the upper surface and the lower surface to ensure that the upper surface and the lower surface of the airfoil deformation can accurately capture the change of the flow field. The height of the first layer grid of the surface near the normal wall was 3 × 10⁻⁵, which satisfies y+ < 1, and the normal growth rate of the grid scale was less than 1.1 in both the moving grid area and the outer stationary grid area, which meets the requirements of turbulence model. The total number of grid nodes in the entire computational domain is 60,270, the radius of the dynamic grid region is 5 times the chord length, the radius of the external grid region is 12 times the chord length, and the grid amount of the dynamic grid region accounts for 80% of the total grid number. This set of grids was selected through verification of three sets of grids, with grid numbers of 43,159, 60,270, and 98,403, respectively. Three sets of grids were used to calculate the flow around a rigid airfoil from an angle of attack of 0° to 18°, respectively. Only when the angle of attack is 14° did a slight difference appear, and the calculation results of the second and third sets of grids were relatively close, with the error within 0.35%. Therefore, considering the comprehensive calculation resources and calculation accuracy, the second set of grids was selected as the reference grid for calculation.
3.1.2. Time Step Independence Study
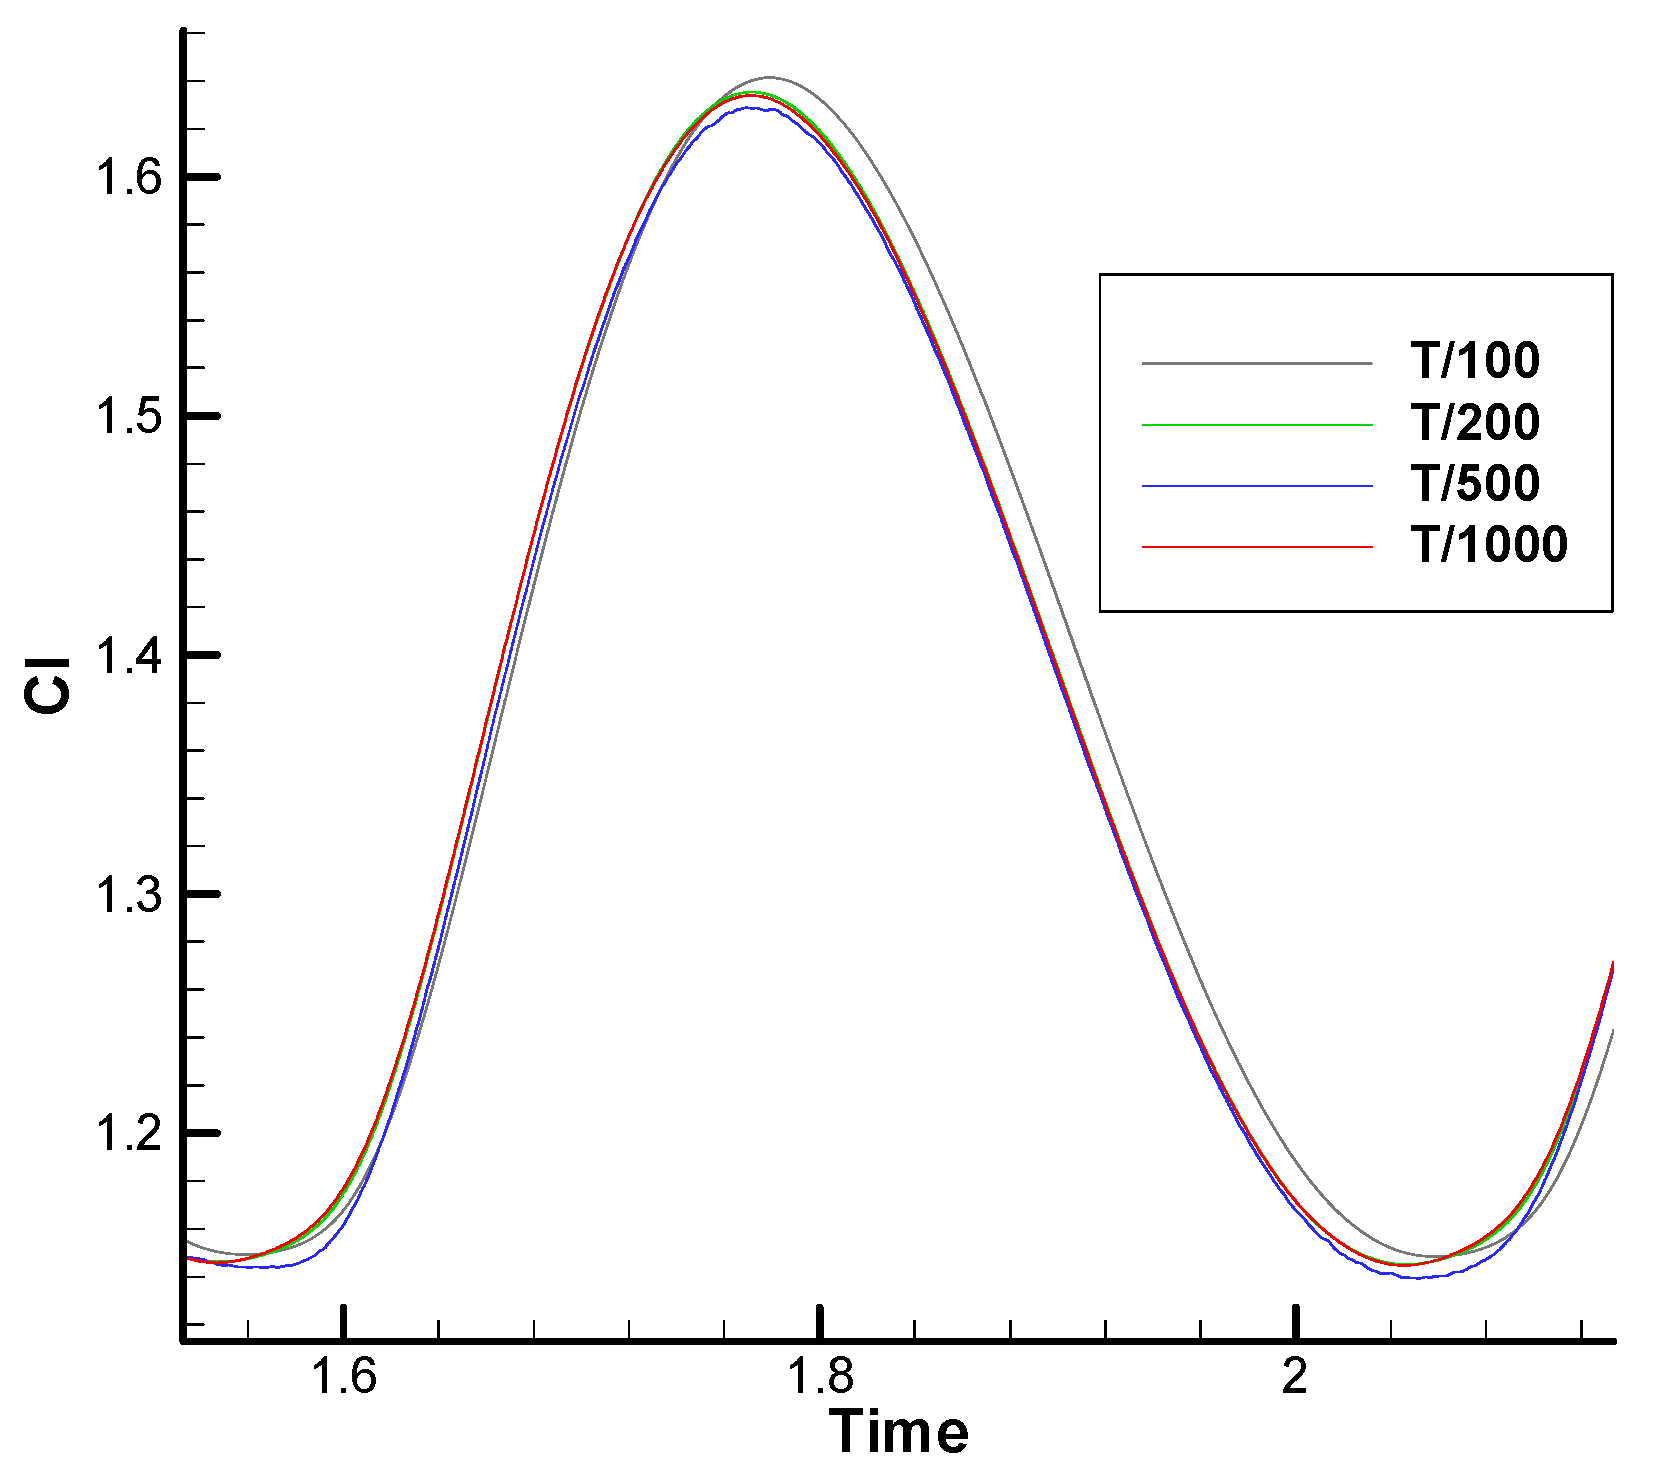
For the unsteady problem of airfoil deformation, the selection of appropriate time step ensures the accuracy of calculation and saves computational resources. In this paper, the independence of time step was verified before numerical simulation research. Four kinds of time steps (unit: s), namely T/100, T/200, T/500, and T/1000, were, respectively, selected for time independence calculation. As shown in Figure 4, in a period deformation, the variation curve of airfoil lift coefficient with time had a certain difference under different time step settings. The two curves with time steps of T/500 and T/1000 almost coincided, and the error was controlled within 0.1%. Therefore, this paper selected T/500 as the time step and iterated at least 15 periods in the calculation until the calculation was completely convergent; then, the data of a deformed period were truncated as the research and analysis object.
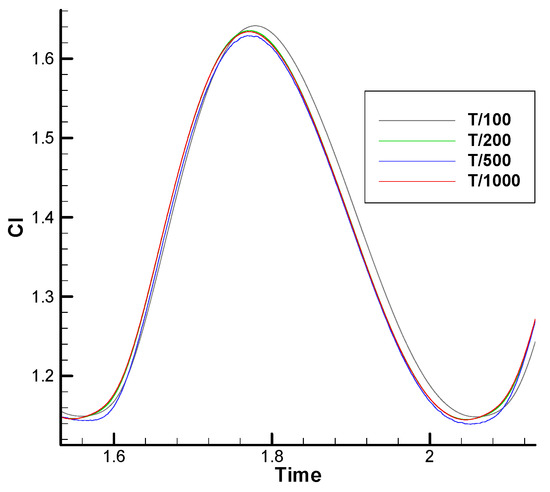
Figure 4.
Time step independence verification at α = 14°, = 0.10c, and f = 2 Hz.
3.2. Experimental Comparison
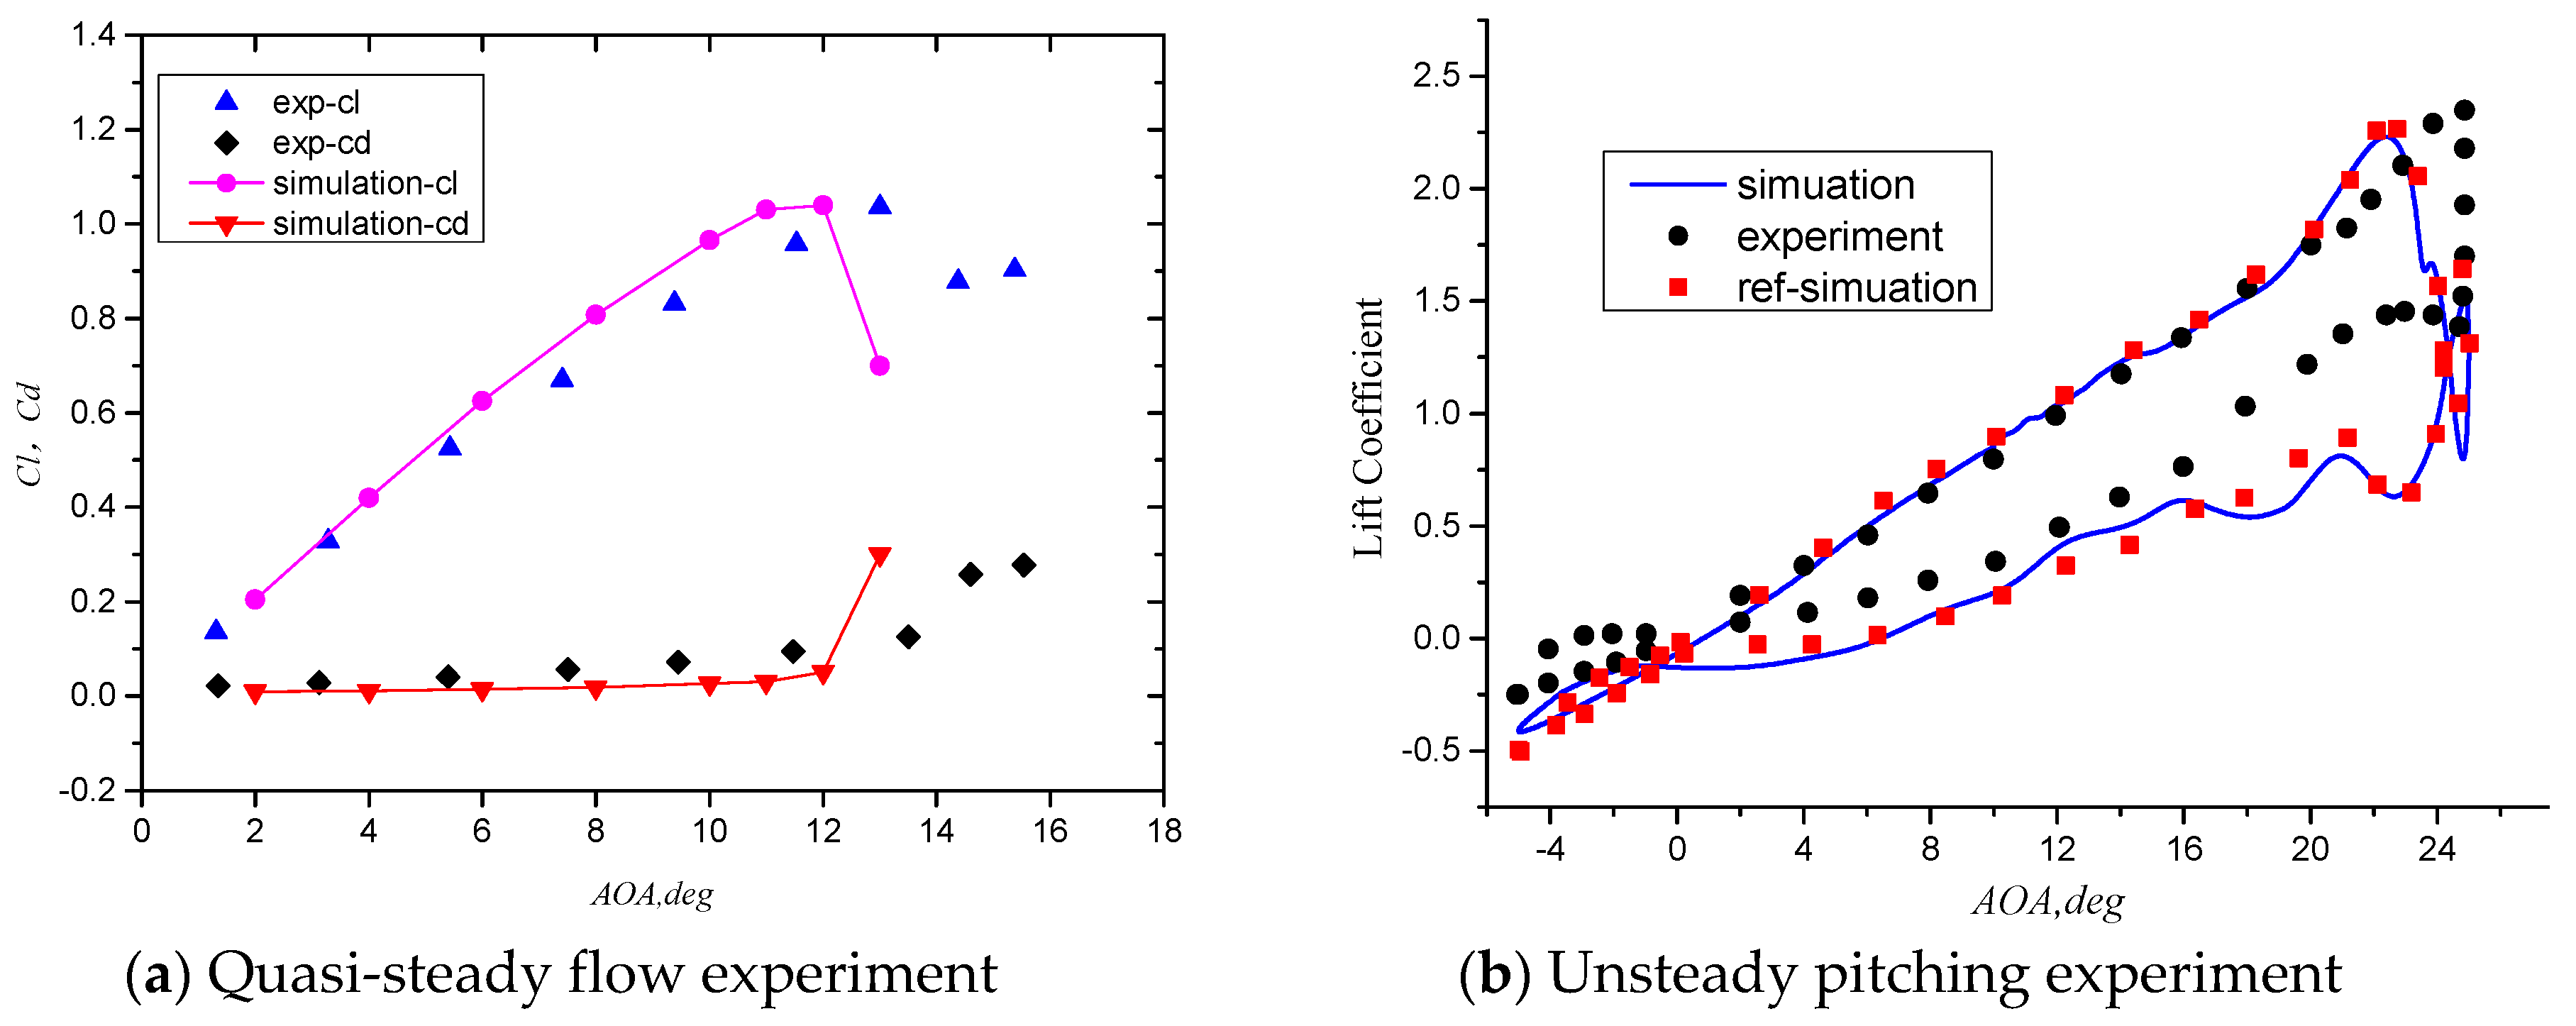
In order to verify the reliability and accuracy of the numerical method, it is compared with the NACA0012 quasi-steady flow experiment of Hansman and Craig [19] and the oscillating airfoil experiment data of Lee [20]; the results are showed in Figure 5a,b, respectively. From the comparison of quasi-steady experiments corresponding to Figure 5a, it can be seen that the numerical simulation results in this paper were almost consistent with the experimental values in a small angle of attack. Although the stall angle of attack was one degree earlier than the experimental value, the numerical simulation and experimental test values of the maximum lift coefficient corresponding to the stall angle of attack are basically the same. In the unsteady experimental comparison corresponding to Figure 5b, the motion law of the airfoil is as follows: , Reynolds number is Re = 1.35 × 10⁵, inlet airflow velocity is U∞ = 14 m/s, reduced frequency is , and inlet turbulence is 1%. A parametric scheme of study is summarized in Table 3 [14,16]. As can be seen from Figure 5b, the numerical calculation shows good agreement with the experimental value in the upstream phase of the oscillating airfoil. The angle of attack of the lift coefficient drop is slightly earlier than the experimental value. Due to the large-scale flow field separation phenomenon when the airfoil started to oscillate downward, the numerical simulation result was different from the experimental result, but the trend is basically the same. At the same time, the numerical simulation results of this paper were consistent with the numerical simulation results of Dong [21]. Overall, the numerical simulation method used in this paper is feasible, and the numerical simulation results obtained are reliable.
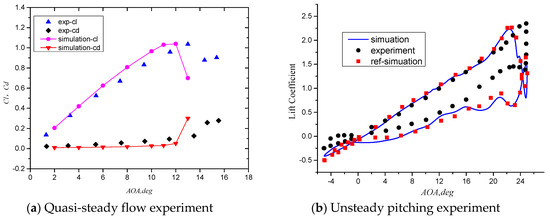
Figure 5.
Comparison of calculation results with experimental results.

Table 3.
Parametric scheme of study.
4. Calculation Results and Analysis
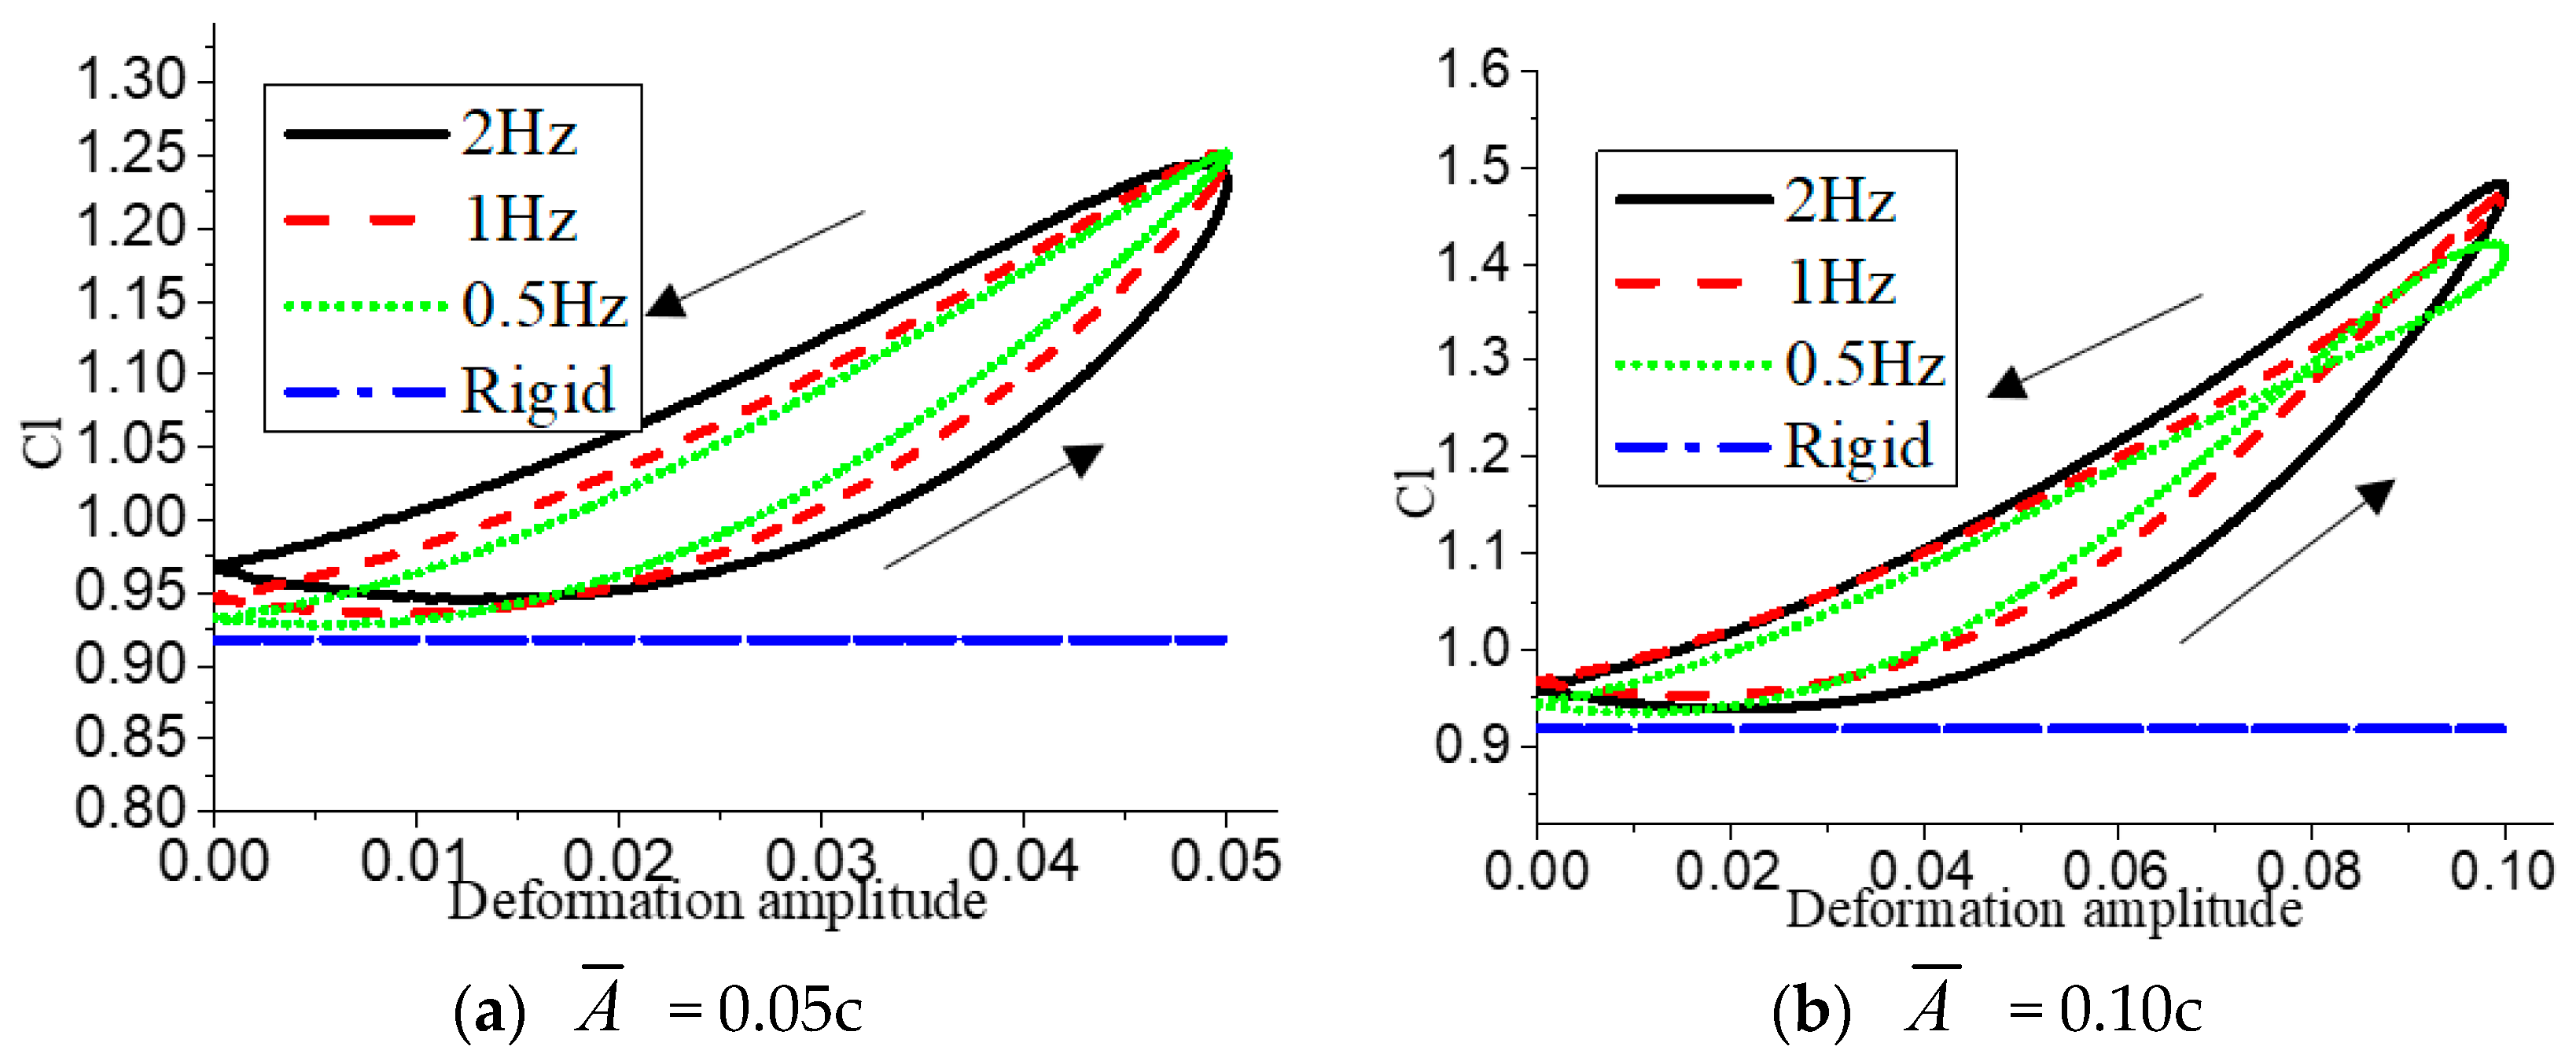
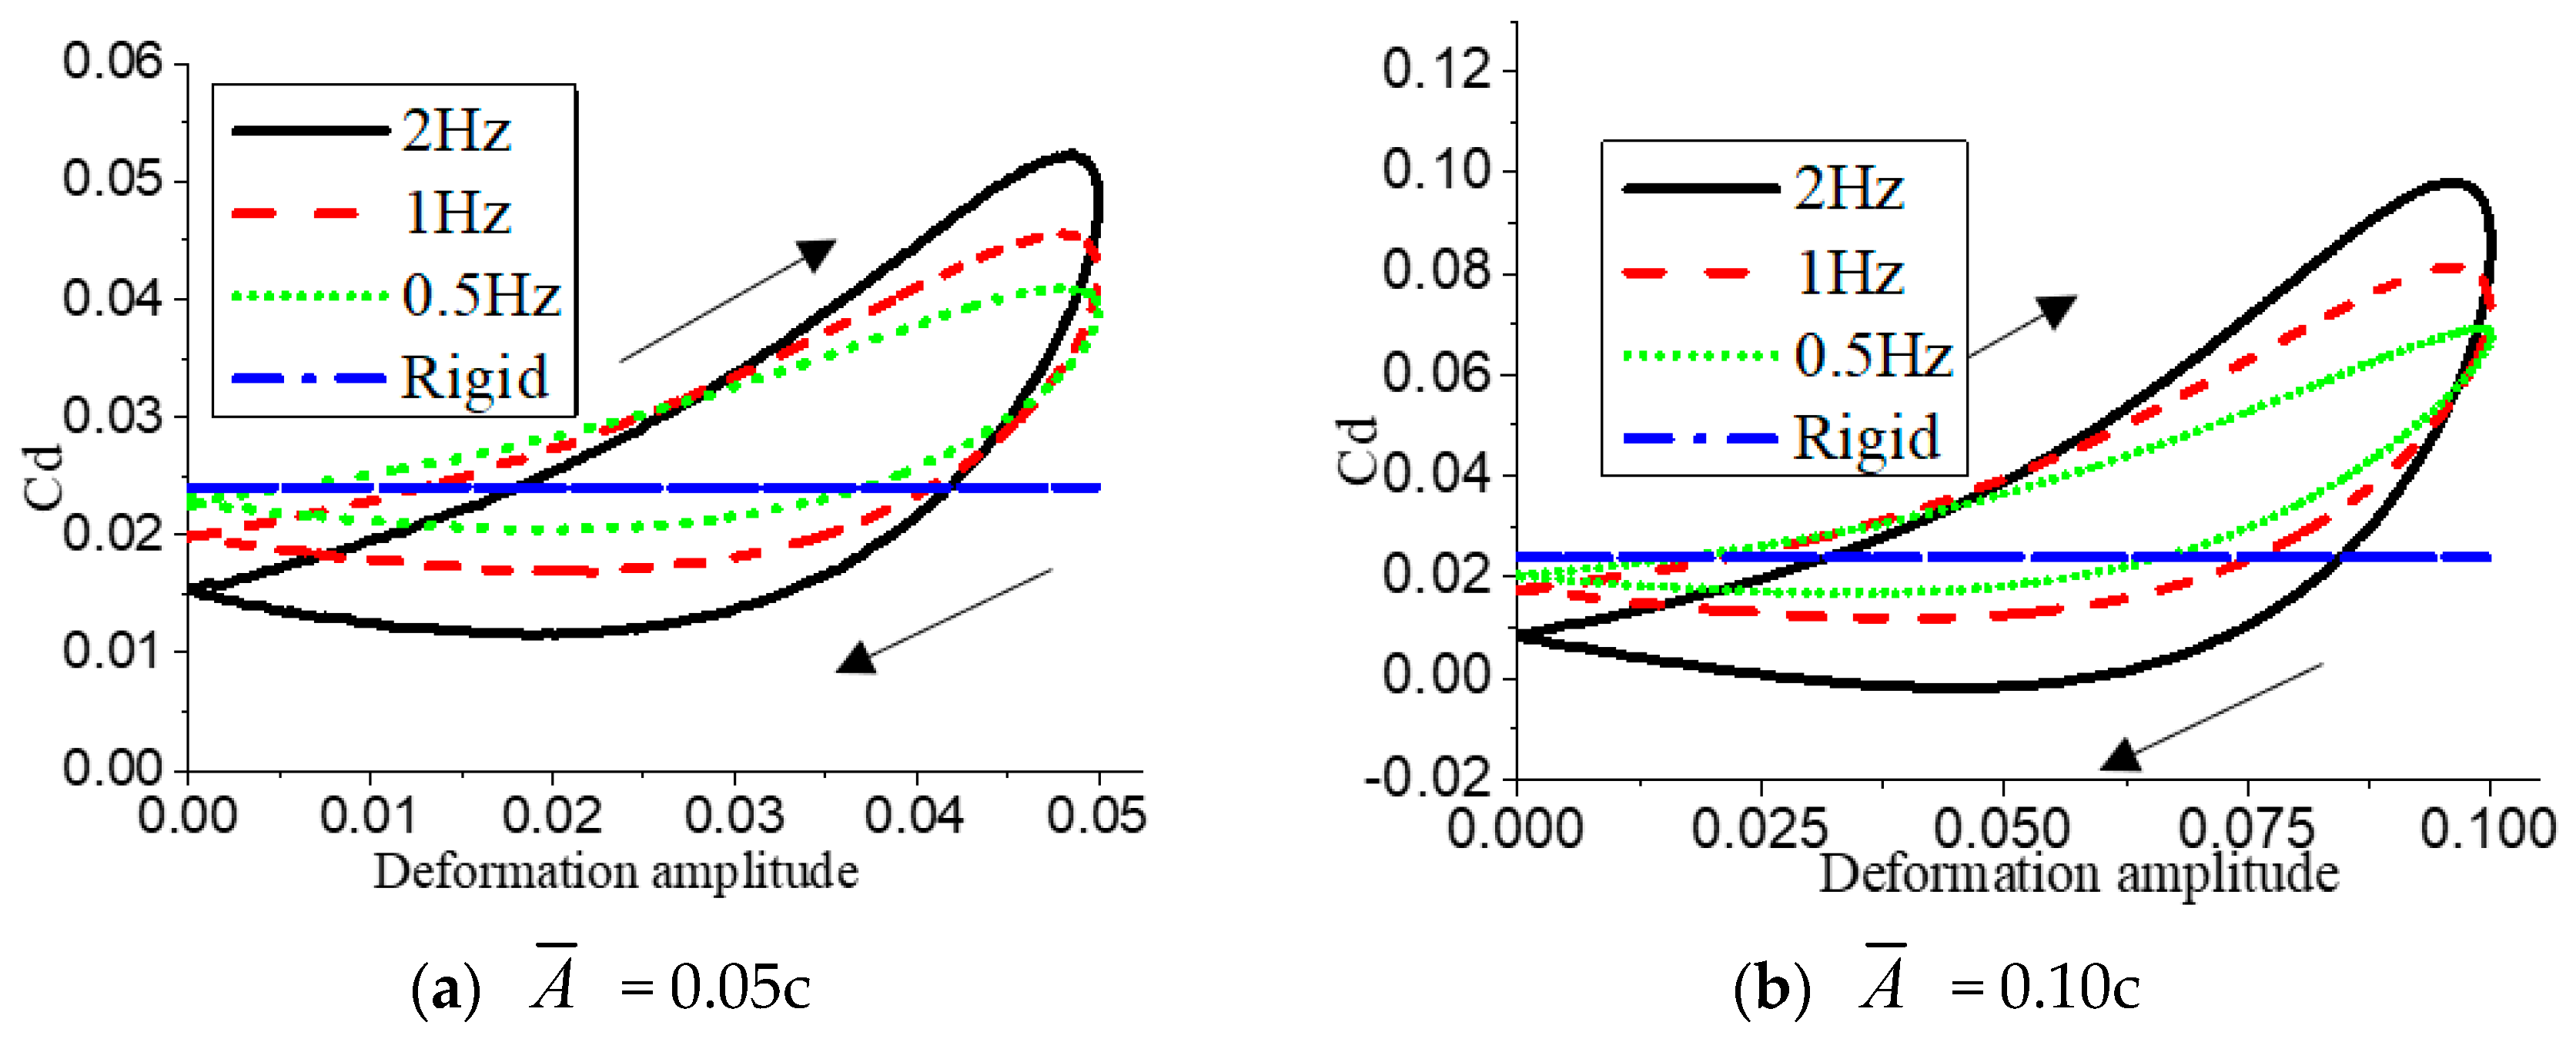
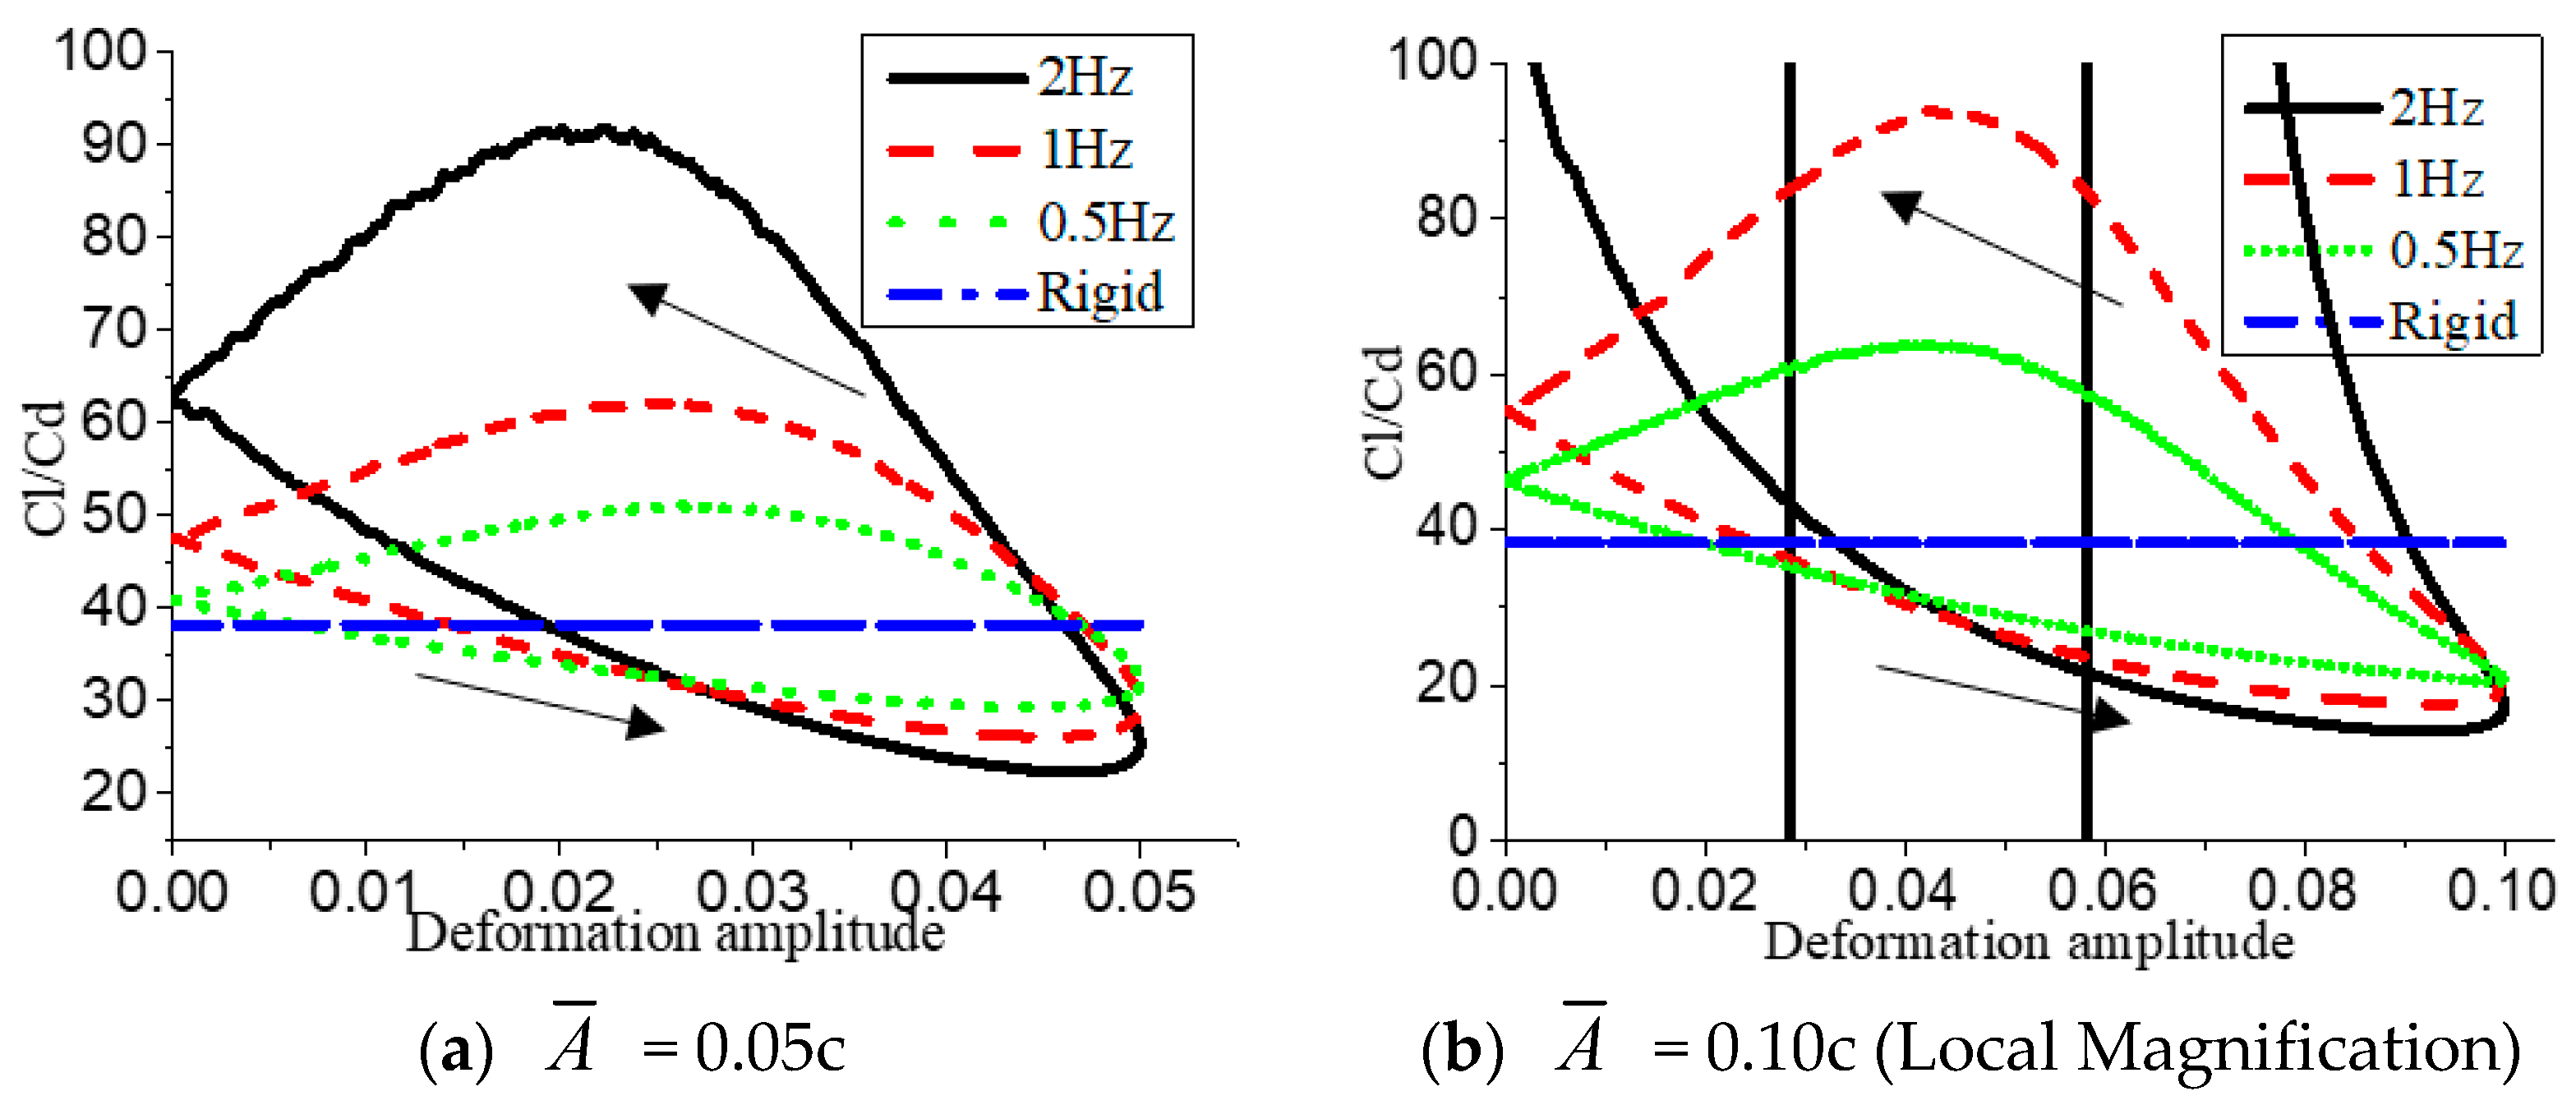
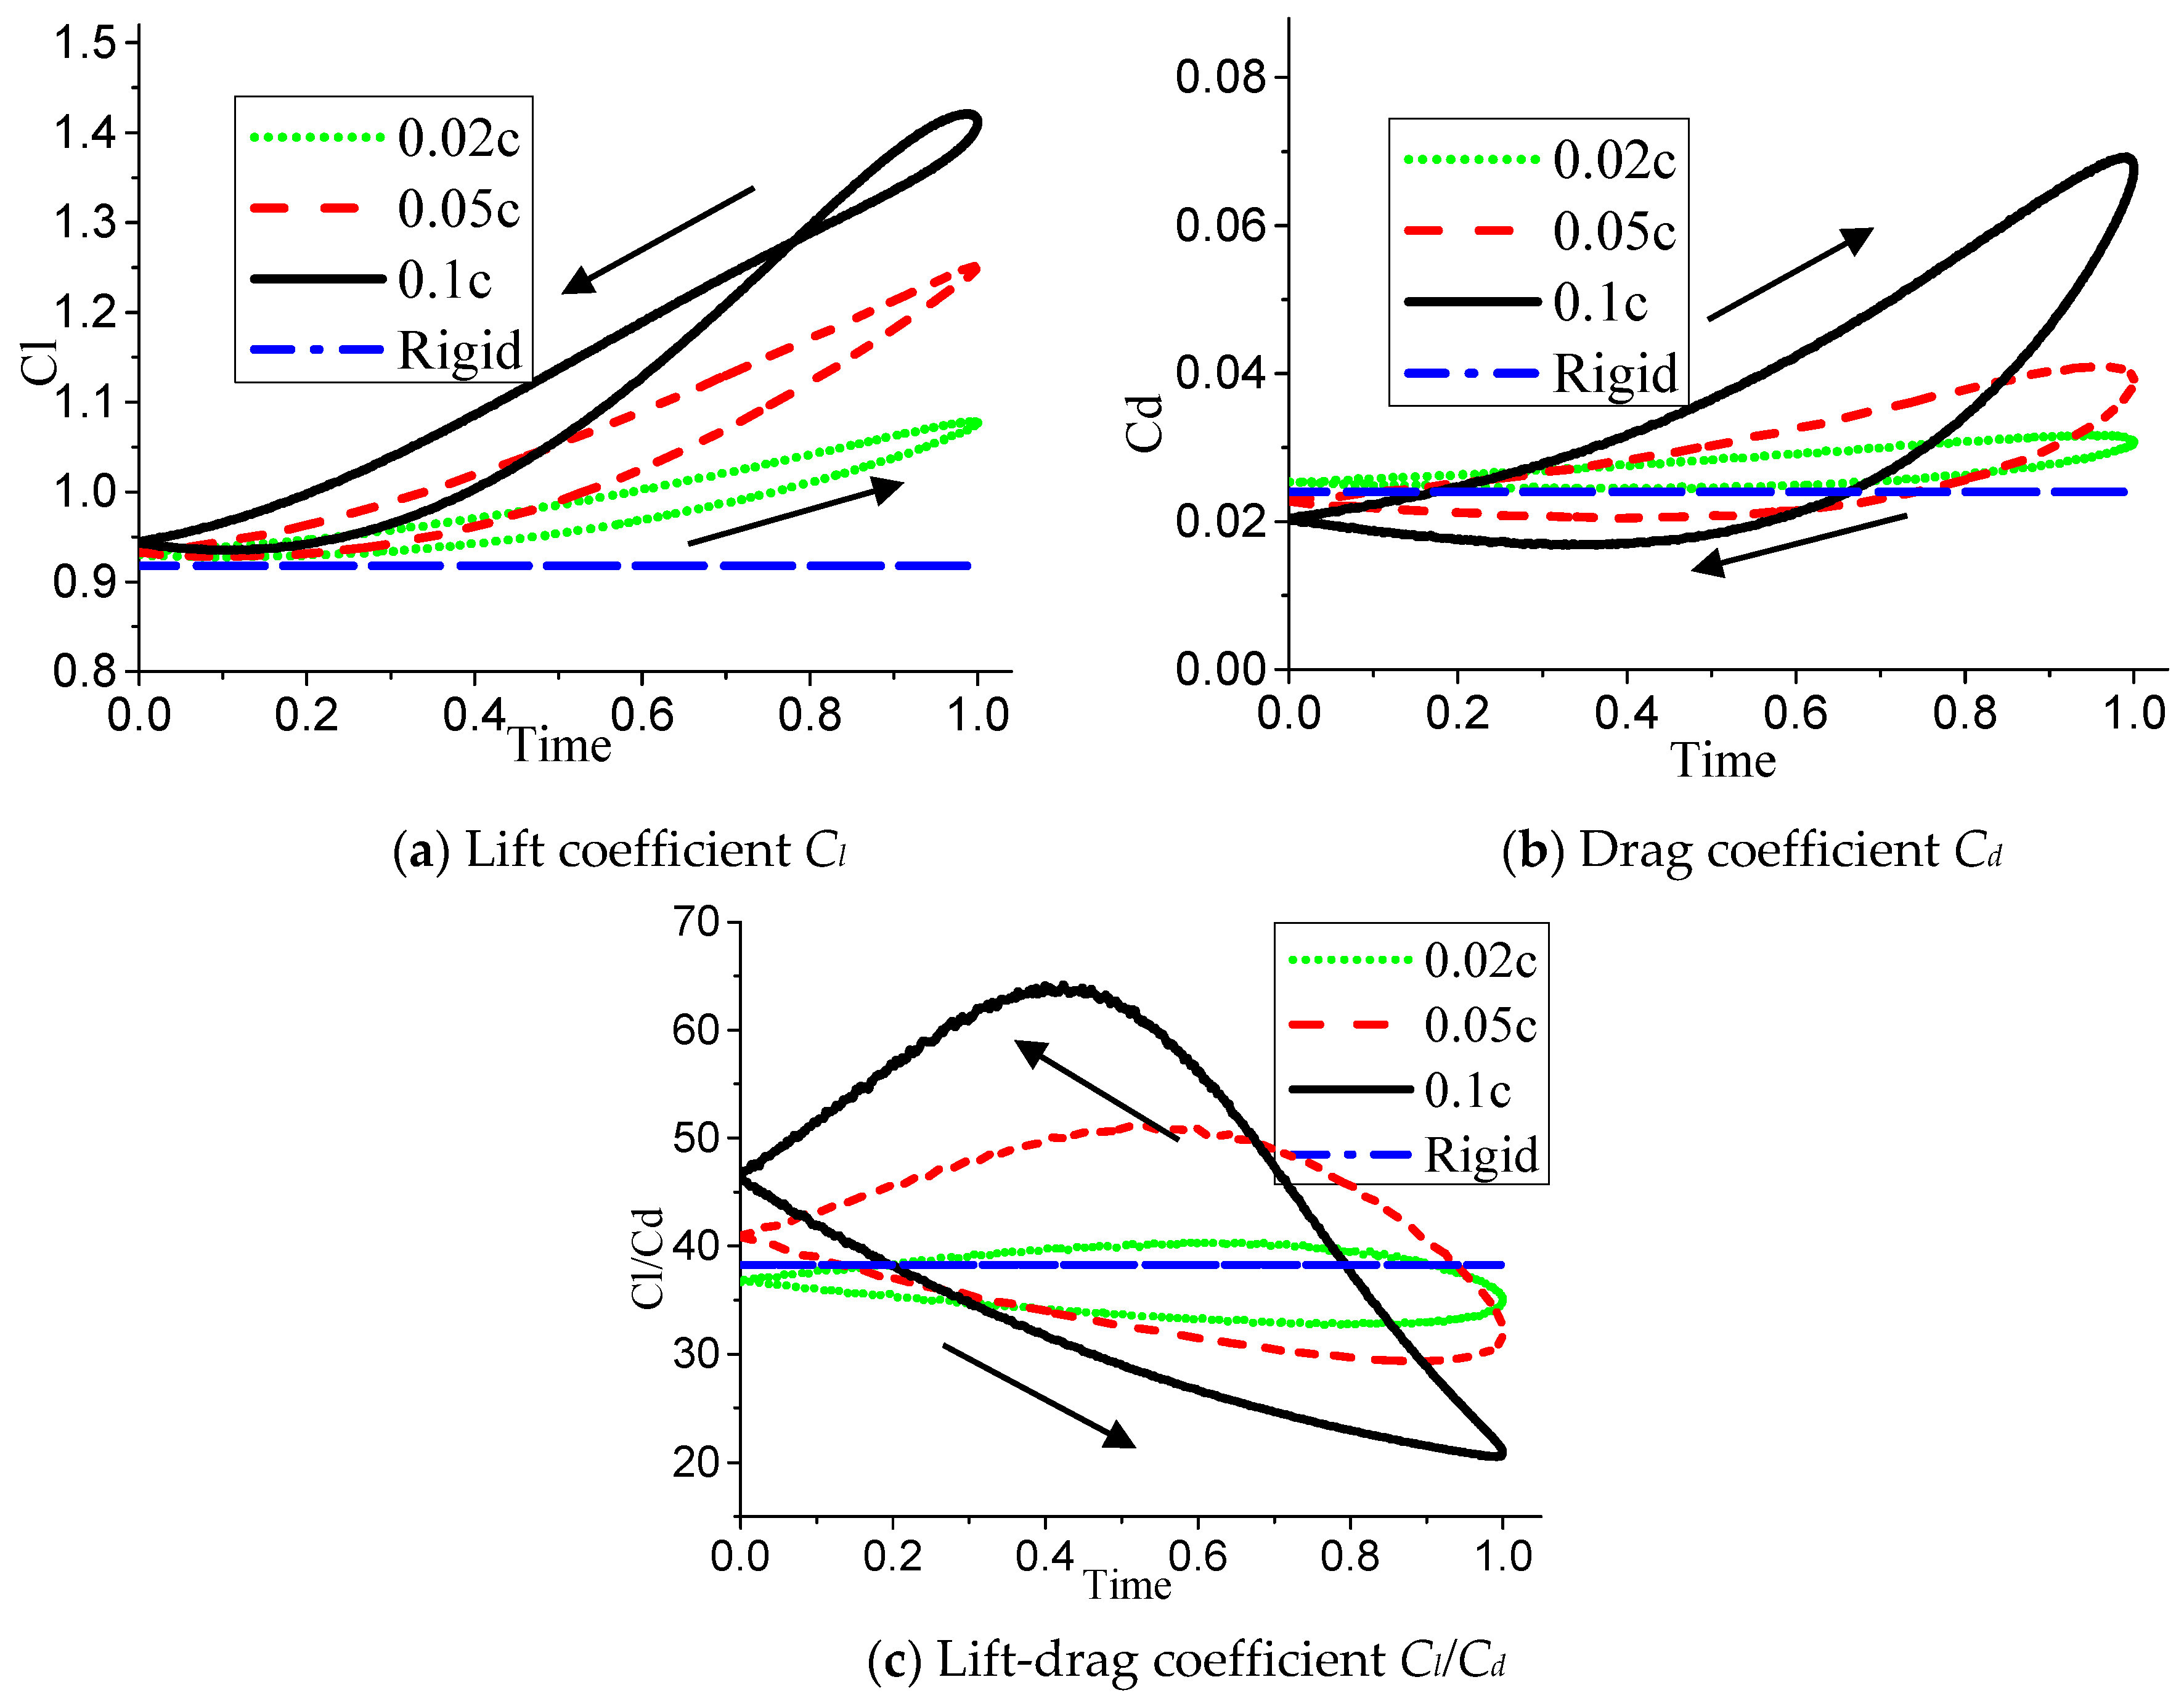
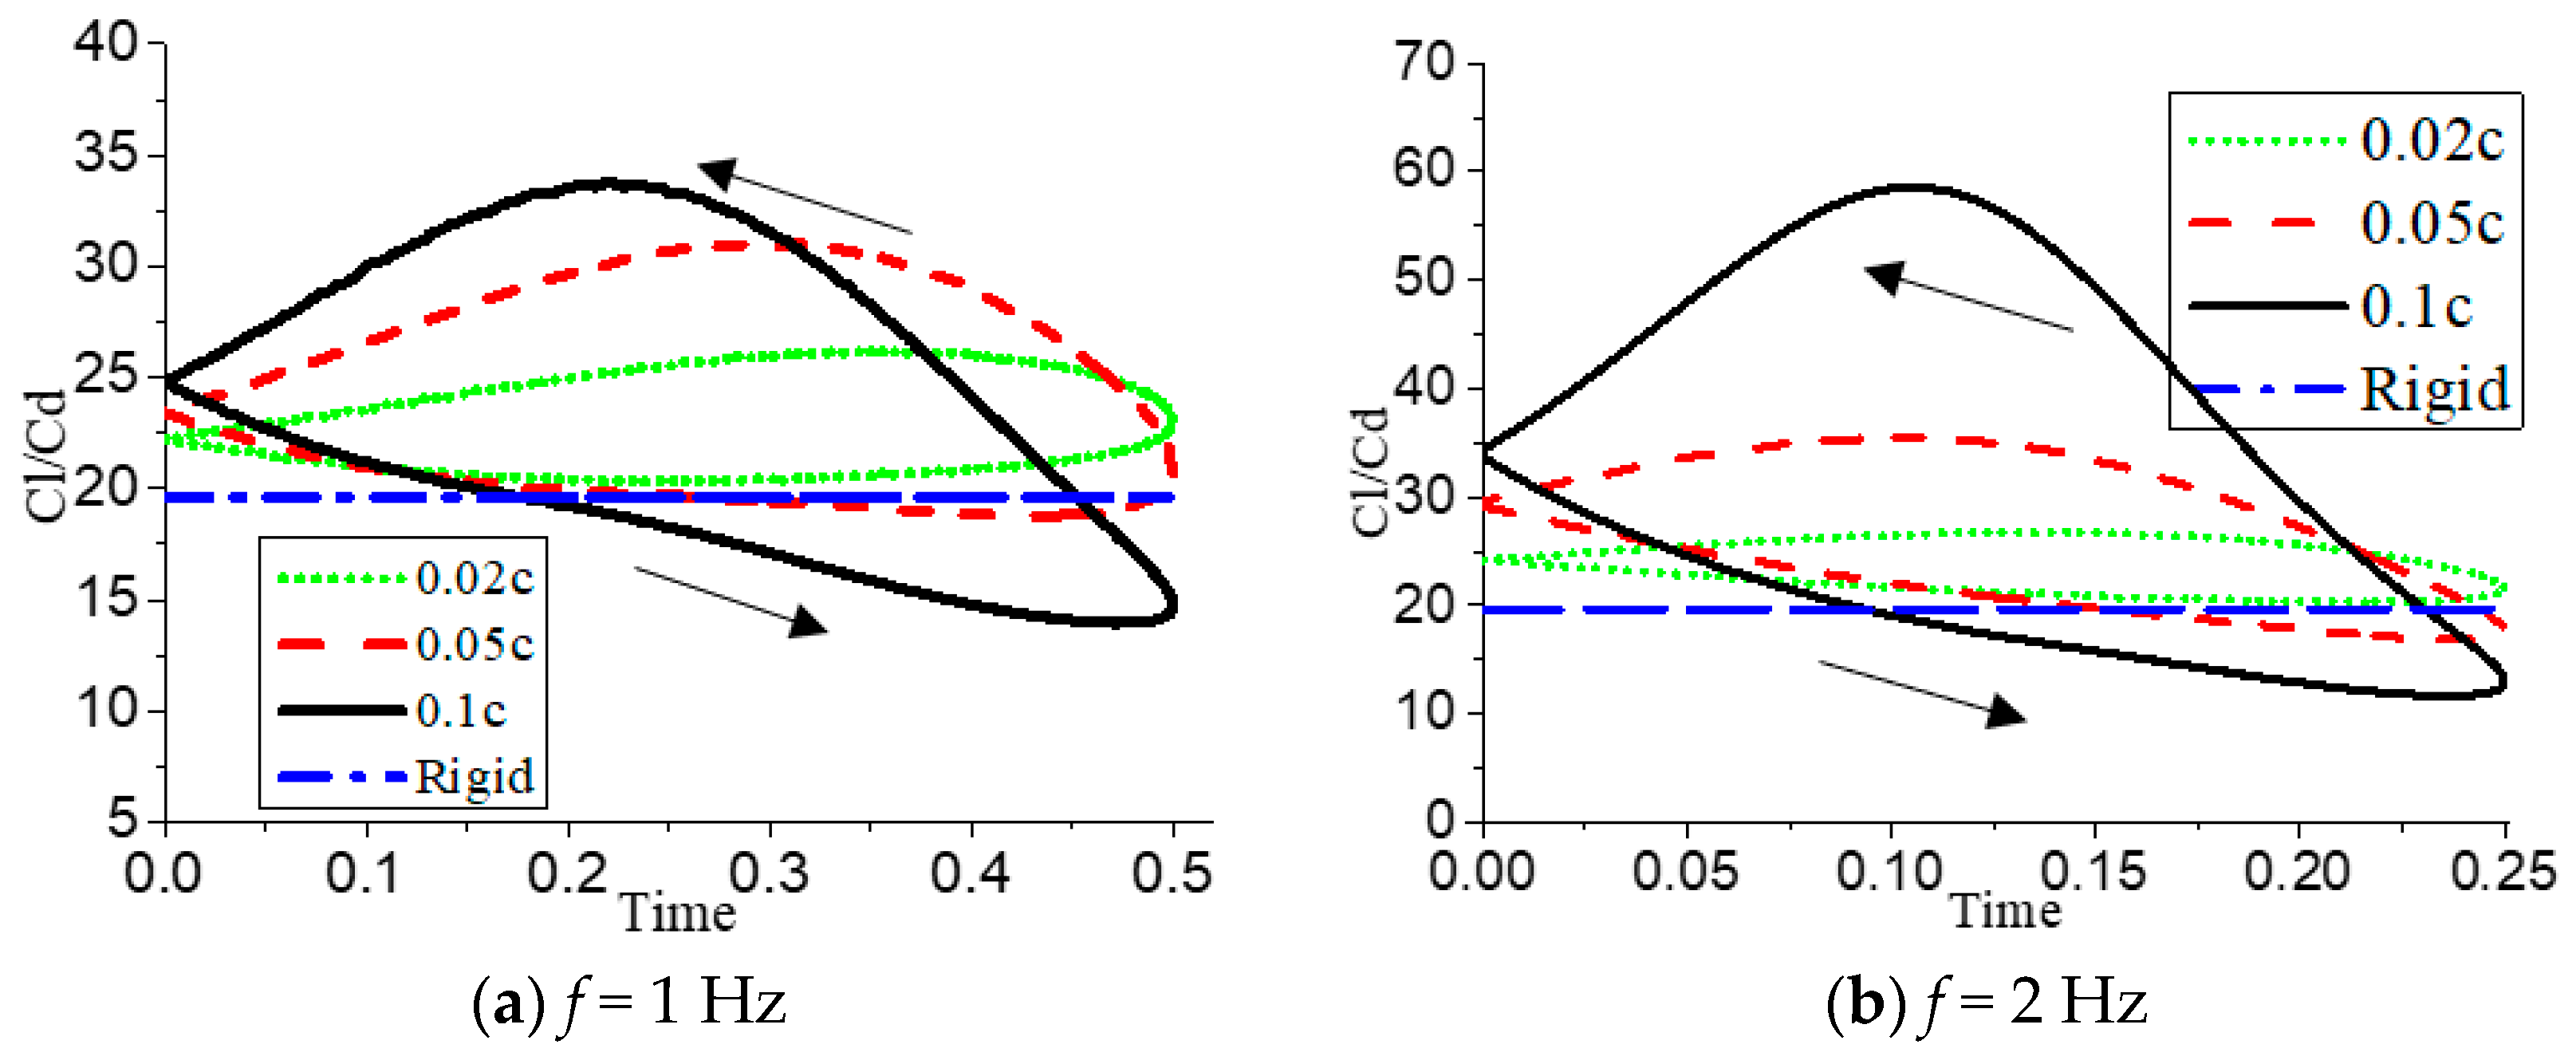
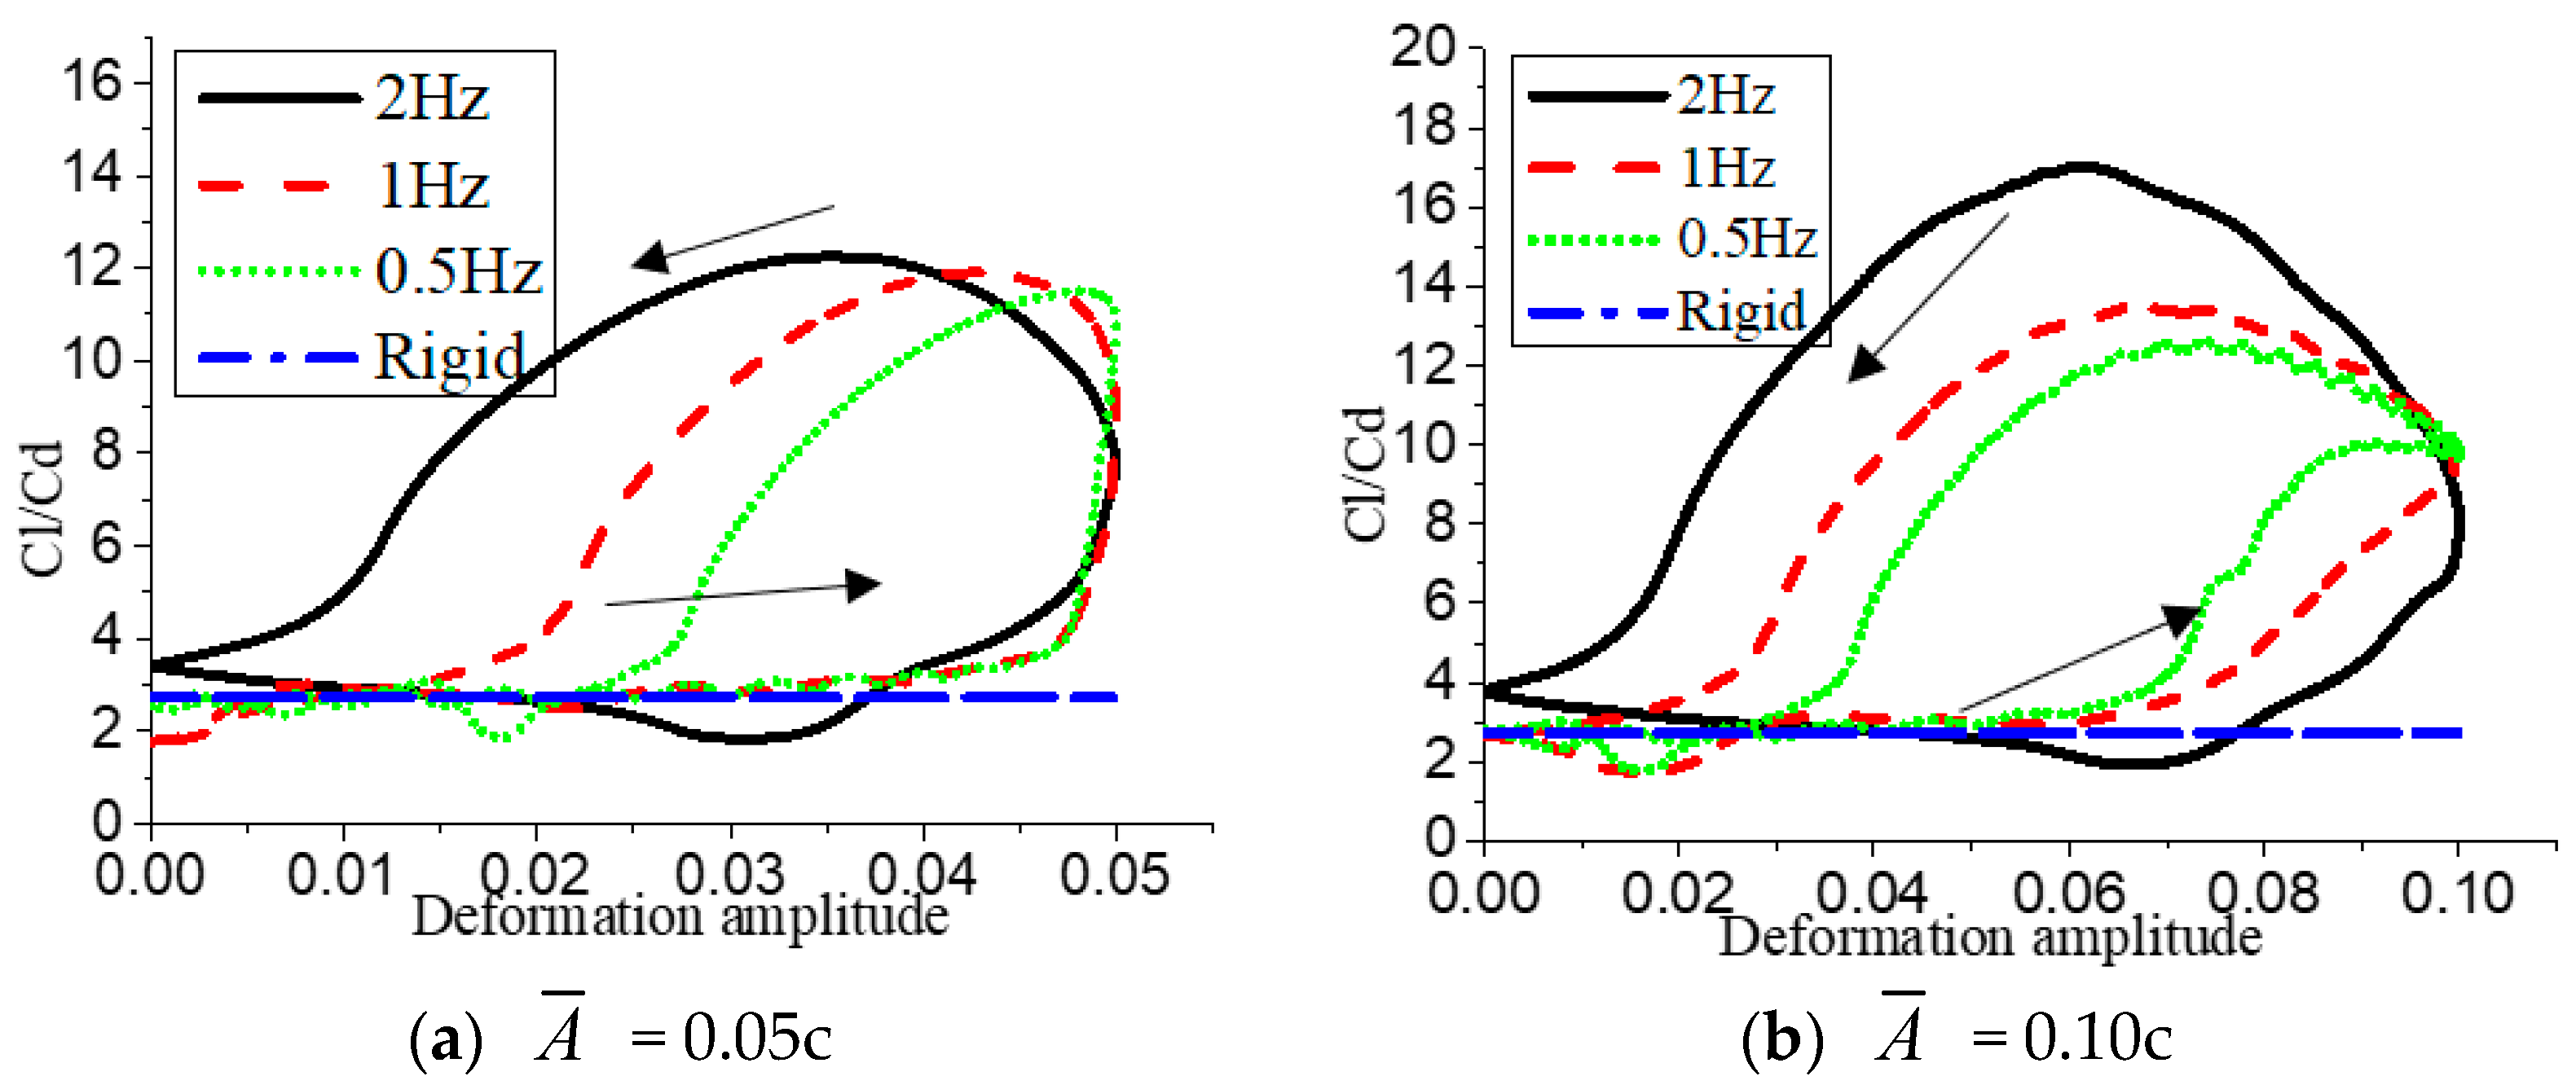
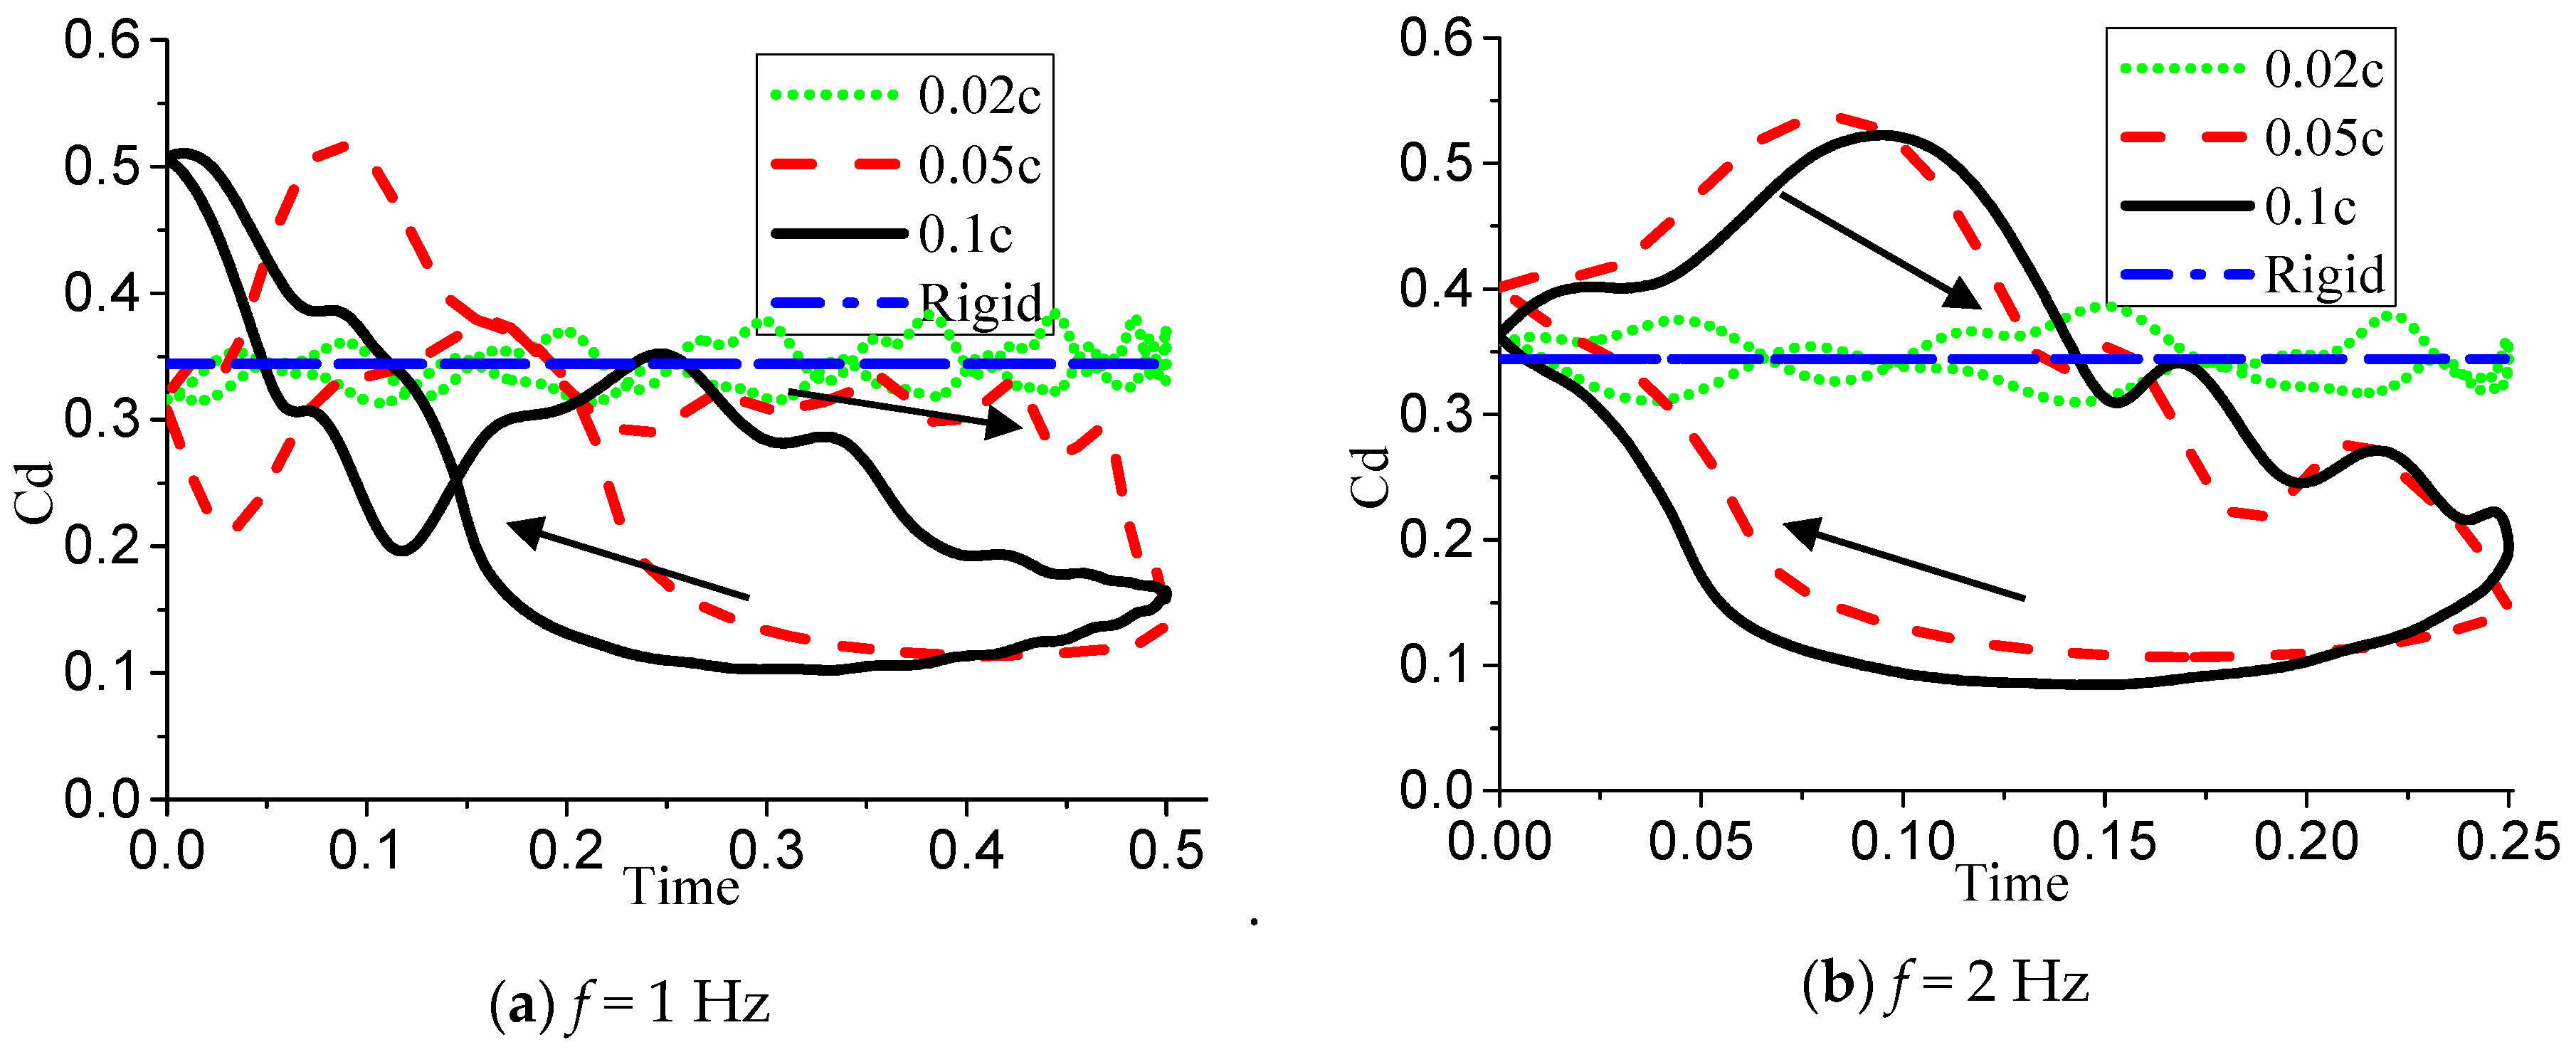
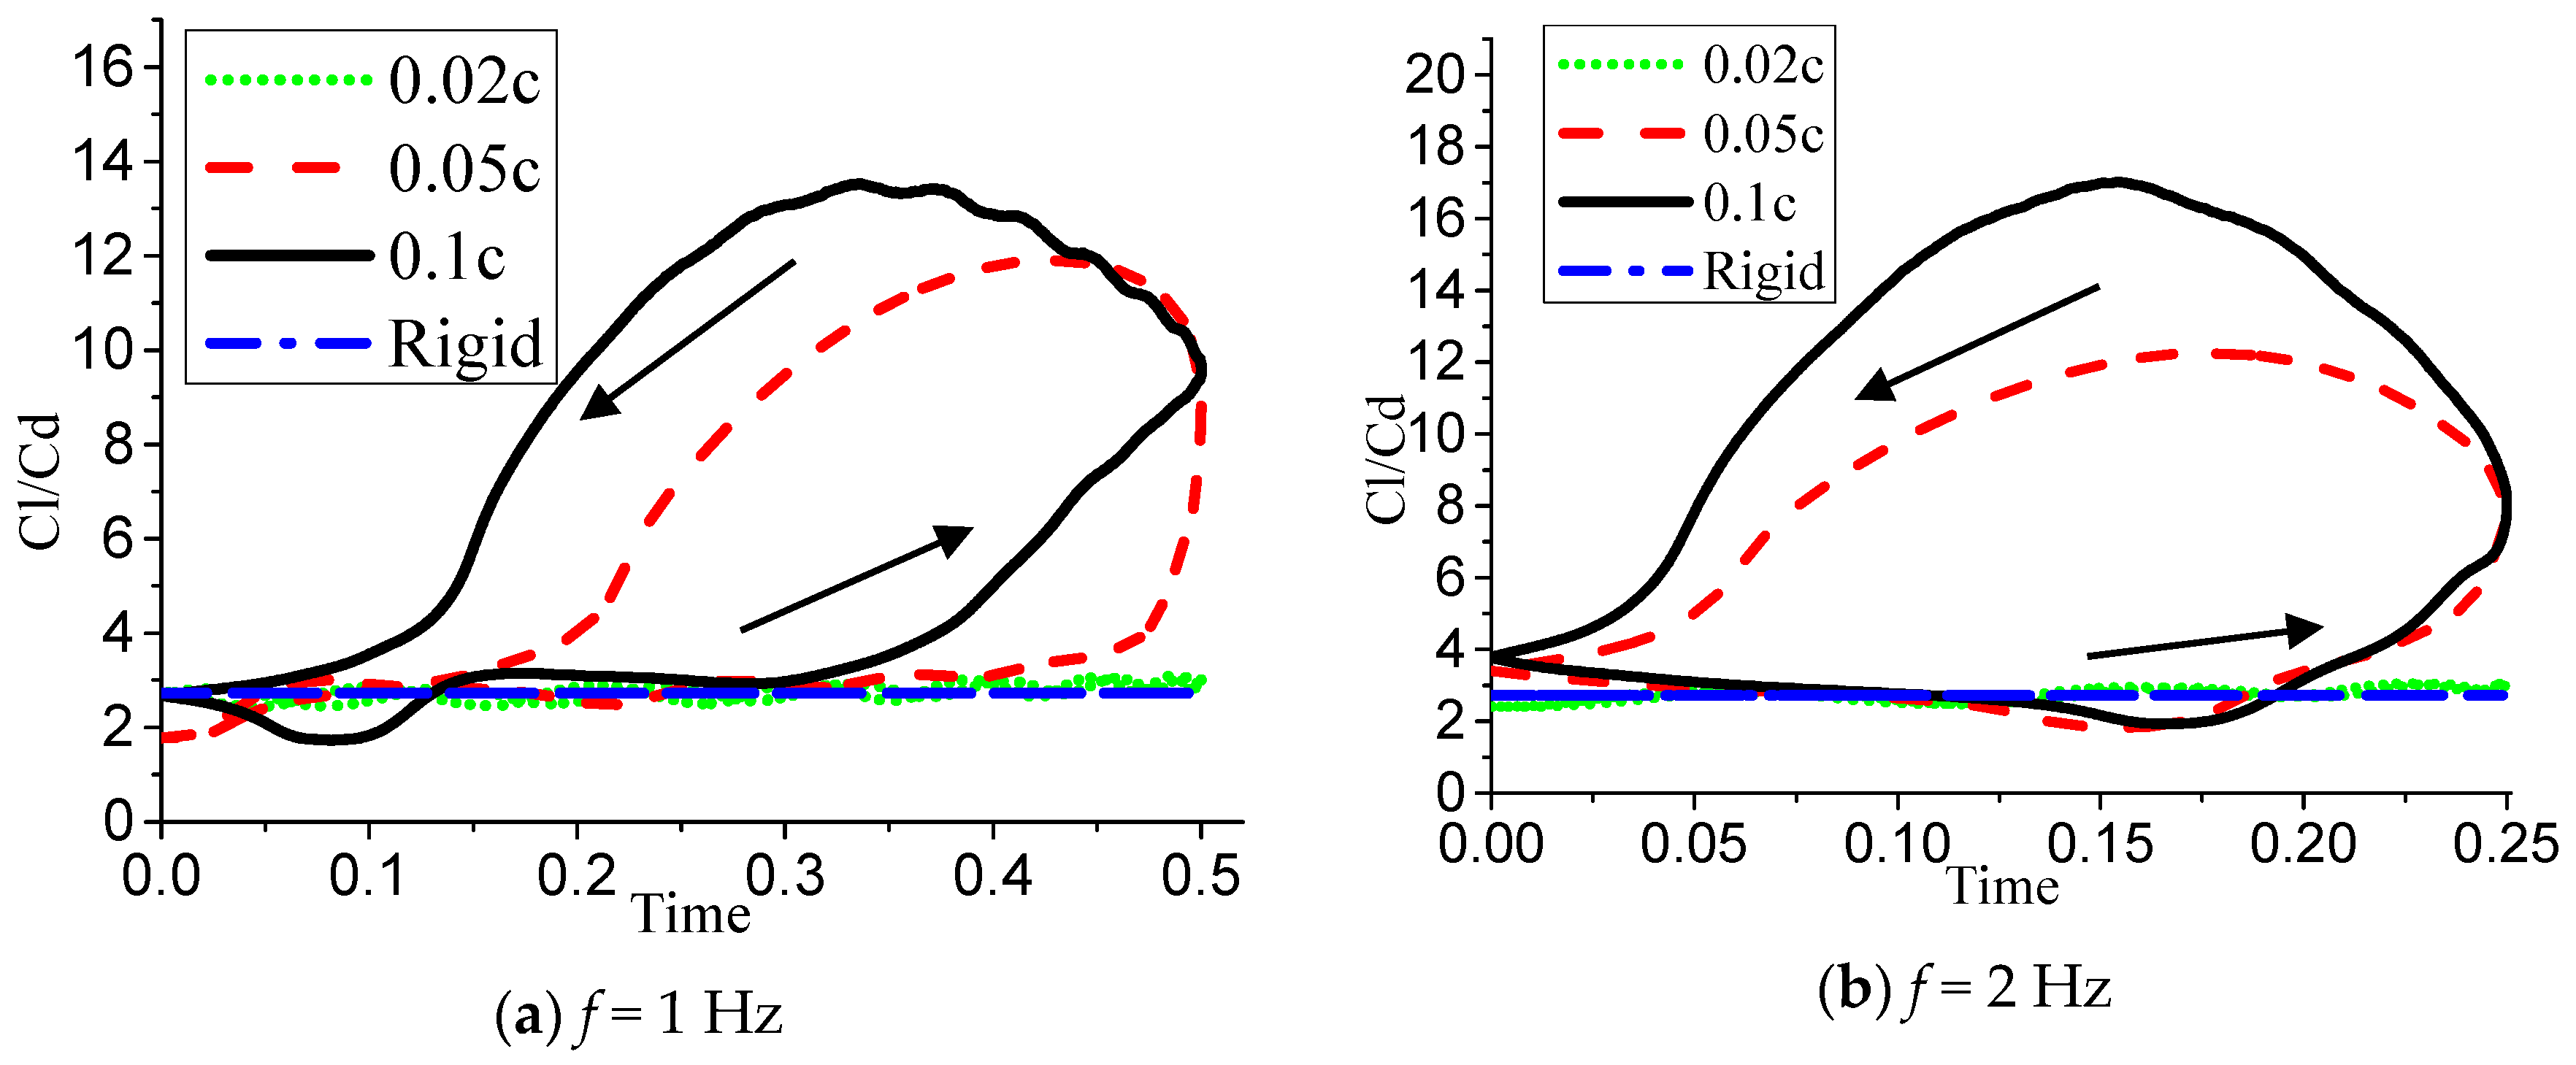
The studying object in this paper is the airfoil NACA0012 with a chord length of 0.4 m. In a deformed period, the aerodynamic performance of the deformed blade is studied when it is deformed with the same thickness at different attack angles, different frequencies and different vibration amplitudes. In this paper, the angle of attack α is 10° (before stall angle of attack), 14° (shallow stall angle of attack) and 18° (deep stall angle of attack), the deformation frequency f is 2 Hz, 1 Hz, and 0.5 Hz, and the deformation amplitude is 0.020c, 0.05c, and 0.10c, respectively. The direction indicated by the arrow in the data diagram describes the change process of a period-center piston aerodynamic data when the airfoil starts to deform to the maximum deformation amplitude (deformation ascending) and when the airfoil returns to the initial shape (deformation descending) from the maximum deformation amplitude.
4.1. Active Deformed Airfoil at Attack Angle α = 10°
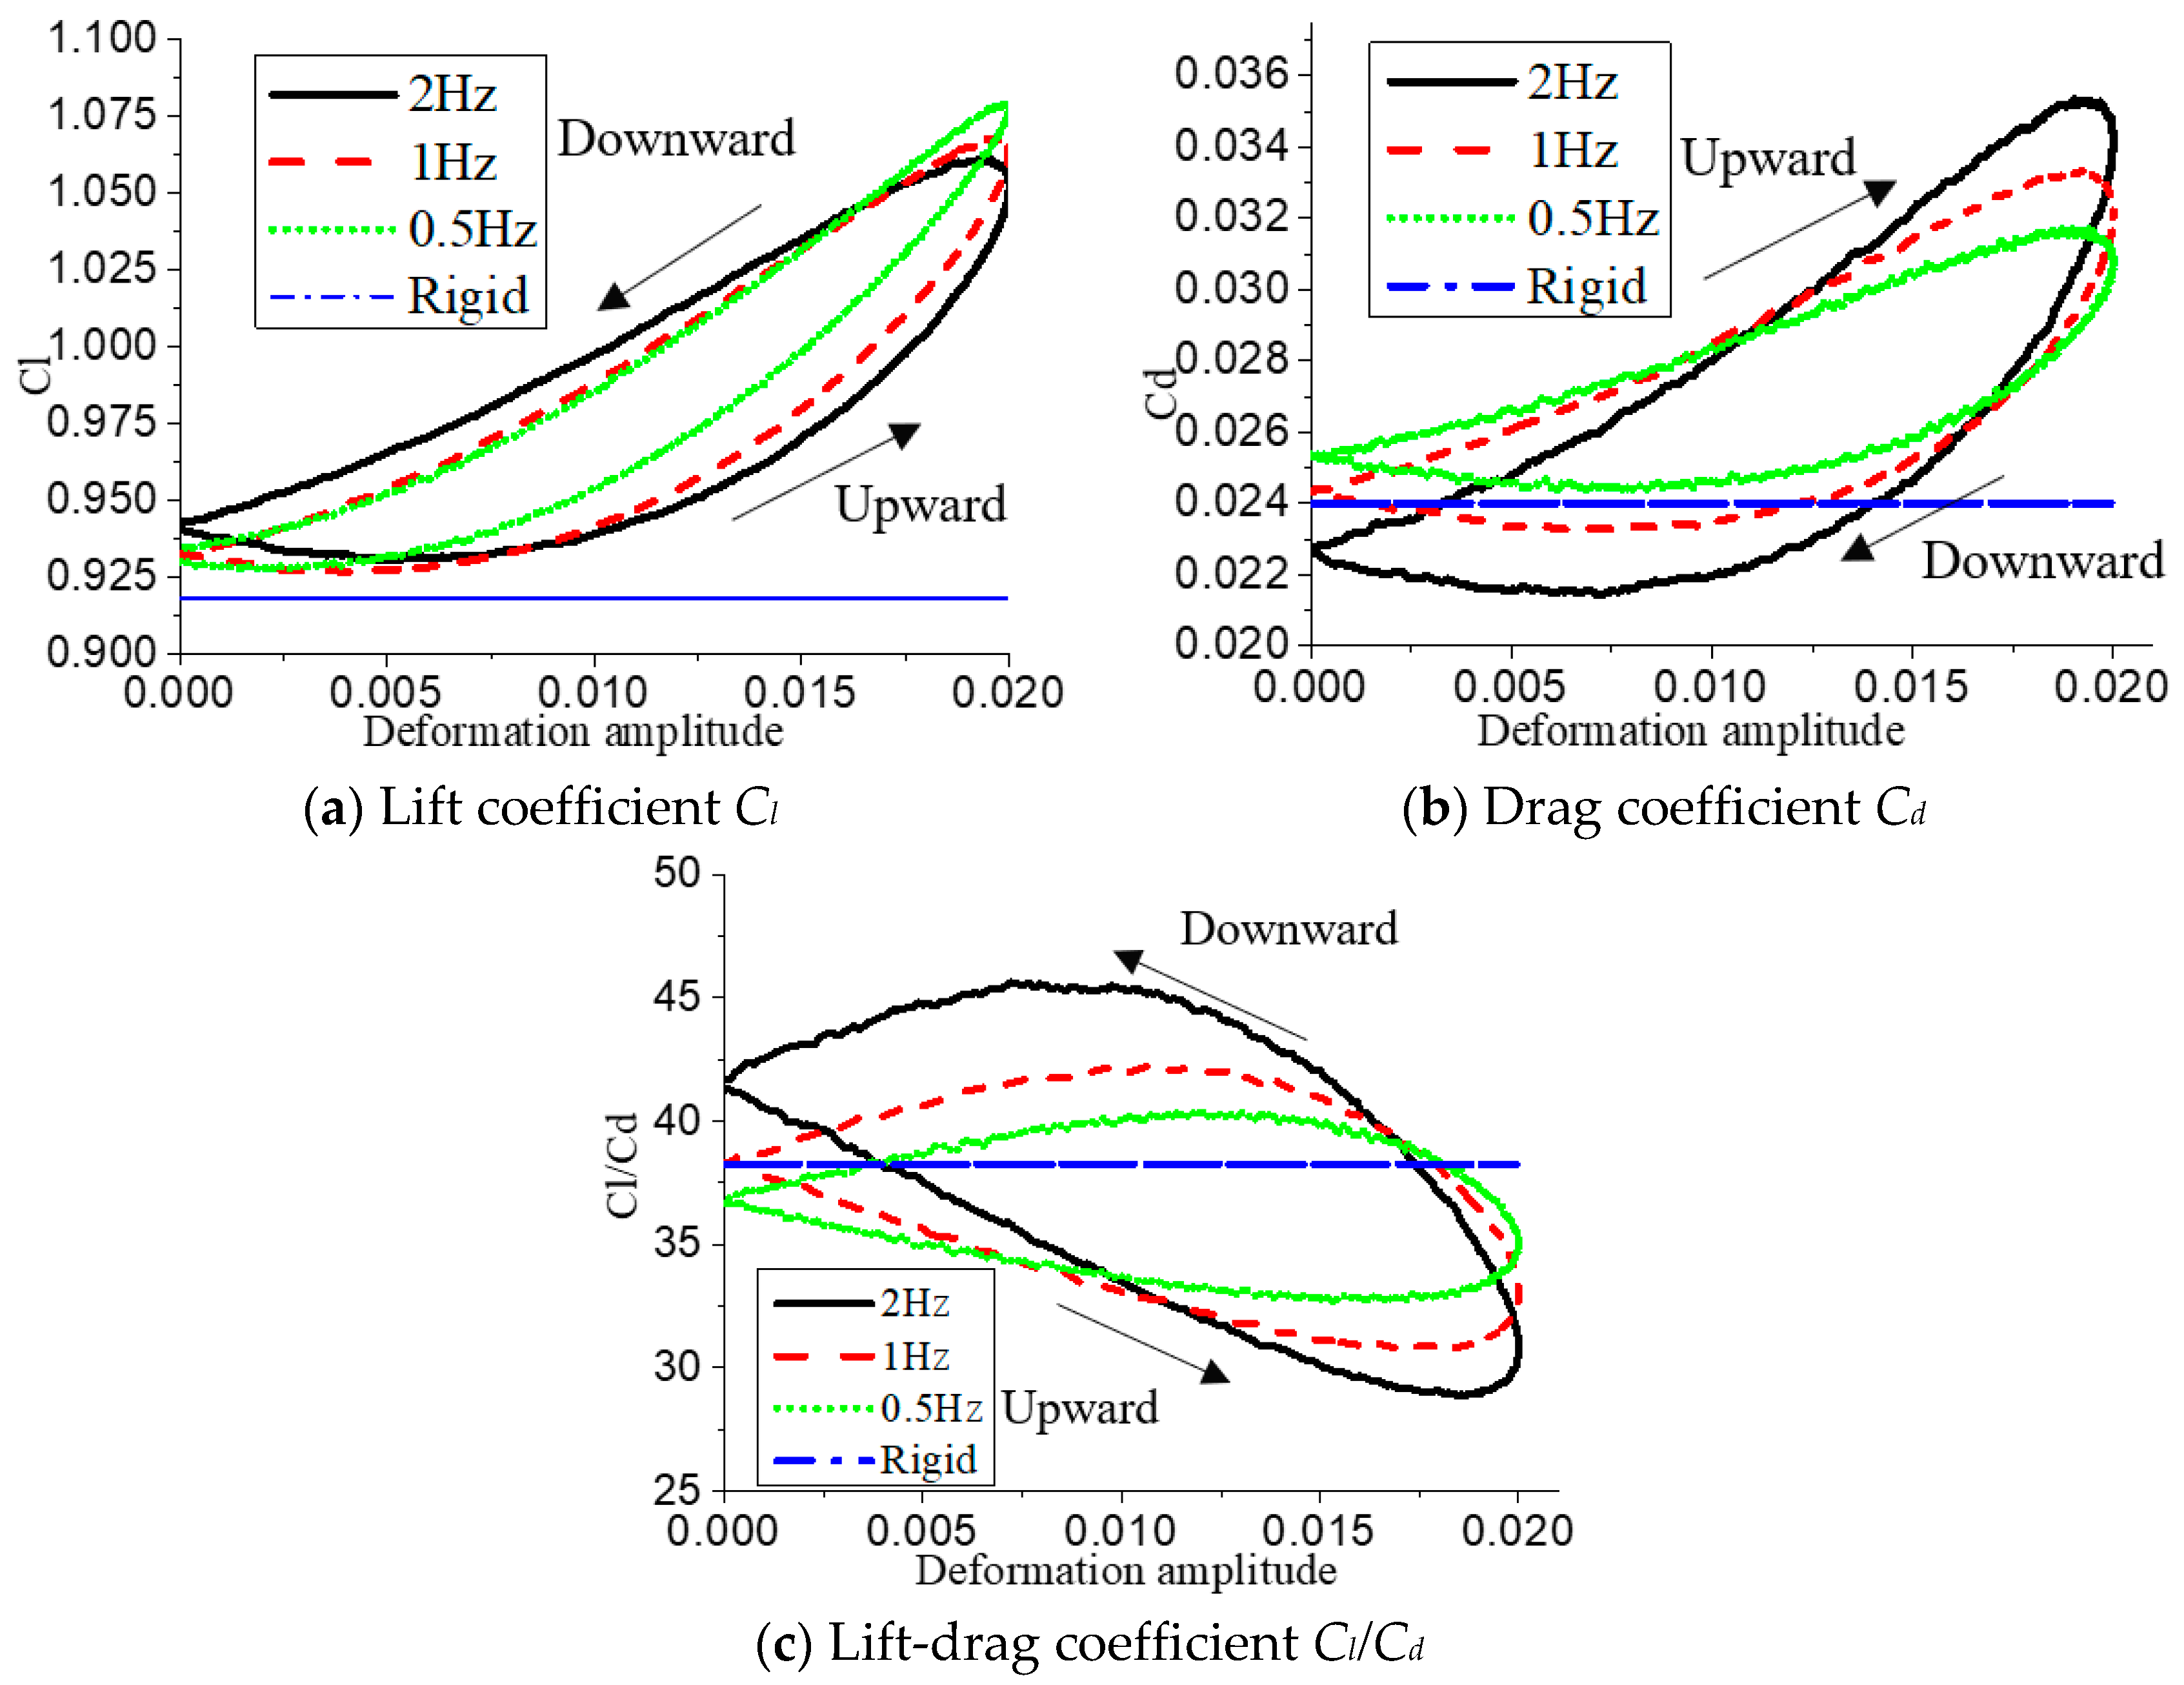
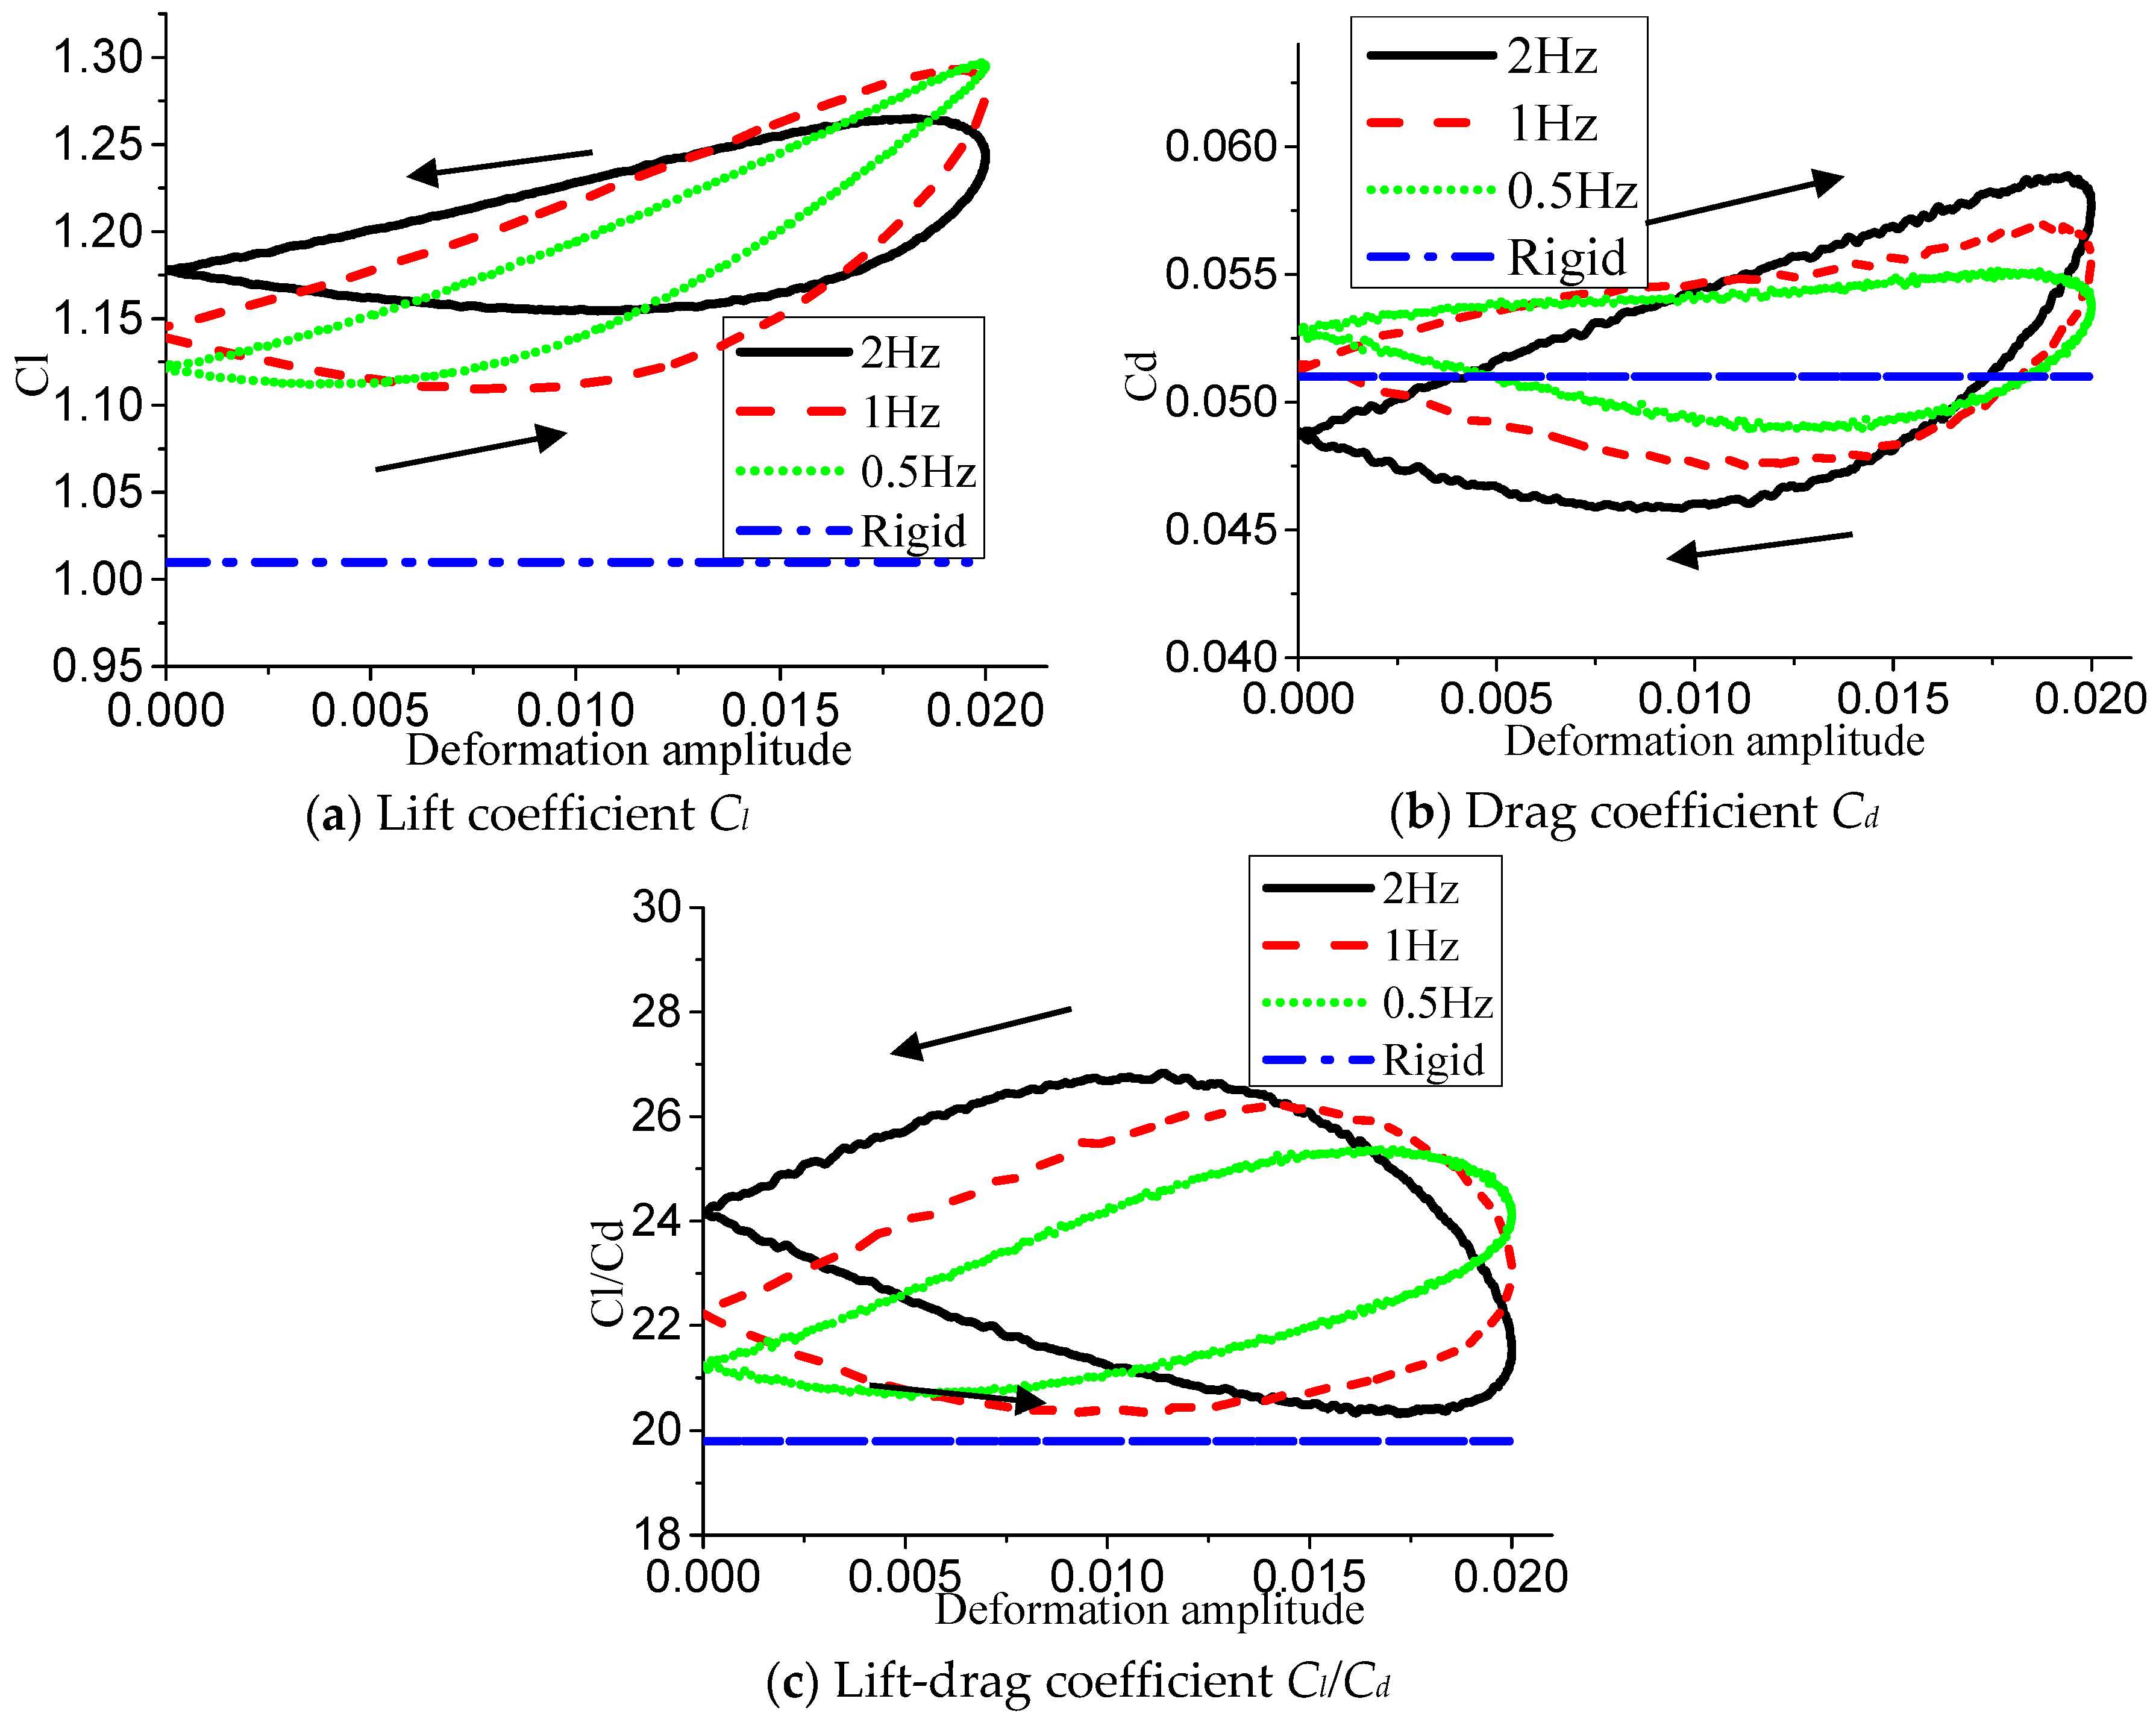
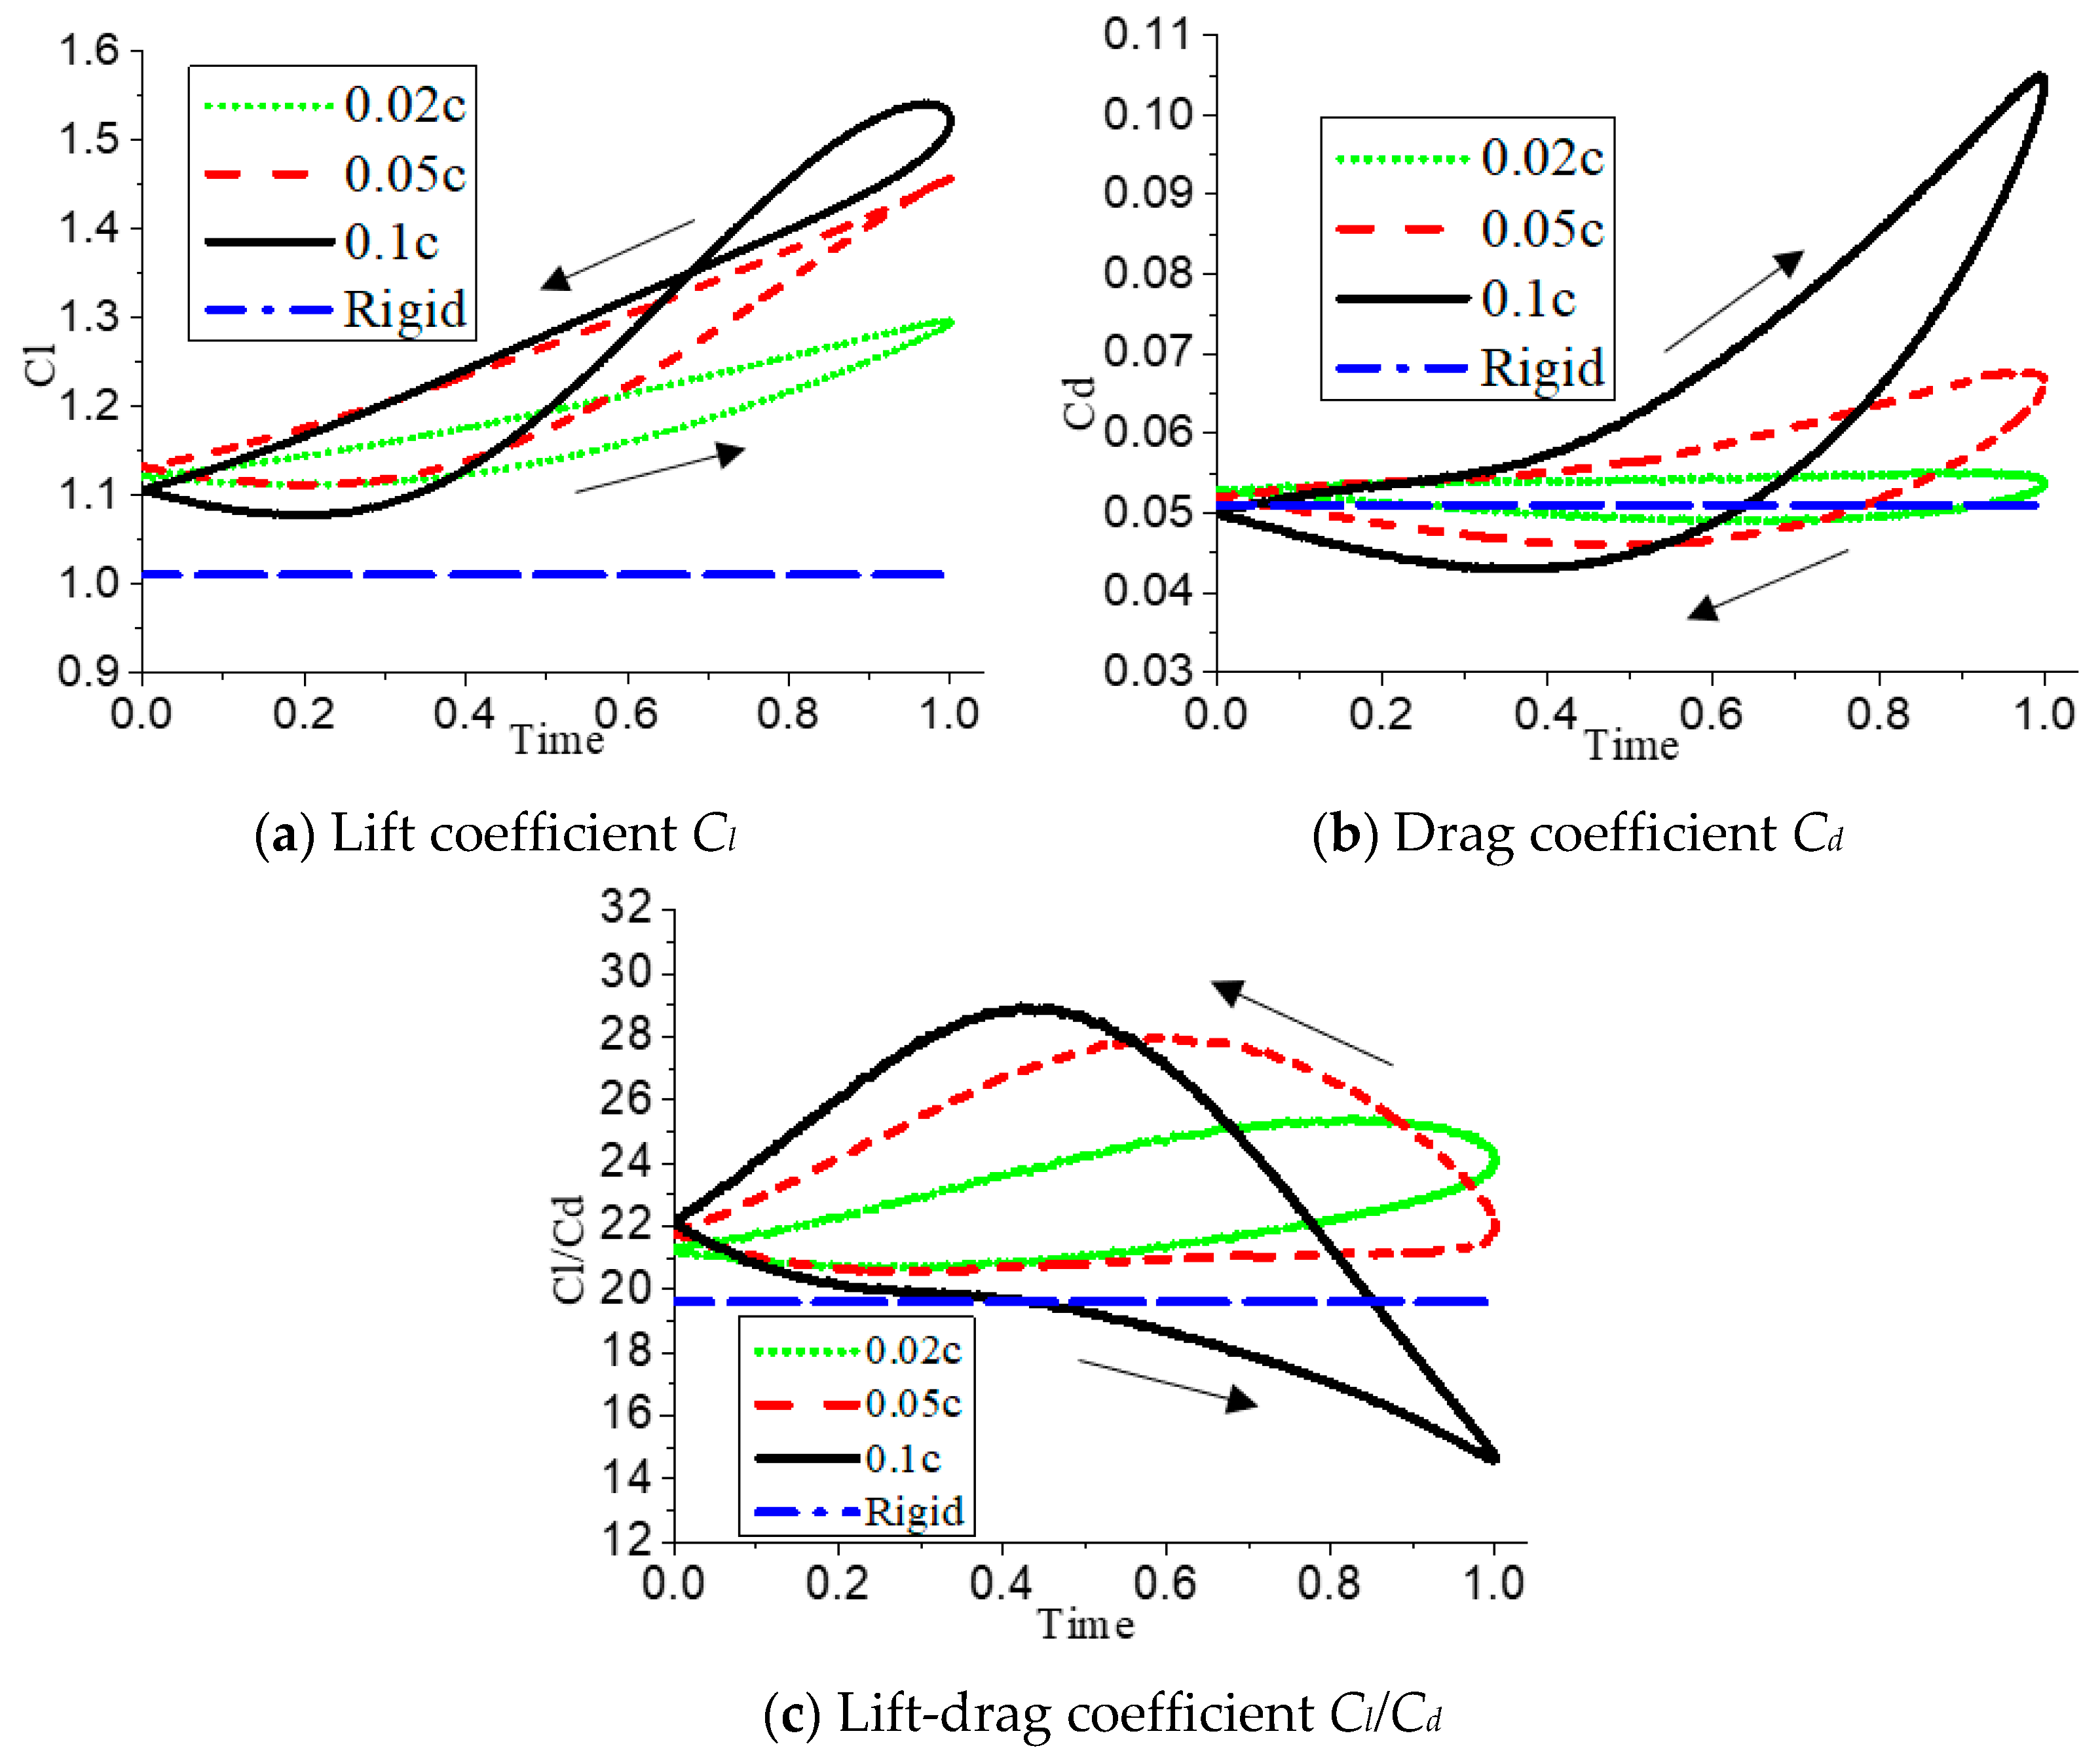
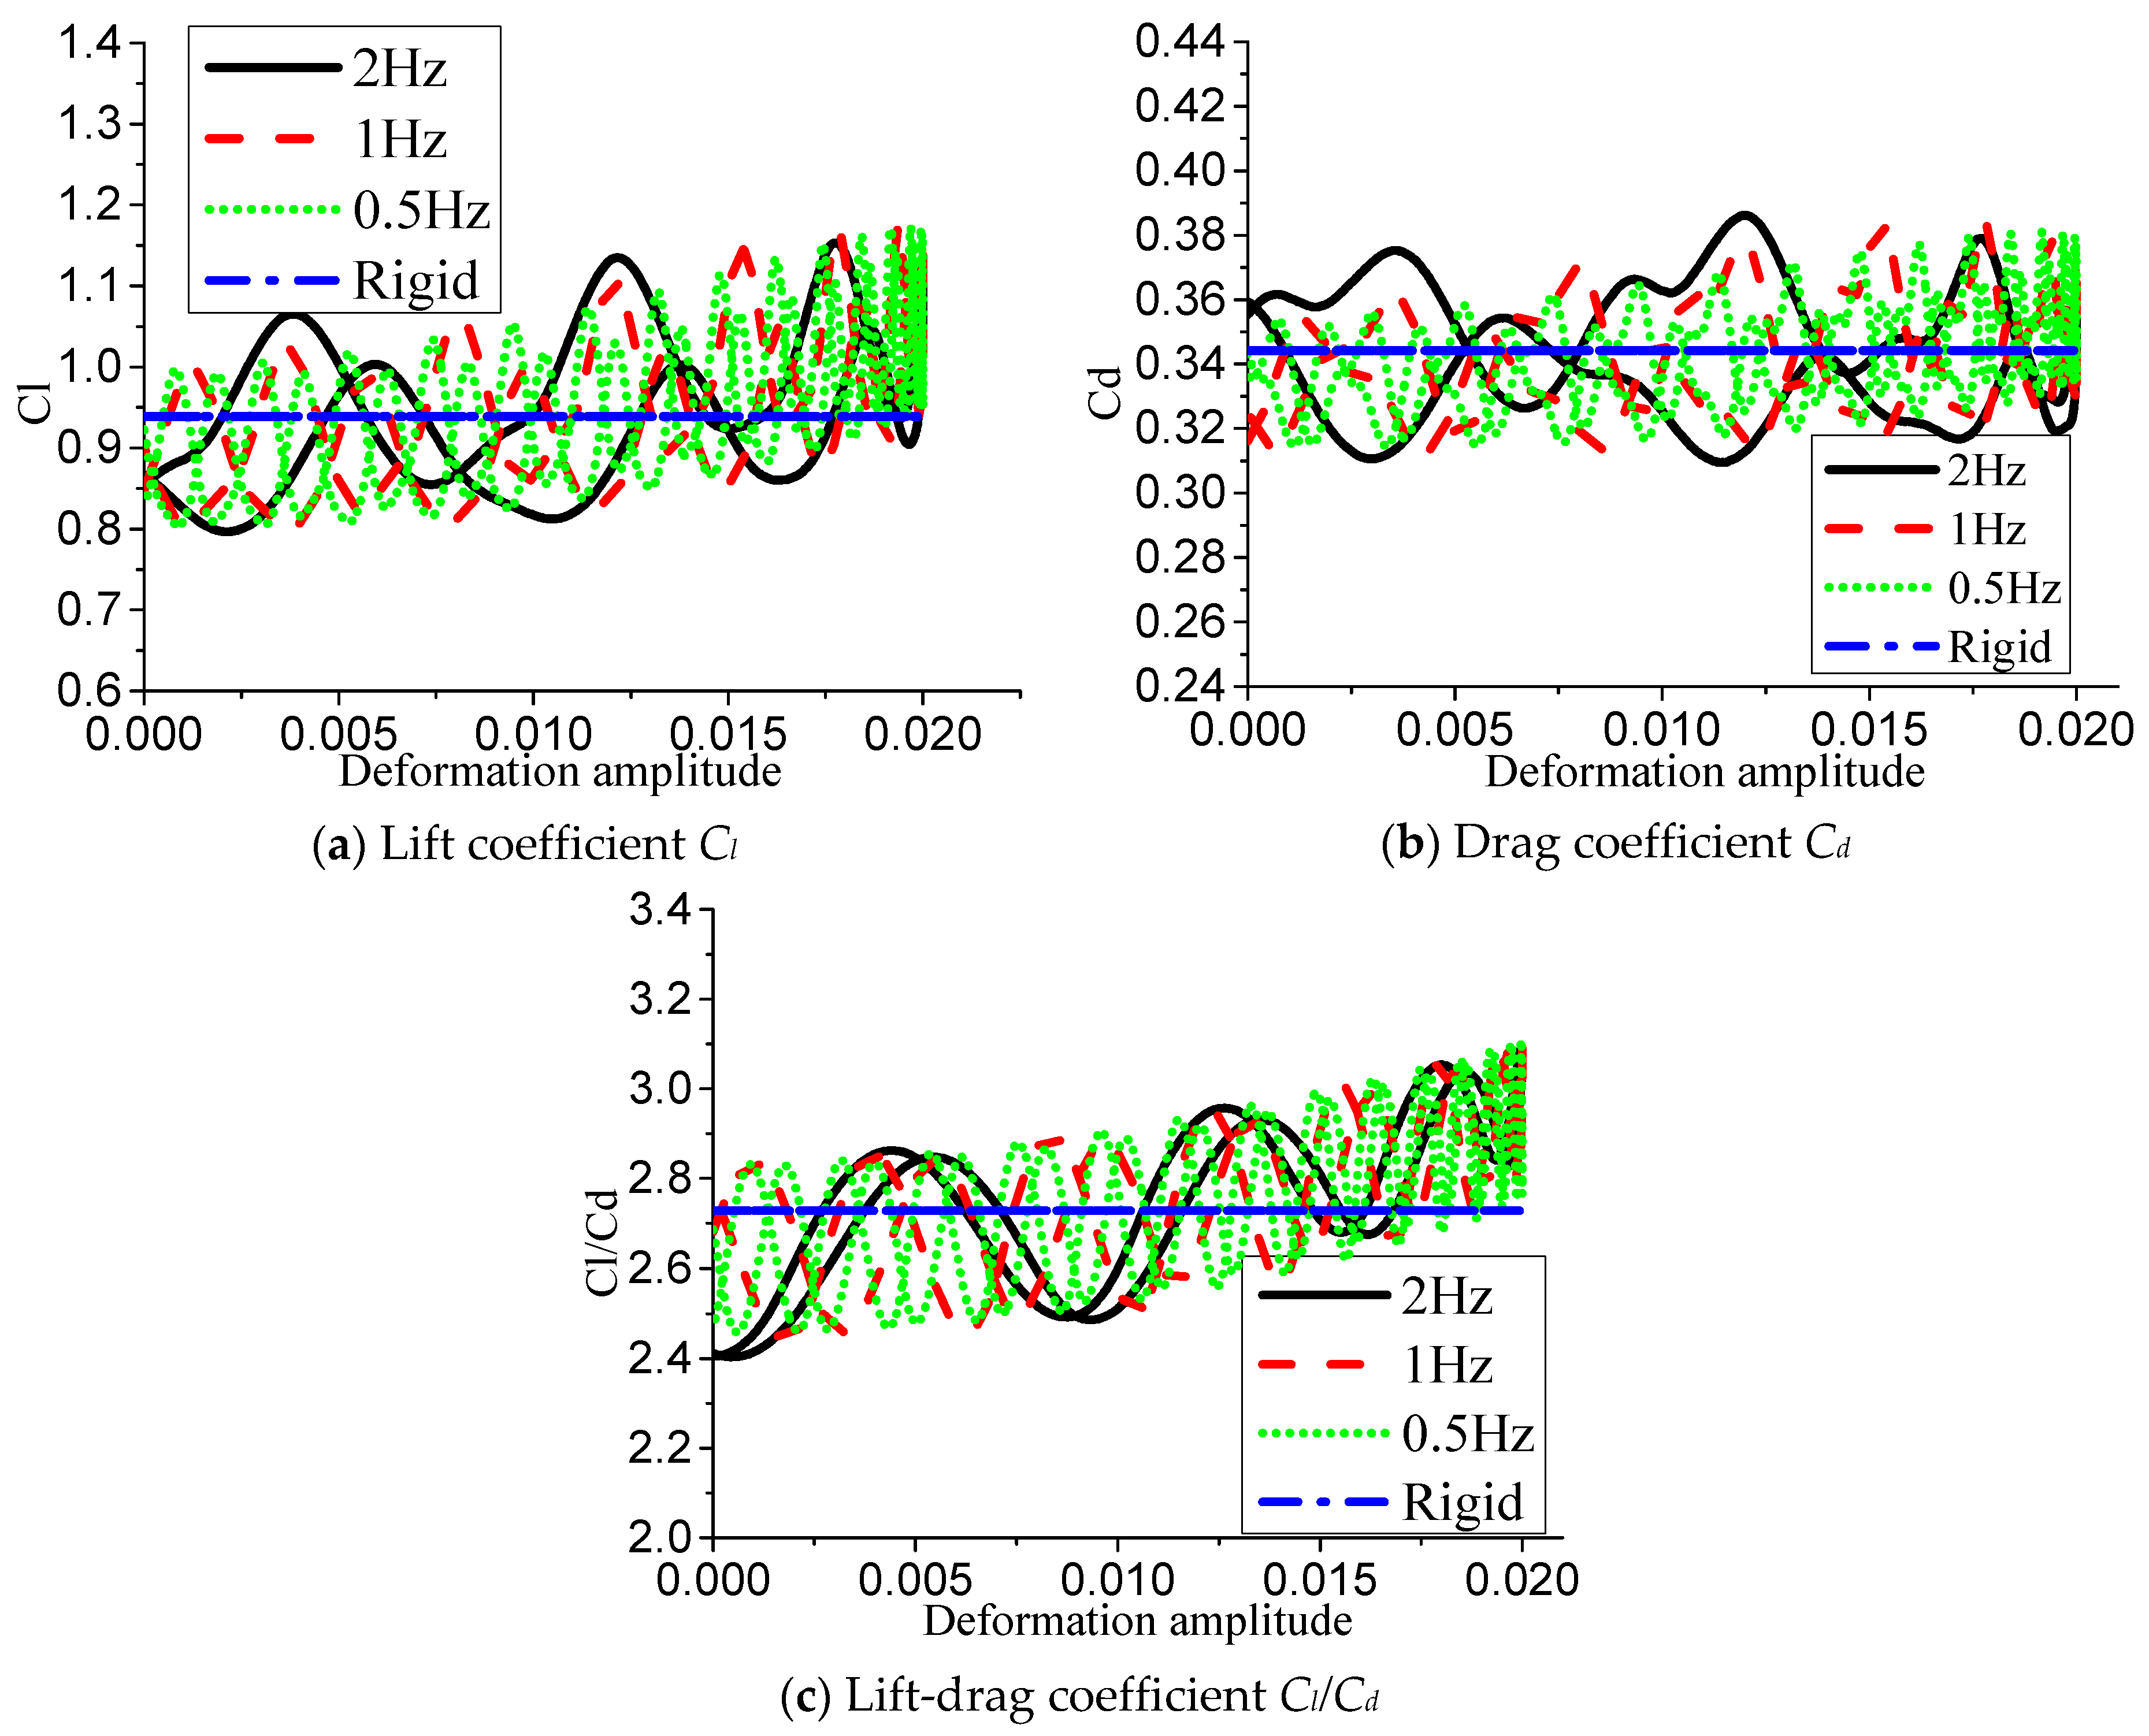
The influence law of the same deformation amplitude and different deformation frequencies on the aerodynamic performance of the actively deformed airfoil was analyzed when the angle of attack was 10°, that is, before stall. Figure 6 shows the lift-drag coefficient and lift-drag ratio of the airfoil at different deformation frequencies when the deformation amplitude was 0.020c, and also gives the simulation results of the flow around the original NACA0012 rigid airfoil as a comparison. As can be seen from Figure 6a, due to the generation of deformed movement, the lift coefficient of the deformed airfoil at three frequencies was greater than that of the rigid airfoil in a moving period, and the lift coefficient reached the maximum value when the deformation amplitude of the airfoil increased to 0.020c. However, the increase of deformation frequency has no significant effect on the maximum and minimum lift coefficient. With the increase of deformation frequency, the minimum value of the lift coefficient of the deformed airfoil is always higher than that of the original airfoil, and the more obvious the hysteresis of the lift coefficient, the larger the area enclosed by the hysteresis loop. As can be seen from the relationship between the drag coefficients in Figure 6b, with the increase of deformation frequency, the drag coefficient at the maximum deformation amplitude was larger, and in the second half of the deformation downward, the drag coefficient was gradually lower than that of the rigid airfoil. Therefore, based on Figure 6c of the lift-to-drag ratio relation, it can be seen that the lift-to-drag ratio was lower than that of the rigid airfoil in a larger range of deformed period after the airfoil changes camber, and the lift-to-drag ratio can be recovered and lifted when the airfoil deforms downward.
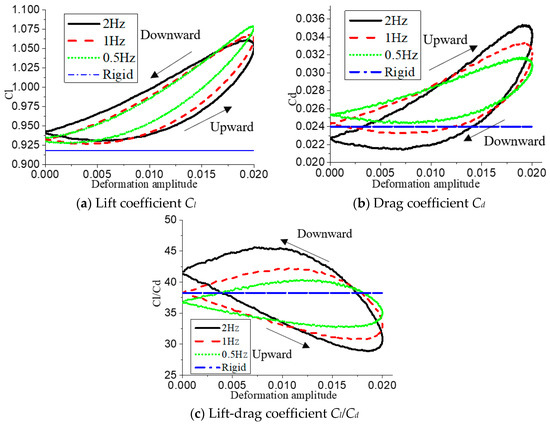
Figure 6.
When = 0.020c, variation of unsteady aerodynamic parameters with f.
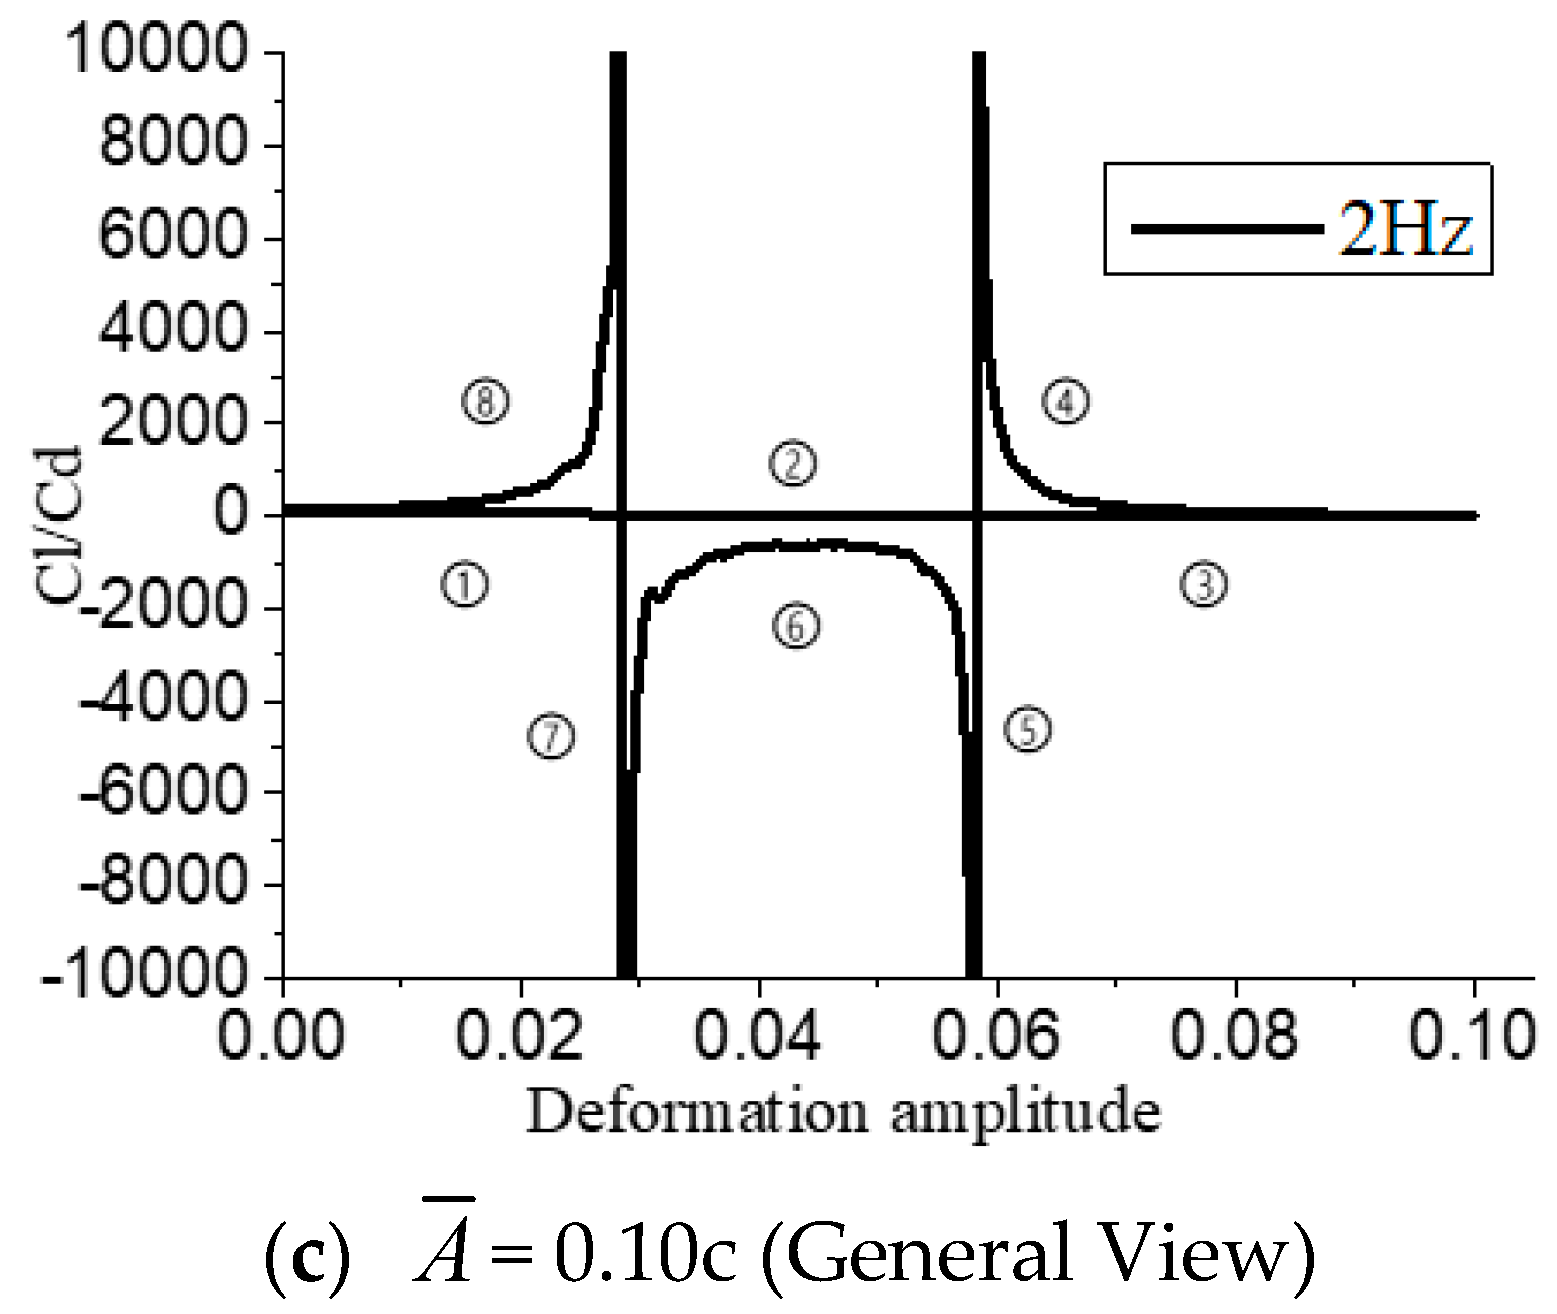
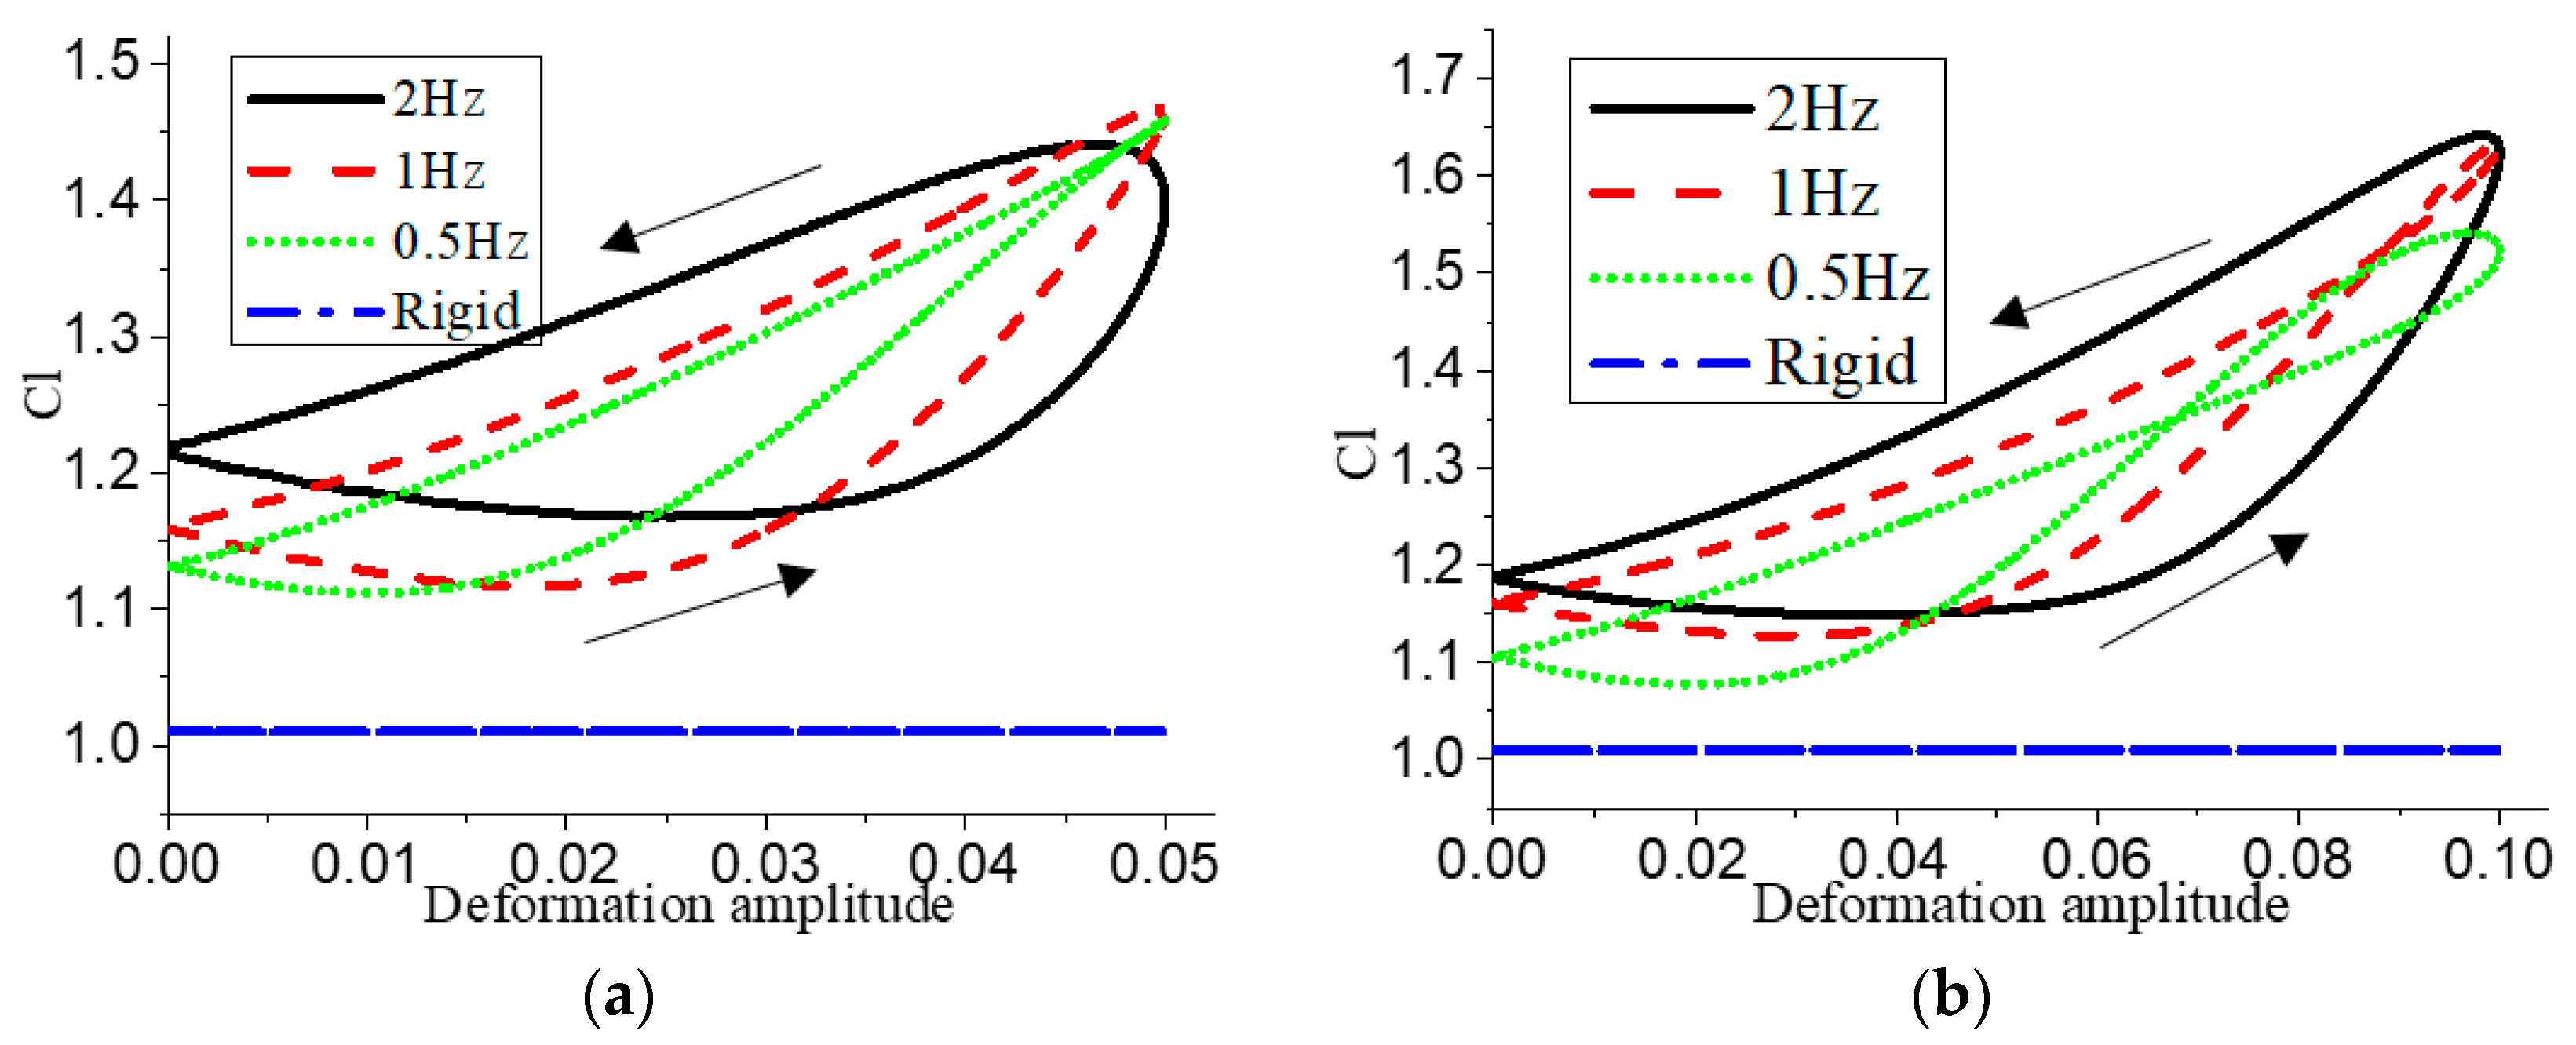
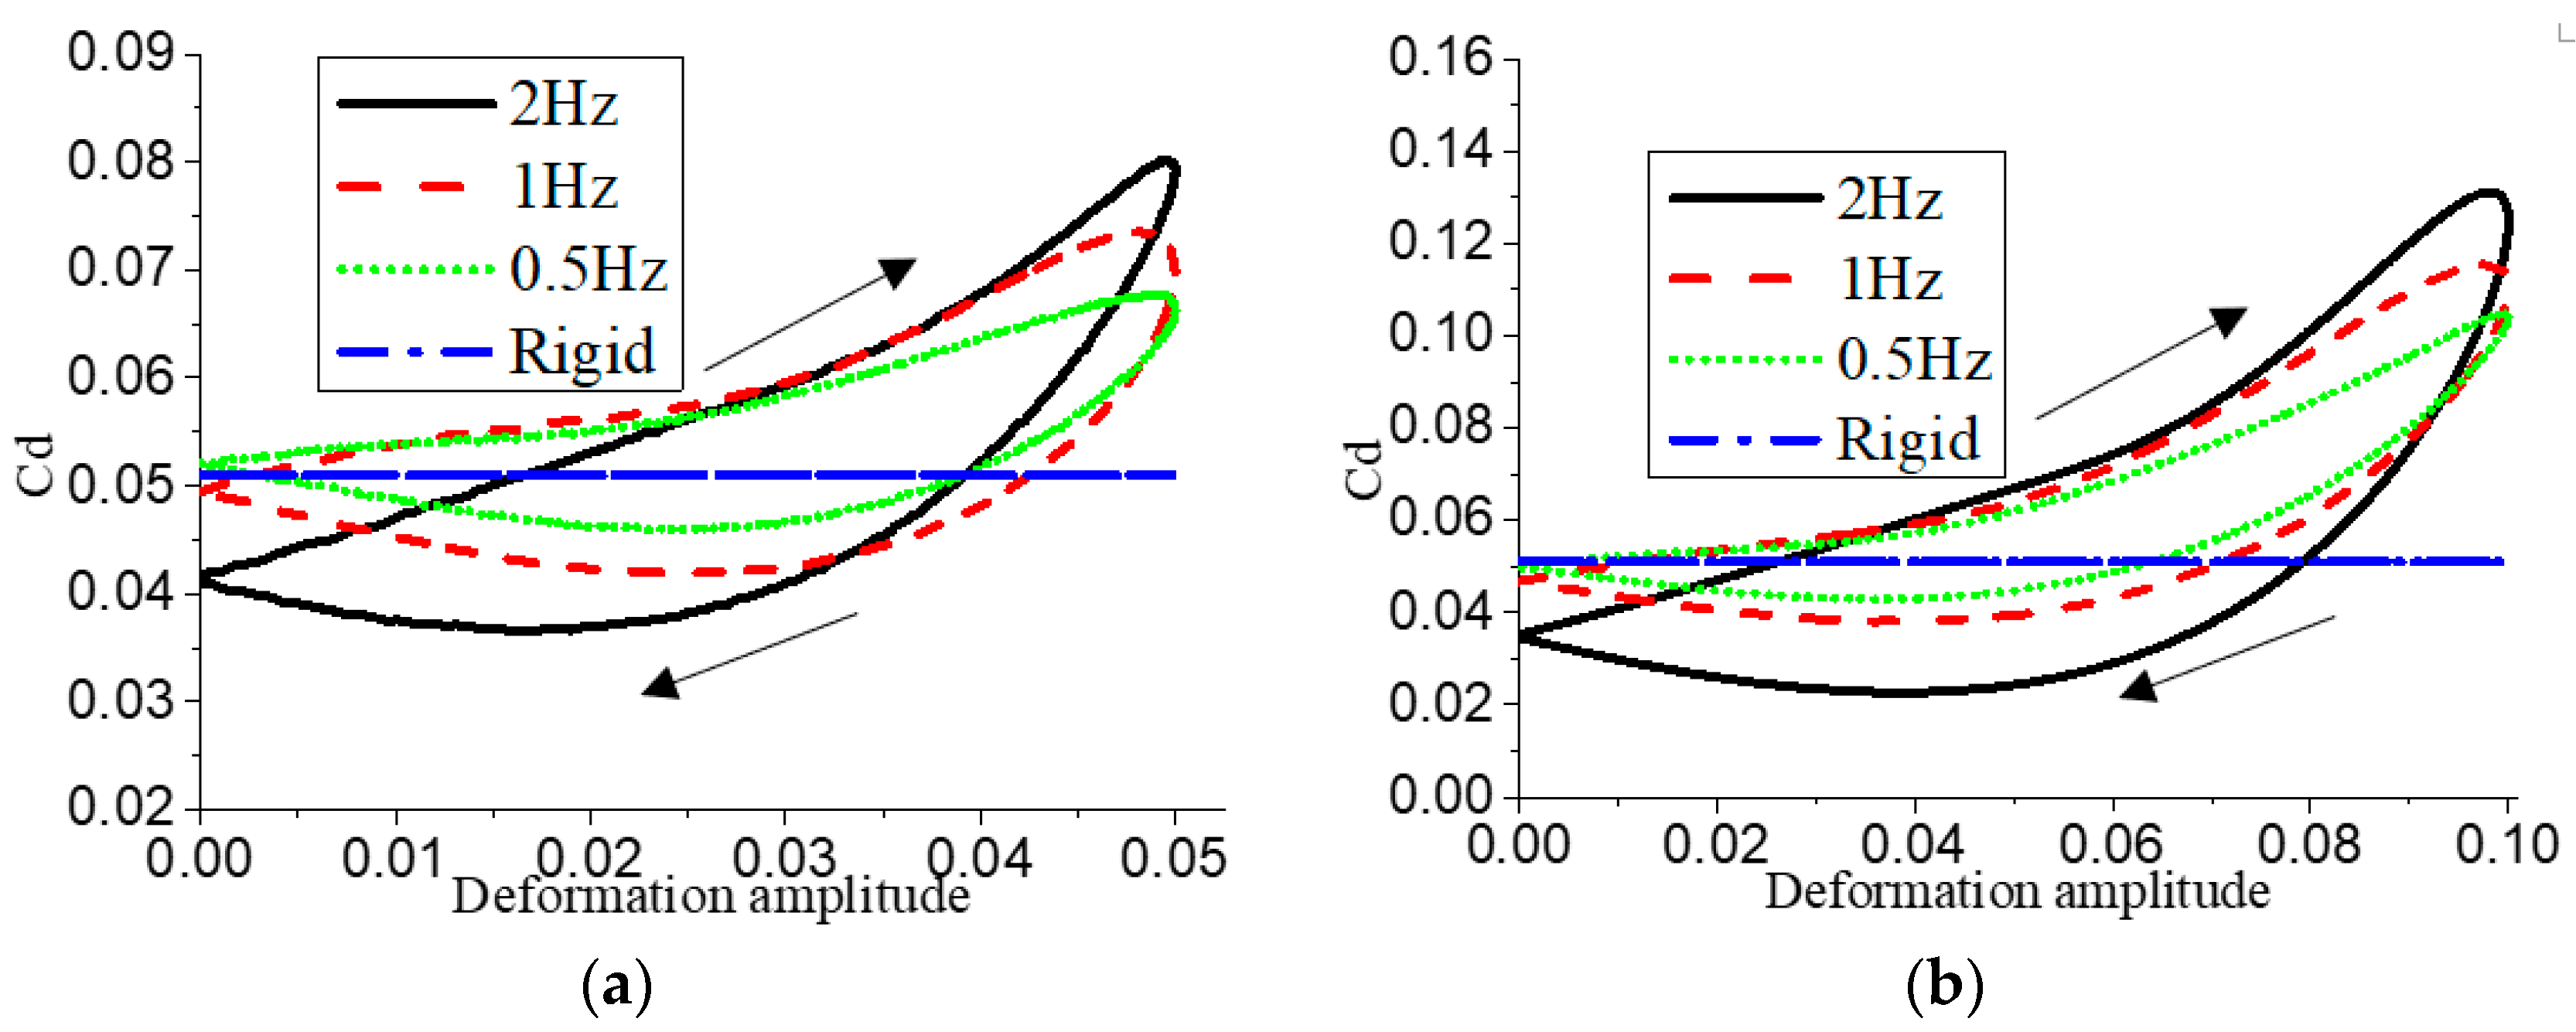
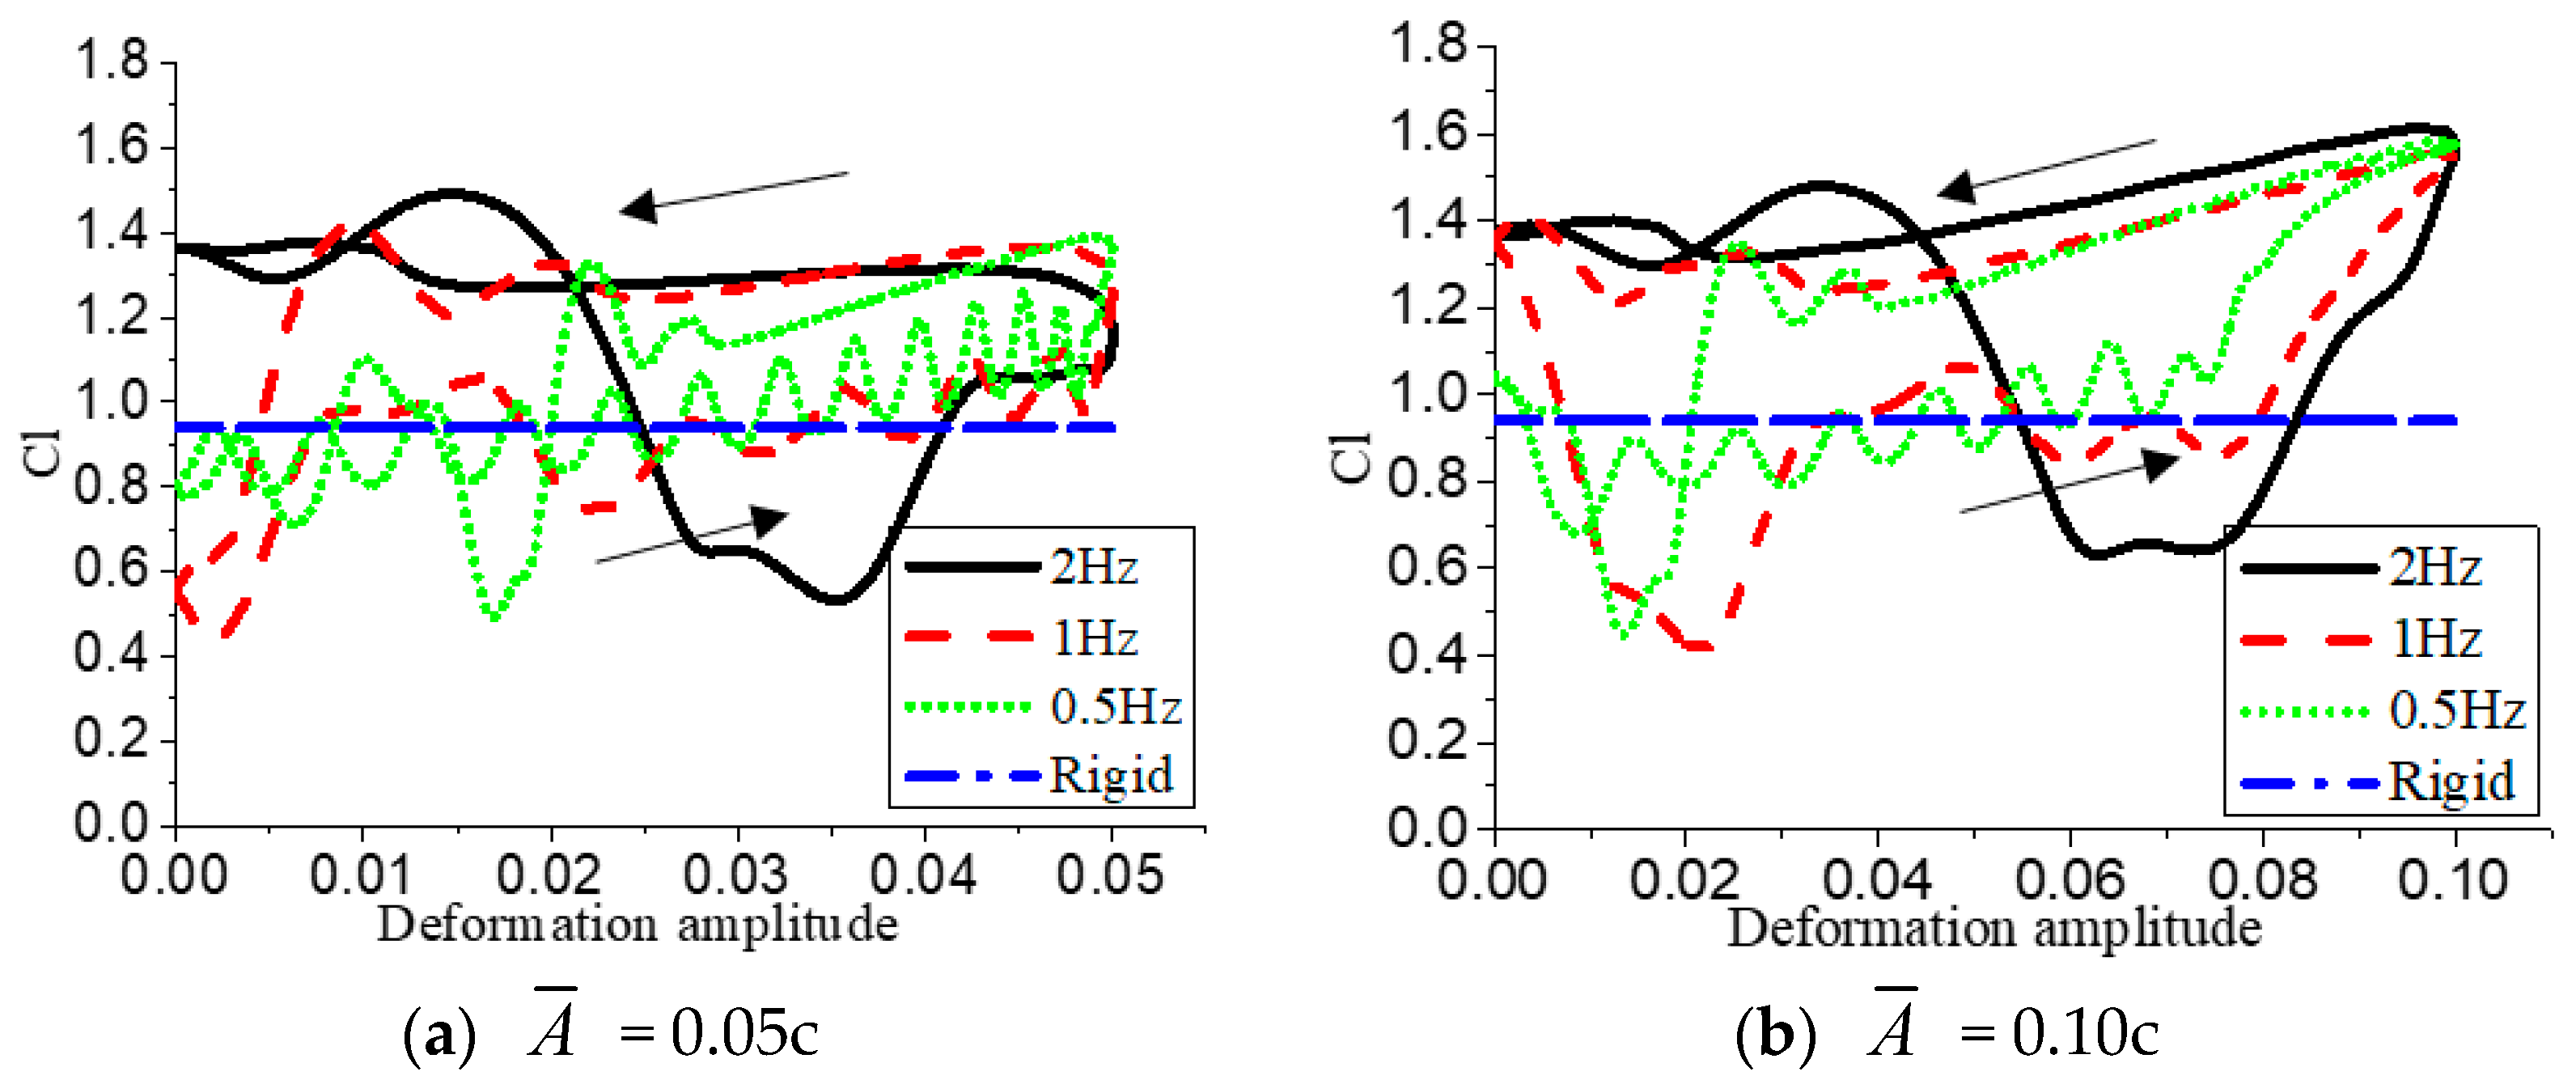
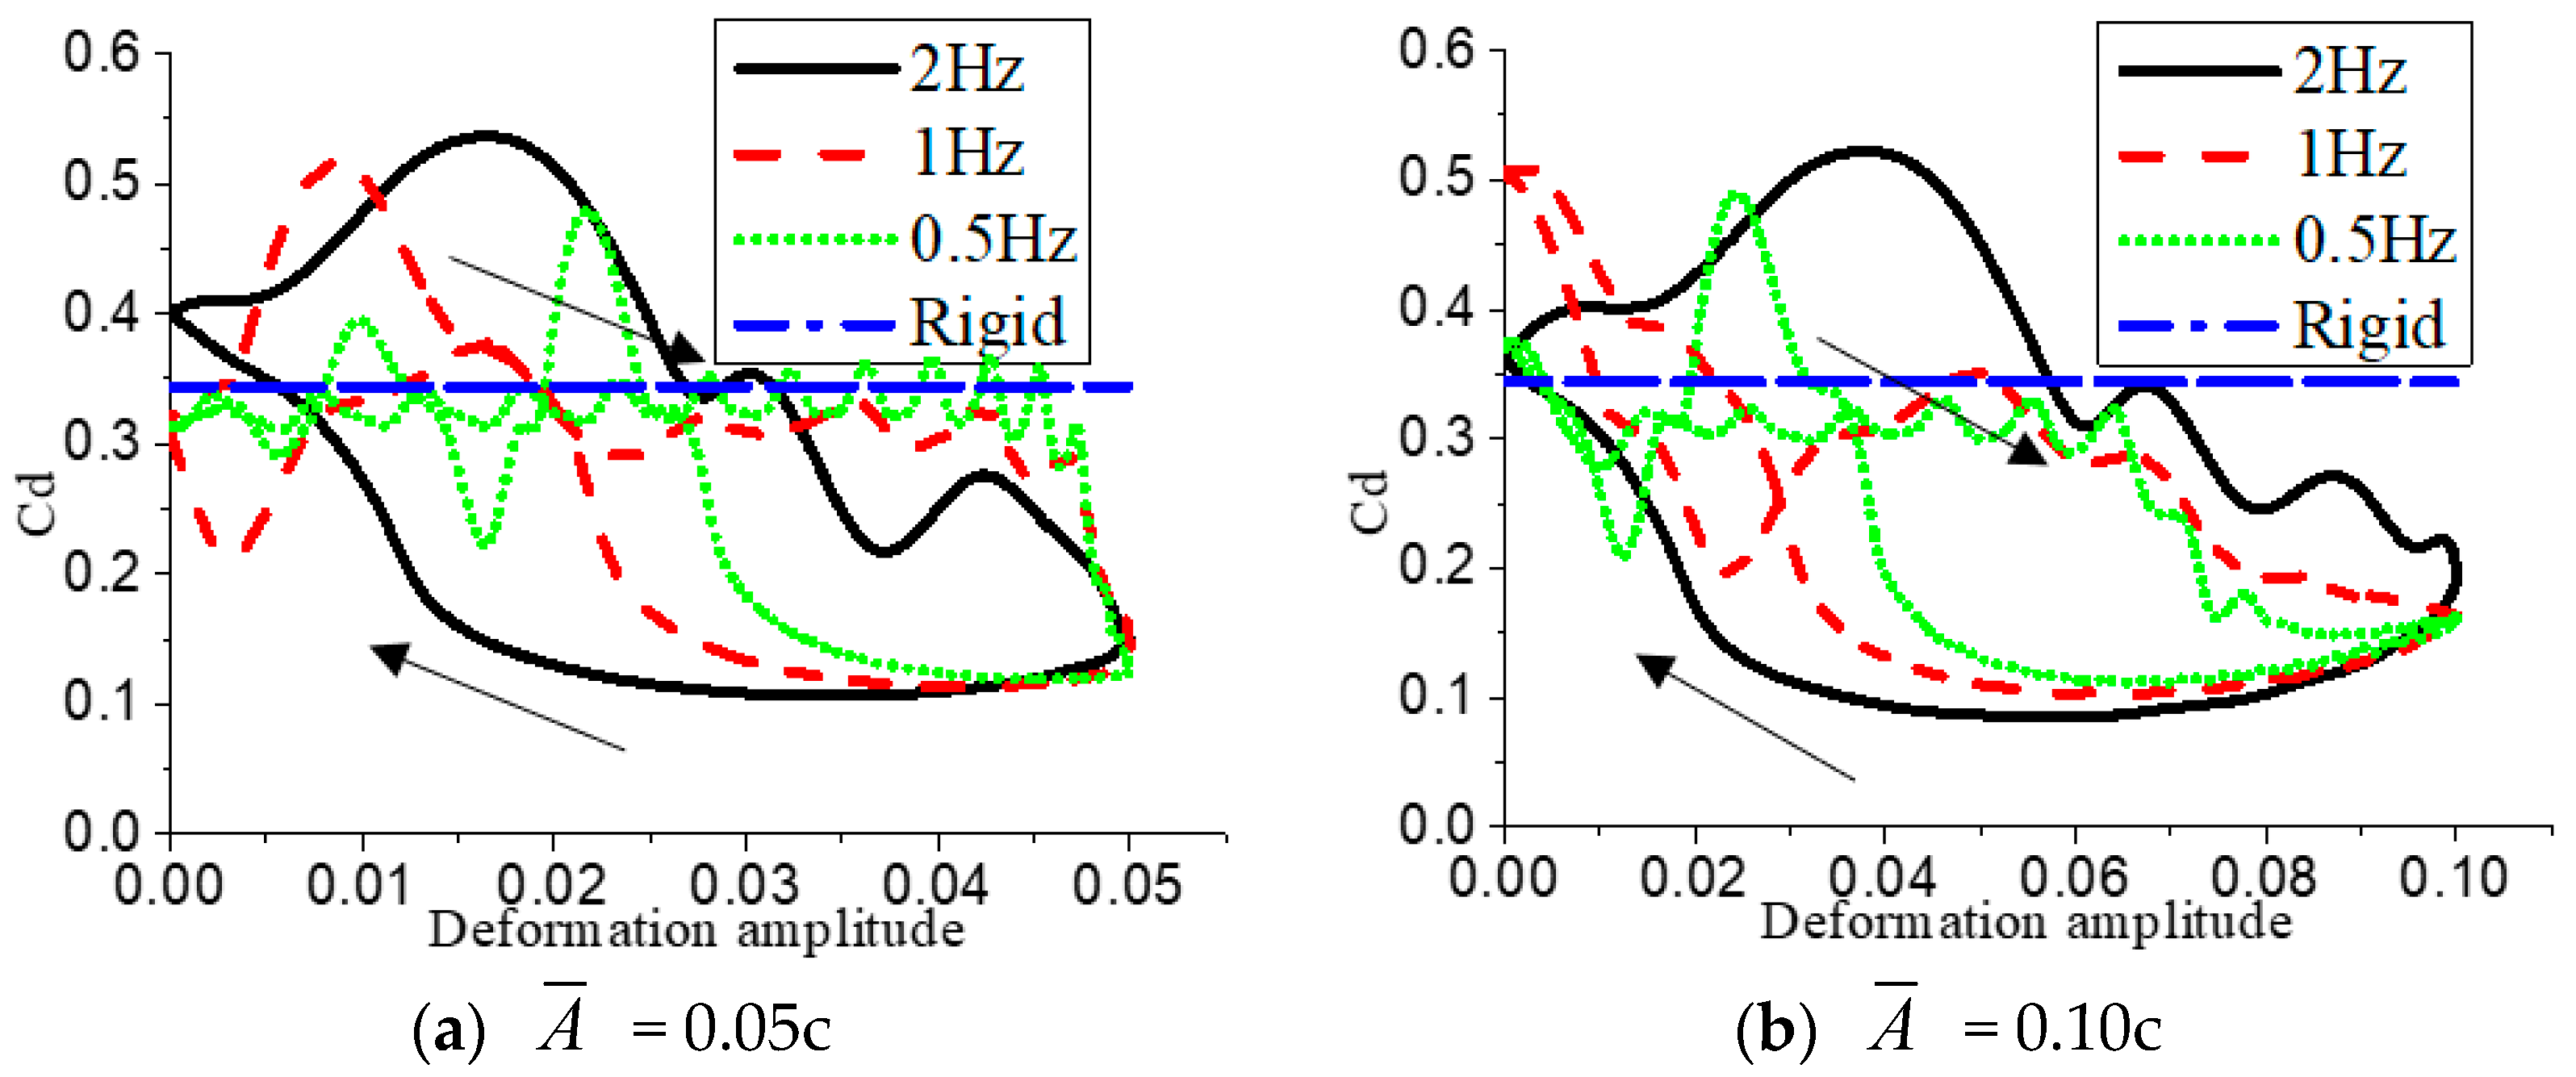
Figure 7, Figure 8 and Figure 9 show the changes in aerodynamic performance of the airfoil at deformation amplitudes of 0.05c and 0.10c. It can be seen that in the case of fixed deformation amplitude , the deformation frequency f had no obvious influence on the extreme value of the lift coefficient, and the area of the hysteresis loop also increased with the increase of f. When is 0.10c and f is 0.5 Hz and 1Hz, respectively, the hysteresis loop of lift coefficient presents a horizontal “eight-shape”. In Figure 8, the value of resistance coefficient still shows a similar change rule with 0.020c. The difference is that when the is 0.10c, the deformation frequency is f = 2 Hz, the drag coefficient of the airfoil is negative in the middle section of the downward deformation. Figure 9b,c are lift-to-drag ratio graphs. Since it is difficult to directly represent infinity and infinitesimal values in the graph, the ordinate only takes the interval of −10,000 to 10,000. It can be seen that when f is 2 Hz, the lift-drag ratio of the airfoil is relatively stable in the ascending process (① → ② → ③), but in the descending process (④ → ⑤ → ⑥ → ⑦ → ⑧), infinite values and infinitesimal values appear in the processes of ④ → ⑤ and ⑦ → ⑧, respectively. Here, it is explained that when the airfoil is in large deformation amplitude, only the deformation frequency needs to be high enough, and the airfoil will not generate resistance but generate thrust itself in a certain interval of deformation descending, thus forming a situation similar to flapping foil flapping to generate thrust. In addition, it can be inferred that if the deformation amplitude or frequency continues to increase, the thrust generation interval of the airfoil will gradually increase. However, the case of this airfoil obtaining thrust is beyond the scope of this article; thus, it will not be discussed much. From Figure 9, it can be concluded that the lift-to-drag ratio of the airfoil decreases as the camber increases when the deformation goes up, and is lower than the lift-to-drag ratio of the rigid airfoil at the beginning of the deformation. Similarly, due to the decrease of the drag coefficient when the deformation goes down, the lift-to-drag ratio quickly recovers and shows a larger increase in the middle section of the downward movement.
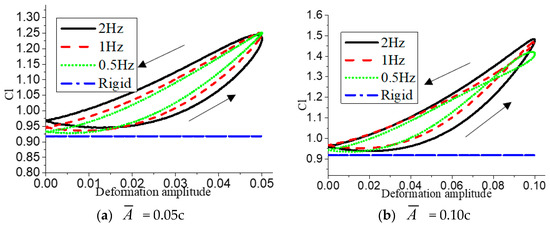
Figure 7.
When = 0.05c and = 0.10c, variation of lift coefficient with f.
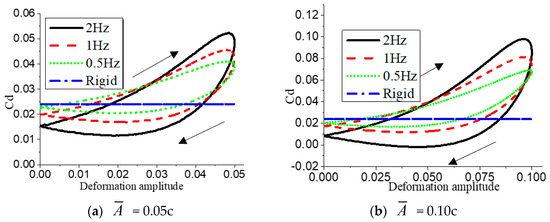
Figure 8.
When = 0.05c and = 0.10c, variation of drag coefficient with f.
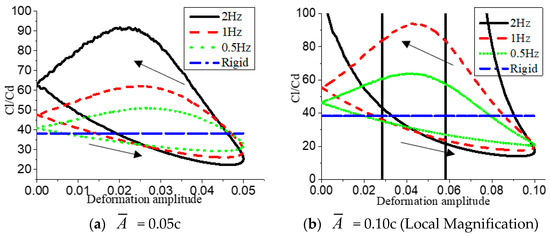
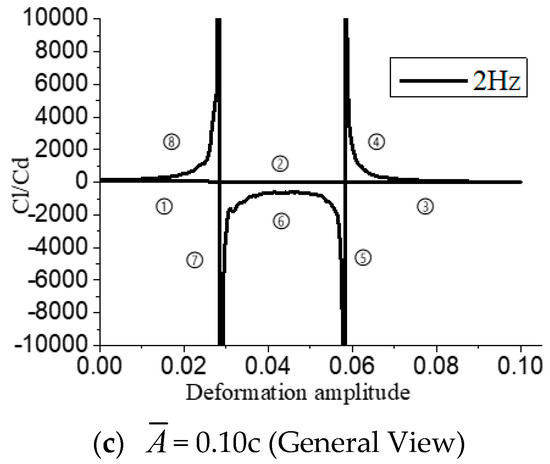
Figure 9.
When = 0.05c and = 0.10c, variation of lift-drag coefficient with f.
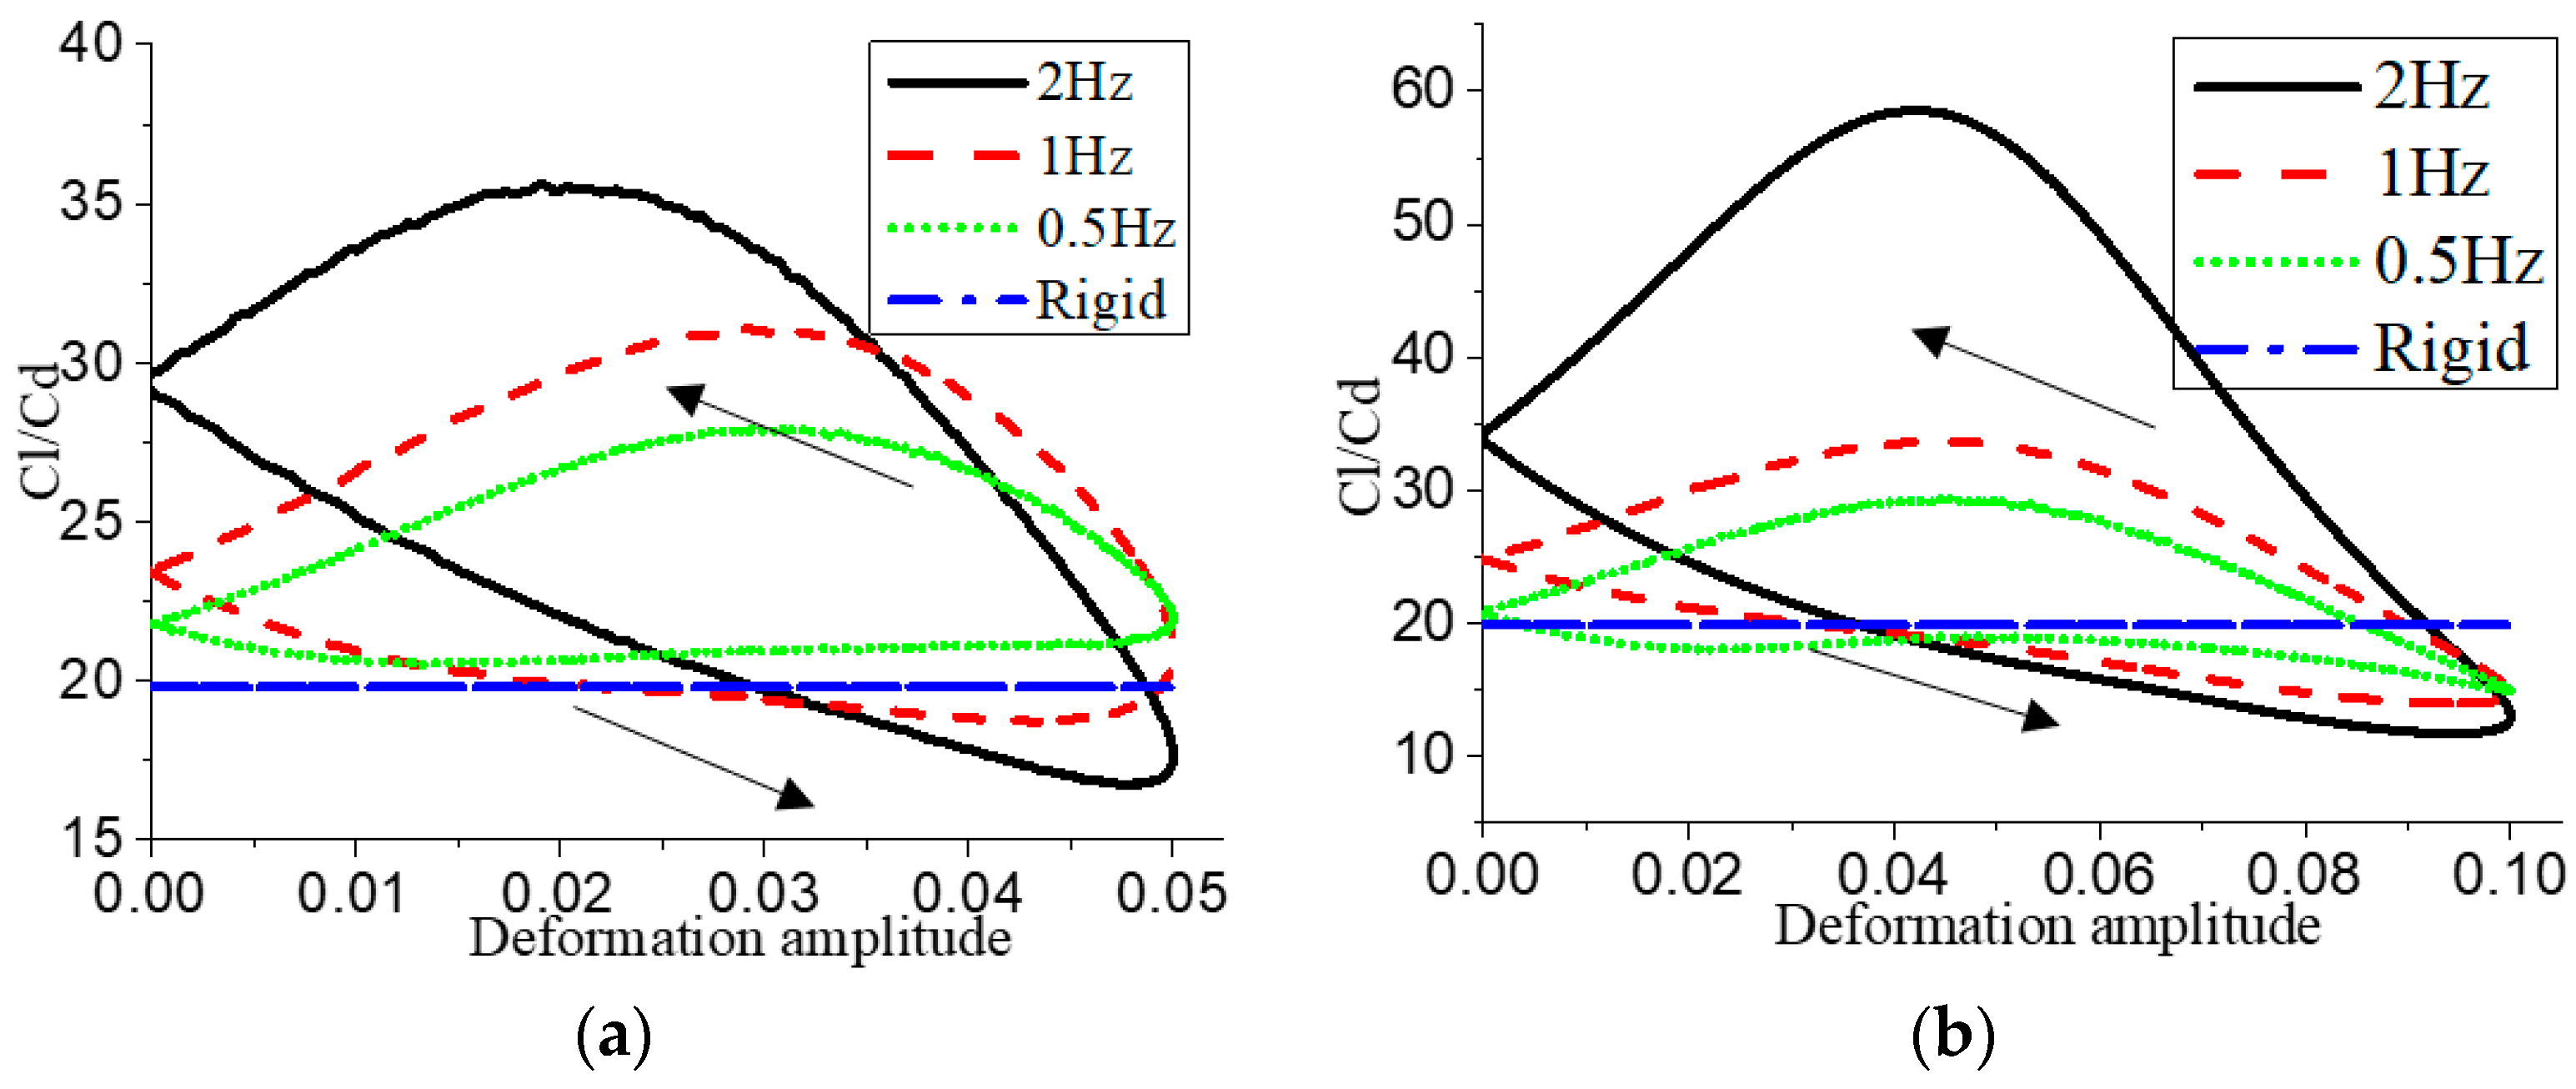
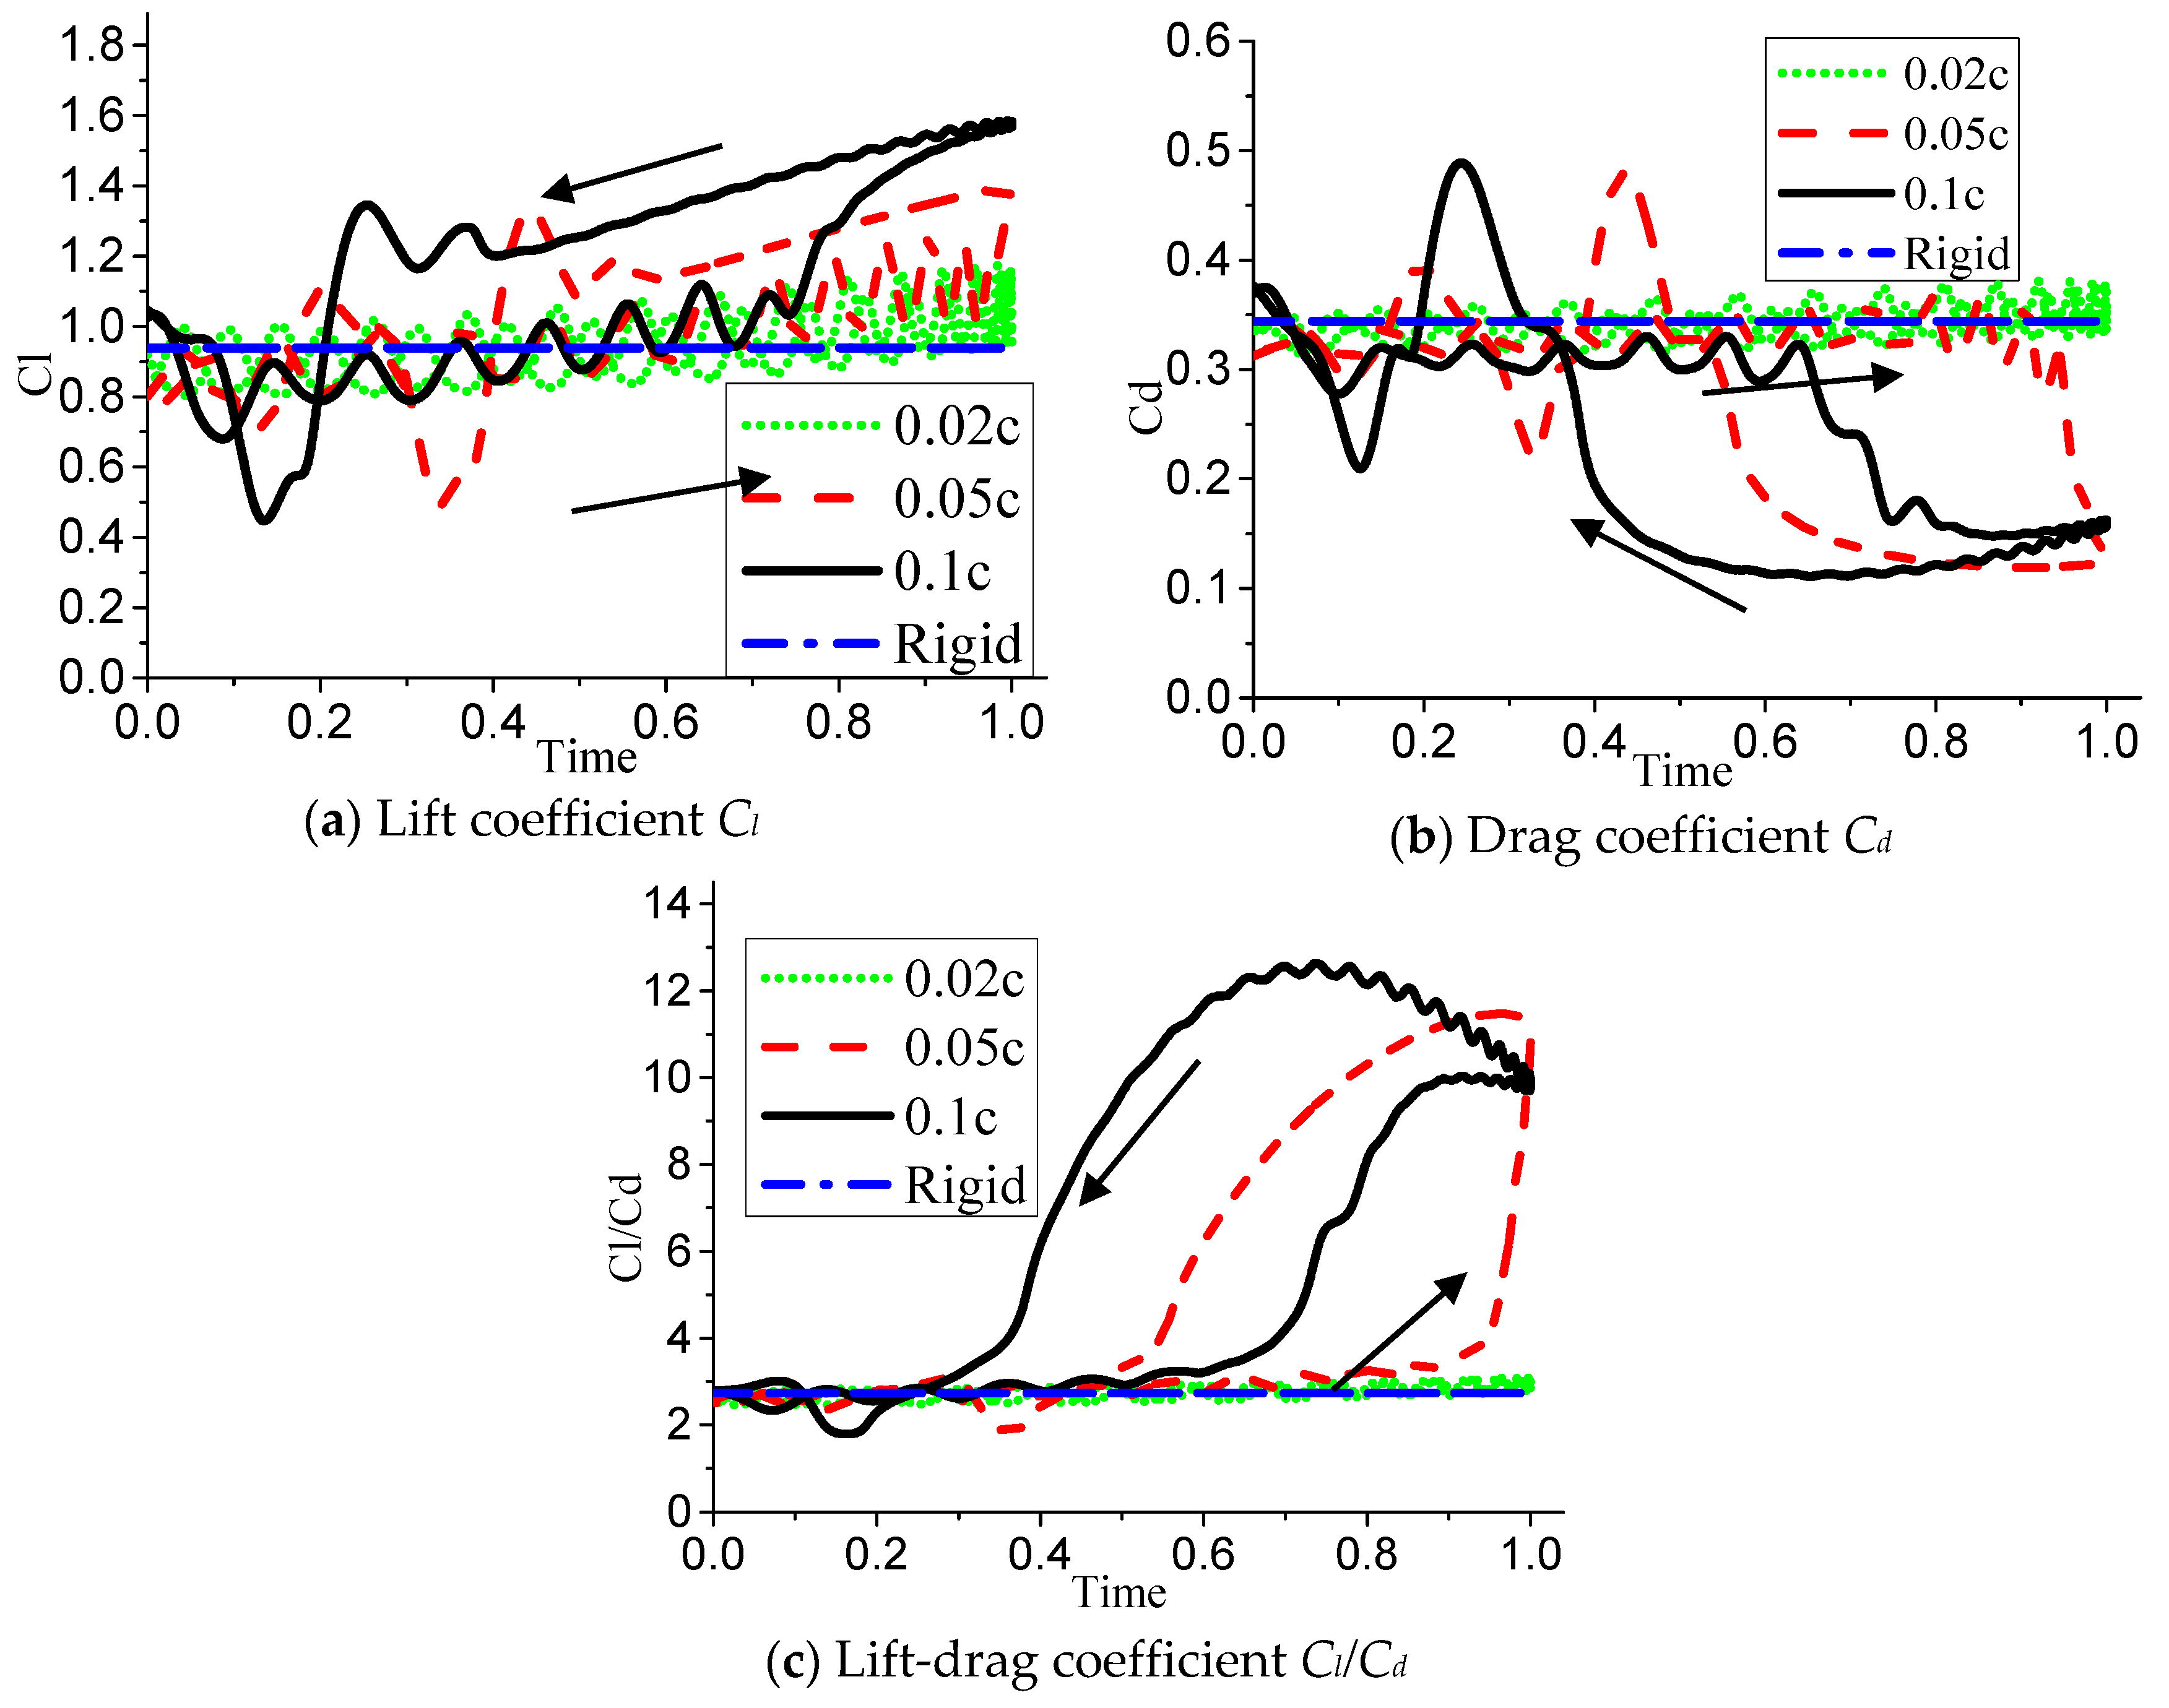
In order to obtain the influence of deformation amplitude on the aerodynamic performance of airfoil more clearly, the lift-drag coefficient and lift-drag ratio diagrams of airfoil under the same deformation frequency f = 0.5 Hz and different deformation amplitudes are given below. Figure 10 gives the graph under different deformation amplitudes when f is 0.5 Hz. In Figure 10a, it can be seen that when increases, the value of the maximum lift coefficient also increases, and the maximum lift coefficient under the condition of = 0.10c reaches 55.6% compared with that of the rigid airfoil. At the same time, because α = 10° is the angle of attack before stall, the flow field of airfoil suction surface is relatively stable, and the flow field can be well recovered when the airfoil deforms from a period to the initial symmetric airfoil; thus, the initial value of the lift coefficient of the deformed airfoil is very close to that of the rigid airfoil. As can be seen in Figure 10b, the maximum drag coefficient of the airfoil in a deformed period also increases with the increase of the deformation amplitude, and when = 0.10c, the drag coefficient will increase sharply.
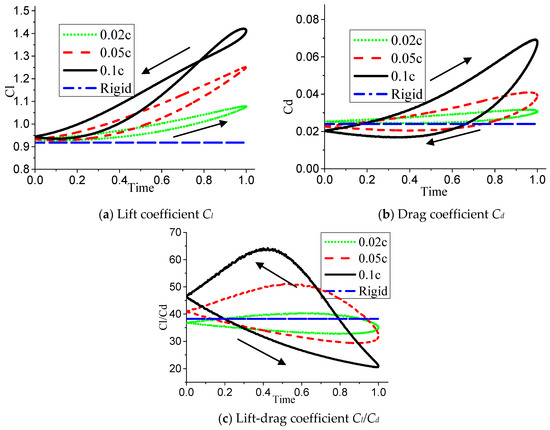
Figure 10.
When f = 0.5 Hz, variation of unsteady aerodynamic parameters with .
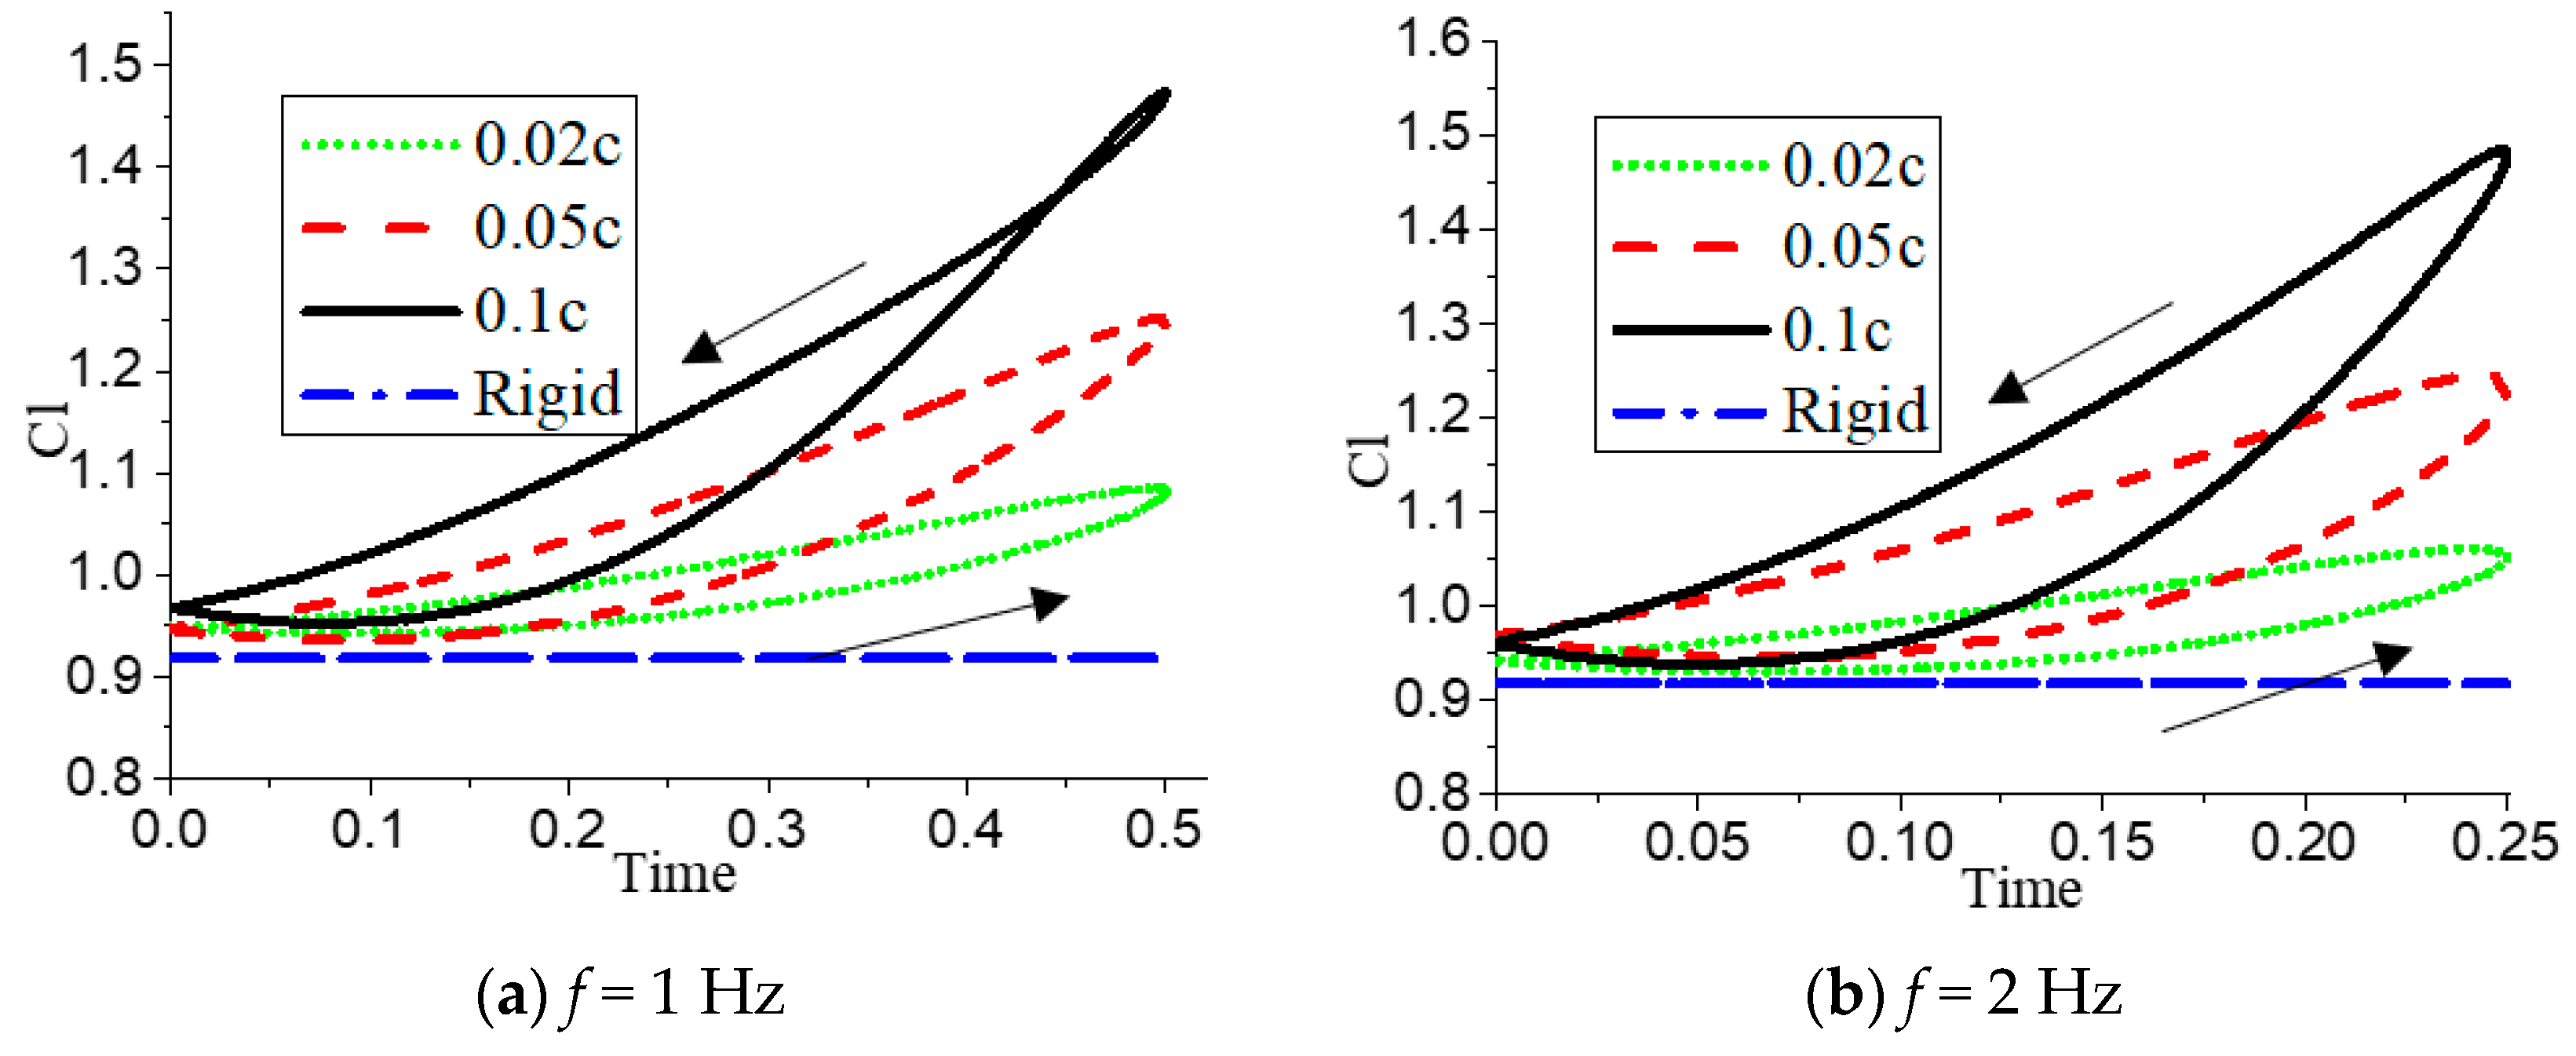
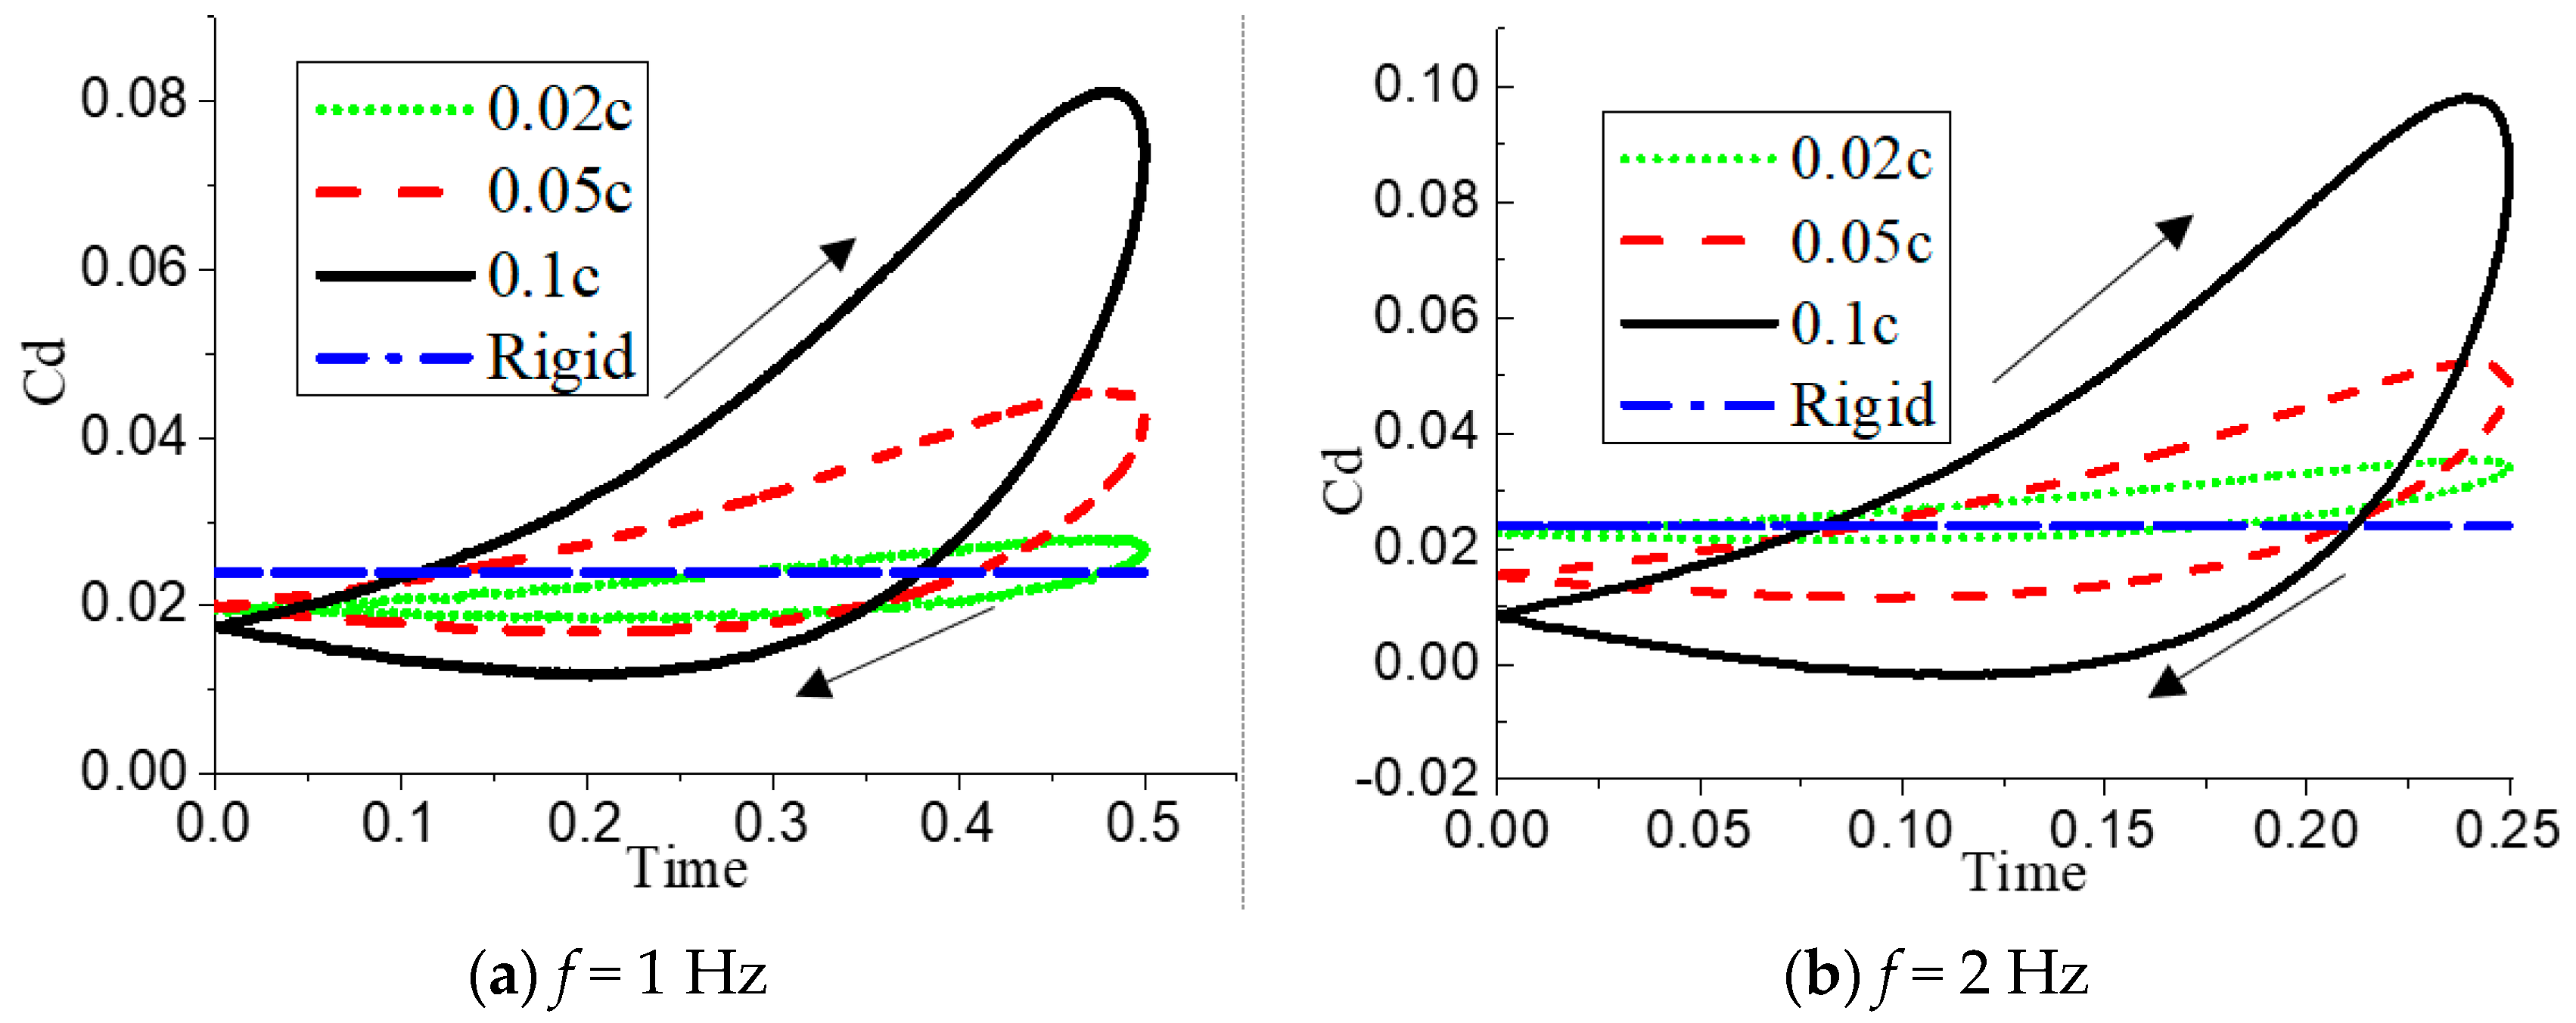
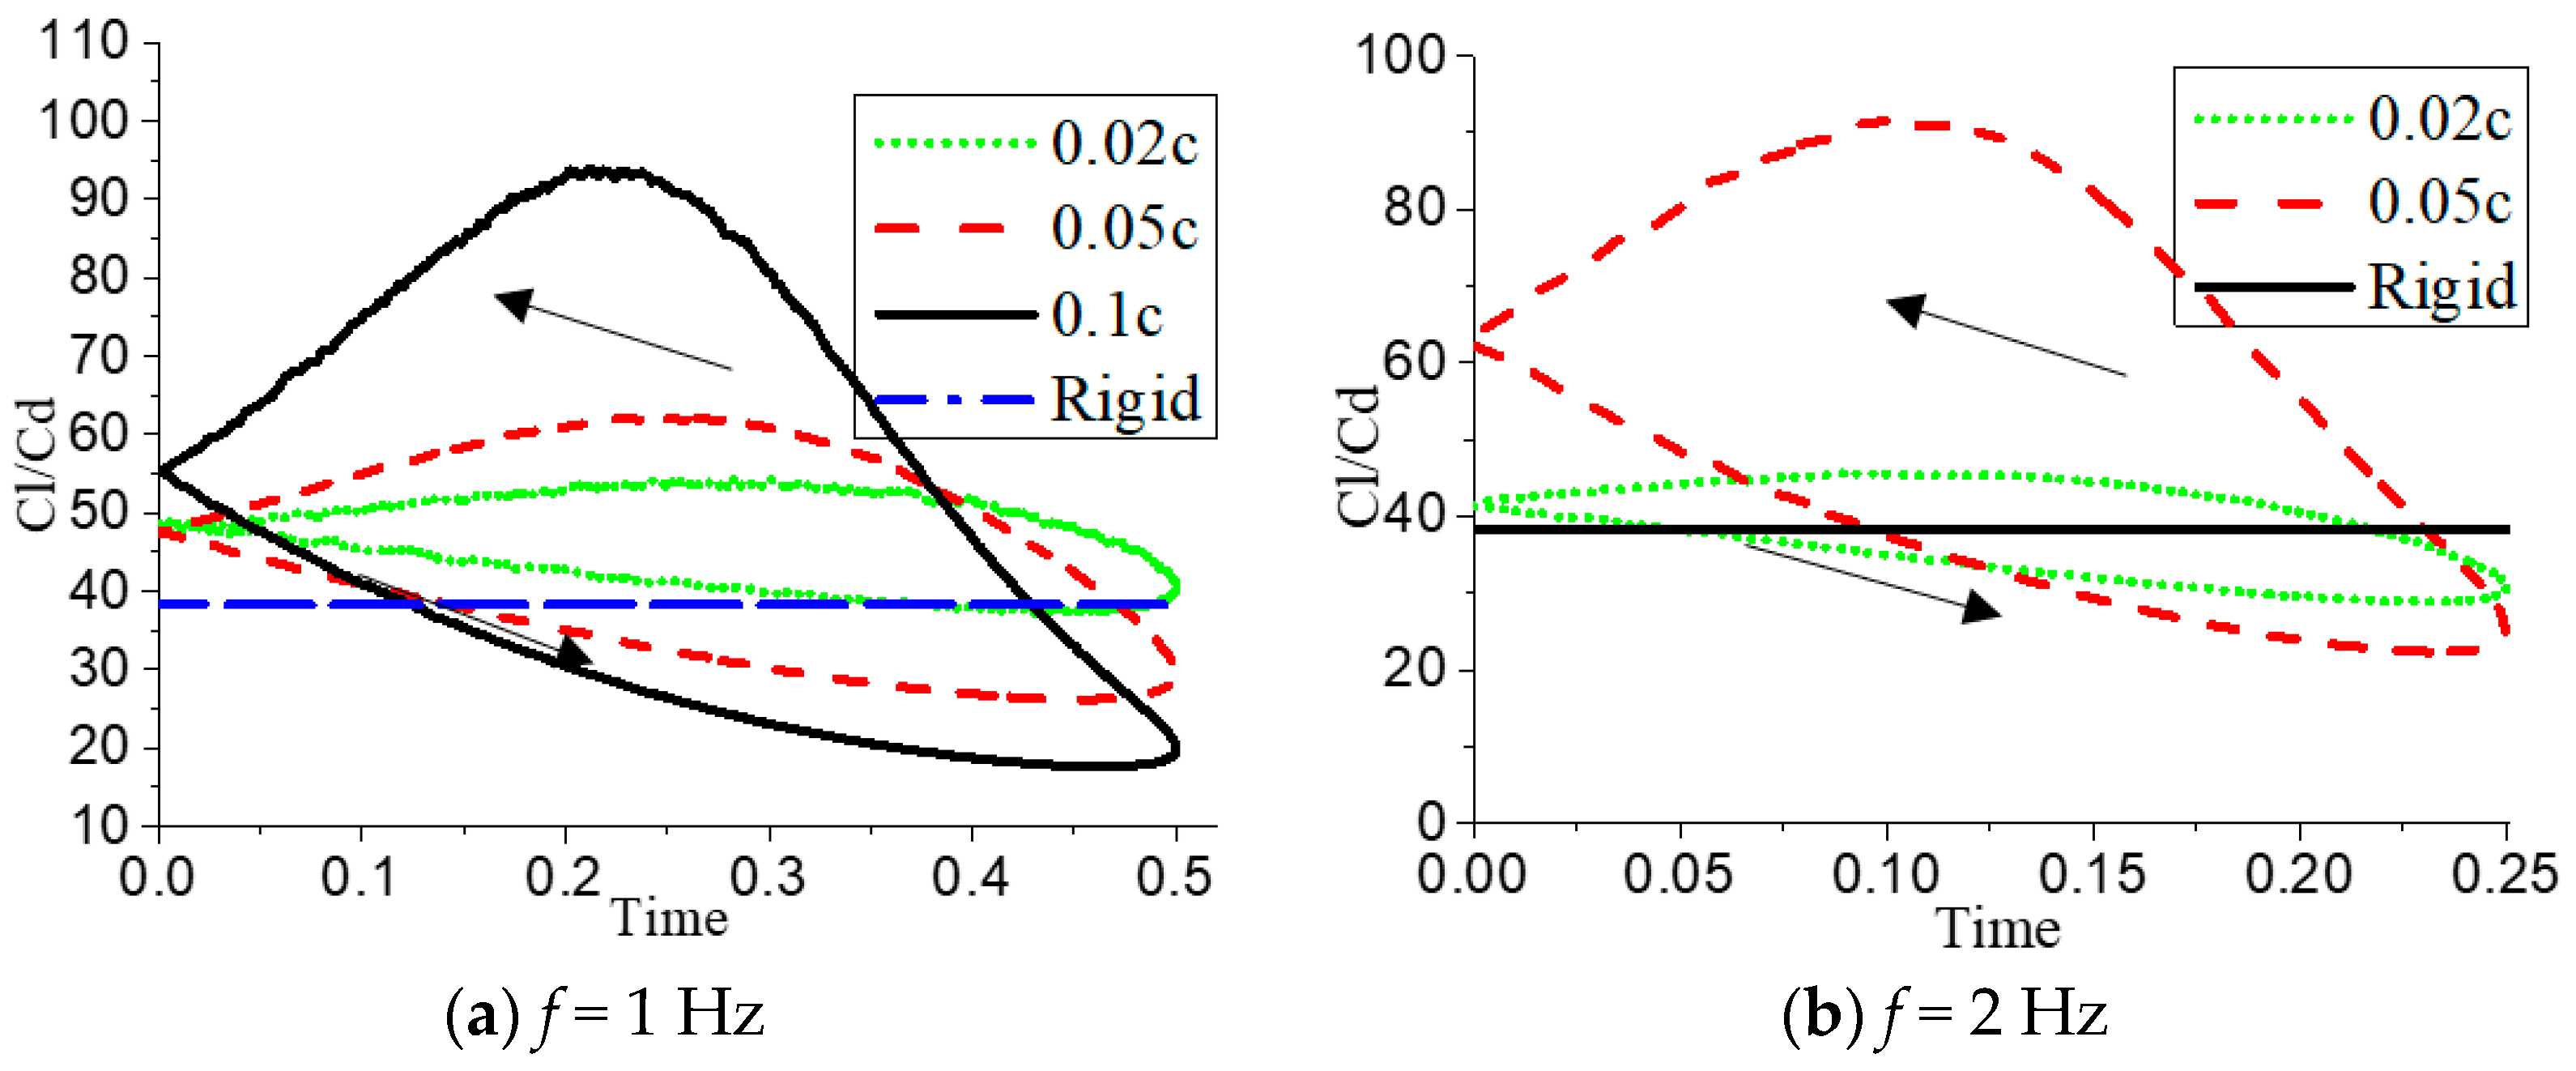
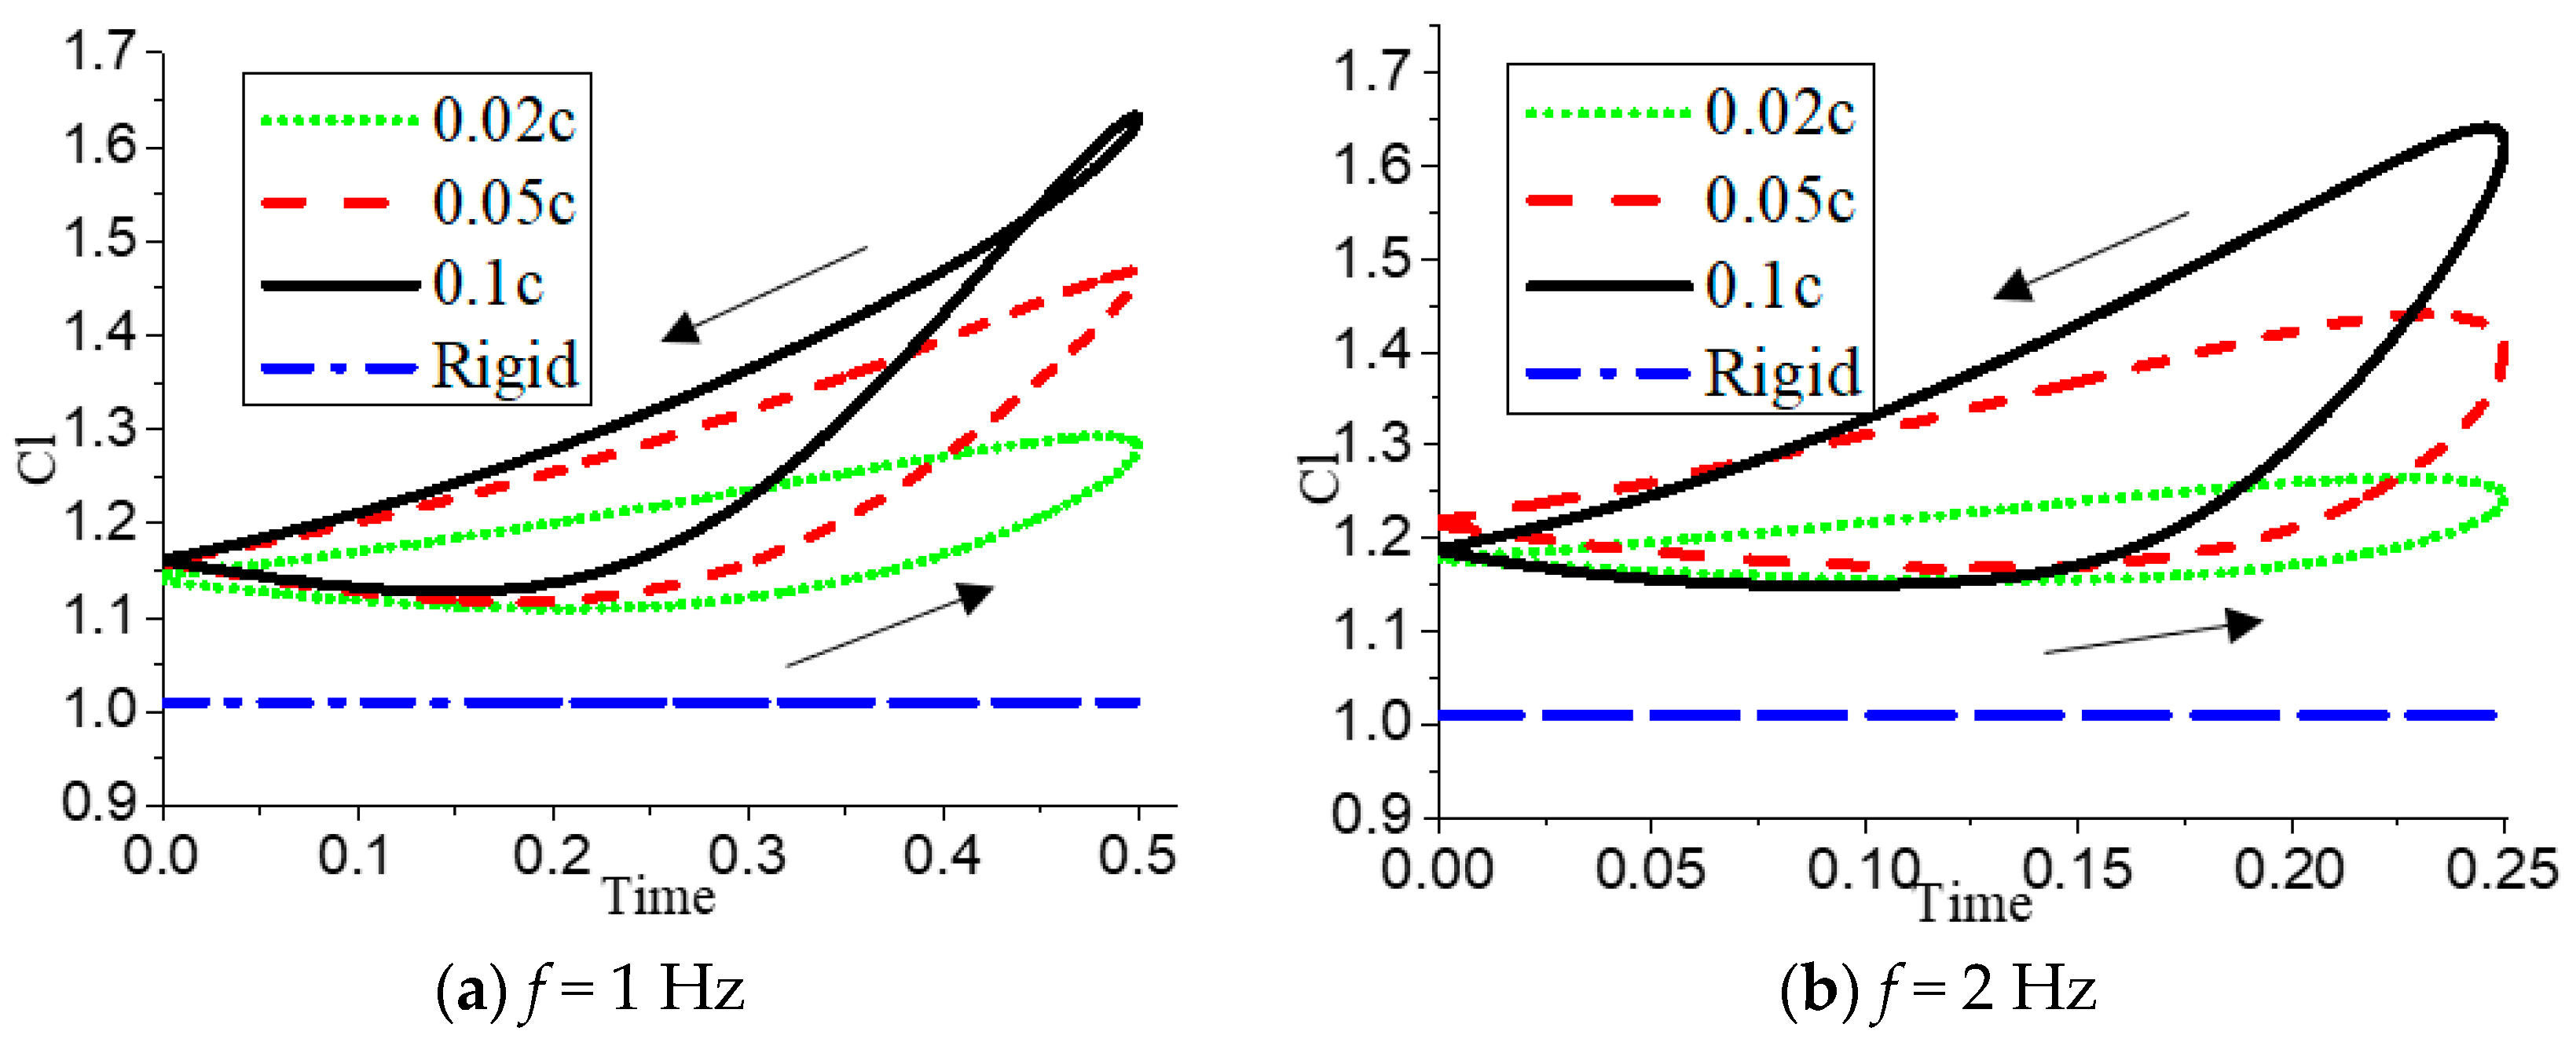
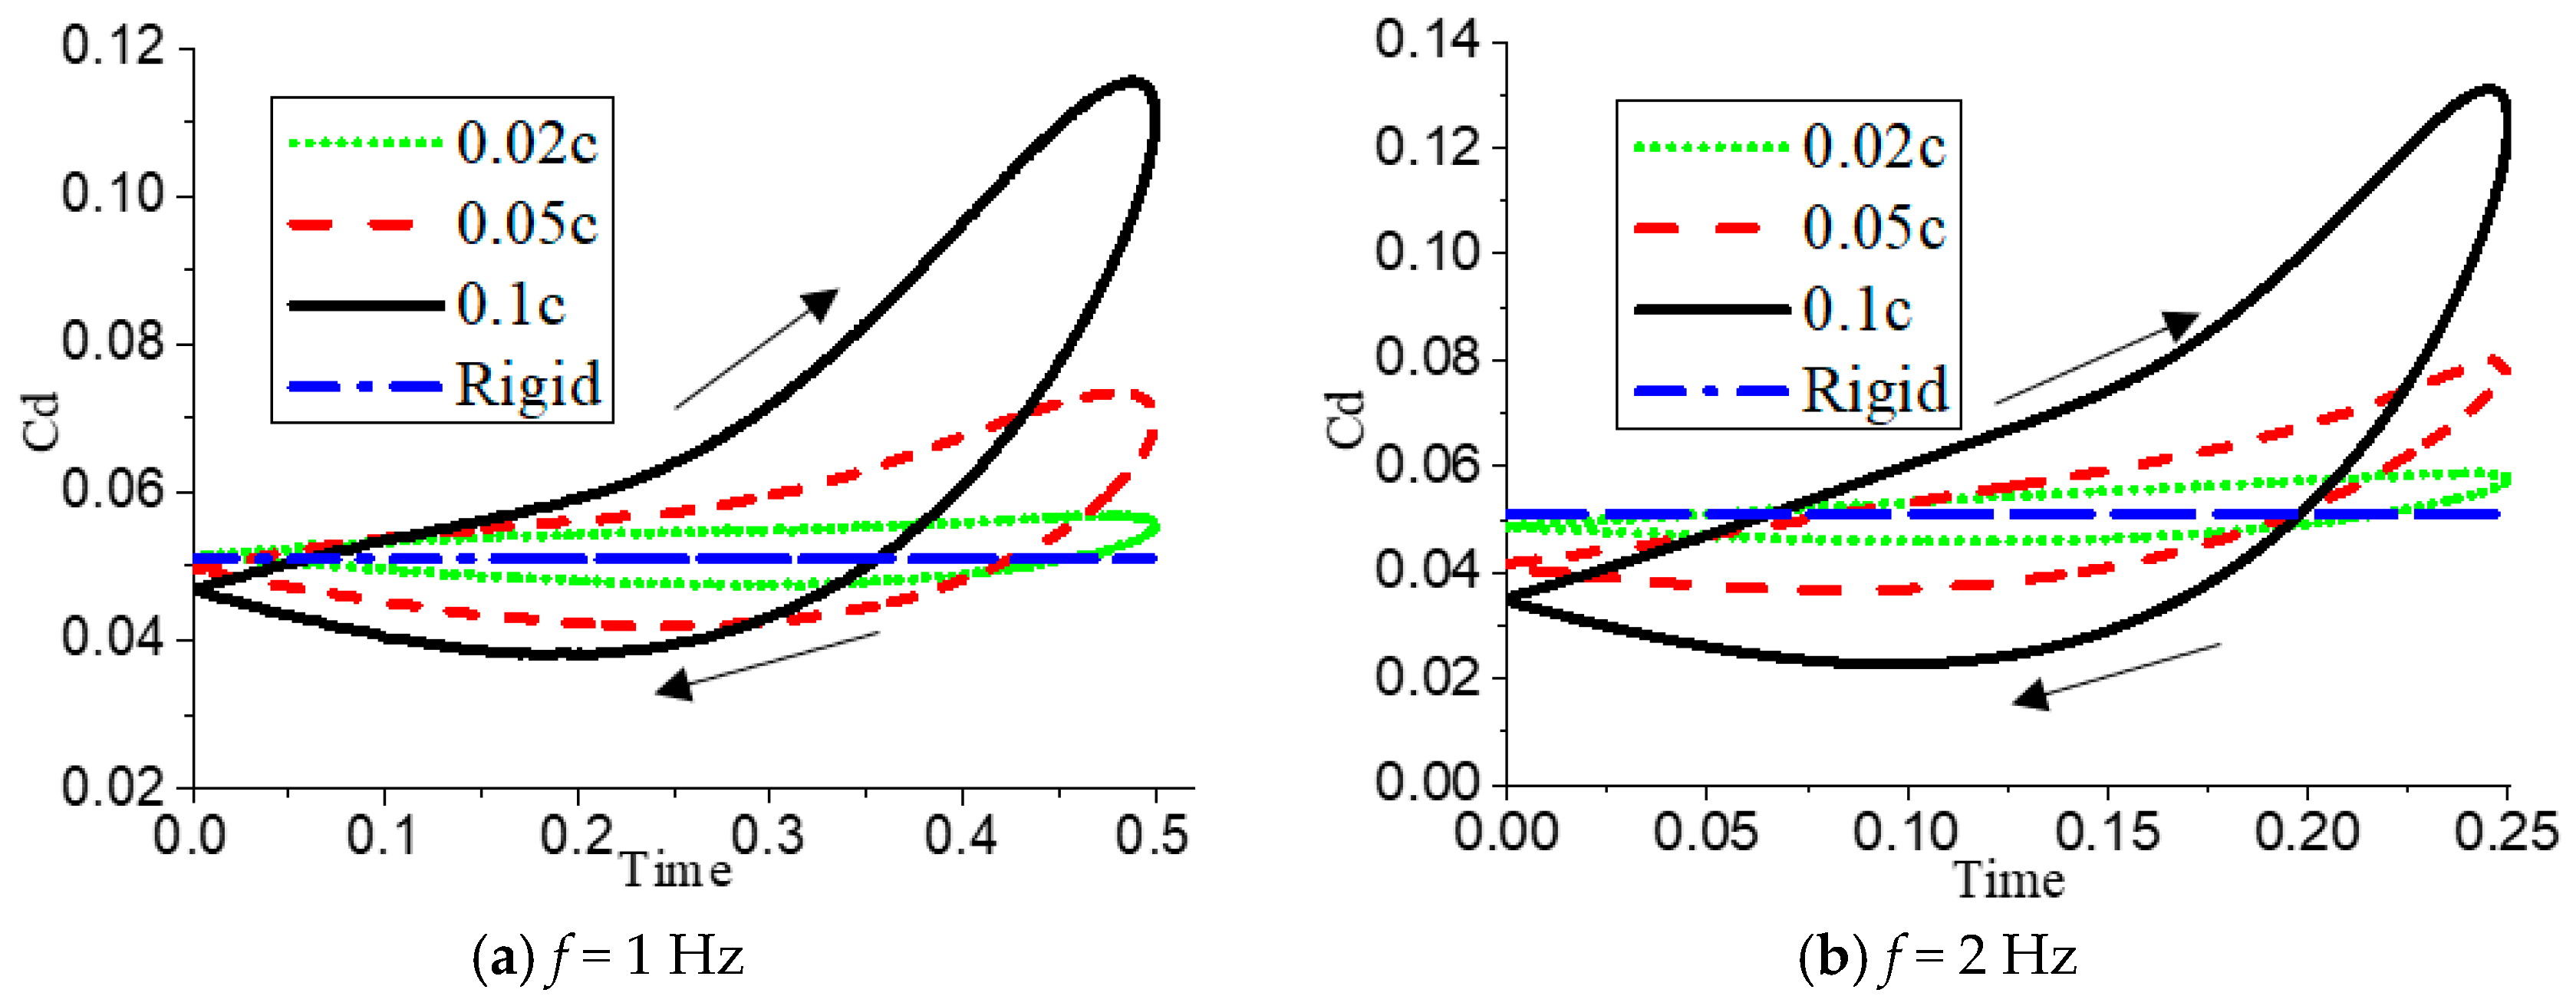
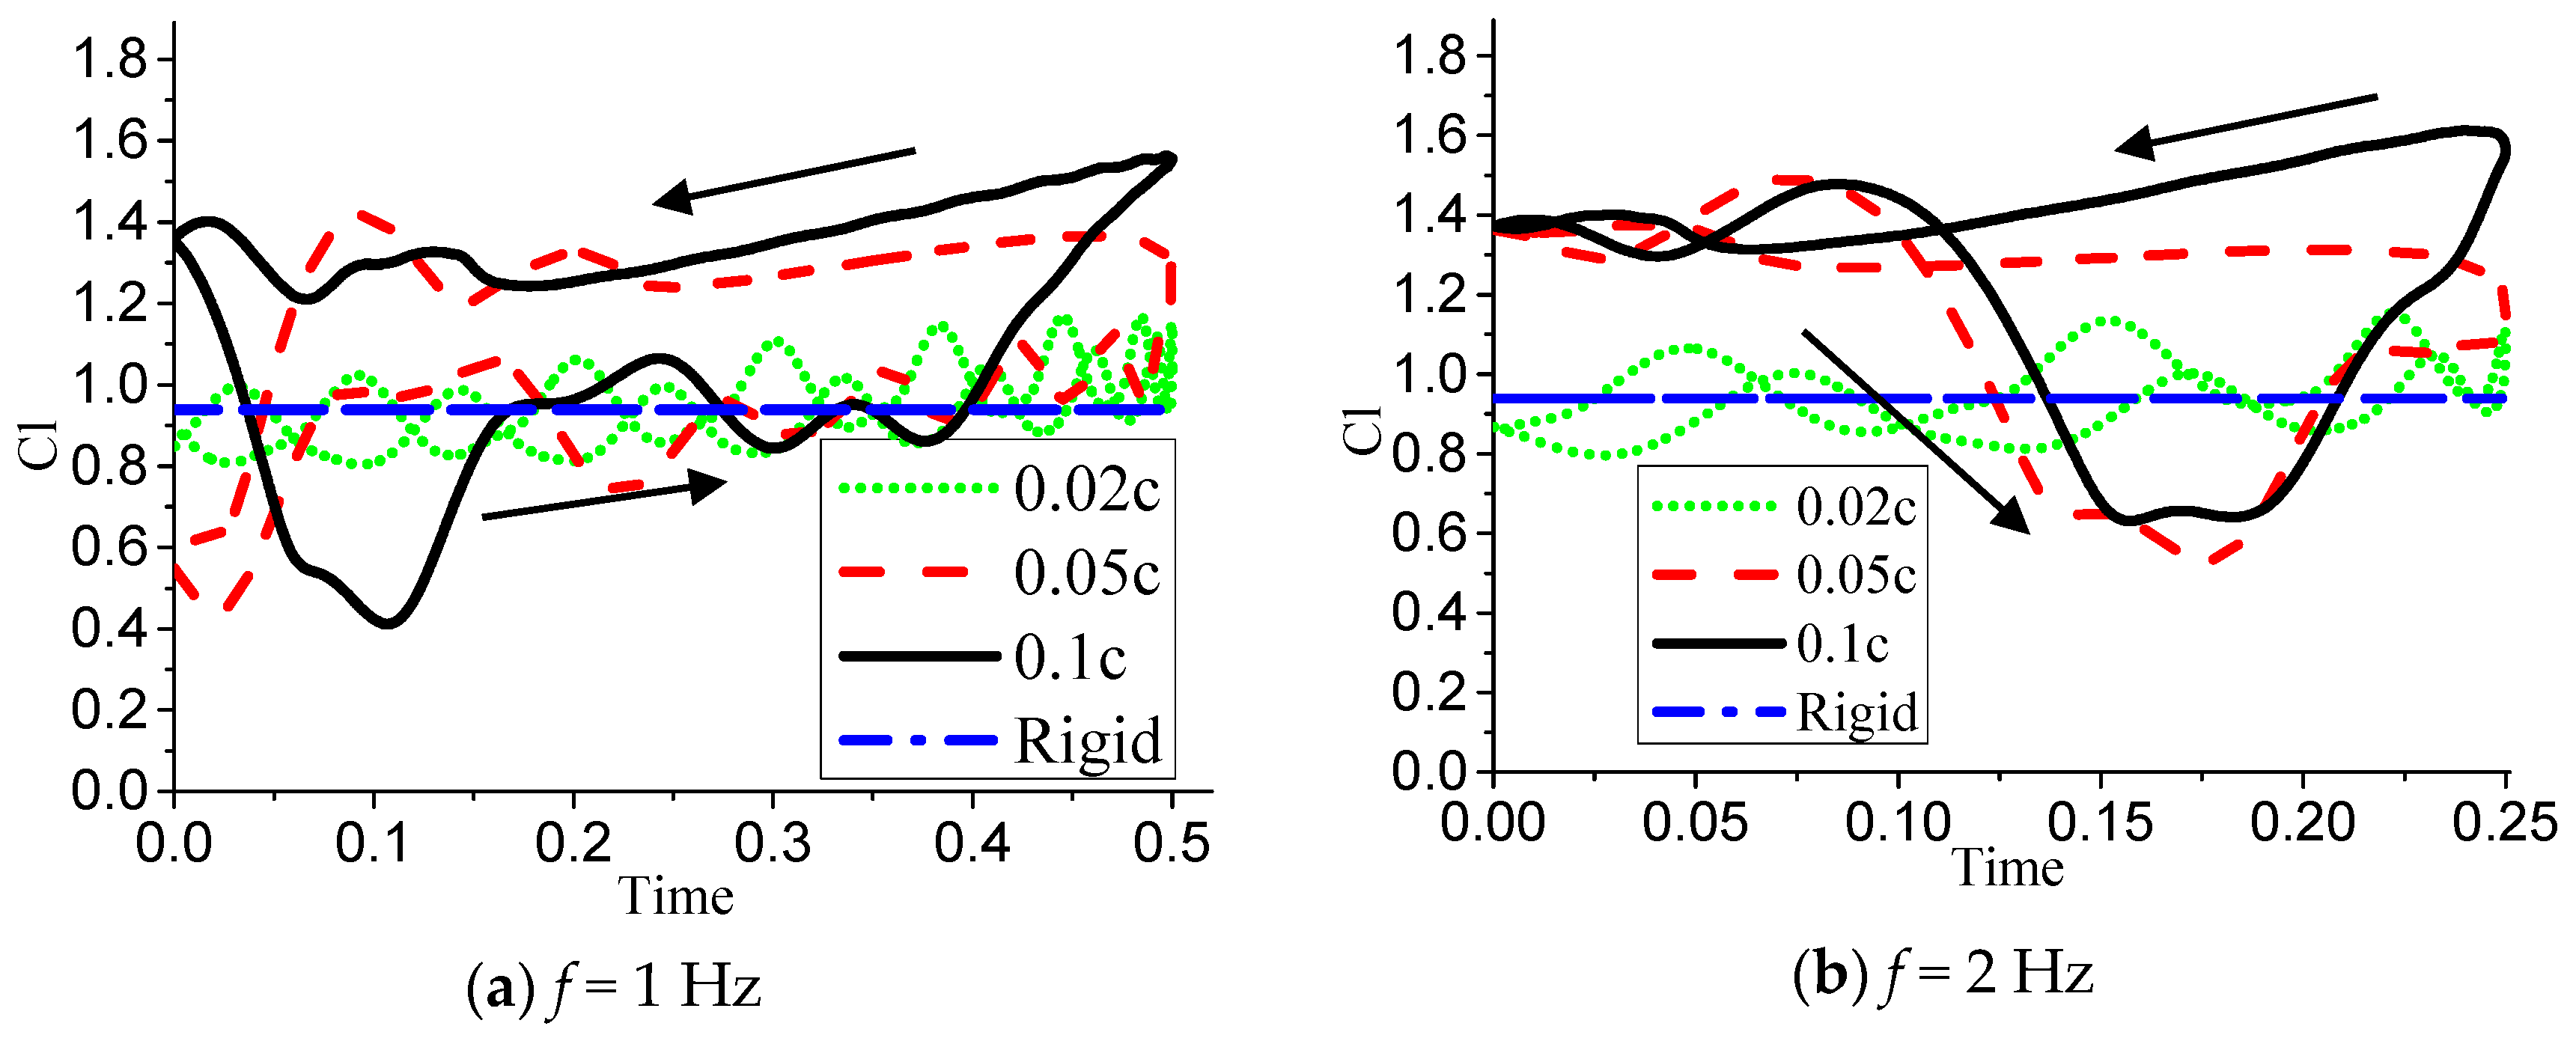
Figure 11, Figure 12 and Figure 13 show the relationship between the aerodynamic parameters corresponding to different deformation amplitudes under the condition that the deformation frequency f is 1 Hz and 2 Hz, respectively. It can be seen in the lift coefficient relationship diagram of Figure 11 that the same vibration frequency f when the deformation amplitude is increased, the lift coefficient of the airfoil in a deformation period is greater than that of the rigid airfoil. As the amplitude increases, the maximum lift coefficient value increases greatly. Figure 12 shows the drag coefficient relationship. Similarly, as the amplitude increases, the drag coefficient increases sharply. In addition, the area of the hysteresis loop of the drag coefficient increases with the increase of the amplitude. It can be seen from the graph of lift-resistance ratio of Figure 13 that when f = 1 Hz and is 0.020c, the lift-to-drag ratio of the deformed airfoil is higher than that of the rigid airfoil during the whole deformation period, and the lift-to-drag ratio is improved nearly 25% in the downward stage of deformation. The airfoil can stably improve the aerodynamic performance under this deformation mode, and is also the best deformation mode under the 10° angle of attack.
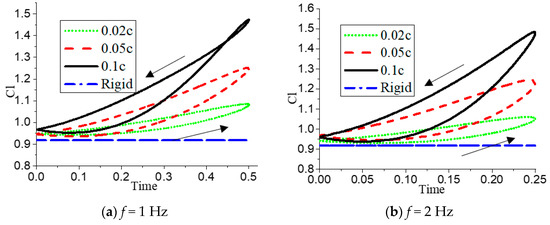
Figure 11.
When f = 1 Hz (a) and f = 2 Hz (b), variation of lift coefficient with .
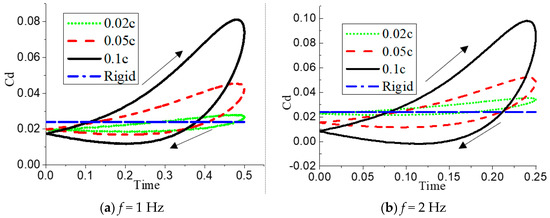
Figure 12.
When f = 1 Hz (a) and f = 2 Hz (b), variation of drag coefficient with .
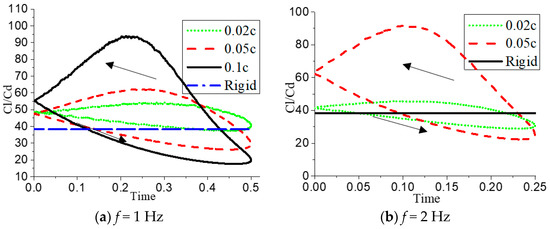
Figure 13.
When f = 1 Hz (a) and f = 2 Hz (b), variation of lift-drag coefficient with .
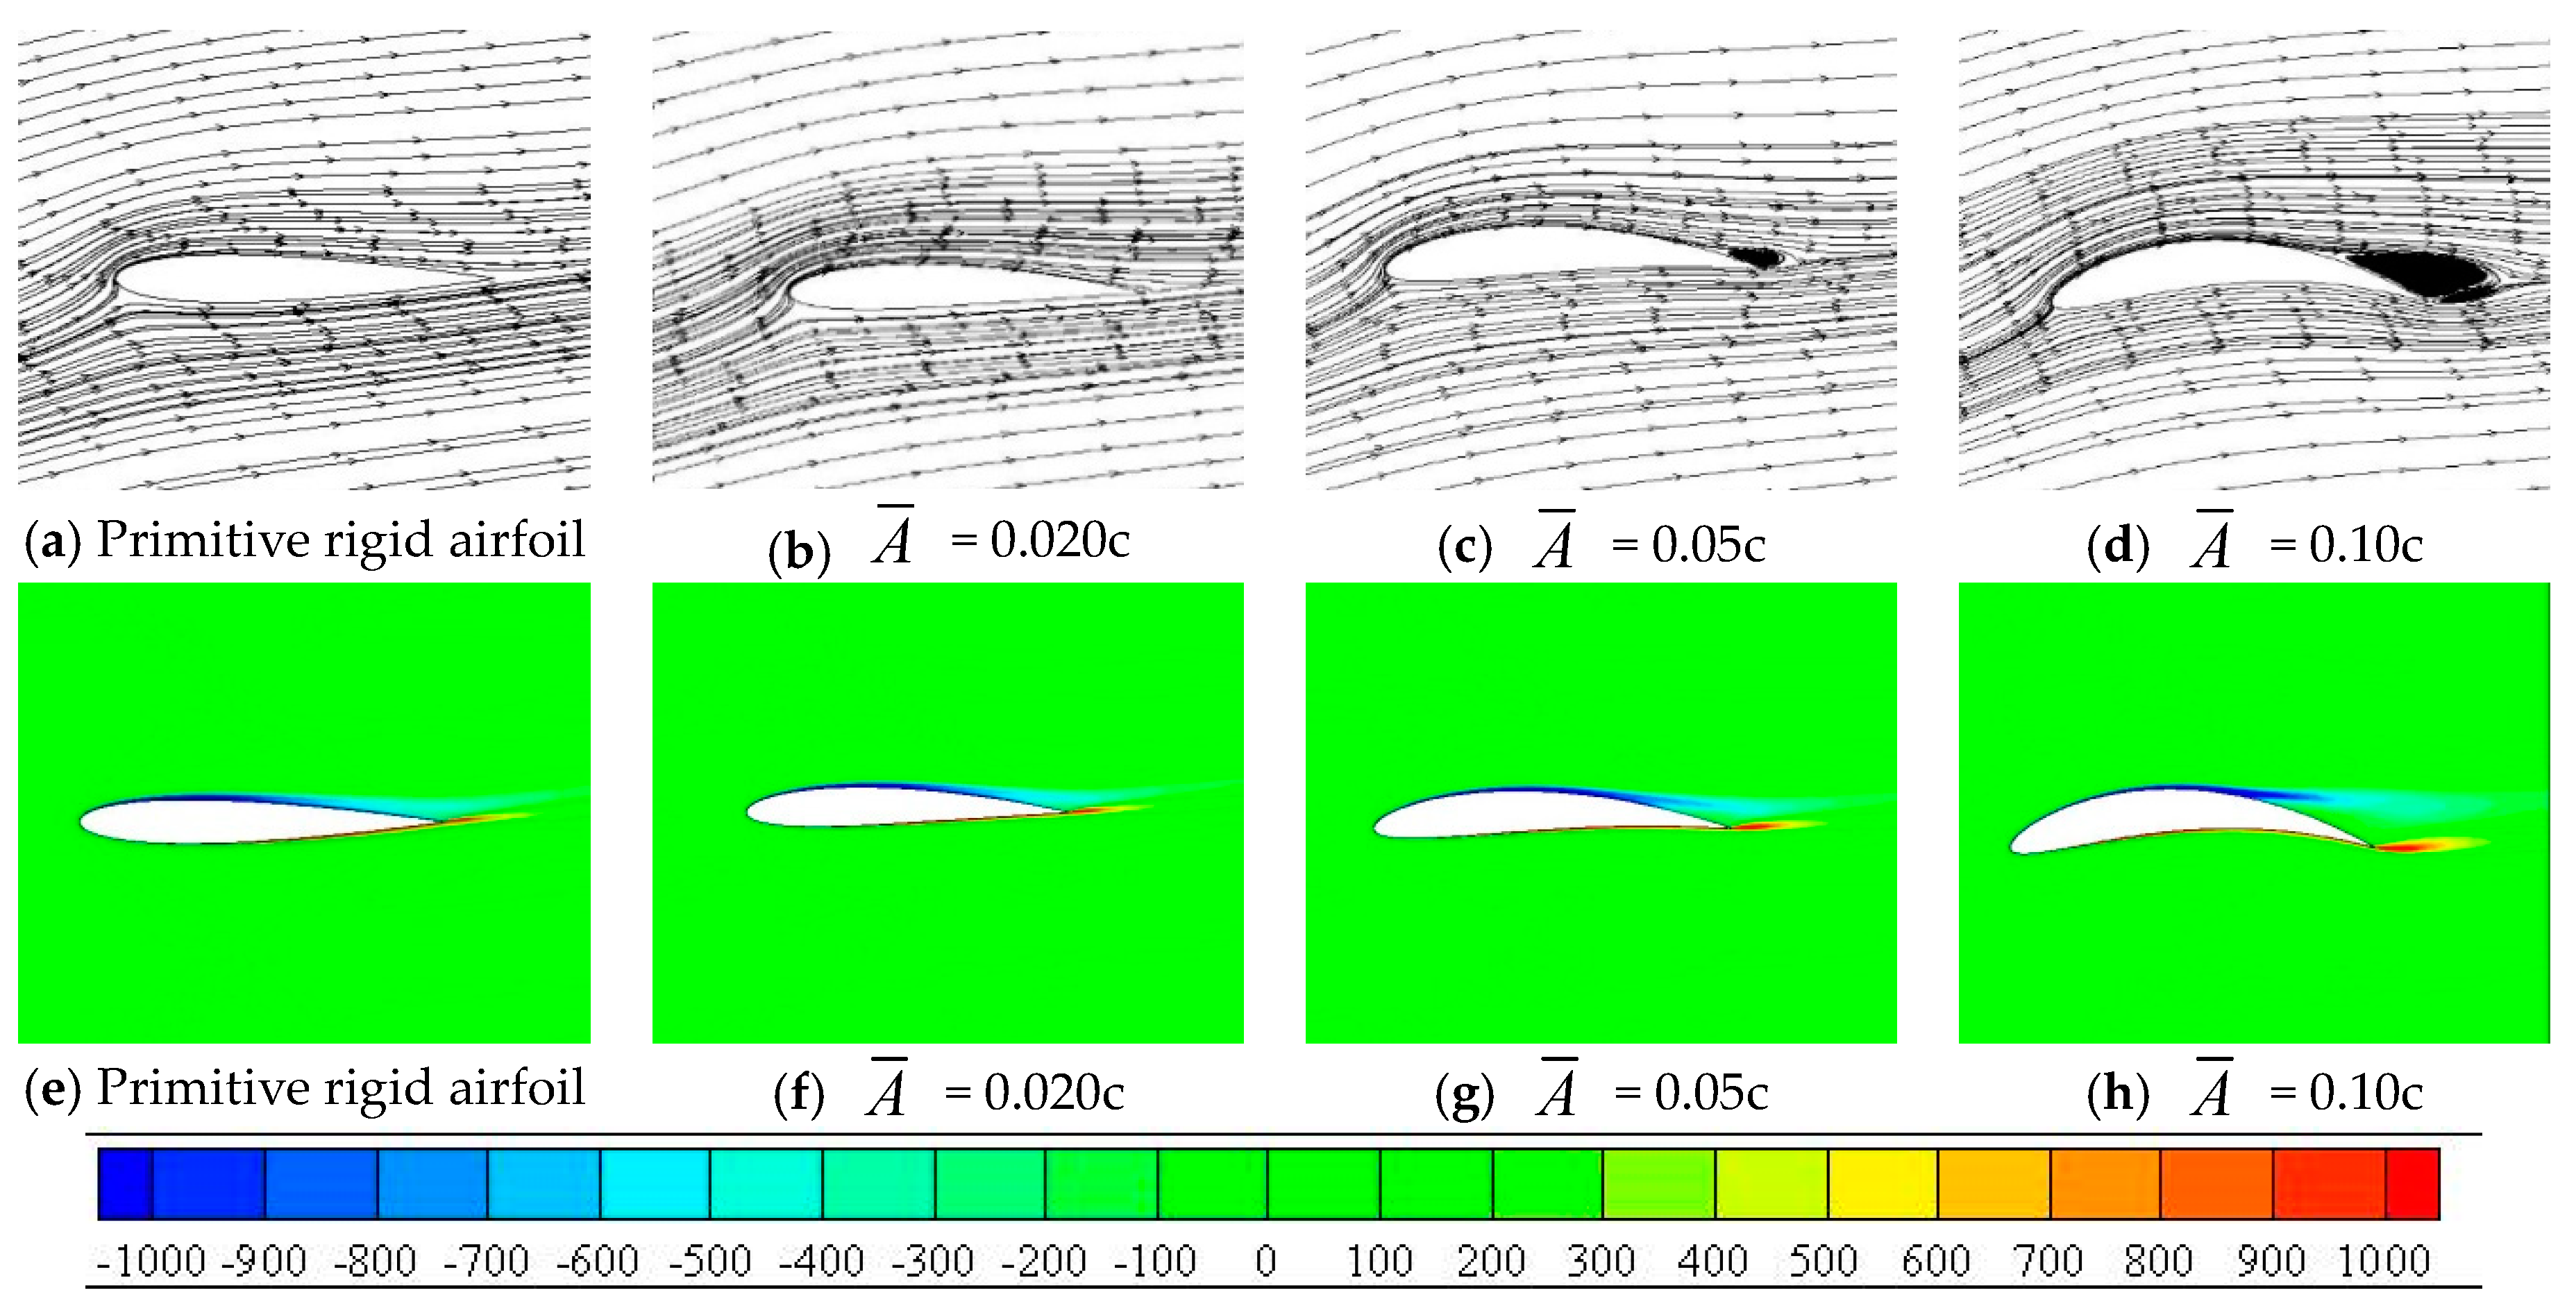
The resistance coefficient value in Figure 12b can be seen to increase with the rise of the deformation amplitude, and the resistance coefficient increases sharply when reaches 0.10c. Therefore, Figure 14 gives the instantaneous streamline diagram and instantaneous vorticity diagram of the original rigid airfoil and the airfoil at the moment when the airfoil deforms to a given maximum deformation amplitude under three deformation amplitudes. For the rigid airfoil, Figure 14a, when the airfoil is at the stall angle of attack, the suction surface of flow field is appendage flow from the leading edge to the trailing edge, and the slender free shear layer on suction surface is extended from the leading edge to the trailing edge. It can be seen from the streamline diagram of Figure 14b–d that due to the increase of the deformation amplitude of the active deformation of the airfoil, after reaching the given maximum deformation amplitude, separation bubbles of different sizes appear at the trailing edge of the airfoil. When is 0.020c, the upper airfoil surface maintains a stable flow field like the rigid airfoil, and the boundary layer of suction surface does not separate. When the increases to 0.05c, the boundary layer at the rear section of the airfoil gradually thickens near the trailing edge, pushing the main flow outward, the pressure gradually decreases, and the increase of the reverse pressure gradient causes the boundary layer flow to begin to separate and form vortex. With the continued increase to 0.10c, the separation point of the airfoil suction surface continues to move forward, the pressure of the main flow and the vortex zone at the separation becomes lower, and a large-scale separation bubble has been formed at the trailing edge, resulting in the increase of differential pressure resistance.
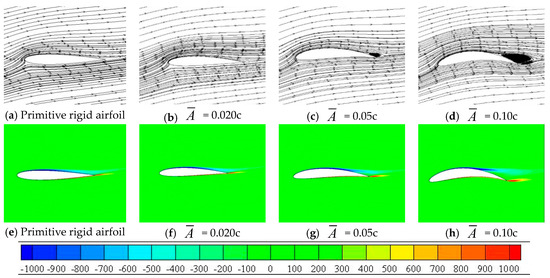
Figure 14.
Streamline and vorticity distribution under different deformation amplitudes at attack angle α = 10° and f = 0.5 Hz.
4.2. Active Deformed Airfoil at Attack Angle α = 14°
When the angle of attack α = 14°, it has exceeded the critical angle of attack and is in the light stall angle of attack range. Figure 15 is a graph showing the aerodynamic parameters of an airfoil at three different deformation frequencies when the deformation amplitude is 0.020c. As can be seen from the lift coefficient diagram in Figure 15a, under the condition of light stall angle of attack, the aerodynamic performance of the actively deformed airfoil shows obvious improvement. The lift coefficient value is increased by more than 10% over the rigid airfoil in the whole deformed period. The larger the deformation frequency is, the smaller the fluctuation range of the lift coefficient value is. In Figure 15b, the airfoil resistance coefficient still increases with the increase of camber when the deformation goes up, and the maximum resistance coefficient value increases with the increase of f. The larger f when the deformation goes down, the more obvious the decrease of the resistance coefficient value is. As can be seen in Figure 15, although the drag coefficient increases with the increase of deformation camber, the lift-drag ratio of the airfoil is still maintained above the lift-drag ratio of the rigid airfoil throughout the deformation period, and the maximum lift-drag ratio can be increased by about 25%.
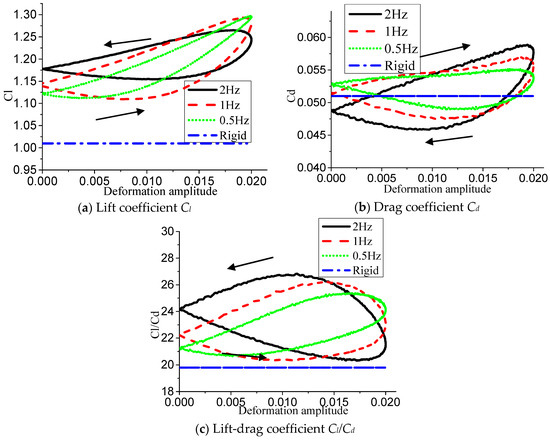
Figure 15.
= 0.020c, variation of unsteady aerodynamic parameters with f.
Figure 16, Figure 17 and Figure 18 show the unsteady aerodynamic parameters at three deformation frequencies for deformation amplitudes of 0.05c and 0.10c. As can be seen in Figure 16, the influence of the deformation frequency on the extreme value of airfoil lift coefficient is still not obvious, only slightly different at the initial stage of deformation, and the area of hysteresis loop also increases with the increase of frequency. The drag reduction effect of the actively deformed airfoil in Figure 17 is still in the downward stage of airfoil deformation, and the drag reduction effect increases with the increase of f. The best drag reduction effect can reach about 50%. Therefore, it can be seen in Figure 18 that the lift-to-drag ratio has the maximum lift-to-drag ratio when the deformation goes down, and the lift-to-drag ratio is more obvious when the frequency f = 2 Hz. In addition, when the airfoil is at = 0.05c and f = 0.5 Hz, the lift-to-drag ratio in one cycle of the actively deformed airfoil is improved compared with the rigid airfoil, and the maximum lift-to-drag ratio can be increased by about 25%.
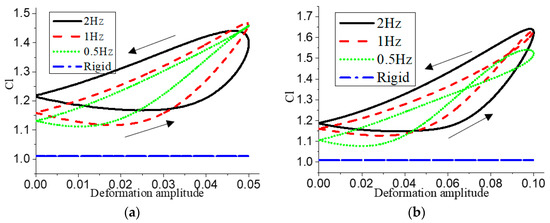
Figure 16.
When = 0.05c (a) and = 0.10c (b), variation of lift coefficient with f.
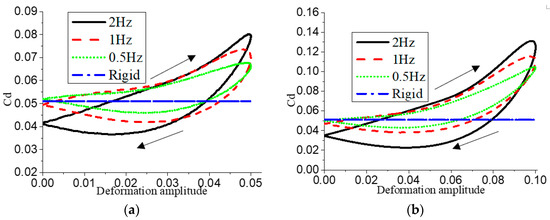
Figure 17.
When = 0.05c (a) and = 0.10c (b), variation of drag coefficient with f.
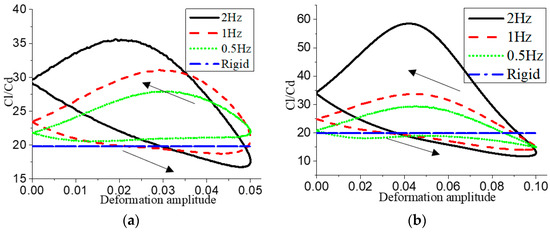
Figure 18.
When = 0.05c (a) and = 0.10c (b), variation of lift-drag coefficient with f.
It can be seen from Figure 16a that the flow hysteresis effect produced by the airfoil during active deformation is closely related to the response time of its suction surface flow field structure. With the increase of f, that is, the period time of airfoil deformation gradually shortens, its suction surface separation flow field structure cannot respond in time with the change of camber. Specifically, when f = 0.5 Hz, the lift coefficient starts to increase at 30% of the given deformation amplitude when the airfoil deforms. When f reaches 2 Hz, when the airfoil returns to the initial symmetric airfoil state and starts a new deformation period again, the lift coefficient increases only when the camber increases to 80% of the given deformation amplitude due to the existence of large separation bubbles at the trailing edge. Prior to this, the lift coefficient value is still slowly decreasing compared with the initial state.
Figure 19 shows the relationship between the unsteady aerodynamic parameters of the deformation frequency f = 0.5 Hz and the different deformation amplitudes of the airfoil. As the amplitude increases, the maximum lift coefficient of the airfoil gradually increases. During the initial deformation, the amplitude has no obvious influence on the lift coefficient value, but when the deformation amplitude reaches a larger value, its lifting capacity becomes more limited, and the lift coefficient curve presents a horizontal “eight-shape”. This is because when the airfoil deforms to the maximum deformation, its suction surface separation flow field structure has sufficient evolution time, resulting in large-sized separation bubbles at the trailing edge, and the airfoil lift coefficient value decreases with the recovery of camber at a smaller slope. Therefore, it can be seen in Figure 19 that the drag coefficient at = 0.10c increases sharply under the maximum deformation, and the numerical value increases twice as much as that of the rigid airfoil, while the lift-drag ratio is also lower than that of the rigid airfoil at the maximum deformation.
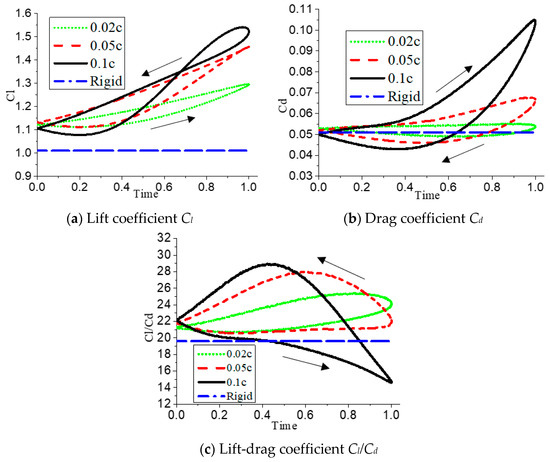
Figure 19.
When f = 0.5 Hz, variation of unsteady aerodynamic parameters with .
When Figure 20, Figure 21 and Figure 22 show the lift resistance coefficient increases significantly when f = 1 Hz and f = 2 Hz, respectively, as the deformation amplitude increases. When = 0.10c, the drag coefficient also reaches the maximum camber, which results in a significantly lower lift-to-drag ratio than the rigid airfoil here. While = 0.020c and = 0.05c, it maintains the same or even higher lift-to-drag ratio than the rigid airfoil during one cycle of airfoil deformation.
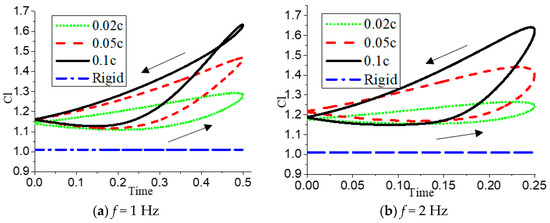
Figure 20.
When f = 1 Hz and f = 2 Hz, variation of lift coefficient with .
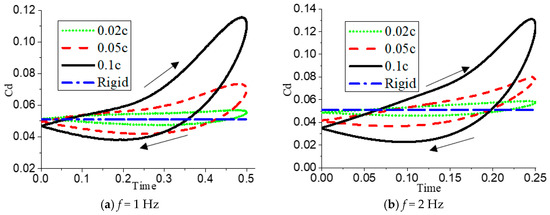
Figure 21.
When f = 1 Hz and f = 2 Hz, variation of drag coefficient with .
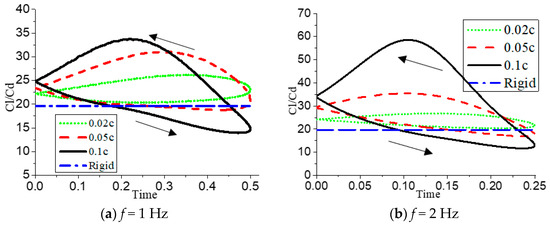
Figure 22.
When f = 1 Hz and f = 2 Hz, variation of lift-drag coefficient with .
4.3. Active Deformation Airfoil at 18° Angle of Attack
Figure 23 shows the relationship between unsteady aerodynamic parameters at different deformation frequencies f at an angle of attack α = 18° and a deformation amplitude = 0.020c. At the angle of attack of deep stall, the flow field of the rigid airfoil suction surface starts to separate from the position of the leading edge point and form a large-scale separation bubble covering over the suction surface, while the small vortex at the trailing edge of the airfoil continuously falls off downstream. At this deformation amplitude, it can also be seen that the lift coefficient of the airfoil in a deformed period fluctuates regularly with the shedding of the vortex on the upper airfoil surface. The value fluctuates basically around the time-average lift coefficient of the rigid airfoil and increases when reaching the maximum camber. On the whole, at this angle of attack, the smaller deformation amplitude is not enough to help the fluid to resist the reverse pressure gradient generated by the upper airfoil surface and to reduce the size of the separation bubble; thus, the aerodynamic performance in a period of active airfoil deformation is difficult to significantly improve.
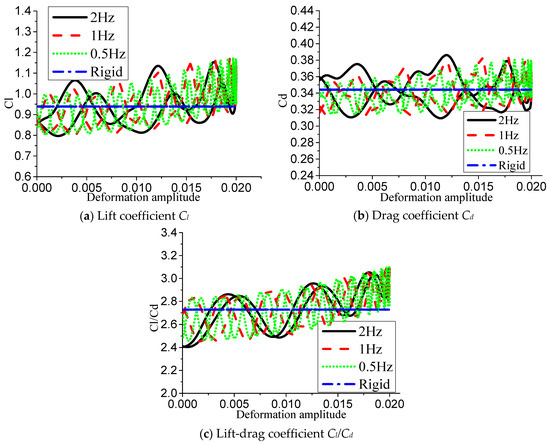
Figure 23.
When = 0.020c, variation of unsteady aerodynamic parameters with f.
As shown in Figure 24, different deformation frequencies f have no obvious influence on the variation interval of airfoil lift coefficient value, and the aerodynamic performance of the airfoil is effectively and stably improved in the deformation descending stage after the maximum camber. However, due to the difference of f, the lift coefficient of airfoils will suddenly drop at a certain moment of deformation. From Figure 24a, it can be seen that when f = 0.5 Hz, the lift coefficient of the airfoil plummets when the deformation goes down to 40% of the maximum deformation amplitude. When the frequency increases to 1 Hz, the plummeting phenomenon is postponed to 10% of the maximum deformation amplitude when the deformation goes down, while when the frequency f = 2 Hz, the deformation goes up to 40% of the maximum deformation amplitude. Similarly, this rule is also showed in Figure 24b, and due to the increase of , the interval for stable improvement of aerodynamic performance of airfoil during deformation downward is widened. As shown in Figure 25, the variation of drag coefficient is quite different from the previous working conditions. Under the attack angle of deep stall, the active deformation of airfoil can produce drag reduction effect in most areas. Under the conditions of = 0.05c and = 0.10c, the drag coefficient is almost lower than that of the rigid airfoil in the whole section when the airfoil deforms downward, and the drag reduction effect of inside reaches about 50% in the specific section under each f. Therefore, it can be seen from Figure 26 that the lift-drag ratio of the airfoil after active deformation is basically the same as that of the rigid airfoil when the airfoil is deformed upward, and the entire interval from the maximum deformation amplitude to the deformation downward to the initial state is significantly improved, which is the optimization effect brought by the increase of lift and the decrease of resistance at the same time.
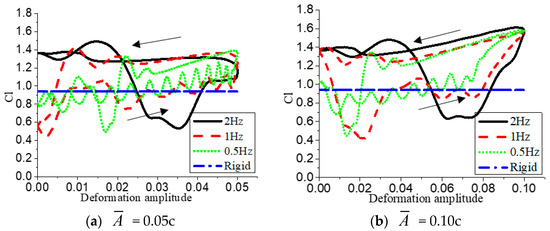
Figure 24.
When = 0.05c and = 0.10c, variation of lift coefficient with f.
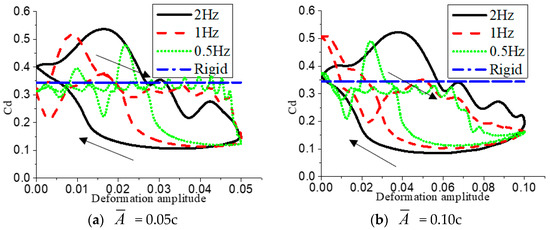
Figure 25.
When = 0.05c and = 0.10c, variation of drag coefficient with f.
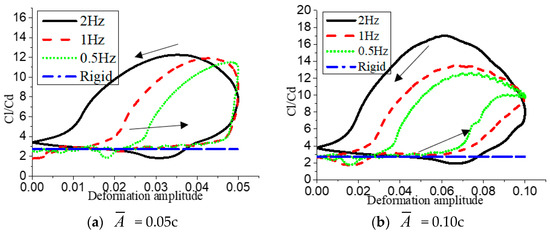
Figure 26.
When = 0.05c and = 0.10c, variation of lift-drag coefficient with f.
Figure 27, Figure 28, Figure 29, Figure 30, Figure 31 and Figure 32 show the instantaneous vorticity diagram, when the airfoil deformation amplitude is 0.05c; the deformation goes up to 0.020c, 0.035c, 0.5c, and the deformation goes down to 0.035c, 0.020c in the initial state at three different deformation frequencies. In order to facilitate the distinction, the bending value when the deformation descends is prefixed with a minus sign. As shown in Figure 27a, at the initial deformation of the airfoil with f = 2 Hz, the free shear layer separated from the front edge point of the wall starts to generate a medium-scale vortex structure rolling downstream, and the free shear layer on the blade leading edge surface is rolled up to form a small-scale vortex structure and develops downstream along the upper surface of the airfoil. At this time, the lift coefficient value of the airfoil can still be stably increased. In both papers [22,23,24], the internal physical mechanism of active vibration wall that enhances the anti-separation ability of the fluid on airfoil surface is discussed. When the airfoil deforms to Figure 28a, the lift coefficient starts to decrease when the free shear layer develops to the middle and rear sections of the airfoil. Comparing with Figure 24a, it can be seen that the lift coefficient value of the airfoil at the initial deformation has been significantly reduced when f = 1 Hz. At this time, it can be seen from Figure 27b that the counterclockwise free shear layer rolled up by the upper surface has developed to the middle and rear sections, and the airflow at the trailing edge has rolled up a large-sized secondary separation vortex from the lower surface.

Figure 27.
Instantaneous vorticity of airfoil at the beginning of the deformation with a different f.

Figure 28.
Instantaneous vorticity of airfoil deformed to 0.020c with a different f.

Figure 29.
= 0.05c, instantaneous vorticity of airfoil deformed to 0.035c with a different f.

Figure 30.
= 0.05c, instantaneous vorticity of airfoil deformed to 0.05c with a different f.

Figure 31.
= 0.05c, instantaneous vorticity of airfoil deformed to −0.035c with a different f.

Figure 32.
= 0.05c, instantaneous vorticity of airfoil deformed to −0.020c with a different f.
As shown in Figure 29 and Figure 32, when the airfoil reaches the maximum camber of deformation amplitude = 0.05c, the separation points of the airfoil at three different frequencies f coincide, and the size of the surface backflow region of the upper airfoil is similar. Thus, the lift coefficient increases to a similar degree. When the deformation descends, it can be seen that due to the difference of deformation frequency, the response time of the flow field structure of the upper surface shows obvious difference. When the airfoil deformation descends to 0.020c under the conditions of f = 2 Hz and 1 Hz, the scale of the main separation vortex of the upper surface still does not obviously increase, and the separation zone appears between the shear layers with different rotation degrees of the leading edge and the trailing edge. However, when f = 0.5 Hz, the flow field structure on the airfoil starts to deteriorate obviously, and the lift coefficient reaches the valley state.
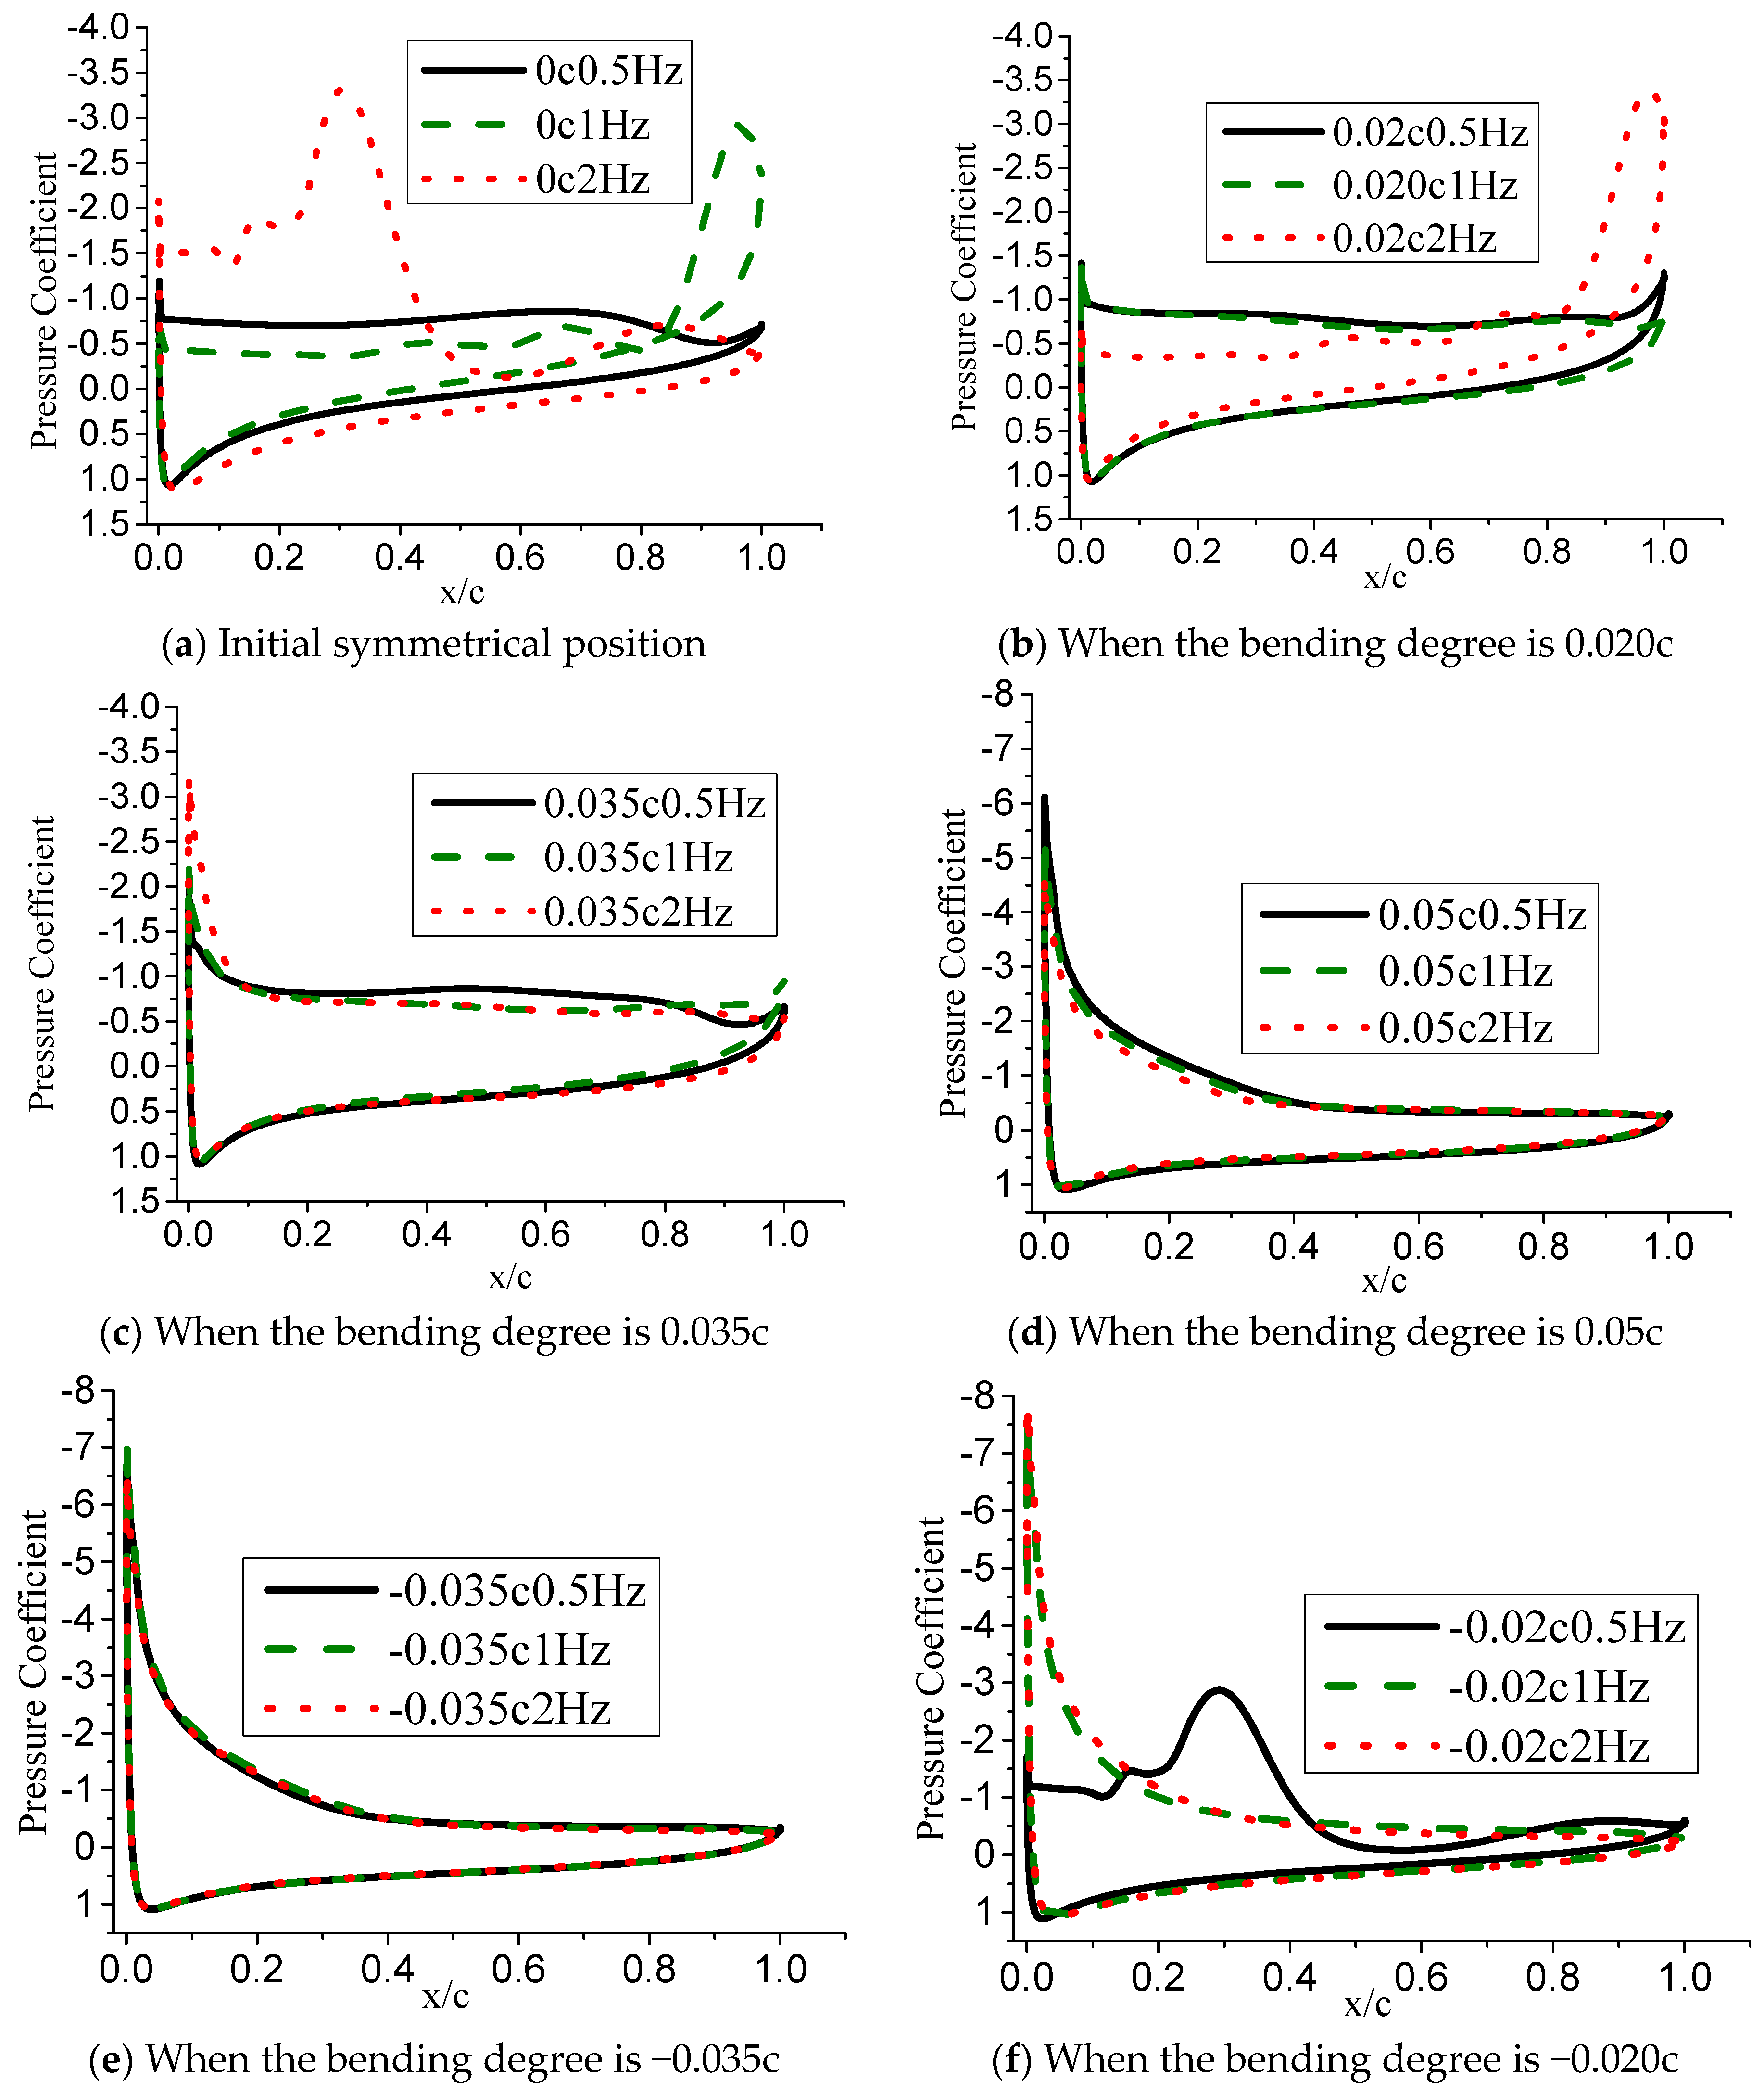
Figure 33 shows a comparison of the surface pressure coefficients when the airfoil is deformed to different cambers at different frequencies f when the airfoil deformation amplitude is = 0.05c. As shown in Figure 33a, when f = 2 Hz, the pressure coefficient pulsation appears on the upper surface of the airfoil, reaching the peak value of the pressure difference between the upper and lower surfaces at 0.3 times chord length. At this time, the area enclosed by the pressure coefficient curve is larger than that enclosed by other deformation frequencies, and the corresponding lift coefficient value is the largest. When f = 1 Hz, a large-scale separation vortex structure is generated at the trailing edge of the airfoil and then falls off, thus, the pressure coefficient pulsation occurs near the trailing edge, and the rest changes little. The curve surrounded by the pressure coefficient is reduced, and the lift coefficient is in the valley corresponding to Figure 24a. In Figure 33b, when f = 2 Hz, since the airflow on the lower surface of the airfoil rolls up the secondary separation vortex from the upper side, the pulsation also occurs at the trailing edge, and the airfoil lift coefficient value starts to decrease. As shown in Figure 33f, when the airfoil f = 0.5 Hz is deformed down to 0.02 c, pressure pulsation occurs on the upper surface, and the airfoil lift coefficient suddenly drops at this stage.
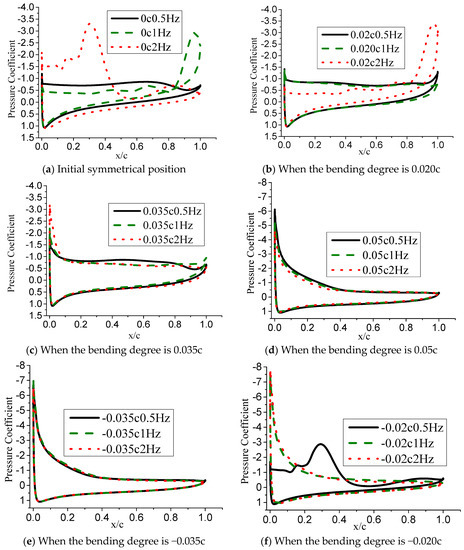
Figure 33.
When = 0.05c, pressure coefficient distribution diagram when airfoil deforms to different cambers at different frequencies f.
Figure 34 shows the relationship between unsteady aerodynamic parameters of airfoil under different deformation amplitudes at deformation frequency f = 0.5 Hz. It can be seen that the maximum lift coefficient value still increases with the increase of the deformation amplitude, and the lift coefficient of the upward stage of the airfoil deformation exhibits periodic fluctuation due to the separation of the separation bubble. For = 0.05c, when the airfoil deforms to the maximum camber, the flow field changes, and the flow starts to move backward from the separation point of the leading edge in the large separation state, and then gradually stabilizes. At this time, the lift coefficient value of the airfoil is improved. When = 0.10c, because the maximum camber value increases, the vortex region of the airfoil suction surface is suppressed faster, so the lift coefficient starts to increase earlier. Under these two deformation amplitudes, the lift coefficient values begin to plummet after two unstable peaks appear when the deformation descends, and the larger the value of is, the closer the plummet point is to the termination point of a deformation period. In addition, as can be seen in Figure 34b, the sharp drop point of the lift coefficient value is accompanied by the occurrence of the peak of the drag coefficient. Due to the small deformation frequency, the flow field of the airfoil suction surface has sufficient response time, and the airfoil lift-to-drag ratio is limited in a range in which the deformation period can be improved.
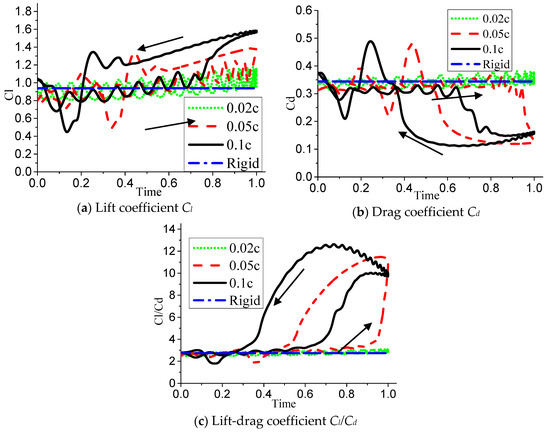
Figure 34.
When f = 0.5 Hz, variation of unsteady aerodynamic parameters with .
Figure 35, Figure 36 and Figure 37 show the unsteady aerodynamic parameters of different deformation amplitudes when the airfoil deformation frequency f = 1 Hz and 2 Hz. When f = 1 Hz, the variation law of the lift coefficient is basically similar to that at 0.5 Hz. Along with the increase in frequency, the airfoil sudden drop point continues to approach the end point of the downward deformation. When = 0.10c, the sharp drop point appears at the starting point of active airfoil deformation. As the frequency f continues to increase to 2 Hz, the airfoil can be stably lifted in the entire downward deformation interval, and the large-scale separation bubble of suction surface in this interval is effectively suppressed. At this time, the flow field has obvious hysteresis phenomenon, and the sharp drop point of lift coefficient does not appear until the airfoil is deformed upward. The drag coefficient is still accompanied by a sudden drop in the lift coefficient, which produces a peak of the drag coefficient. As the lift-to-drag ratio increases by , the range that can be increased is greater, and the lifting effect is more significant.
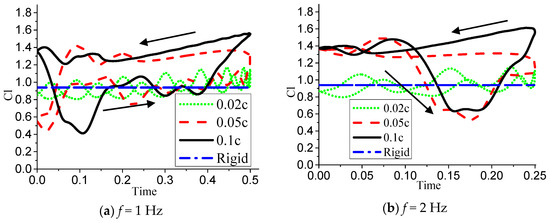
Figure 35.
When f = 1 Hz and f = 2 Hz, variation of lift coefficient with .
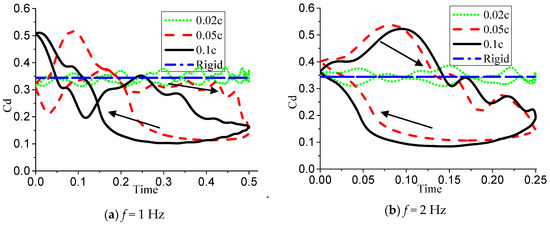
Figure 36.
When f = 1 Hz and f = 2 Hz, variation of drag coefficient with .
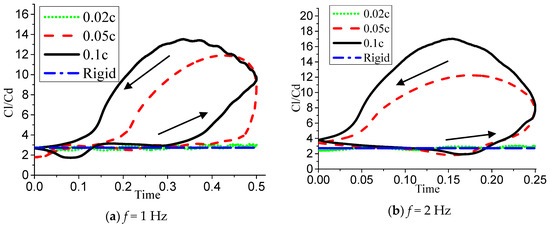
Figure 37.
When f = 1 Hz and f = 2 Hz, variation of lift-drag coefficient with .
5. Conclusions
In this paper, the unsteady aerodynamic performance of an airfoil with constant thickness and active deformation was studied numerically. The effects of two control parameters, deformation frequency and deformation amplitude, on the flow control effect of the airfoil with different stall angles of attack are discussed, and the conclusions are summarized as follows:
- Before stall angle of attack (α = 10°), the value of lift coefficient is not sensitive to the variation of deformation frequency, and the value of the maximum lift coefficient in one period rises with the increase of deformation amplitude. Before the stall angle of attack, due to the growing of the airfoil camber, there appear different long separation bubbles at the trailing edge with varying deformation amplitudes, resulting in a sharp increase of the drag coefficient of the airfoil, and finally, the lift drag ratio of the airfoil is lower than that of the rigid airfoil in a wide range.
- At a light stall angle of attack (α = 14°), the lift-drag ratio has a stable increase compared with that of the rigid airfoil at a suitable deformation amplitude, which makes the aerodynamic performance better in a deformation period.
- At a deep stall angle of attack (α = 18°), the active deformation of the airfoil significantly improves the flow field of the suction surface of the airfoil, and the drag coefficient of the airfoil is greatly reduced, which makes the lift-drag ratio of the airfoil increase greatly in one period. However, the effect of the lift-drag ratio is extremely limited under the small deformation amplitude.
In a word, before and after the stall angle of attack, the aerodynamic performance of the deformed airfoil presents a more obvious law of variation. The results can be used to guide the design of vertical axis wind turbine, that is to say, in the phase angle specified by the vertical axis wind turbine, the blades can be deformed to different degrees to optimize its aerodynamic performance. In addition, the idea of a deformable blade proposed in this paper does not need to be limited to wind turbines, but can be used in other forms of energy acquisition or propulsion involving airfoil. For example, this idea can be used in the research of energy acquisition or propulsion of flapping foil, which will also be the work we are about to progress in the future.
Author Contributions
Formal analysis, writing–original draft, software and visualization, H.T.; resources, J.F.; formal analysis and visualization, J.G.; conceptualization, project administration, supervision and funding acquisition, Y.W.; writing–review & editing, K.L.
Acknowledgments
This work was funded by the National Natural Science Foundation of China, grant number 51406117, Shanghai Rising-Star Program, and Shanghai Science and Technology Development Foundation, grant number 19QC1400300.
Conflicts of Interest
The authors declare no conflicts of interest.
References
- Li, Y. The vertical axis wind turbine technology lecture I—The vertical axis wind turbine and its development situation. Renew. Energy Sources 2009, 27, 121–123. (In Chinese) [Google Scholar]
- Qu, J.J.; Mei, Y.; Xu, M.W. Optimal design on airfoil of vertical axis wind turbine based on complex optimum method. Renew. Energy Sources 2011, 3, 132–136. (In Chinese) [Google Scholar]
- Ferreira, C.S.; Geurts, B. Aerofoil optimization for vertical-axis wind turbines. Wind Energy 2015, 18, 1371–1385. [Google Scholar] [CrossRef]
- Danao, L.A.; Edwards, J.; Eboibi, O.; Howell, R. A numerical investigation into the influence of unsteady wind on theperformance and aerodynamics of a vertical axis wind turbine. Appl. Energy 2014, 116, 111–124. [Google Scholar] [CrossRef]
- Bouzaher, M.T.; Hadid, M. Numerical Investigation of a Vertical Axis Tidal Turbine with Deforming Blades. Arab. J. Sci. Eng. 2017, 42, 2167–2178. [Google Scholar] [CrossRef]
- Bouzaher, M.T.; Hadid, M.; Semcheddine, D. Flow control for the vertical axis wind turbine by means of flapping flexible foils. J. Braz. Soc. Mech. Sci. Eng. 2016, 39, 1–14. [Google Scholar] [CrossRef]
- Kota, S.; Ervin, G.; Osborn, R. Design and fabrication of and adaptive leading edge rotor blade. In Proceedings of the American Helicopter Sociey 64th Annual Form, Montreal, QC, Canada, 29 April–1 May 2008. [Google Scholar]
- Monner, H.P.; Kintscher, M.; Lorkowski, T. Design of a Smart Droop Nose as Leading Edge High Lift System for Transportation Aircraft. In Proceedings of the 50th AIAA/ASME/ASCE/AHS/ASC Structures, Structural Dynamics, and Materials Conference, Palm Springs, CA, USA, 4–7 May 2009. [Google Scholar]
- Bilgen, O.; Kochersberger, K.B.; Inman, D.J. Novel, Bi-Directional, Variable Camber Airfoil via Macro-Fiber Composite Actuators. J. Aircr. 2010, 47, 303–314. [Google Scholar] [CrossRef]
- Wildschek, A.; Judas, M.; Aversa, N.; Grünewald, M.; Maier, R.; Steigenberger, N.D.J. Multi-Functional Morphing Trailing Edge for Control of All-Composite, All-Electric Flying Wing Aircraft. In Proceedings of the 26th Congress of ICAS and 8th AIAA ATIO, Anchorage, AK, USA, 14–19 September 2008. [Google Scholar]
- Yokozeki, T.; Sugiura, A.; Hirano, Y. Development and Wind Tunnel Test of Variable Camber Morphing Wing. Front. For. China 2013, 2, 329–334. [Google Scholar]
- Hao, N. Experimental Study of Unsteady Aerodynamic Characteristics of Variable Camber Wing at Low Reynolds Number. J. Exp. Mech. 2014, 29. [Google Scholar] [CrossRef]
- Liu, L.; Ang, H. Analysis on the aerodynamic characteristics of continuous variable camber morphing airfoils of leading and trailing edge. Flight Dyn. 2017, 40, 43–53. [Google Scholar]
- Qian, C.; Peng, B.; Ying, W.-L.; Leng, J.-S. Analysis on the aerodynamic characteristics of variable camber airfoils with continuous smooth morphing trailing edge. Acta Aerodyn. Sin. 2010, 28, 46–53. [Google Scholar]
- Yang, W.; Wang, H.; Jian, T.; Yang, J. Characterization of the Flow Separation of a Variable Camber Airfoil. Image Technol. 2018, 29, 44701–44704. [Google Scholar] [CrossRef]
- Nie, R.; Qiu, J.; Ji, H.; Li, D. Aerodynamic Characteristics Optimization of Active Compliant Trailing Edge. J. Eng. Thermophys. 2019, 40, 70–78. (In Chinese) [Google Scholar]
- Miller, E.J.; Cruz, J.; Lung, S.F.; Kota, S.; Ervin, G.; Flick, L.P. Evaluation of the Hinge Moment and Normal Force Aerodynamic Loads from a Seamless Adaptive Compliant Trailing Edge Flap in Flight. In Proceedings of the 54th AIAA Aerospace Sciences Meeting, San Diego, CA, USA, 4–8 January 2016. [Google Scholar]
- Wang, Y.; Tong, H.; Si, M.; Wang, J.; Sun, J.; Huang, D. Experimental study on aerodynamic performance of deformable blade for vertical axis wind turbine. Energy 2019, 181, 187–201. [Google Scholar] [CrossRef]
- Hansman, R.J.; Craig, A.P. Low Reynolds number tests of NACA 64-210, NACA 0012, and Wortmann FX67-K170 airfoils in rain. J. Aircr. 1987, 24, 559–566. [Google Scholar] [CrossRef]
- Lee, T.; Gerontakos, P. Investigation of Flow Over an Oscillating Airfoil. J. Fluid Mech. 2004, 512, 313–341. [Google Scholar] [CrossRef]
- Li, D. Effects of Average Attack Angle and Amplitude on Aerodynamic Performance of an Oscillating Airfoil. J. Propuls. Technol. 2014. [Google Scholar] [CrossRef]
- Di, G.; Wu, Z.; Huang, D. The research on active flow control method with vibration diaphragm on a NACA0012 airfoil at different stalled angles of attack. Aerosp. Sci. Technol. 2017, 69, 76–86. [Google Scholar] [CrossRef]
- Dong, H.; Wang, C.; Li, S. Numerical Research on Segmented Flexible Airfoils Considering Fluid-structure Interaction. Procedia Eng. 2015, 99, 57–66. [Google Scholar]
- Kang, W.; Lei, P.; Zhang, J. Effects of local oscillation of airfoil surface on lift enhancement at low Reynolds number. J. Fluids Struct. 2015, 57, 49–65. [Google Scholar] [CrossRef]
© 2019 by the authors. Licensee MDPI, Basel, Switzerland. This article is an open access article distributed under the terms and conditions of the Creative Commons Attribution (CC BY) license (http://creativecommons.org/licenses/by/4.0/).

