Article

The Influence of Micro-Fractures on the Flow in Tight Oil Reservoirs Based on Pore-Network Models

1
Research Centre of Multiphase Flow in Porous Media, School of Petroleum Engineering, China University of Petroleum (East China), Qingdao 266580, China
2
Department of Mechanical and Process Engineering, ETH Zurich, 8092 Zurich, Switzerland
*
Author to whom correspondence should be addressed.
Energies 2019, 12(21), 4104; https://doi.org/10.3390/en12214104
Submission received: 11 September 2019 / Revised: 20 October 2019 / Accepted: 23 October 2019 / Published: 28 October 2019

Abstract

:
In this paper, the influence of micro-fractures on the flow of tight reservoirs is studied on the microscopic scale. Three-dimensional digital cores of fractured tight sandstone with varying fracture apertures, lengths, and dip angles are constructed using computed tomography (CT) scans. Pore-network models are built using the three-dimensional digital cores to simulate the flow in tight oil reservoirs. The effects of the micro-fracture aperture, length and dip angle on the pore-throat structure, single-phase flow, and two-phase flow for fracture surfaces with/without roughness are studied. The study demonstrates different influences of micro-fracture characteristics on the flow, and the fracture aperture has the most critical effect. Meanwhile, the roughness of the micro-fracture makes a difference in addition to the three factors of micro-fractures. This paper provides a theoretical basis for the effective development of tight sandstone reservoirs.

Graphical Abstract

1. Introduction

Tight oil is an unconventional oil and gas resource that is widely distributed around the world [1]. In the past few decades, tight reservoirs have investigated extensively as the focus of the oil industry [2]. Compared with conventional reservoirs, tight oil reservoirs are characterized by more heterogeneous matrix, more complicated pore structures, much lower porosity and permeability [3,4]. Thus, conventional flow mathematics models based on Darcy’s law are no longer valid [5,6]. The microscopic pore structure of a tight reservoir determines its macroscopic properties and flow law and it has typical multi-scale characteristics [7]. The pore structure consists of abundant micro-fractures which have sizes range from nanometer to micrometer [8]. Due to geological effects such as mineral filling and diagenesis, surfaces of micro-fractures in tight reservoirs are normally rough [9]. The micro-fracture forms the main flow channel in tight reservoirs [10,11], which plays an important role in the flow. However, the flow mechanism with the combination of pores and micro-fractures is still unclear [12]. This paper reported on the influence of the variation of the apertures, lengths and dip angles of micro-fractures on a few critical physical characteristics of tight reservoirs. Microscopic flows have been simulated using pore-network models of the tight reservoirs with/without surface roughness [13]. This paper provides a theoretical basis for advanced studies and development of tight sandstone reservoirs.
For macroscopic fractures, Xiaomin et al. [14] revealed the flow law of the fractured-vuggy reservoir through laboratory experiments. Zhao et al. [15] investigated the influences of surface roughness of individual fractures on macroscopic fluid flow and solute transport in complex fracture networks using a discrete element method (DEM). Luo et al. [16] numerically investigated the role of fracture roughness distribution in macroscopic fracture flow based on the empirical relationships of mechanical-hydraulic apertures and the estimated distributions of fracture surface roughness. The apertures of macroscopic fractures are much larger than those of general pores, so that the capillary pressure can be neglected, and the irreducible water and residual oil saturation are much lower. The water-flooding process is approximately classical piston displacement, which follows Darcy’s law.
For micro-fractures, J.M. Perez et al. [10] studied the role of micro-fractures in low-permeability reservoirs. Wu et al. [17] proposed a model for gas transport in micro-fractures of shale and tight gas reservoirs. Yang et al. [18] did flow simulation of artificially induced microfractures based on digital rock and Lattice Boltzmann methods, and established the relationships between permeability and fracture parameters. Due to small apertures, large effect of roughness, unneglectable capillary pressure, and sensitive stress, the flow is much complicated without following Darcy’s law. Currently, the flow mechanism of the combination of pores and micro-fractures is still unclear, and the study of micro-fractures considering roughness is rare.
In this paper, the micro-scale flow mechanism is studied using the method of micro-flow simulation, which is based on digital cores and pore-network models. The specific research steps [19,20] are as follows. Firstly, based on computed tomography (CT) scan images, the three-dimensional digital core of a rock sample is constructed and optimized using a numerical algorithm. Then, an equivalent three-dimensional pore-network model is built with the principle of flow similarity and geometric similarity of the microscopic flow. Finally, the pore-network model is used to study characteristics of the core structure, such as geometrical and topological features. In addition, the microscopic flow study is investigated by the flow simulation in porous media.

2. Materials and Methods

2.1. Matrix-Microfracture Digital Core Creation for Tight Reservoirs

2.1.1. Digital Core Construction Based on Computed Tomography (CT) Scans

In this paper, CT scans are used to create digital cores. Using CT scans to create a digital core consists of the following three steps [21,22]: (1) preparation of the rock sample, and CT scans to obtain projection data; (2) reconstruction of a core gray image based on the projection data; (3) construction of the digital core by isolating pore space and core skeleton in the gray image using binary image segmentation algorithms.

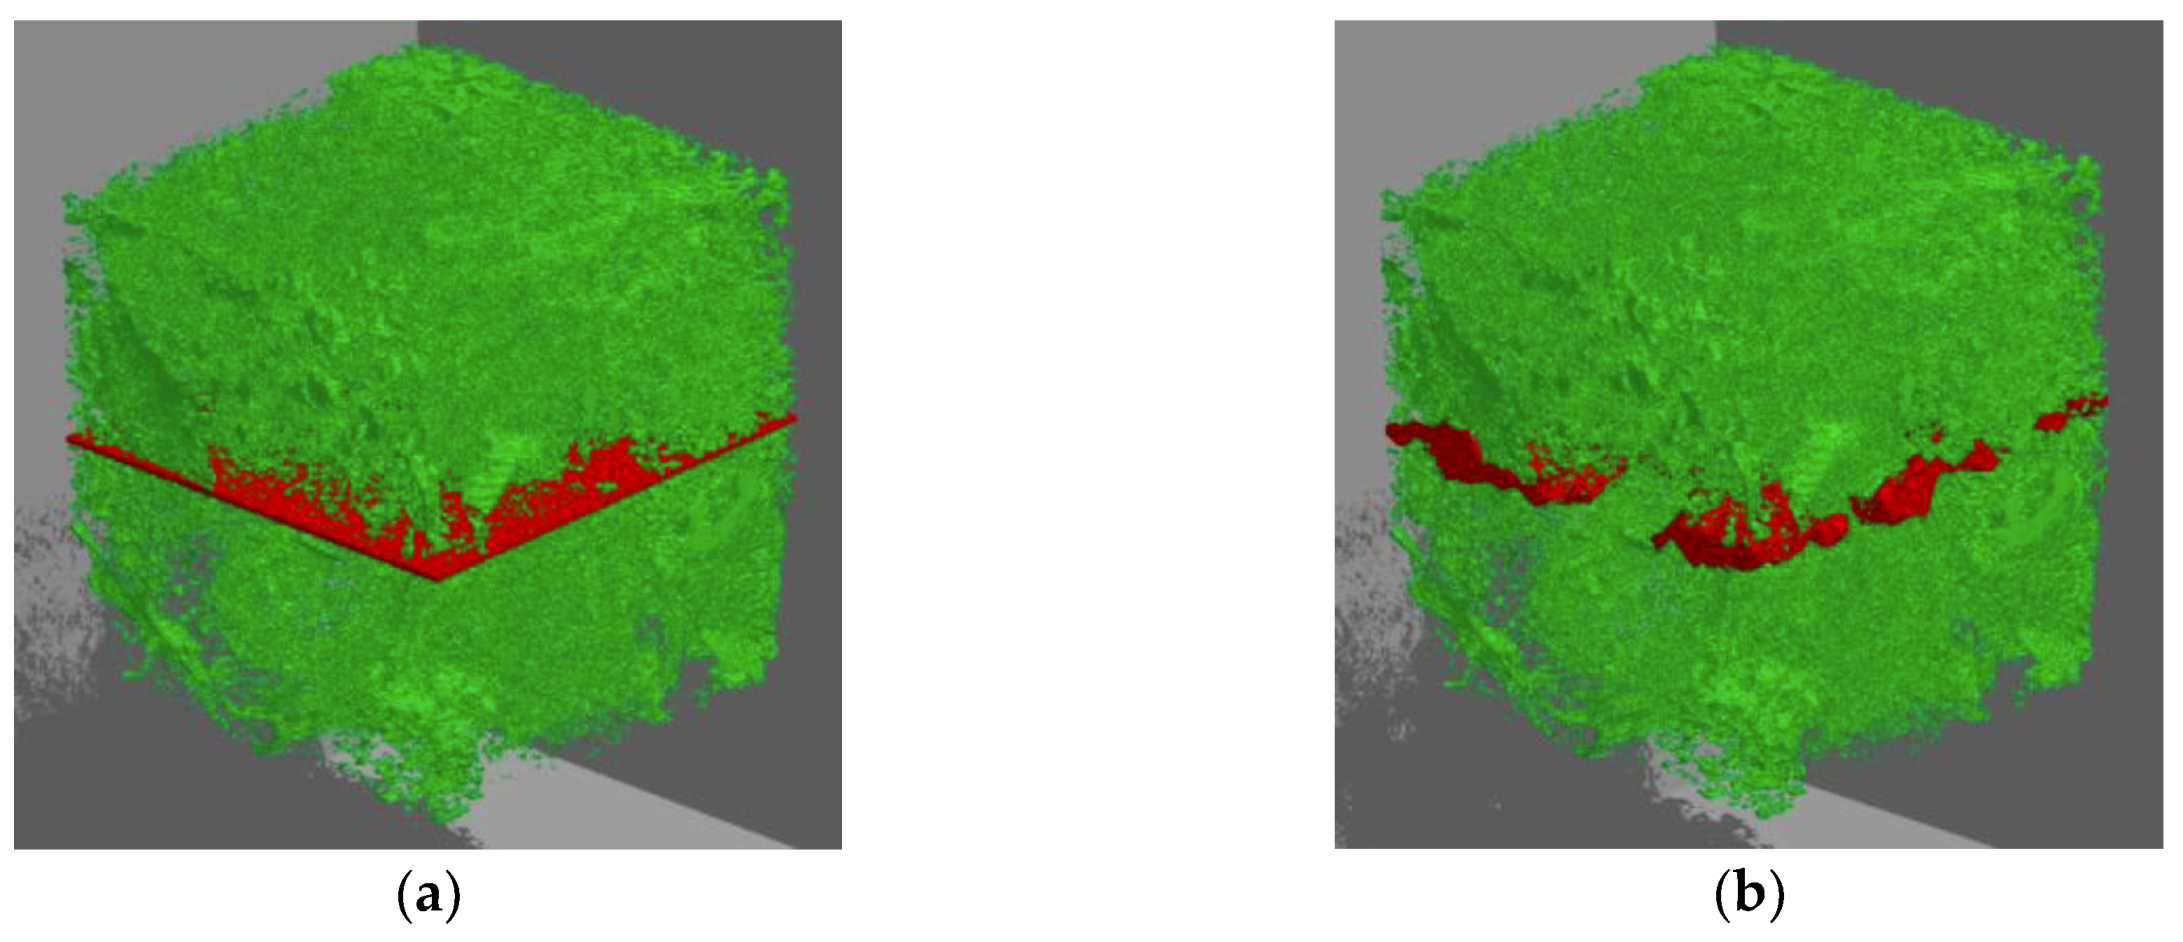
2.1.2. Micro-Fracture Digital Core Construction with/without Roughness

In this study, each digital core is constructed with a micro-fracture with roughness and without roughness. The morphology of a rough surface has a critical influence on many transport physical mechanisms such as the flow resistance of fluid along rough surfaces [23]. Therefore, in order to simulate the matrix micro-fracture system of tight reservoirs accurately, the rough surface must be characterized and used for the digital core construction.
The roughness of a rough surface is considered random and the distribution is disordered. There are two parameters to characterize a rough surface, fractal dimension [24] and scale coefficient [25]. The fractal dimension Df is the magnitude change of surface topography, which represents microscopic complexity of the surface profile. The larger the fractal dimension Df is, more irregular structures with higher complexity on the surface profile. The scale coefficient G is the magnitude of the contour amplitude, which reflects the flatness of the surface.
There are many methods to characterize rough surfaces. One method [26] is to evaluate the rough surface based on its approximate fractal dimension, which is typically between 2 and 3. A surface with the fractal dimension of 2 is a smooth surface; Df of 2.5 indicates a rather rough surface; Df close to 3 indicates that the surface is close to a three-dimensional model. Fractal dimension is an approximation, but we need to note that real surfaces are not fractal in nature over more than a few orders of magnitude of scale. This is because the actual surface size is constant and some new microstructure behavior appears as the surface expands. Therefore, another method [27] is used in this study to characterize rough surfaces, using trigonometric functions similar to the Fourier series expansion, each of which is related to the frequency of a certain spatial oscillation.
The trigonometric function depending on the frequency f of oscillation over time is given by:
cos ( 2 π f t )
Similarly, the oscillation in the space is featured by a corresponding spatial frequency. By replacing the time variable t with the spatial variable x and replacing the time frequency f with the spatial frequency v, the trigonometric function in shown in the following Equation (2).
cos ( 2 π ν x )
As there is more than one dimension of the space, multiple spatial frequencies defined in Cartesian coordinates are used, as shown in Equation (3).
cos ( 2 π ( ν x x + ν y y ) )
Only a discrete set of spatial frequencies are used to simplify simulation:
ν x = m , ν y = n
where m and n are integers.
Thus, a surface consisting of elementary waves can be represented by Equation (5):
cos ( 2 π ( m x + n y ) + ϕ )
Each elementary wave has its amplitude. The simplest way to determine the amplitude is to use coefficients Amn from the Gaussian distribution. However, it is more likely that slow oscillations have larger amplitude than fast ones. For the discrete assumption, the amplitude should be gradually reduced as the spatial frequency increases, as shown in the following Equation (6):
A m n = a ( m , n ) h ( m , n ) = 1 | m 2 + n 2 | β = 1 ( m 2 + n 2 ) β 2
where m and n are spatial frequencies; the spectral exponent β indicates how fast the higher frequency is attenuated.
The spectral exponent is related to the fractal dimension of a surface, but only for infinite series covering high frequencies and a certain exponential range. Therefore, as shown by the Equation (7), the amplitude of roughness surface is obtained by using a finite frequency and multiplied by a random function with a Gaussian distribution:
a ( m , n ) = g ( m , n ) h ( m , n )
The phase angle is a random function of spatial frequency shown as Equation (8):
ϕ ( m , n ) = u ( m , n )
Then a rough surface is given by Equation (9):
f ( x , y ) = m = M M n = N N a ( m , n ) cos ( 2 π ( m x + n y ) + ϕ ( m , n ) )
where x and y are spatial coordinates; m and n are spatial frequencies; a ( m , n ) is the amplitude; and ϕ ( m , n ) is the phase angle.
Using the modeling method of rough surfaces above, digital cores with different surface roughness are shown in Figure 1.

2.2. Matrix-Microfracture Pore-Network Model Building for Tight Reservoirs

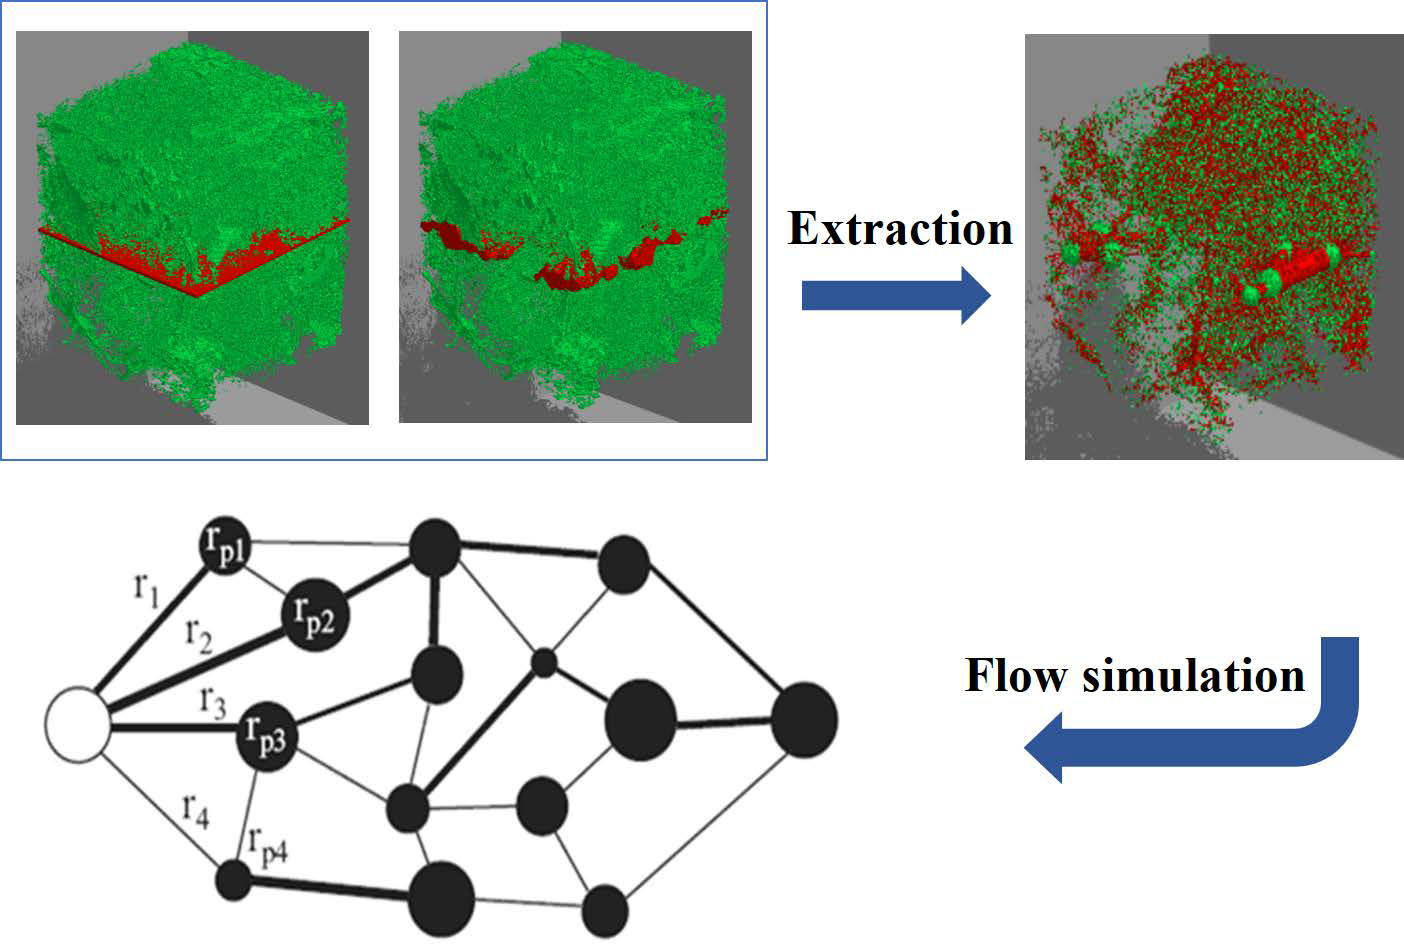
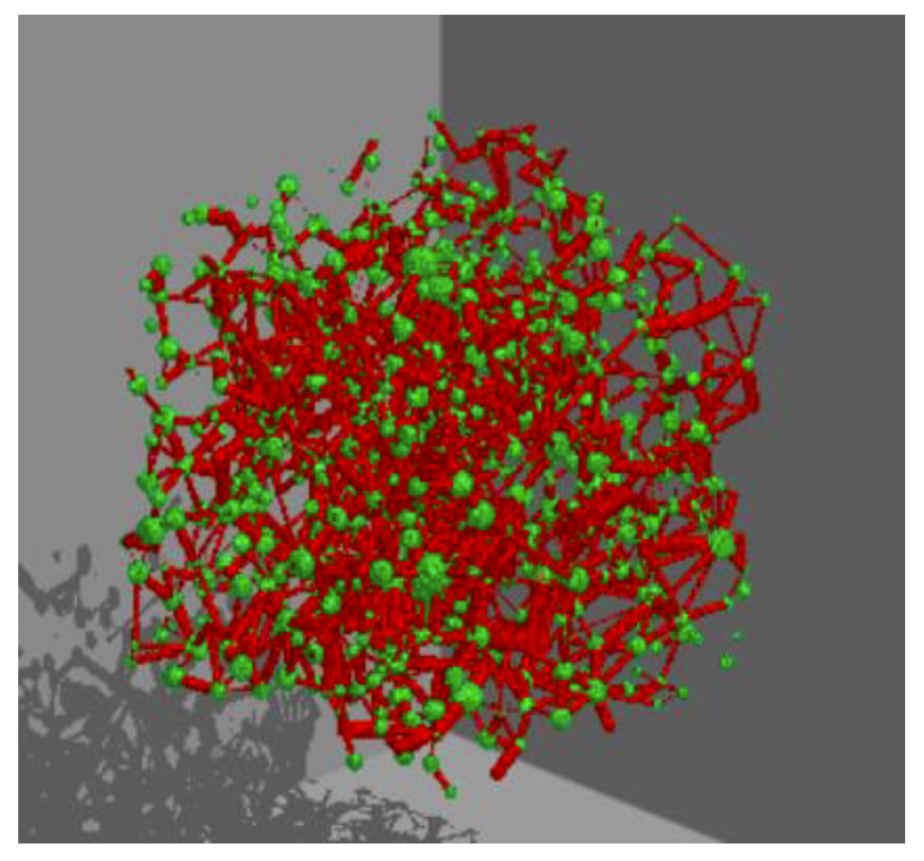
2.2.1. Extraction of Pore-Network Models

In this paper, the maximal inscribed sphere method [28] is used to extract the pore-network model. Select a point in the pore pixel of the three-dimensional digital core, and then create a sphere with the point as the center, and enlarge the sphere radius until the surface of the sphere touches the nearest rock skeleton. The collection of all the pixels in the spherical region is called the largest sphere. The determination of the pores in the pore-network model is to find the local maximum sphere in a string is considered as a pore, while the smallest sphere between the two largest spheres in a string is classified as a throat. Eventually the entire string structure is simplified to a pore-network model with pores and throats.

2.2.2. Structural Features of Pore-Network Models

Structural feature distribution [29] of a pore-network model is mainly divided into two categories. One is geometric structure feature distribution, which is used to describe geometric size and shape distribution of the pore-throat unit in the pore-network model. A few parameters are used to evaluate the geometric structure feature distribution: number, radius, length, shape factor of pores and throats, etc. The other type is topological structure distribution, which represents the degree of interconnection between pores and throats in the pore-network model. It is characterized by coordination number and network connectivity function.

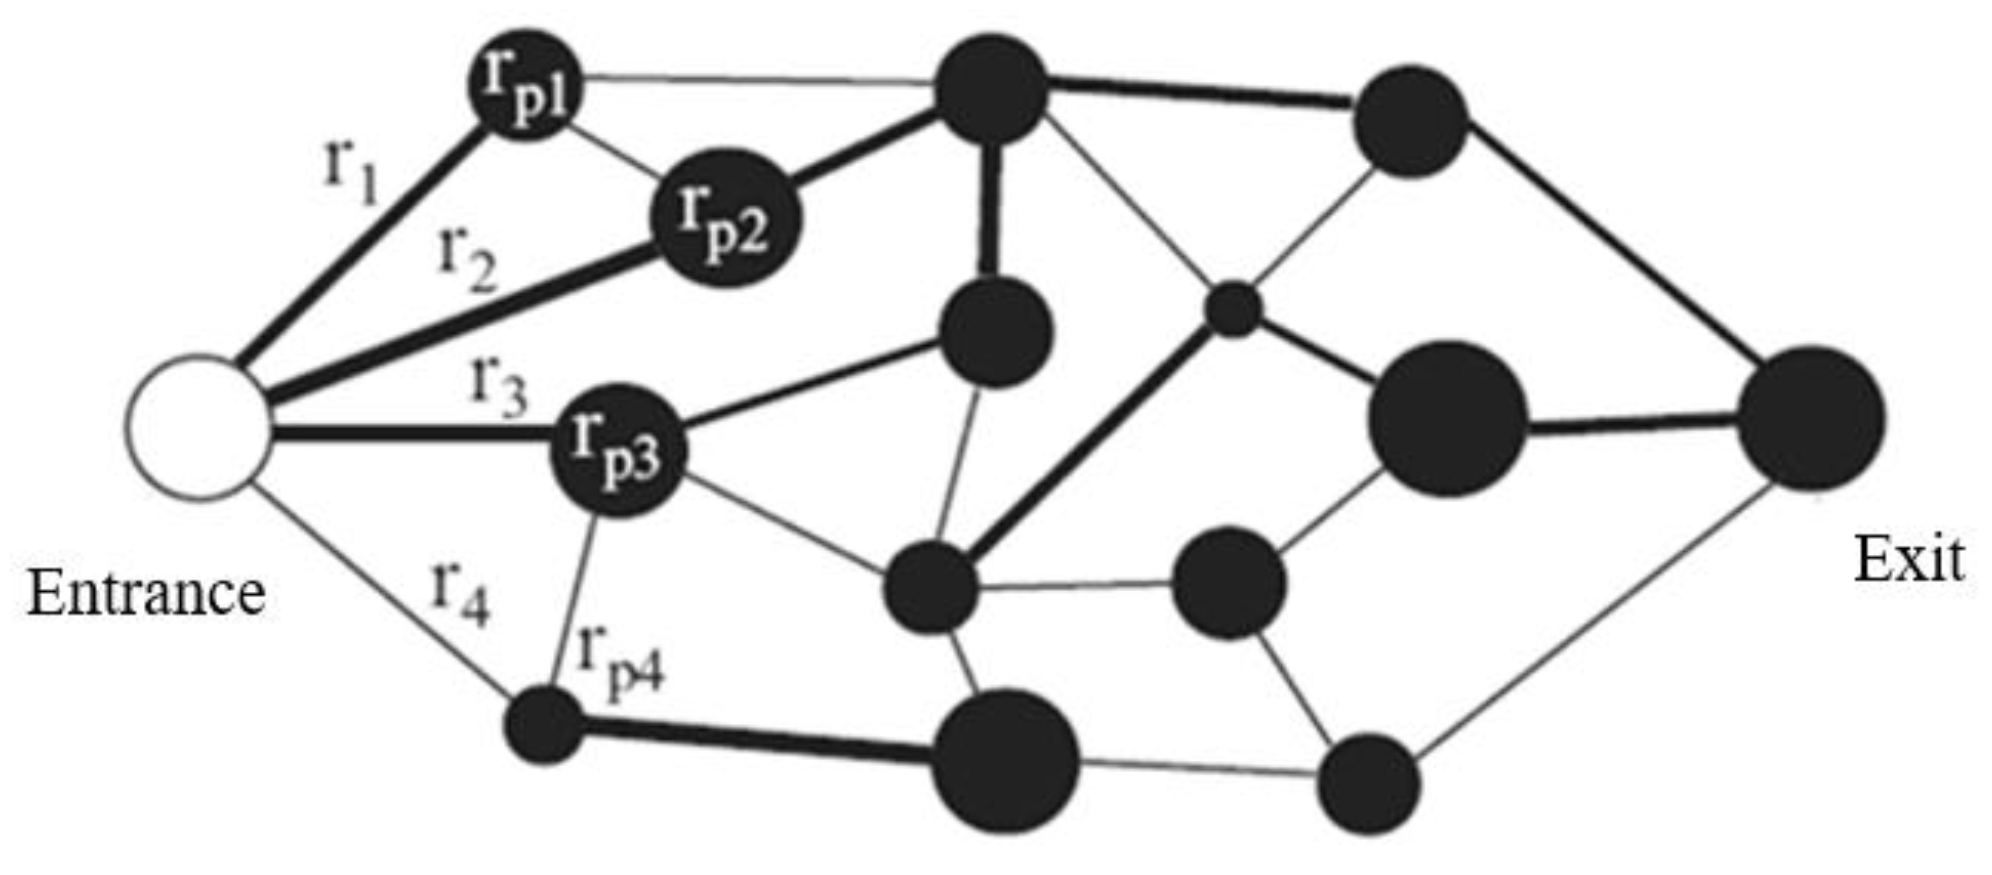
2.2.3. Flow Simulation of Pore-Network Models

We can consider the extracted pore-network model as a quasi-steady state model, that is, the capillary force completely controls the fluid flow [30]. Compared to the capillary pressure, the pressure drop caused by viscous force can be ignored in the model. The flow of fluid from one pore to the other is instantaneous, regardless of the flow process in pores and throats. The fluid flowing in the model is an incompressible Newtonian fluid. According to the pore-network model shown in Figure 2, the displacement and imbibition can be simulated.
During the displacement process, the pressure at the outlet is kept constant, while the displacement phase pressure at the inlet is gradually increased. For each additional pressure, the capillary inlet pressure (valve pressure) of the throats r1, r2, r3, r4 connected to the pores at the inlet is calculated and sorted in the ascending order. When the displacement phase pressure is larger than the valve pressure of a particular throat, then the displacement phase immediately passes through the throat into the next pore [31]. In the end, the predetermined saturation is reached or all pores are displaced. At each pressure step, the parameters can be calculated, such as the absolute and relative permeability.
The calculation of transport properties is performed on a selected central region of the pore-network in order to minimize boundary effects [32]. When the network is fully saturated with one-phase fluid p, we set a constant pressure drop across the network, and calculate the flow rate Q and the pressure drop Δ P across the selected region. The absolute permeability Kpabs is determined as:
K p a b s = Q μ p L A Δ P
where A is the cross-sectional area of the selected region, μ is the viscosity of the fluid p, and L is the length of the region.
When the network is saturated with two-phase fluid, the average pressure drop in the non-wetting and wetting fluids at different stages of the displacement across the calculation region is calculated. The water saturation Sw and the total flow rates of non-wetting and wetting fluids across the calculation region are also calculated. The relative permeability of fluid p is given by:
K r , p ( S w ) = K p K p a b s

2.2.4. Validation of the Simulation Method by Network

In this paper, we took a digital core with a size of 400 × 400 × 400 (pixels), with a resolution of 1.0792 μm/pixel. Accuracy and feasibility of the simulation by the pore-network model should be verified. In order to improve the verification efficiency, we extract several digital cores with the same sizes of 100 × 100 × 100 (pixels) from it, and use two methods for flow simulation respectively.
One method is to simulate with the digital core directly, as shown in Figure 3. We use the semi-implicit method for pressure-linked equations (SIMPLE) algorithm [33] to calculate the velocity field on the 3D finite volume open-source platform OpenFOAM® (version 6, OpenFOAM Foundation Ltd., London, United Kingdom) and calculate the absolute permeability. Because the fluid is regarded as an incompressible Newtonian fluid, the continuity and momentum equation [34,35,36,37] are as shown in Equations (12) and (13) respectively. The solver employs the SIMPLE algorithm to solve the equations.
u = 0
ρ [ u t + ( u ) u ] = p + μ 2 u
where u is the flow velocity, p is the pressure, μ is the flow viscosity.
The other method is to simulate the fluid flow after extraction of the network model of the digital core. As a result, the absolute permeability can be obtained as shown in Figure 4.
For each digital core, the permeability calculated by the two methods are compared to be approximately equal as shown in Table 1. Thus, the accuracy and feasibility of the simulation using pore-network models are demonstrated.

3. Results and Discussion

In order to investigate the effects of micro-fractures on the flow of tight reservoirs, digital cores and pore-network models with varying characteristics of micro-fractures are built. In this paper, three critical characteristics are studied, including the aperture, length and dip angle of micro-fractures. For each parameter, digital cores and pore-network models of micro-fractures with and without rough surface are created for simulation.
Figure 5 shows digital cores of tight sandstones built with a micro-fracture with the apertures of 1 μm, 2 μm, 3 μm, 5 μm, 10 μm, 30 μm or 50 μm. The fractures are not conductive in the Z direction but penetrate in the X and Y directions. Corresponding pore-network models of tight sandstones are constructed, as shown in Figure 6.
Similarly, digital cores and pore-network models with a micro-fracture with the length of 50 μm, 100 μm, 150 μm, 200 μm, 250 μm, 300 μm, 350 μm, 400 μm or 450 μm while maintaining an aperture of 10 μm are built, as shown in Figure 7 and Figure 8. The fractures grow in the Y direction in the XY plane and penetrate in the X direction.
For the conditions of the micro-fractures with and without roughness respectively, digital cores with a micro-fracture with the dip angle of 10°, 20°, 30° or 40° while maintaining an aperture of 10 μm are built, as shown in Figure 9. Each of the fractures is a plane at an angle to the XY plane, and penetrates in the Y direction. Pore-network models with corresponding dip angles are shown in Figure 10.

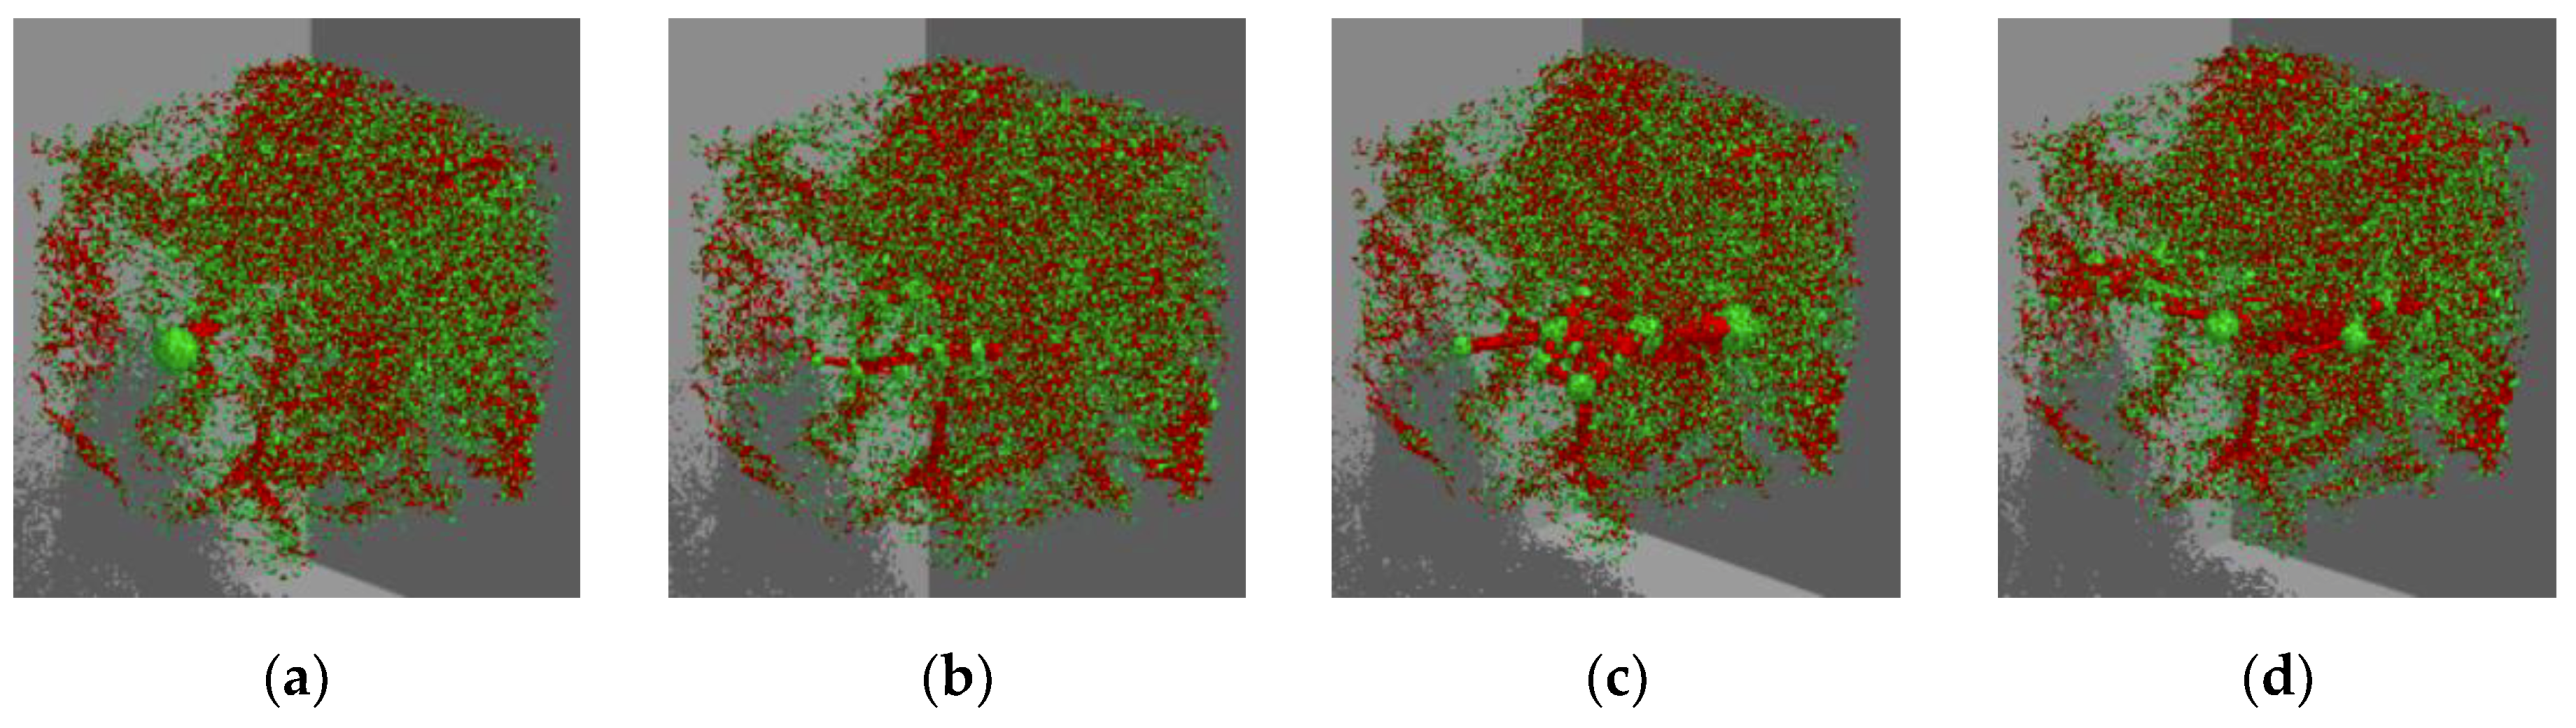
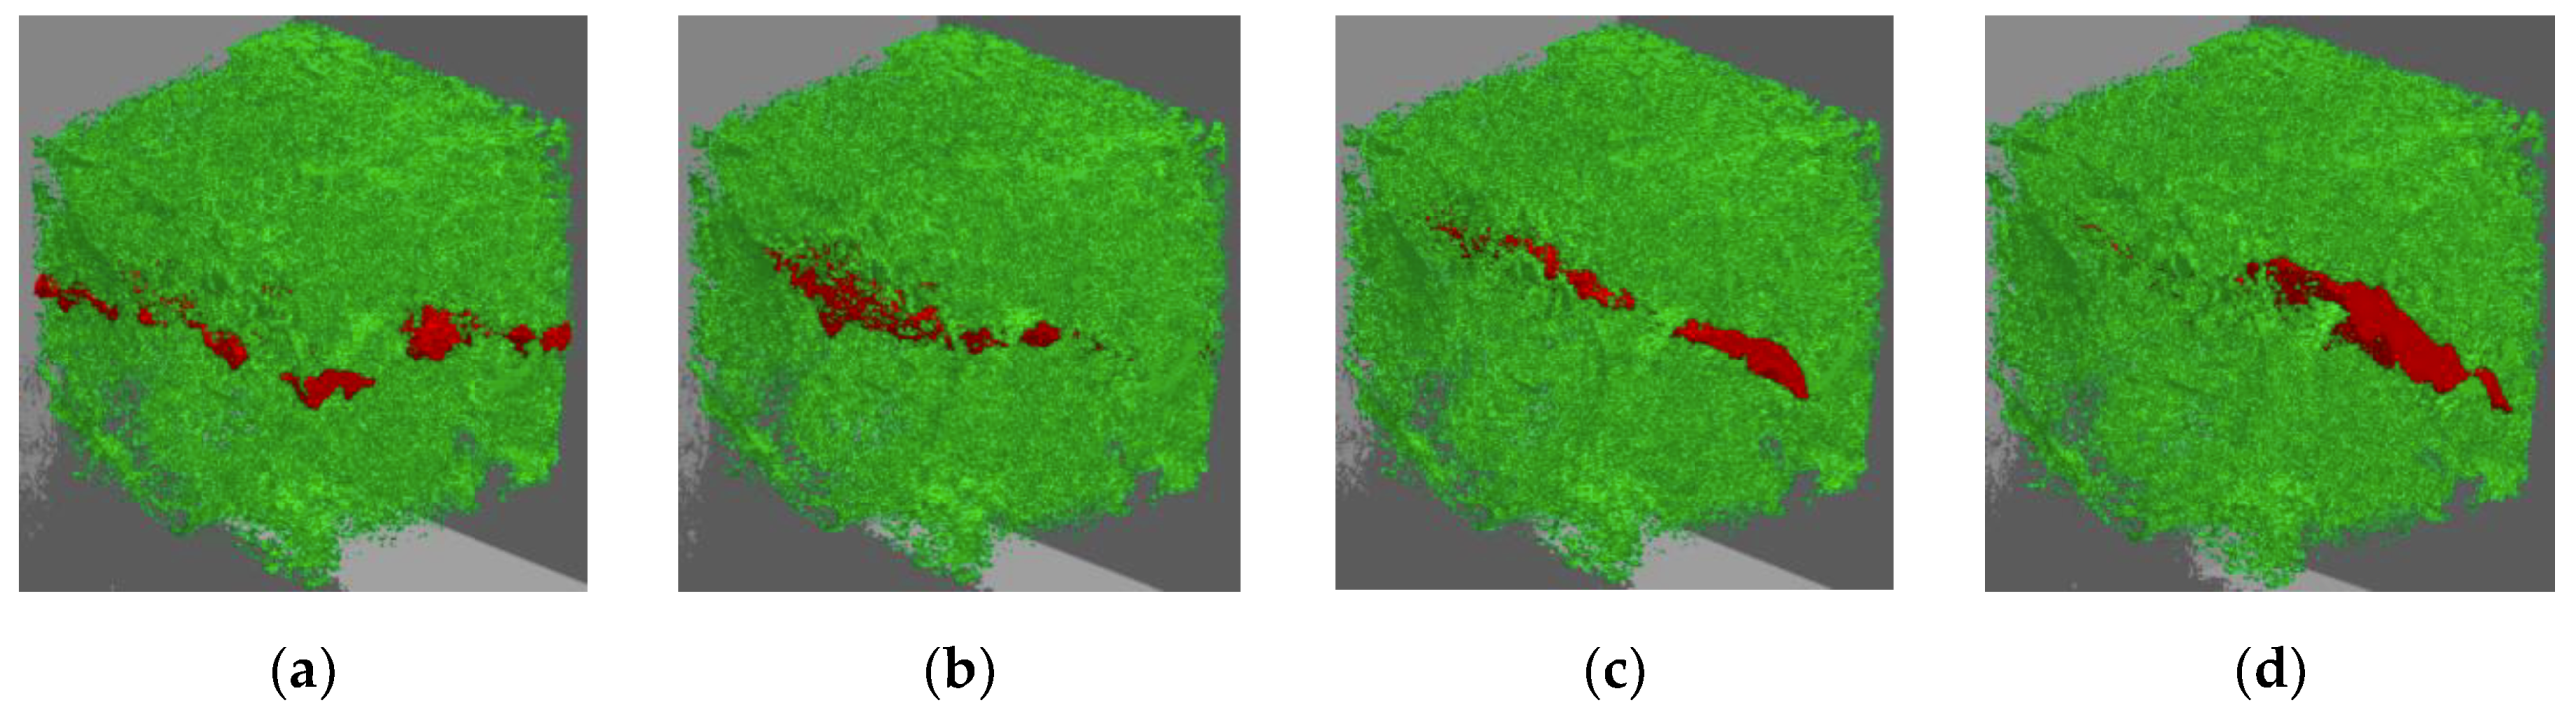
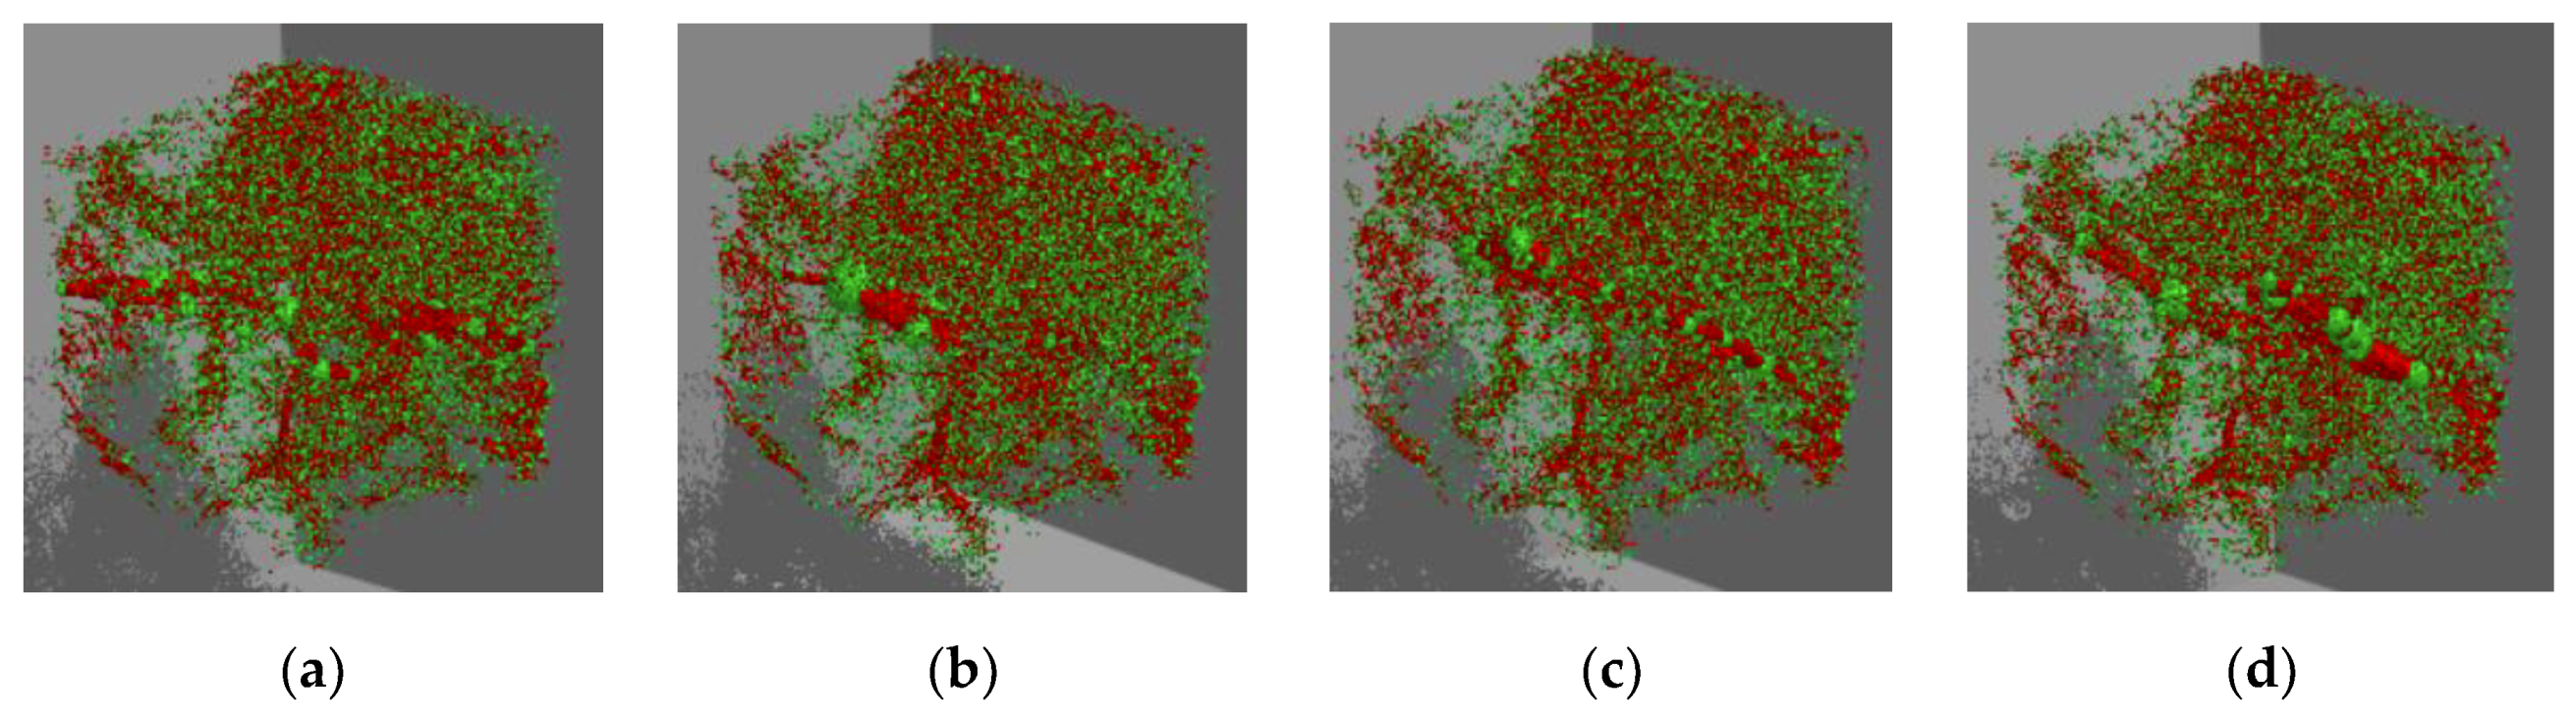
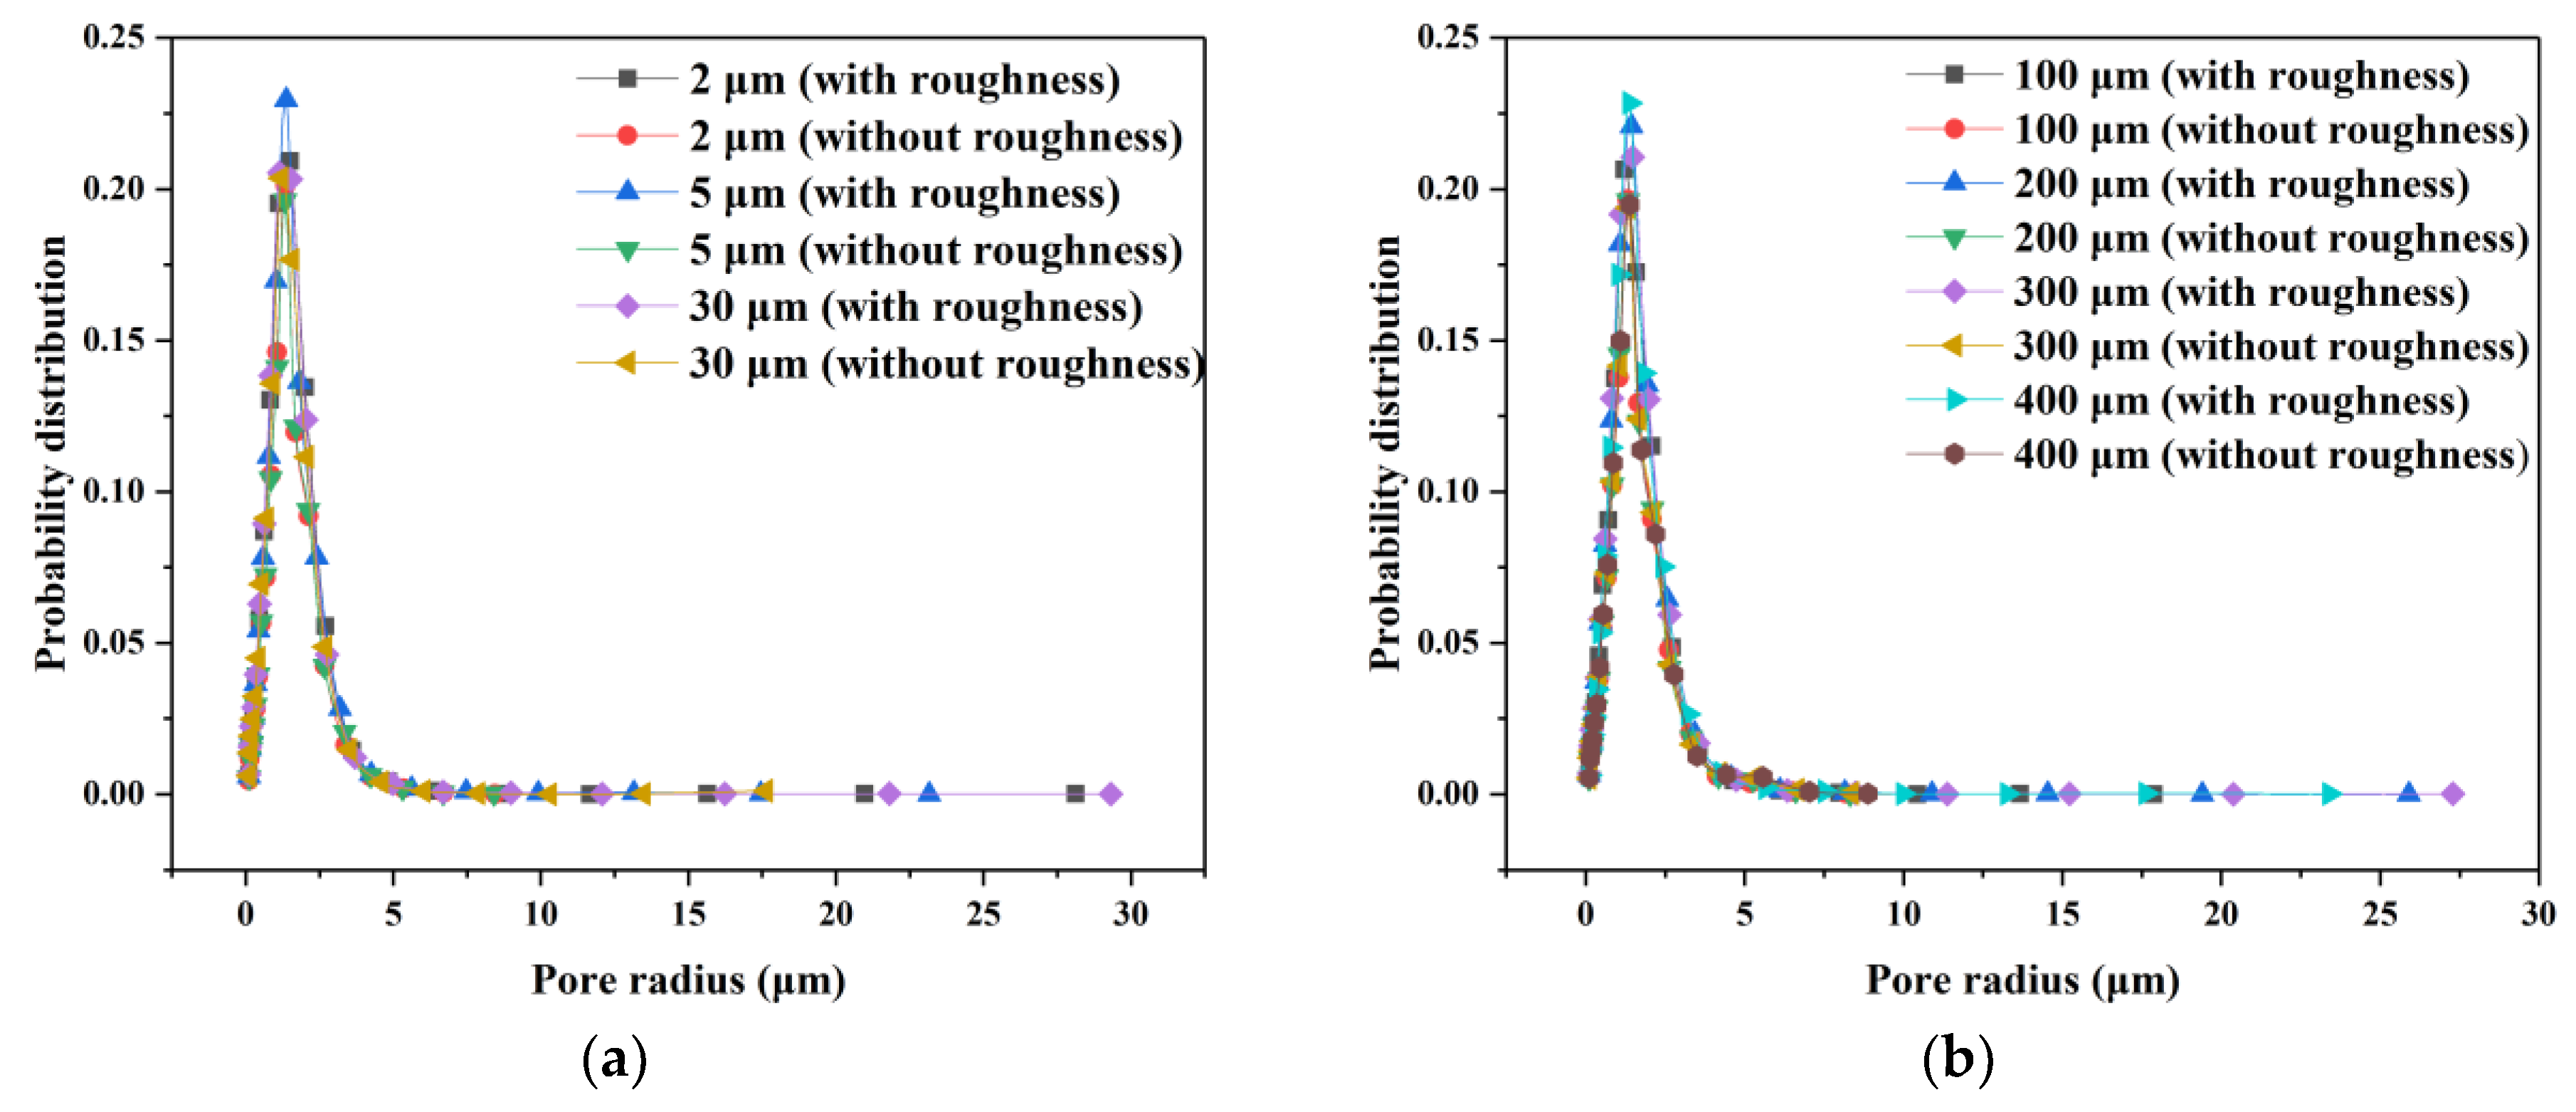
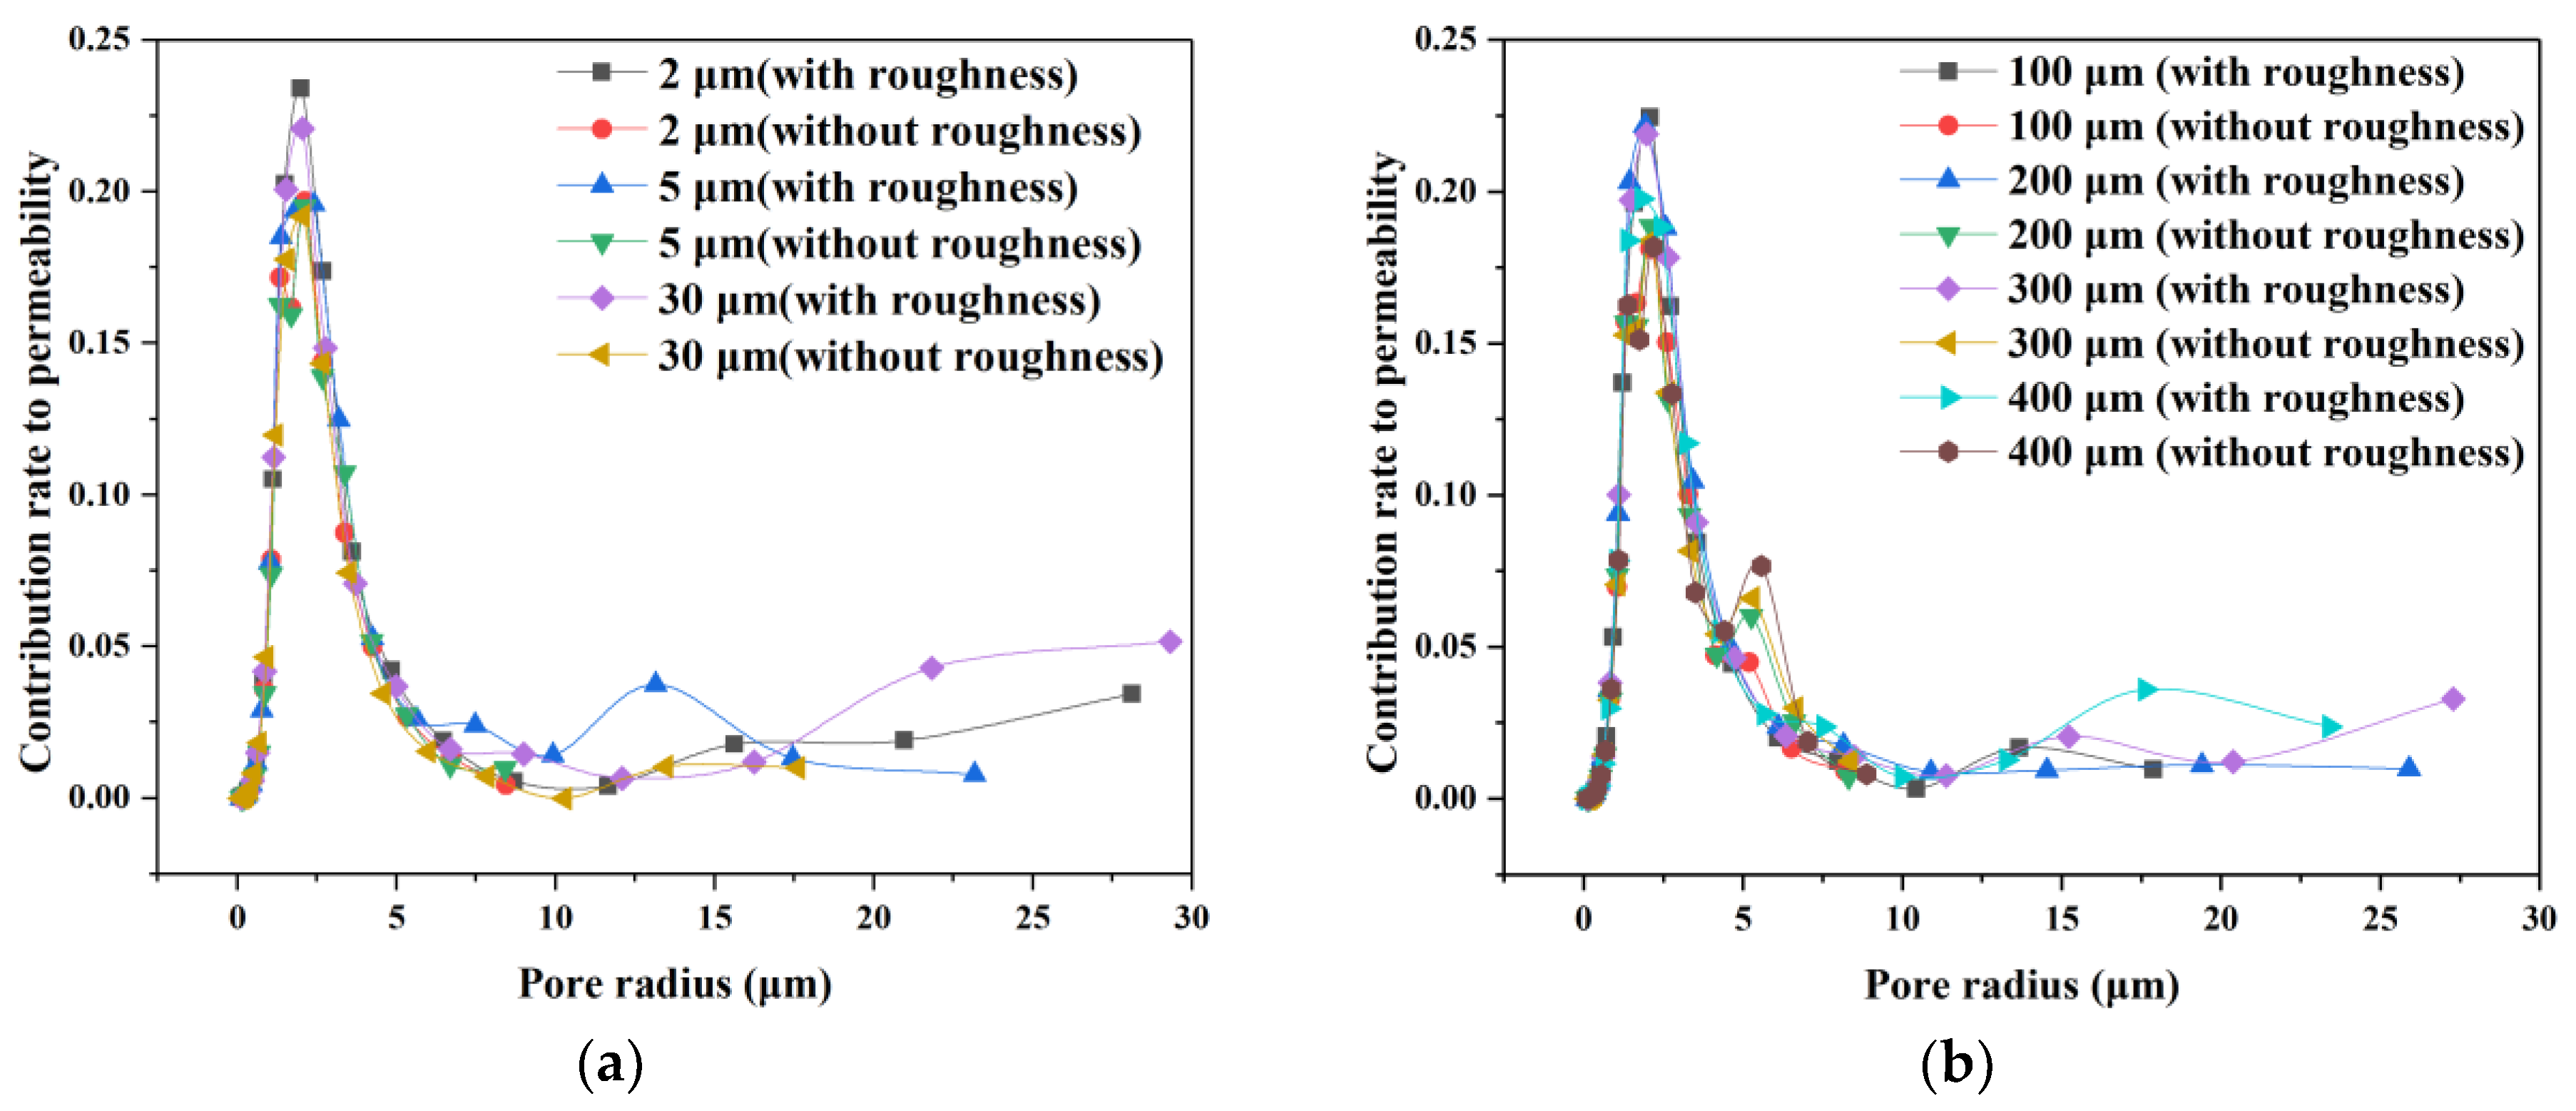
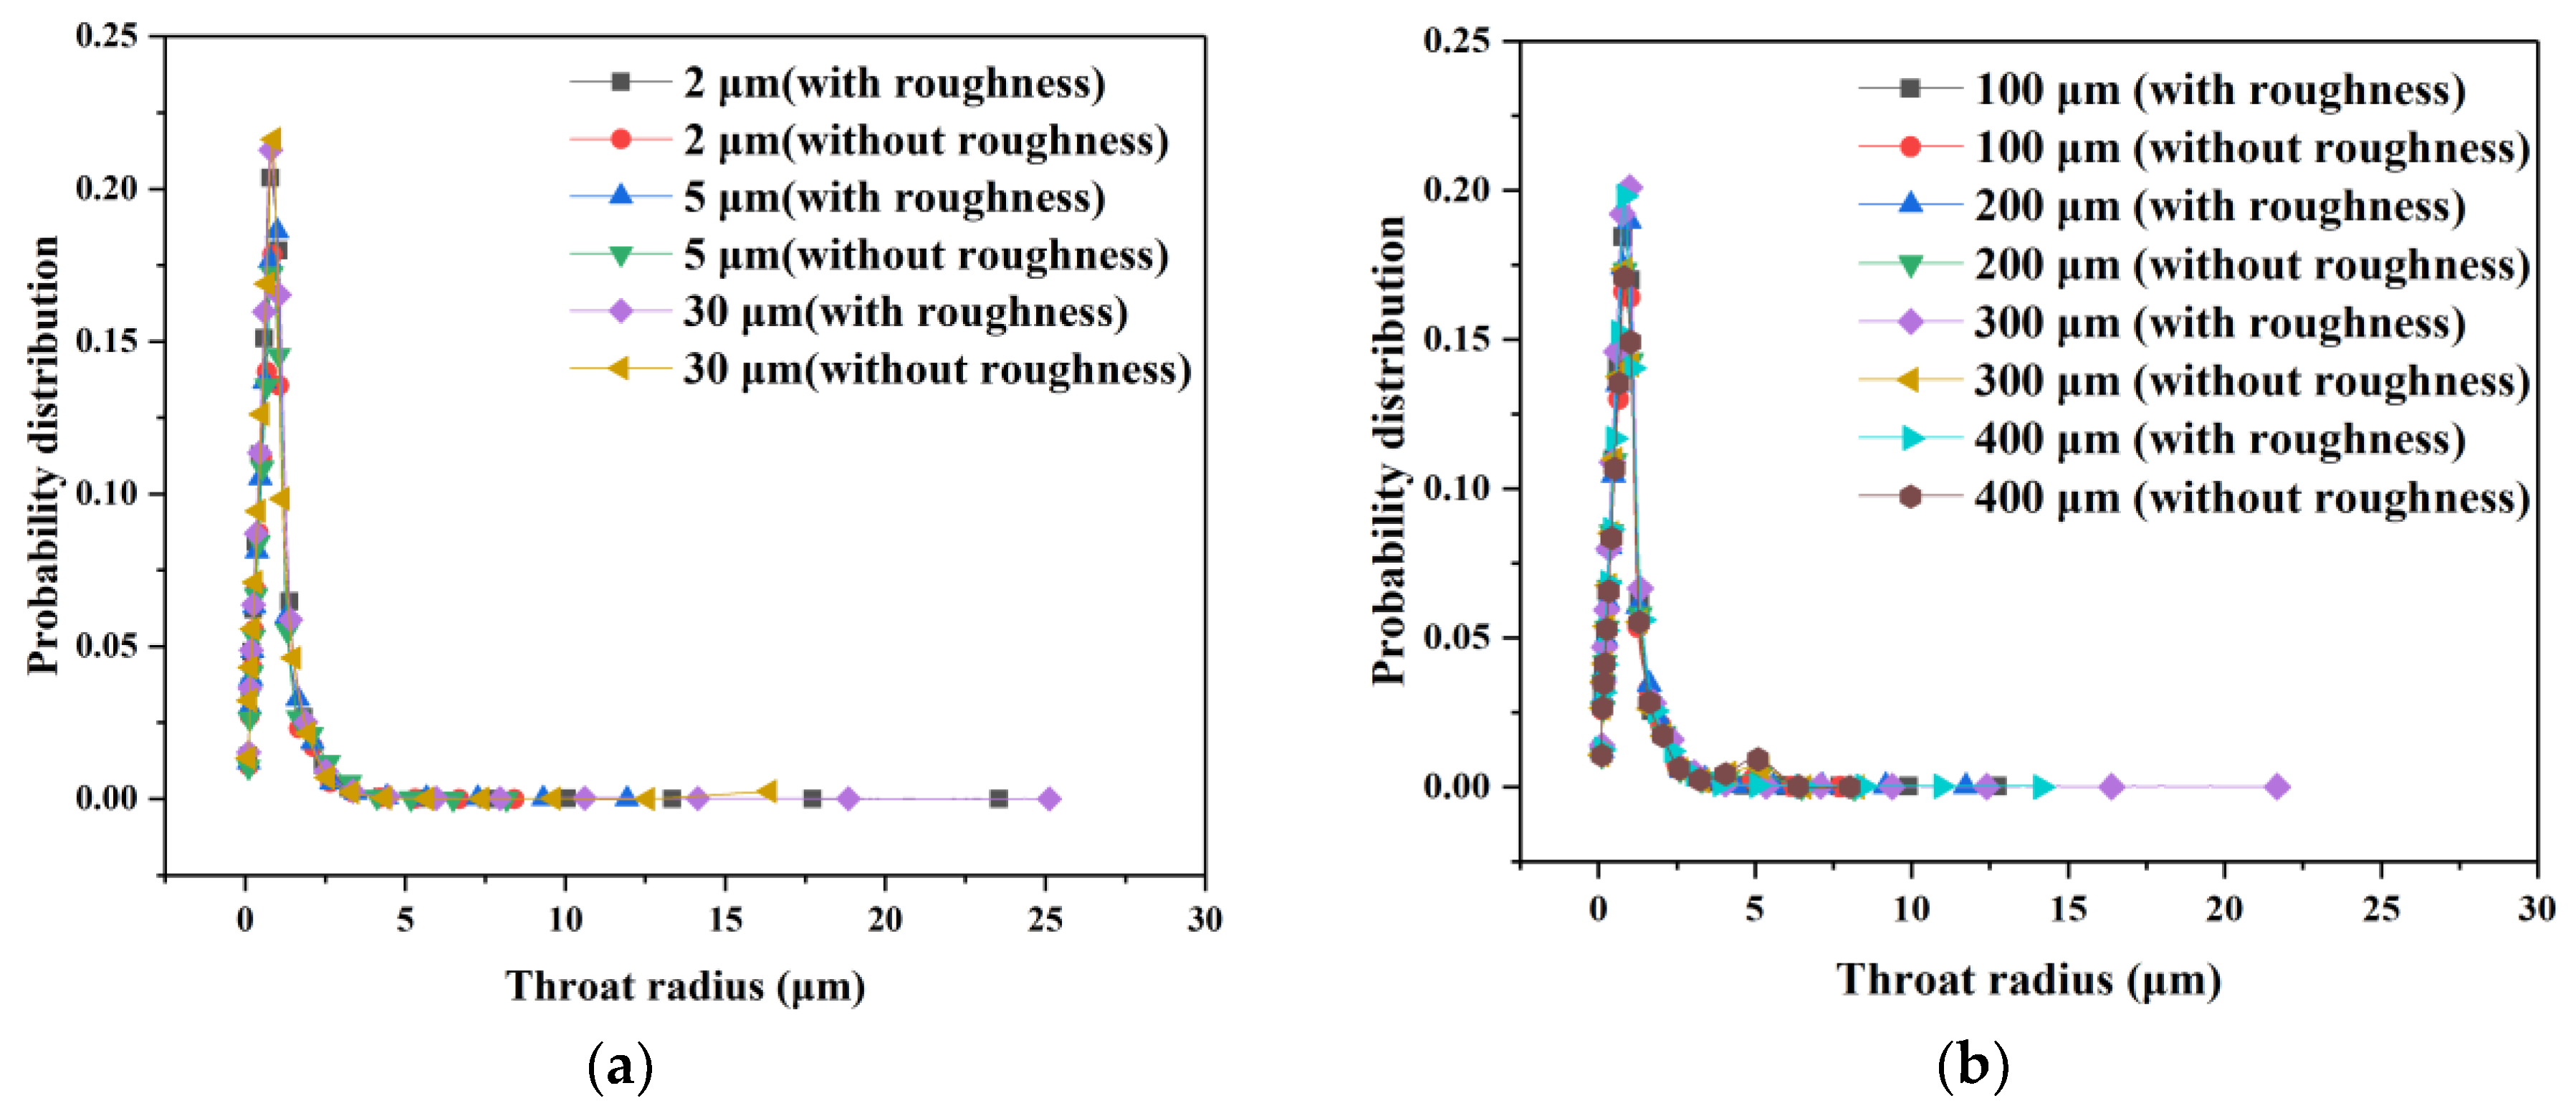
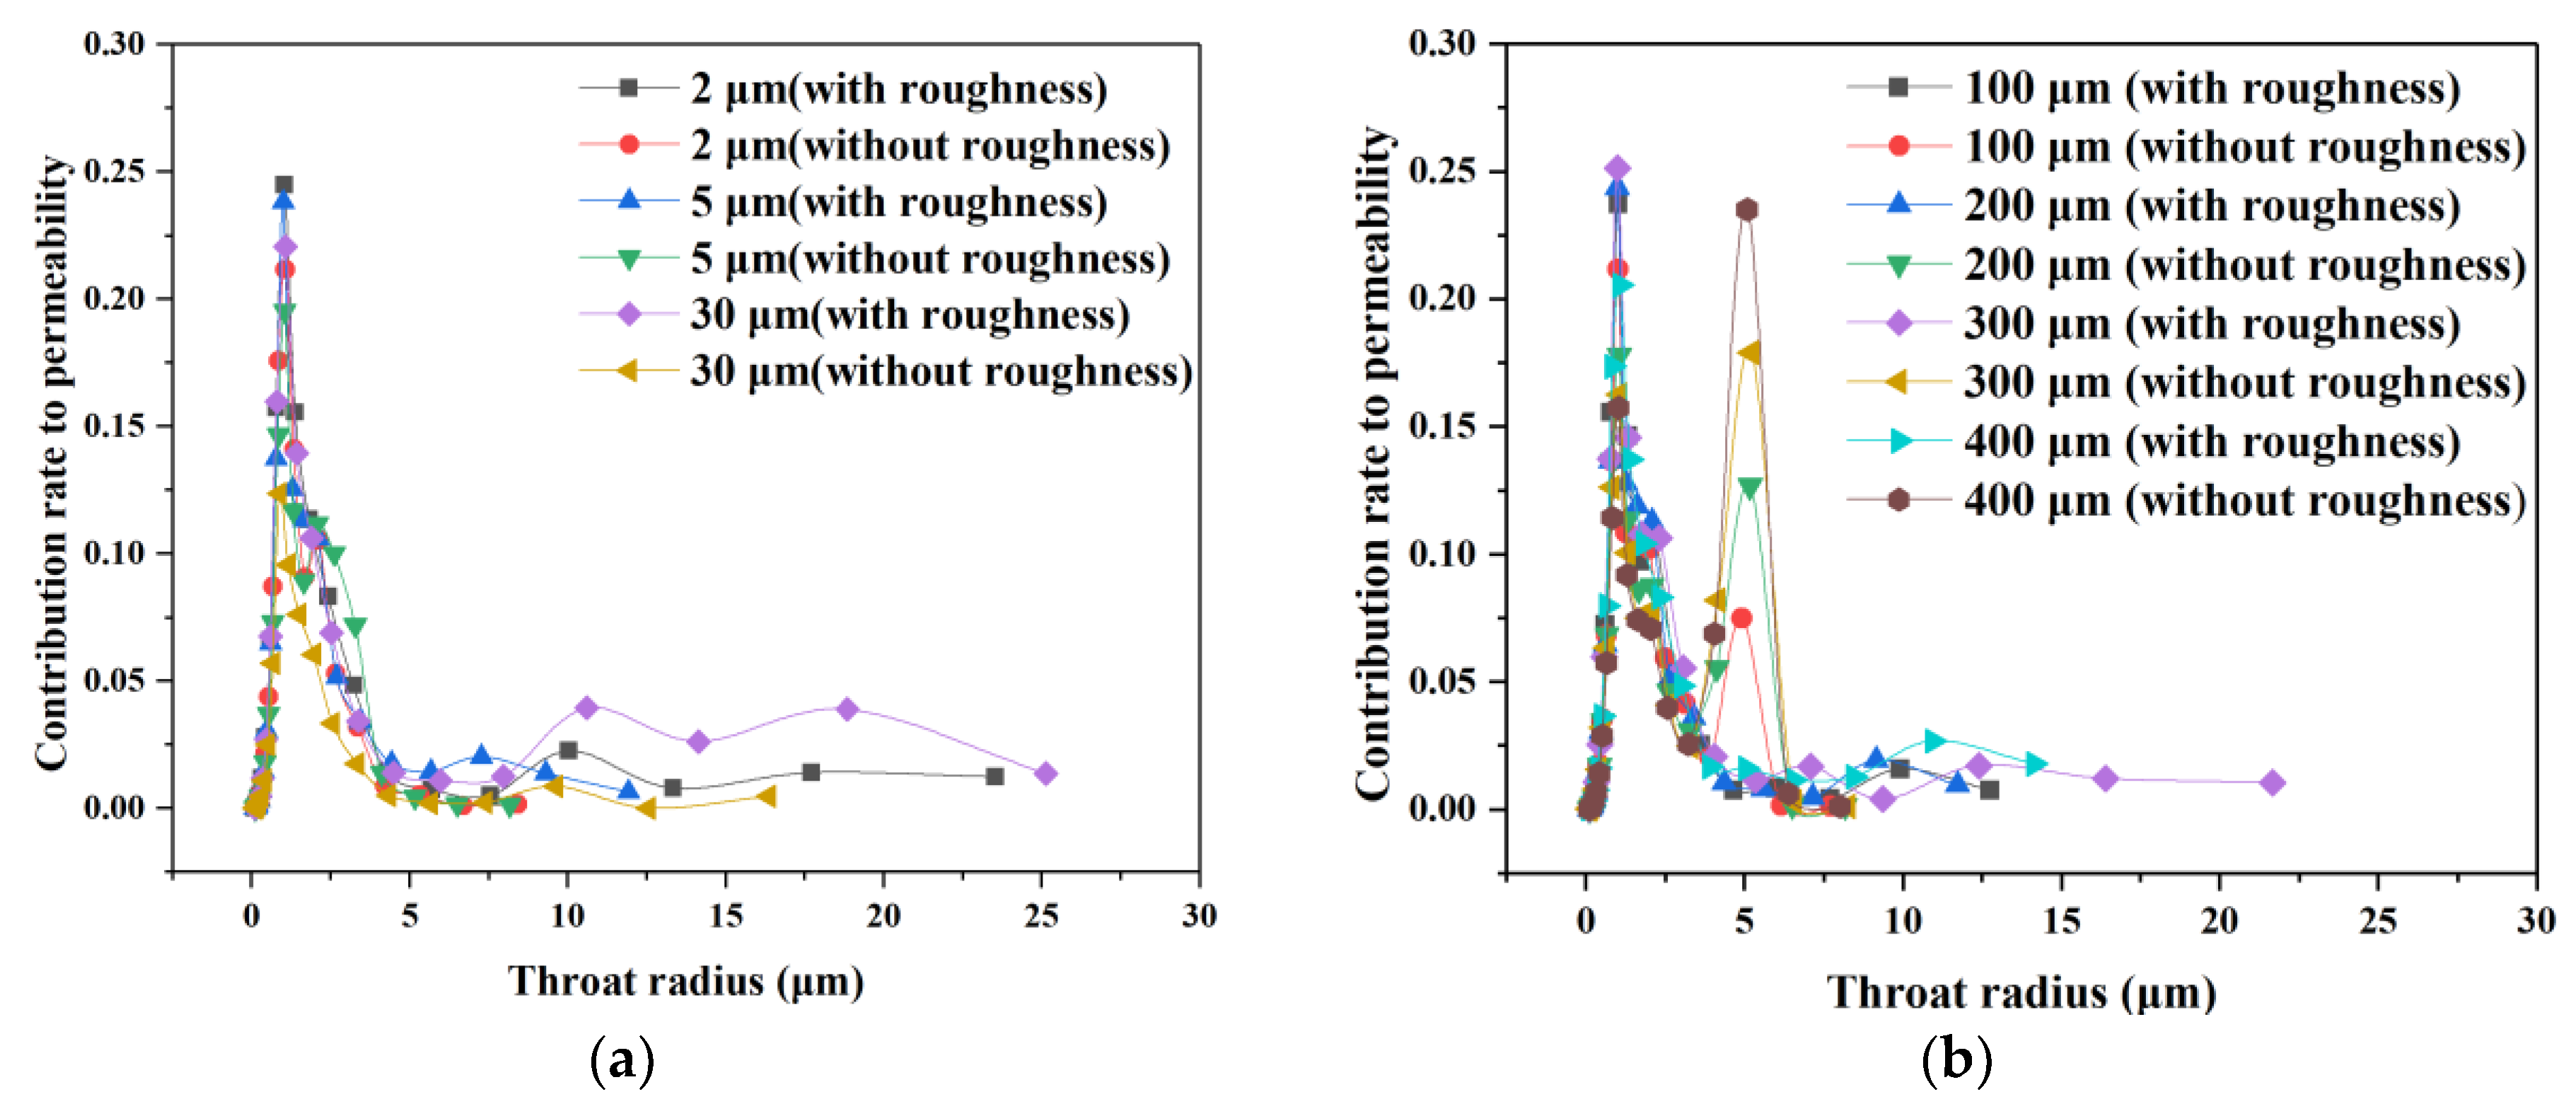
3.1. Effects of Micro-Fractures on Pore and Throat Structures

Using the pore-network models built with varying fracture apertures, lengths and dip angles, we studied characteristics of pore-throat structures. The effects of micro-fracture parameters on the probability distribution and contribution rate to permeability of pore-throat structures are shown in Figure 11, Figure 12, Figure 13 and Figure 14.
As shown in Figure 11 and Figure 13, the fracture aperture and length have the similar effects on the distribution of the pore and throat radii. With larger aperture or length, the distribution of the pore and throat radii are widened with higher peak value. The effects of the fracture aperture and length on the contribution of pore-throat radius to permeability are shown in Figure 12 and Figure 14. When the fracture aperture and length are increased, the contribution of pore and throat radius to permeability has larger distribution with larger radius.
In addition, it is shown that the distribution of pore-throat radius is larger for pore-network models with roughness compared to those without roughness. The presence of coarse particles makes pore-throat structures more diverse, which can also be seen visually from the constructed pore-network models. For models with roughness, the contribution of the pore-throat radius to permeability has larger distribution in the region where the pore and throat radii are small.

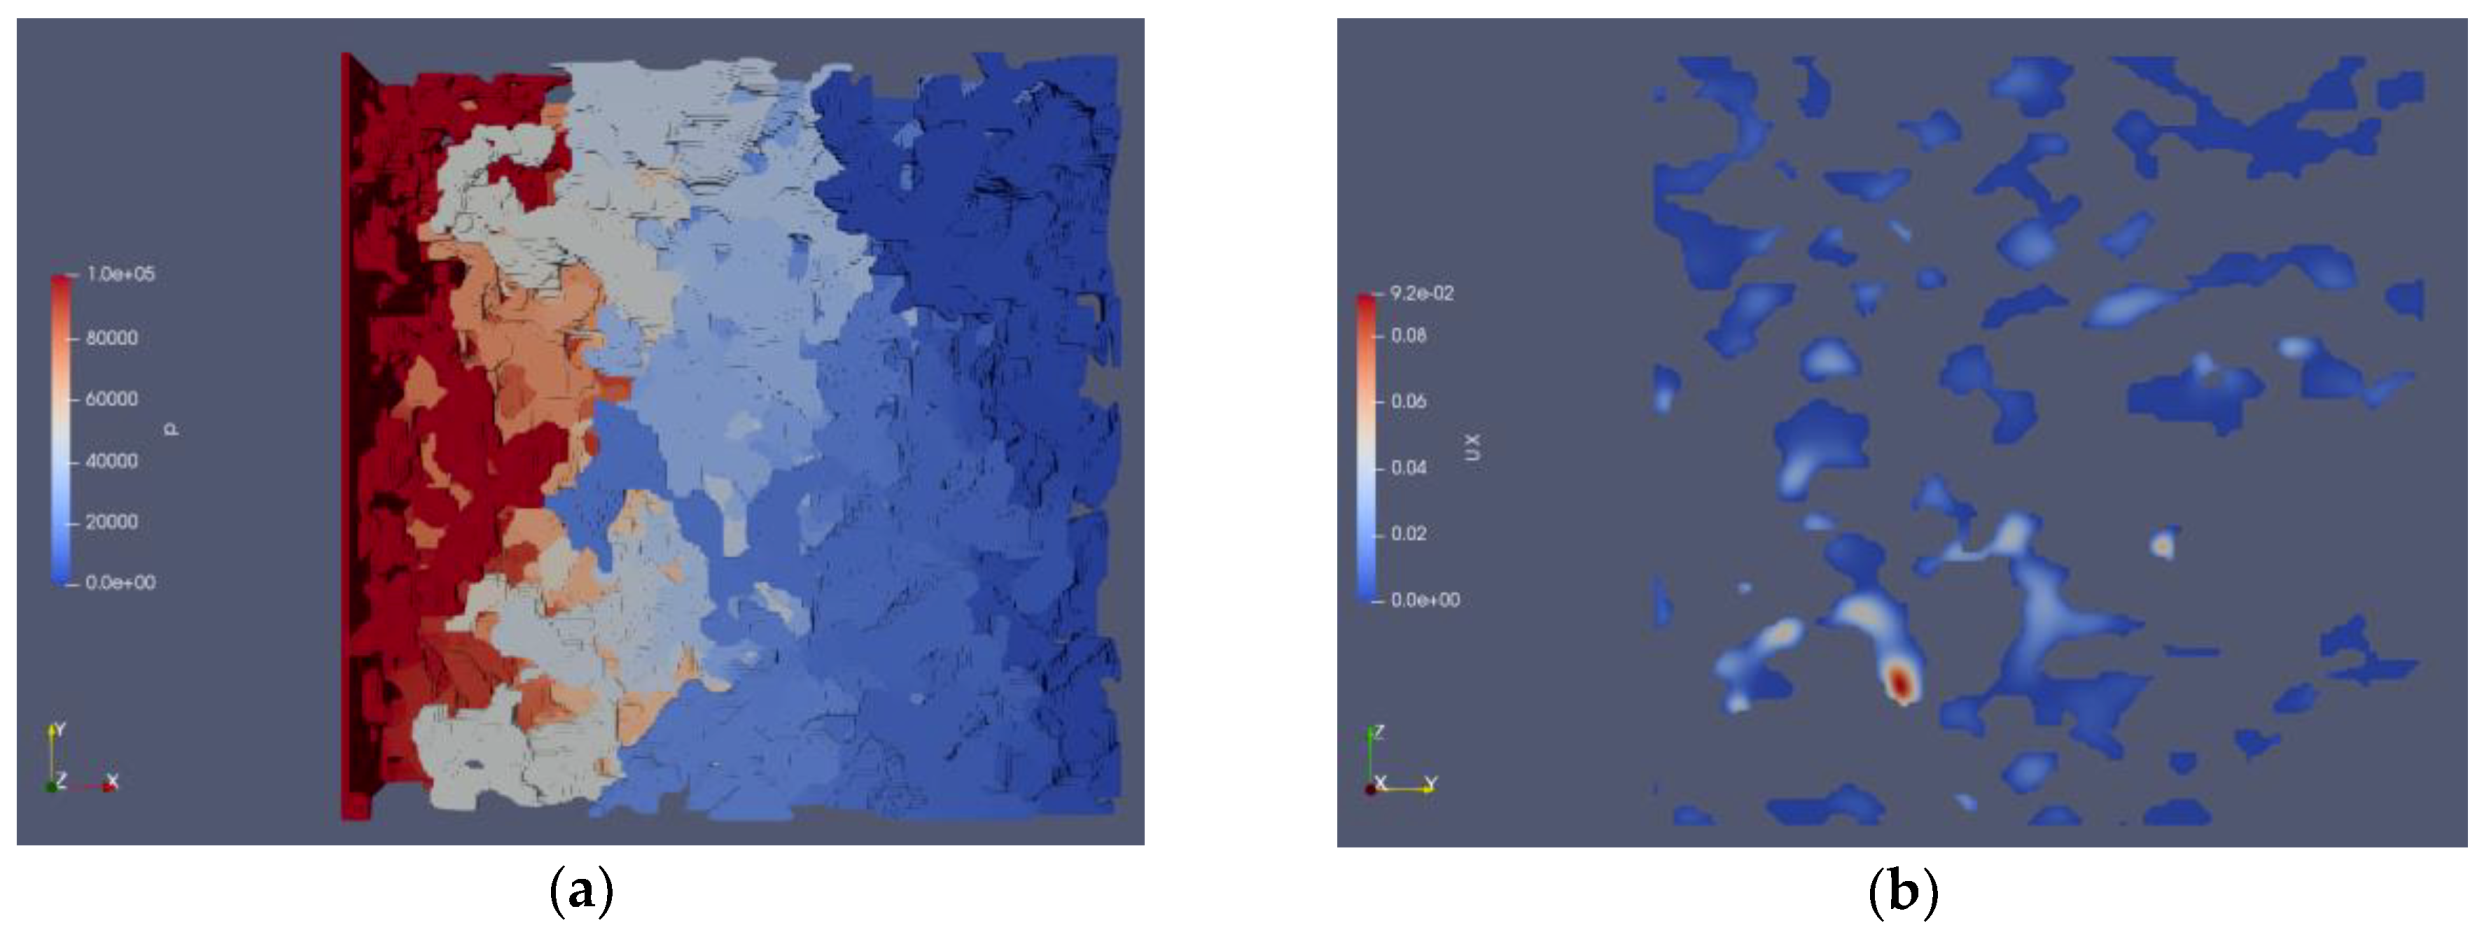
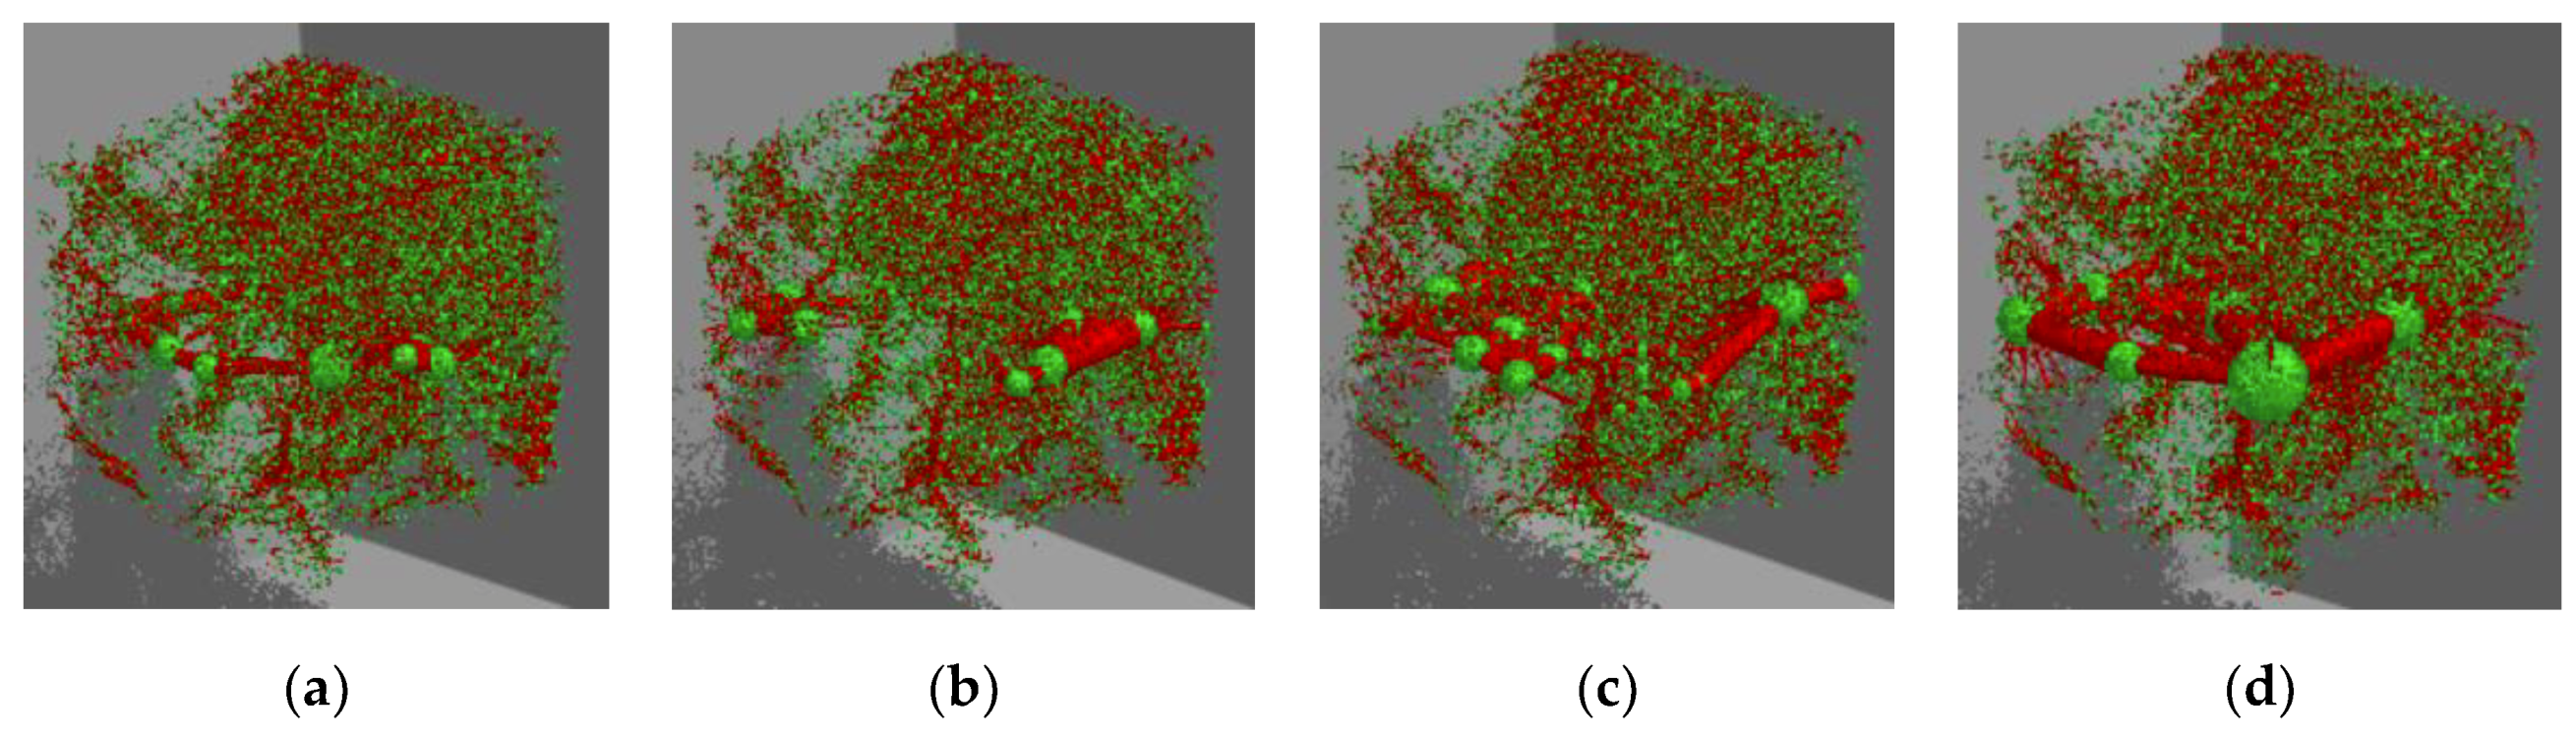
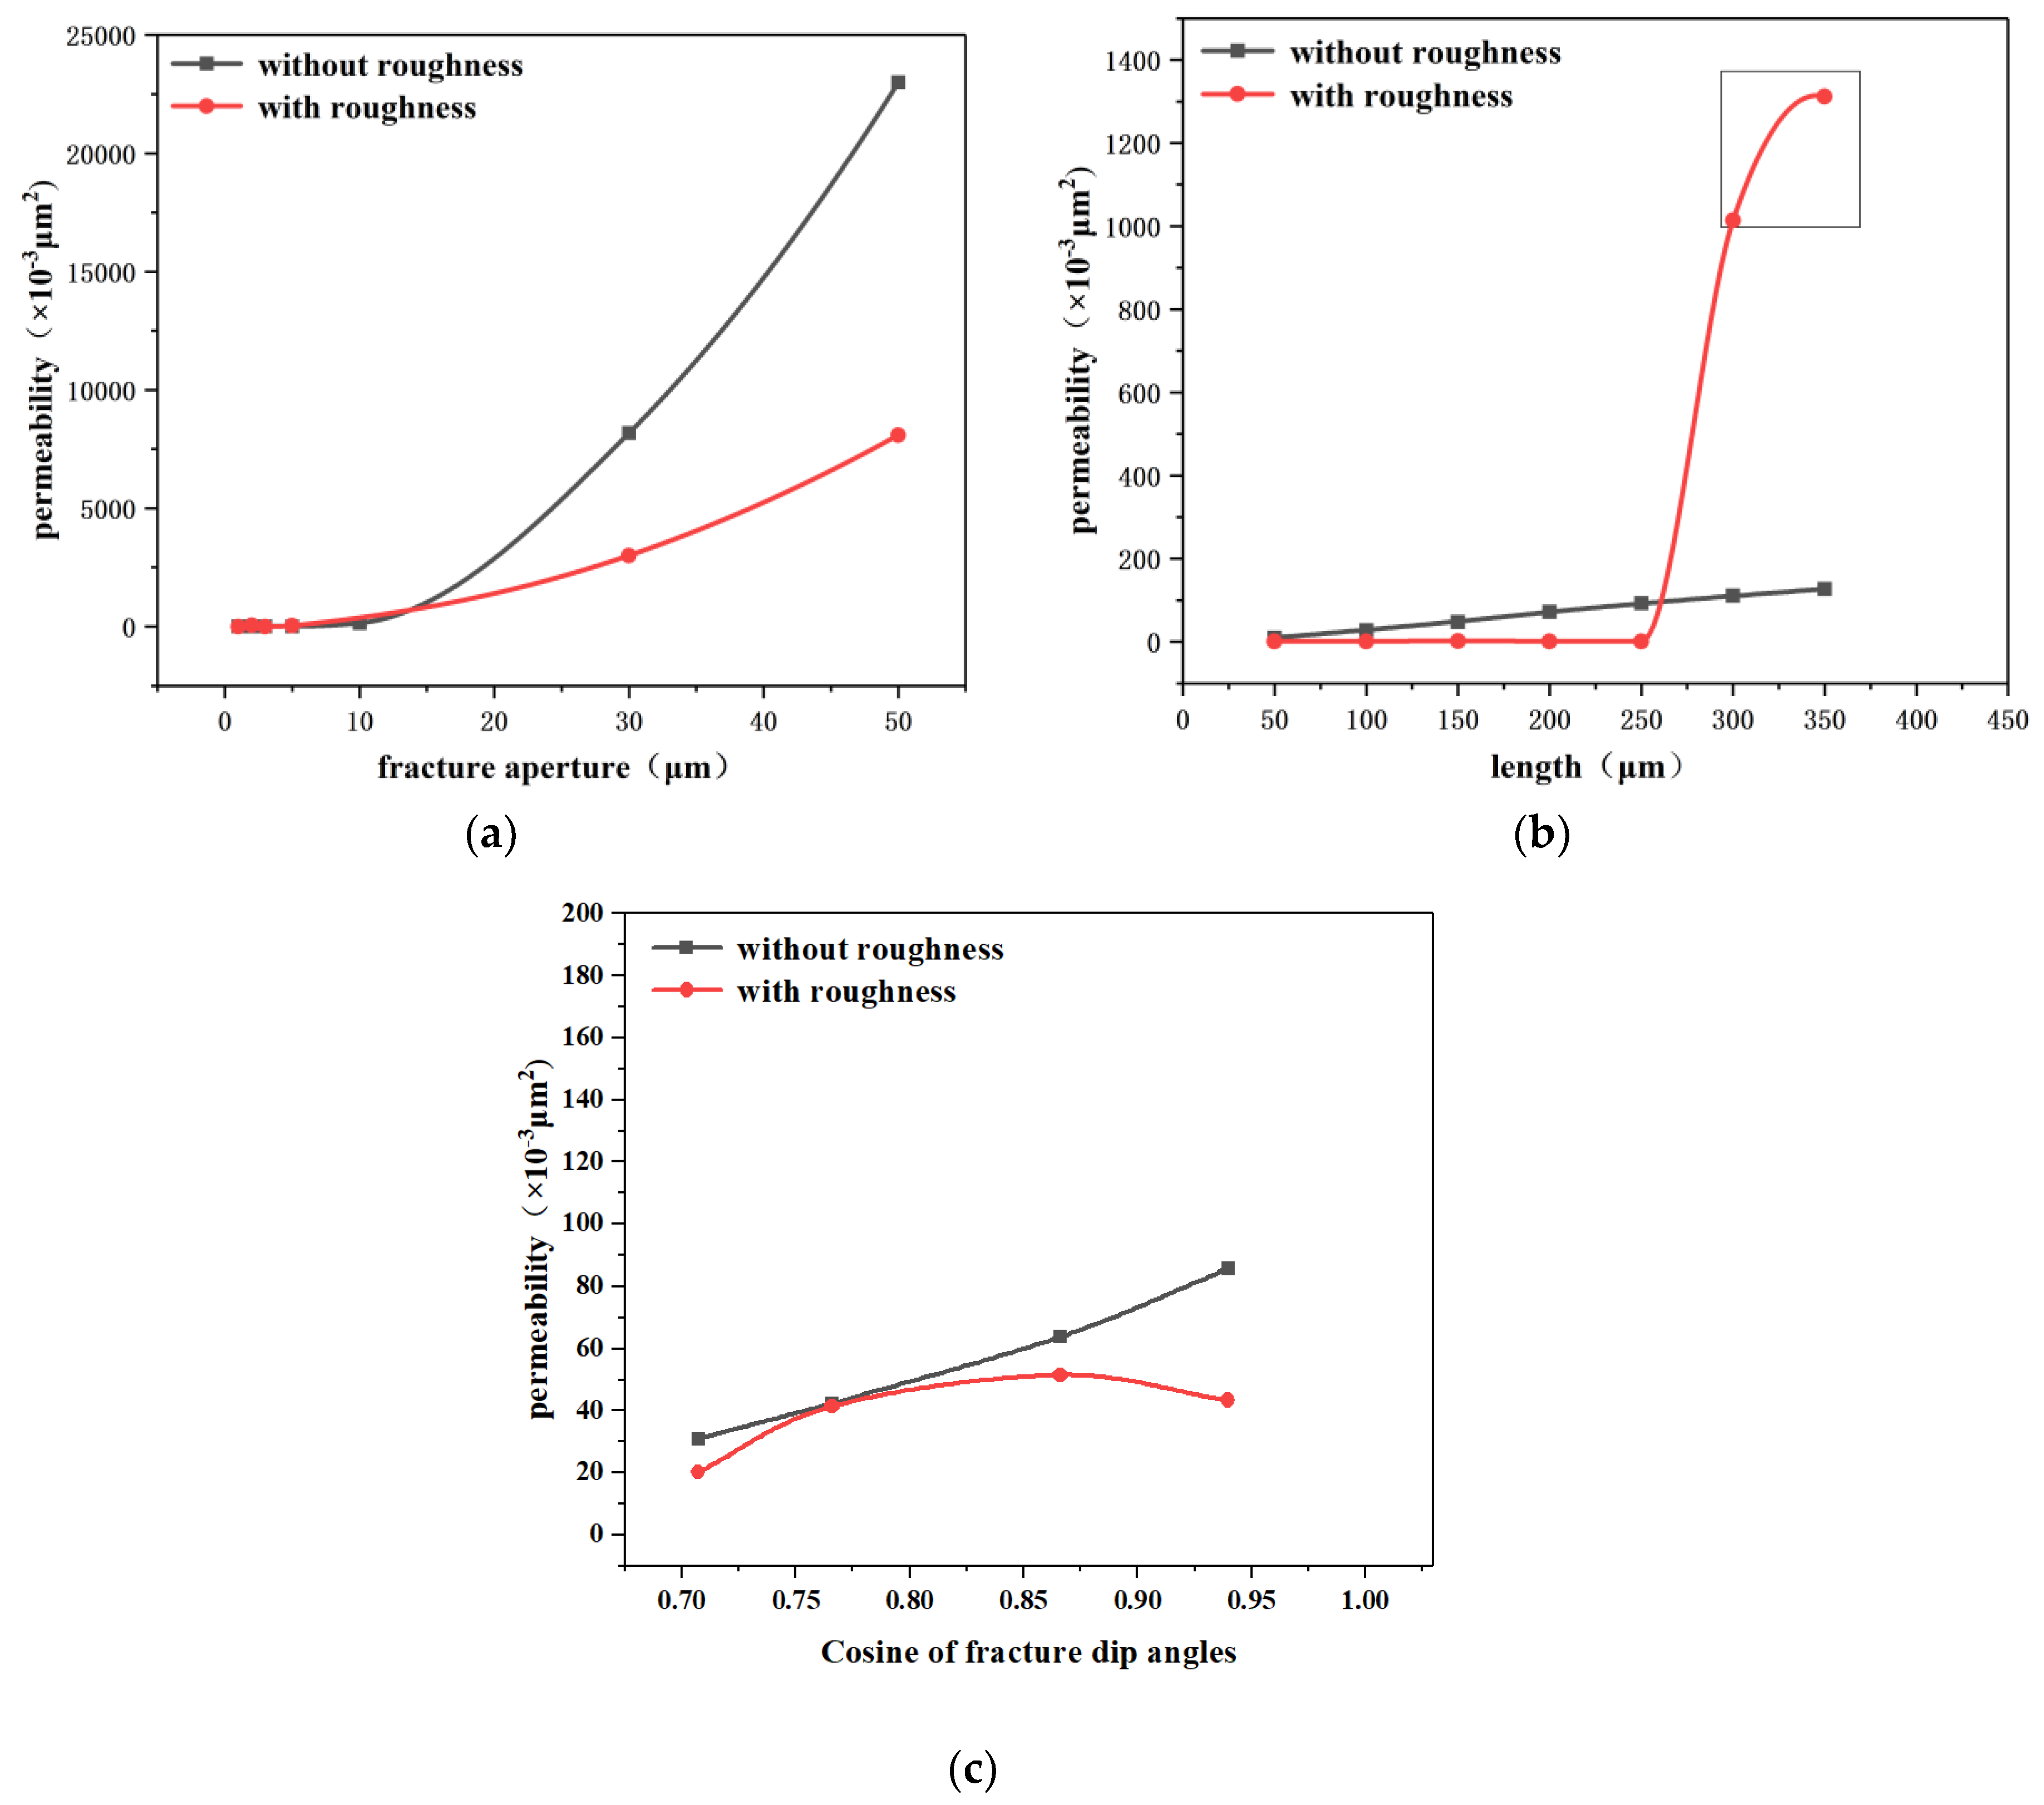
3.2. Effects of Micro-Fractures on Single-Phase Flow

In this section, the effects of micro-fractures on single-phase flow are presented. The absolute permeability with respect to the aperture, length and dip angle of micro-factures are shown in Figure 15.
In the following, the simulation results will be discussed for two scenarios: results of models without roughness and with roughness.
For the first case, modeling without roughness, the effects of micro-fractures on absolute permeability can be modeled by linear equations shown below.
As shown in Figure 15a, the absolute permeability has an exponential growth as the fracture aperture increases, given by:
k = a δ b
where k is the absolute permeability (mD); δ is the fracture aperture (μm); a and b are the parameters related to the rock property.
As for the effect of fracture length shown in Figure 15b, the absolute permeability shows a linear correlation with the fracture length given by:
k = c l + d
where l is the fracture length (μm); c and d are parameters related to the rock property.
Similarly, the absolute permeability is linearly positively correlated with the cosine of the fracture dip angle in the penetration direction of the fracture, shown in Figure 15c.
k = e cos θ + f
where θ is the fracture dip angle (μm); e and f are parameters related to the rock property.
On the other hand, the effects of micro-fractures on surfaces with roughness are more complicated compared to the ideal case without roughness.
The resistance of fluid increases due to retention and drag effects on the fluid of a rough fracture surface, leading to lower absolute permeability. The absolute permeability is also an exponential function of the fracture aperture but with a smaller growth factor compared to the surface without roughness. In addition, the absolute permeability is still linearly correlated with the fracture length when the length is small. Then the absolute permeability suddenly increases when the fracture length reaches 300 μm. Finally, the absolute permeability is no longer linearly positively correlated with the cosine of the fracture dip angle, as shown in Figure 15c. Therefore, only the influence of the micro-fracture aperture on the single-phase flow stays similar for surfaces with and without roughness.
When the aperture is relatively small, the absolute permeability of the core with a rough fracture fluctuates up and down with the increase of the fracture aperture. This is because the actual situation is fully considered when the roughness is simulated, so that the roughness model has randomness. Near to each other, the two faces of a fracture may intersect or separate. If intersectant, they will hinder the flow. If separate, they will broaden the flow channel. Therefore, when the fracture aperture is small, the random distribution of the two cases has a large increase or decrease in the absolute permeability, so the absolute permeability fluctuates with the apertures.
However, when the fracture aperture is relatively large, the two faces of a fracture are far from each other. They can hardly intersect, and the influence of separation is inappreciable in terms of the large aperture. Thus, the change of the absolute permeability of the core with a rough fracture is mainly related to the aperture, and it also satisfies the power-law relationship numerically. On the whole, the core with a rough fracture has a lower absolute permeability than that of the core with a smooth fracture. This is because the fluid is retained and dragged in the pores and throats in the rough fracture, and the resistance to the fluid increases, causing a decrease in the absolute permeability.
From the rectangular box in Figure 15b, the absolute permeability suddenly increases when the fracture length reaches 300 μm or more. To figure out the reason of this phenomenon, the digital cores and pore-network models of the tight sandstone with the fracture of length 300 μm are studied, as shown in Figure 16. It is found that the fracture reaches a space near the core edge, and there are lots of pores with bad connectivity near but out of the fracture. However, the presence of roughness can connect them effectively because the wall of the crack has fluctuations. Thus, the absolute permeability increases substantially.

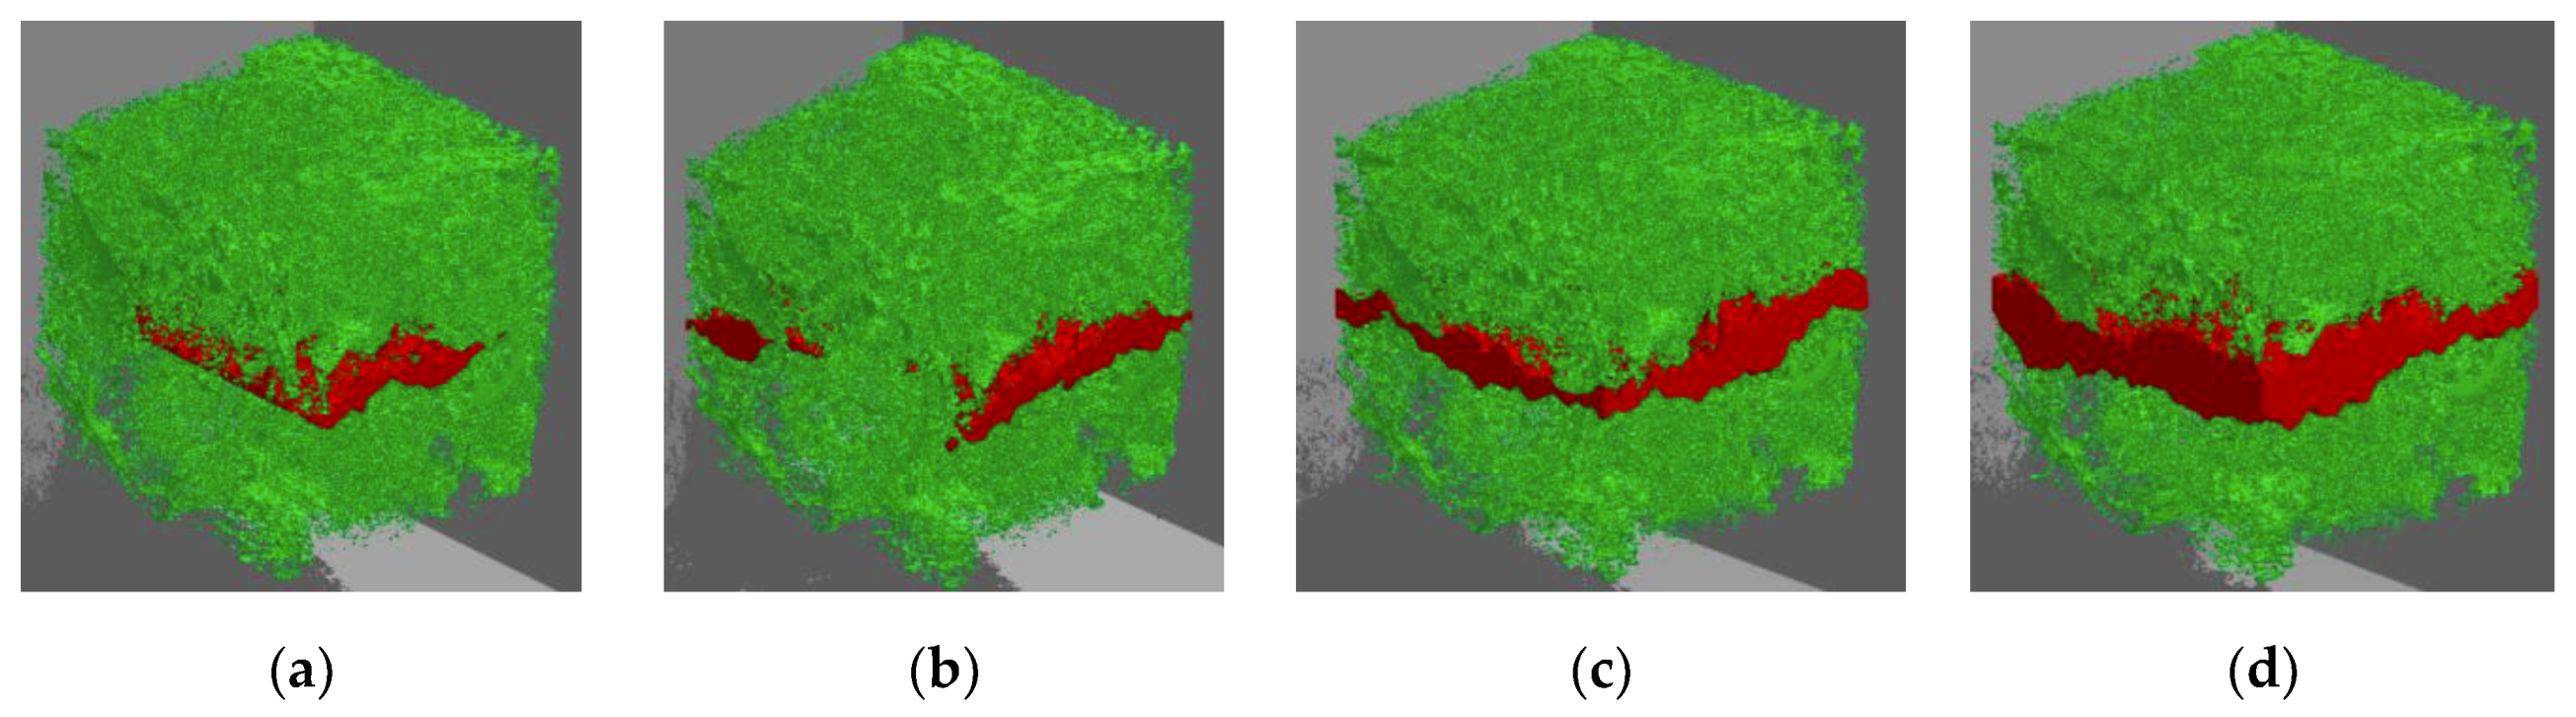
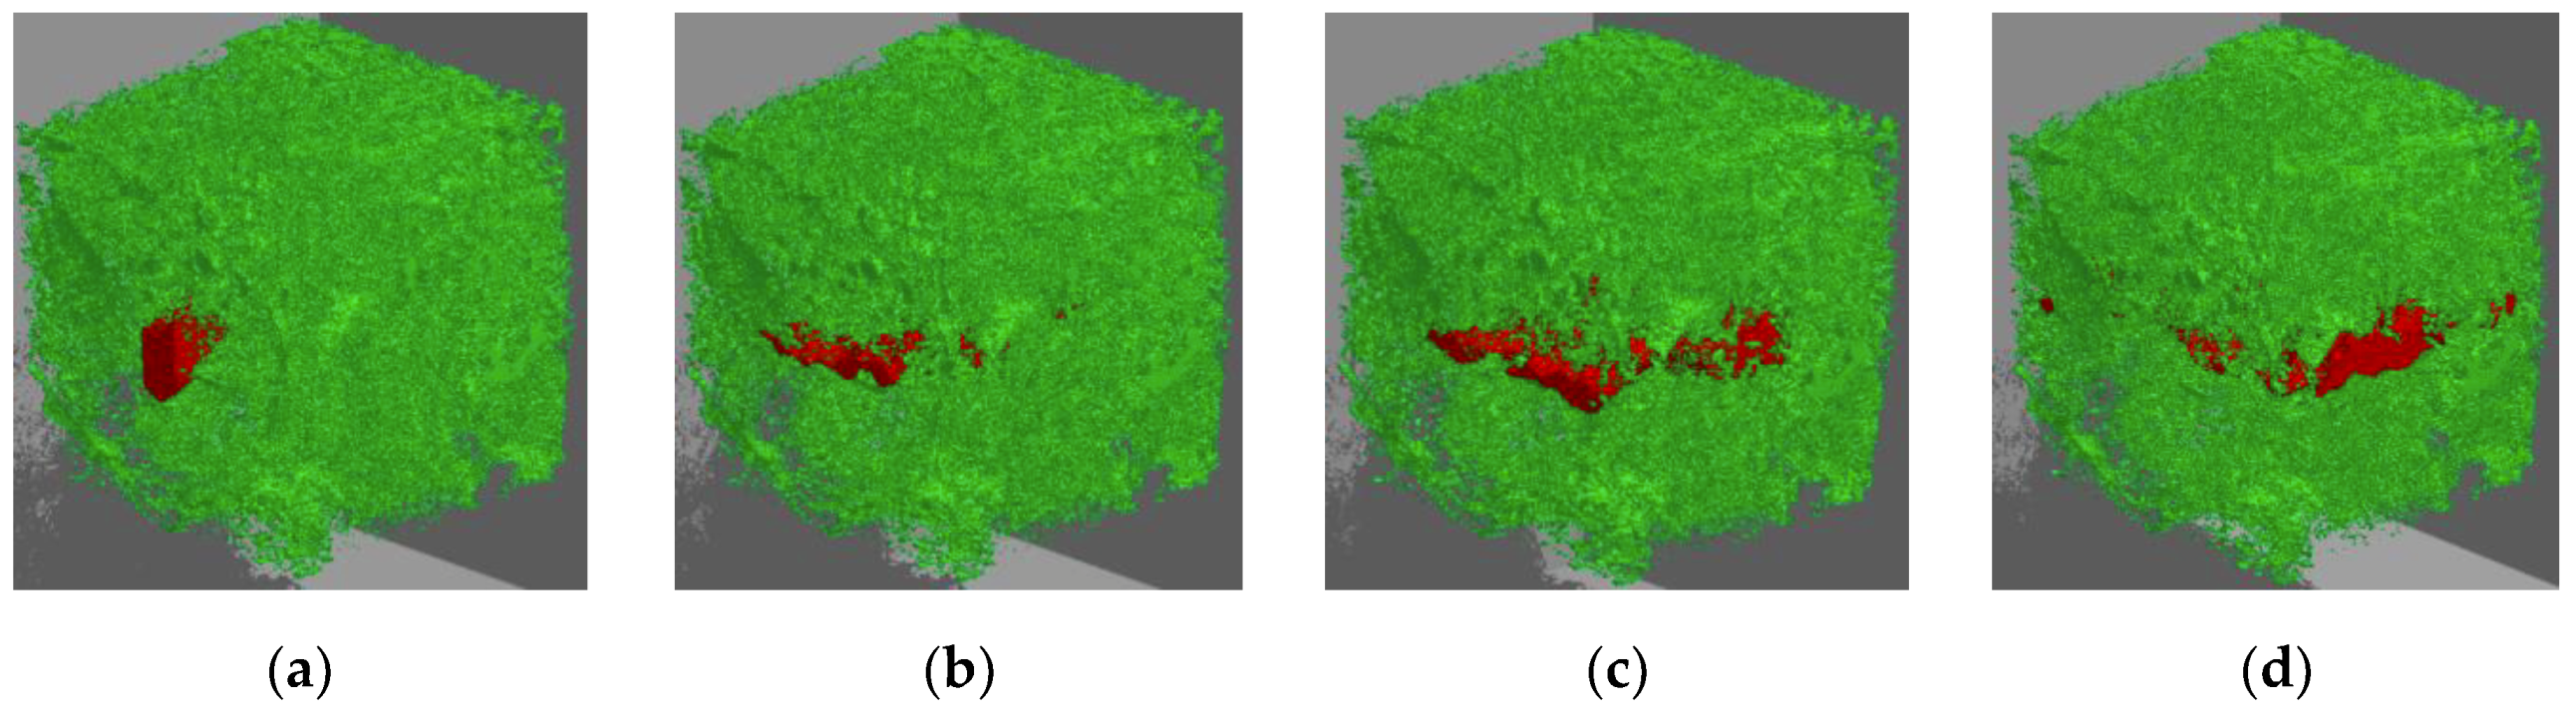
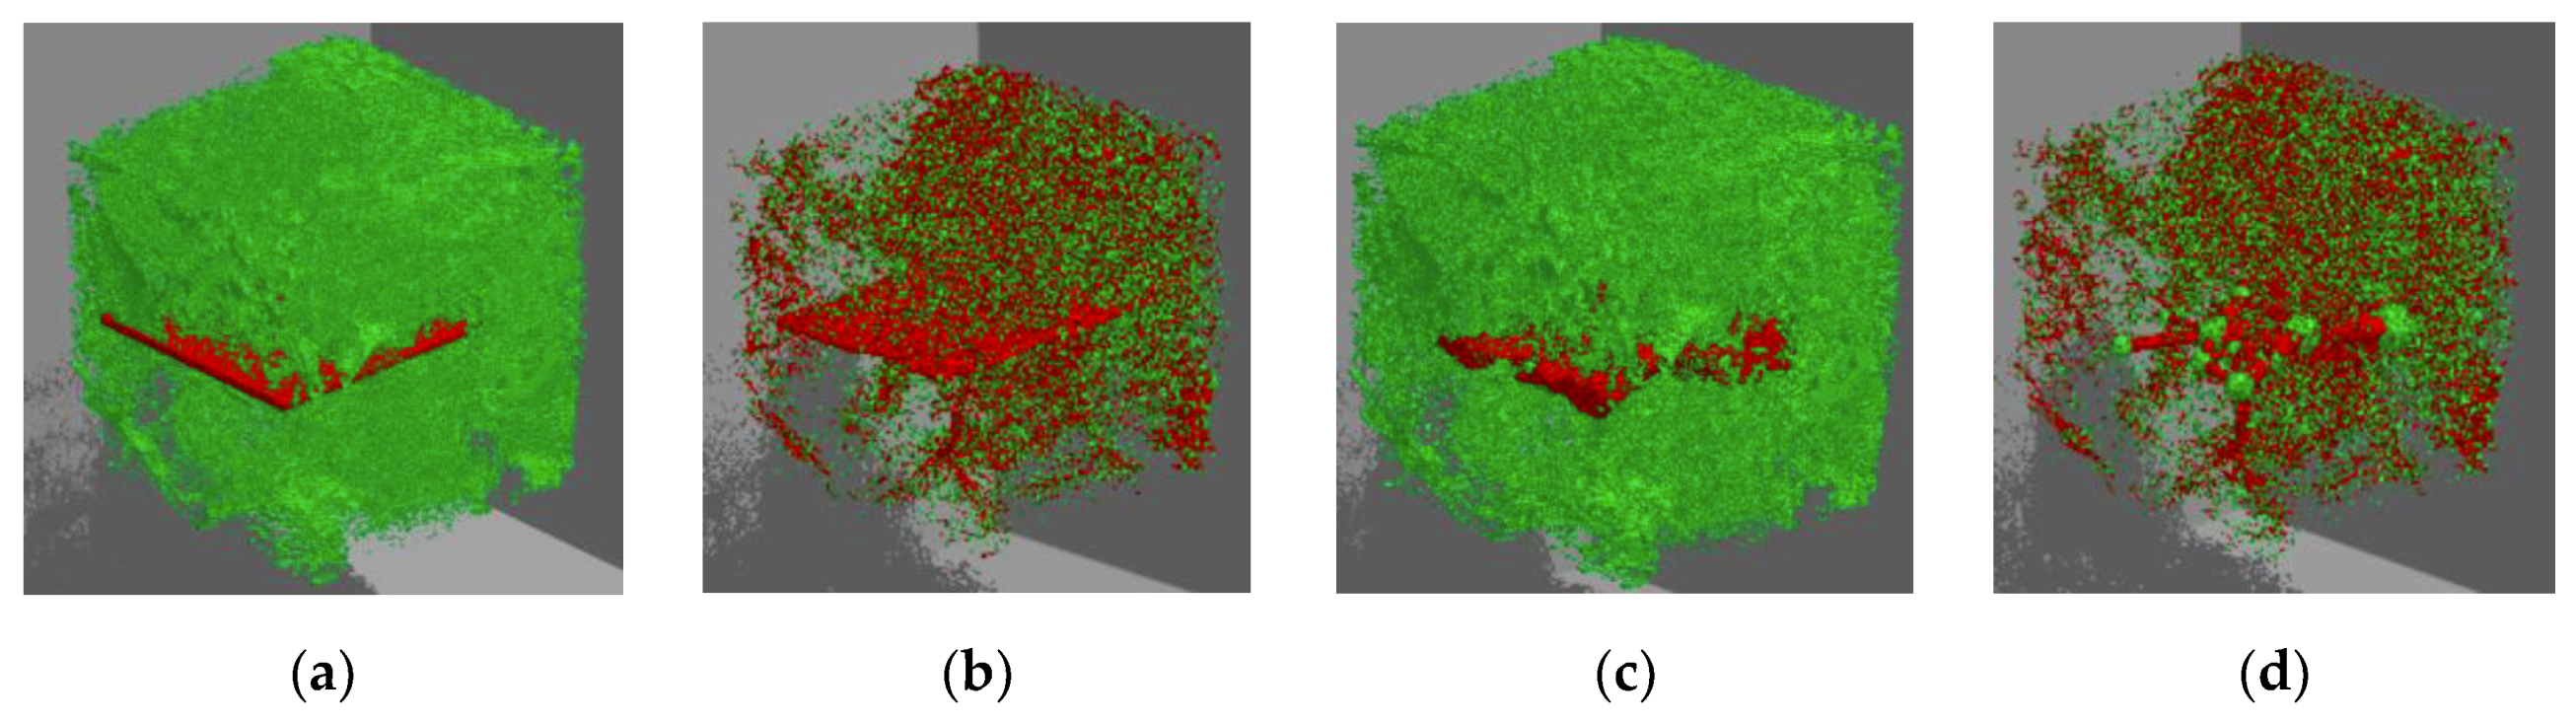
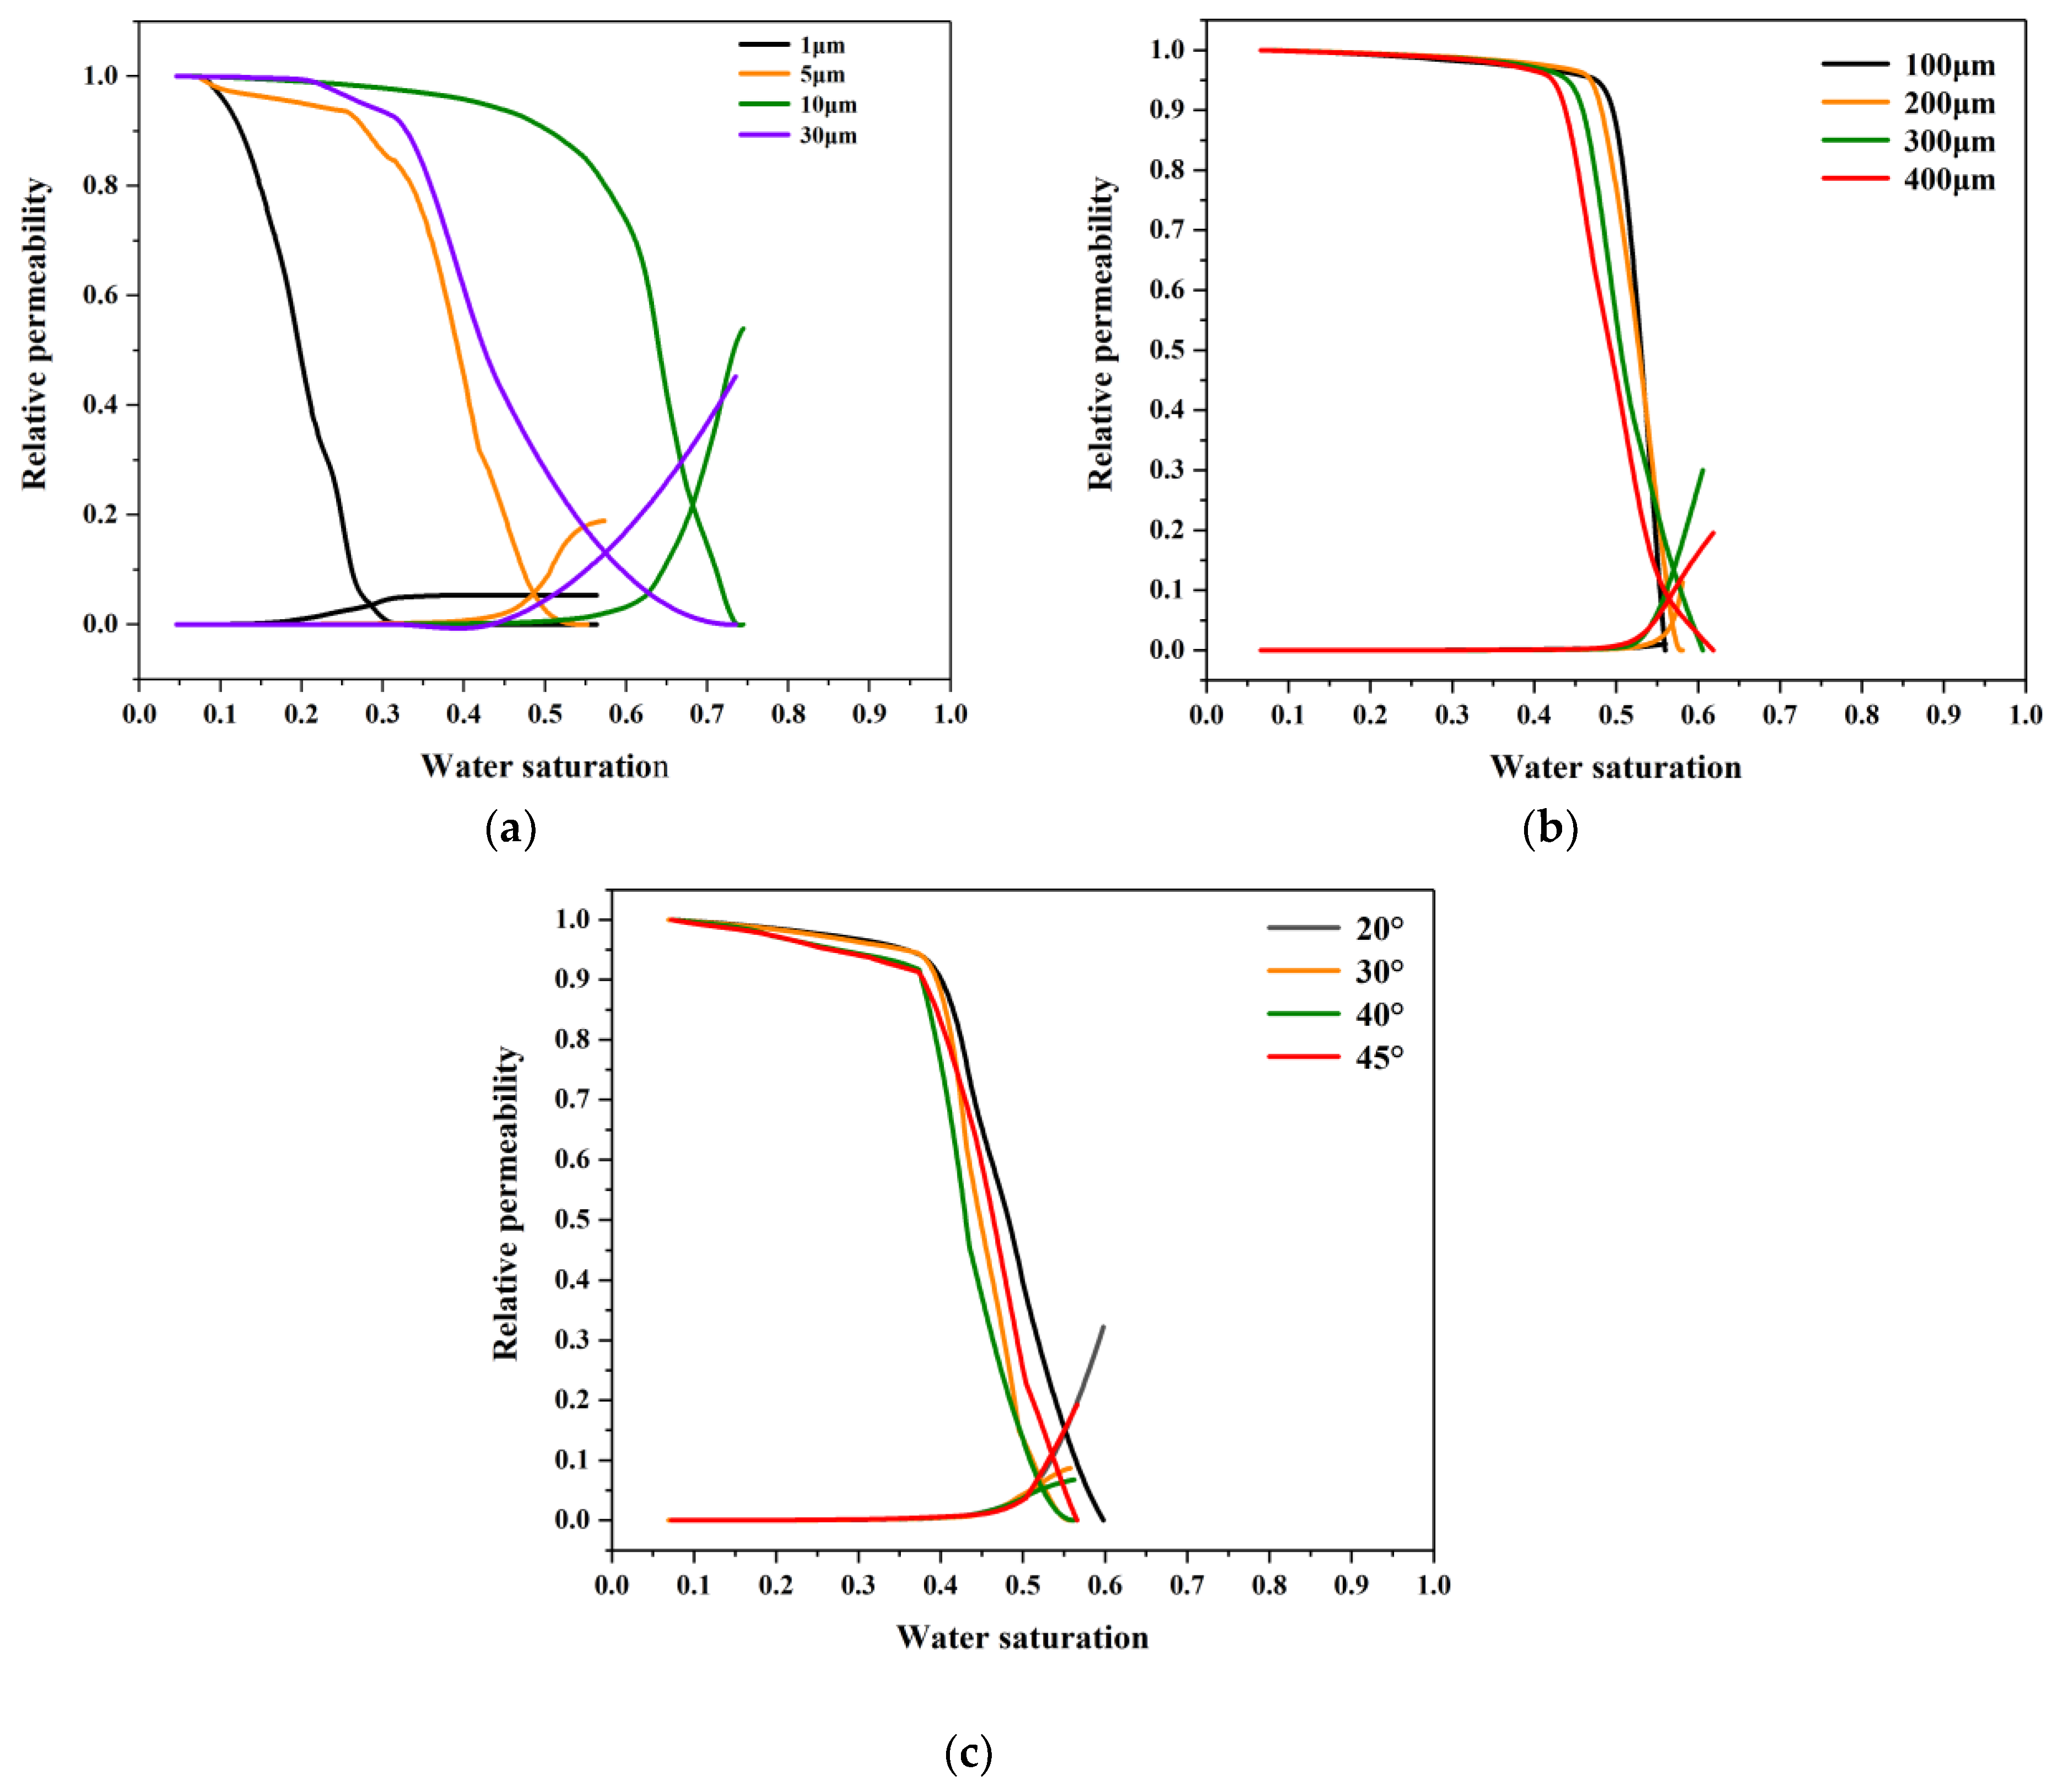
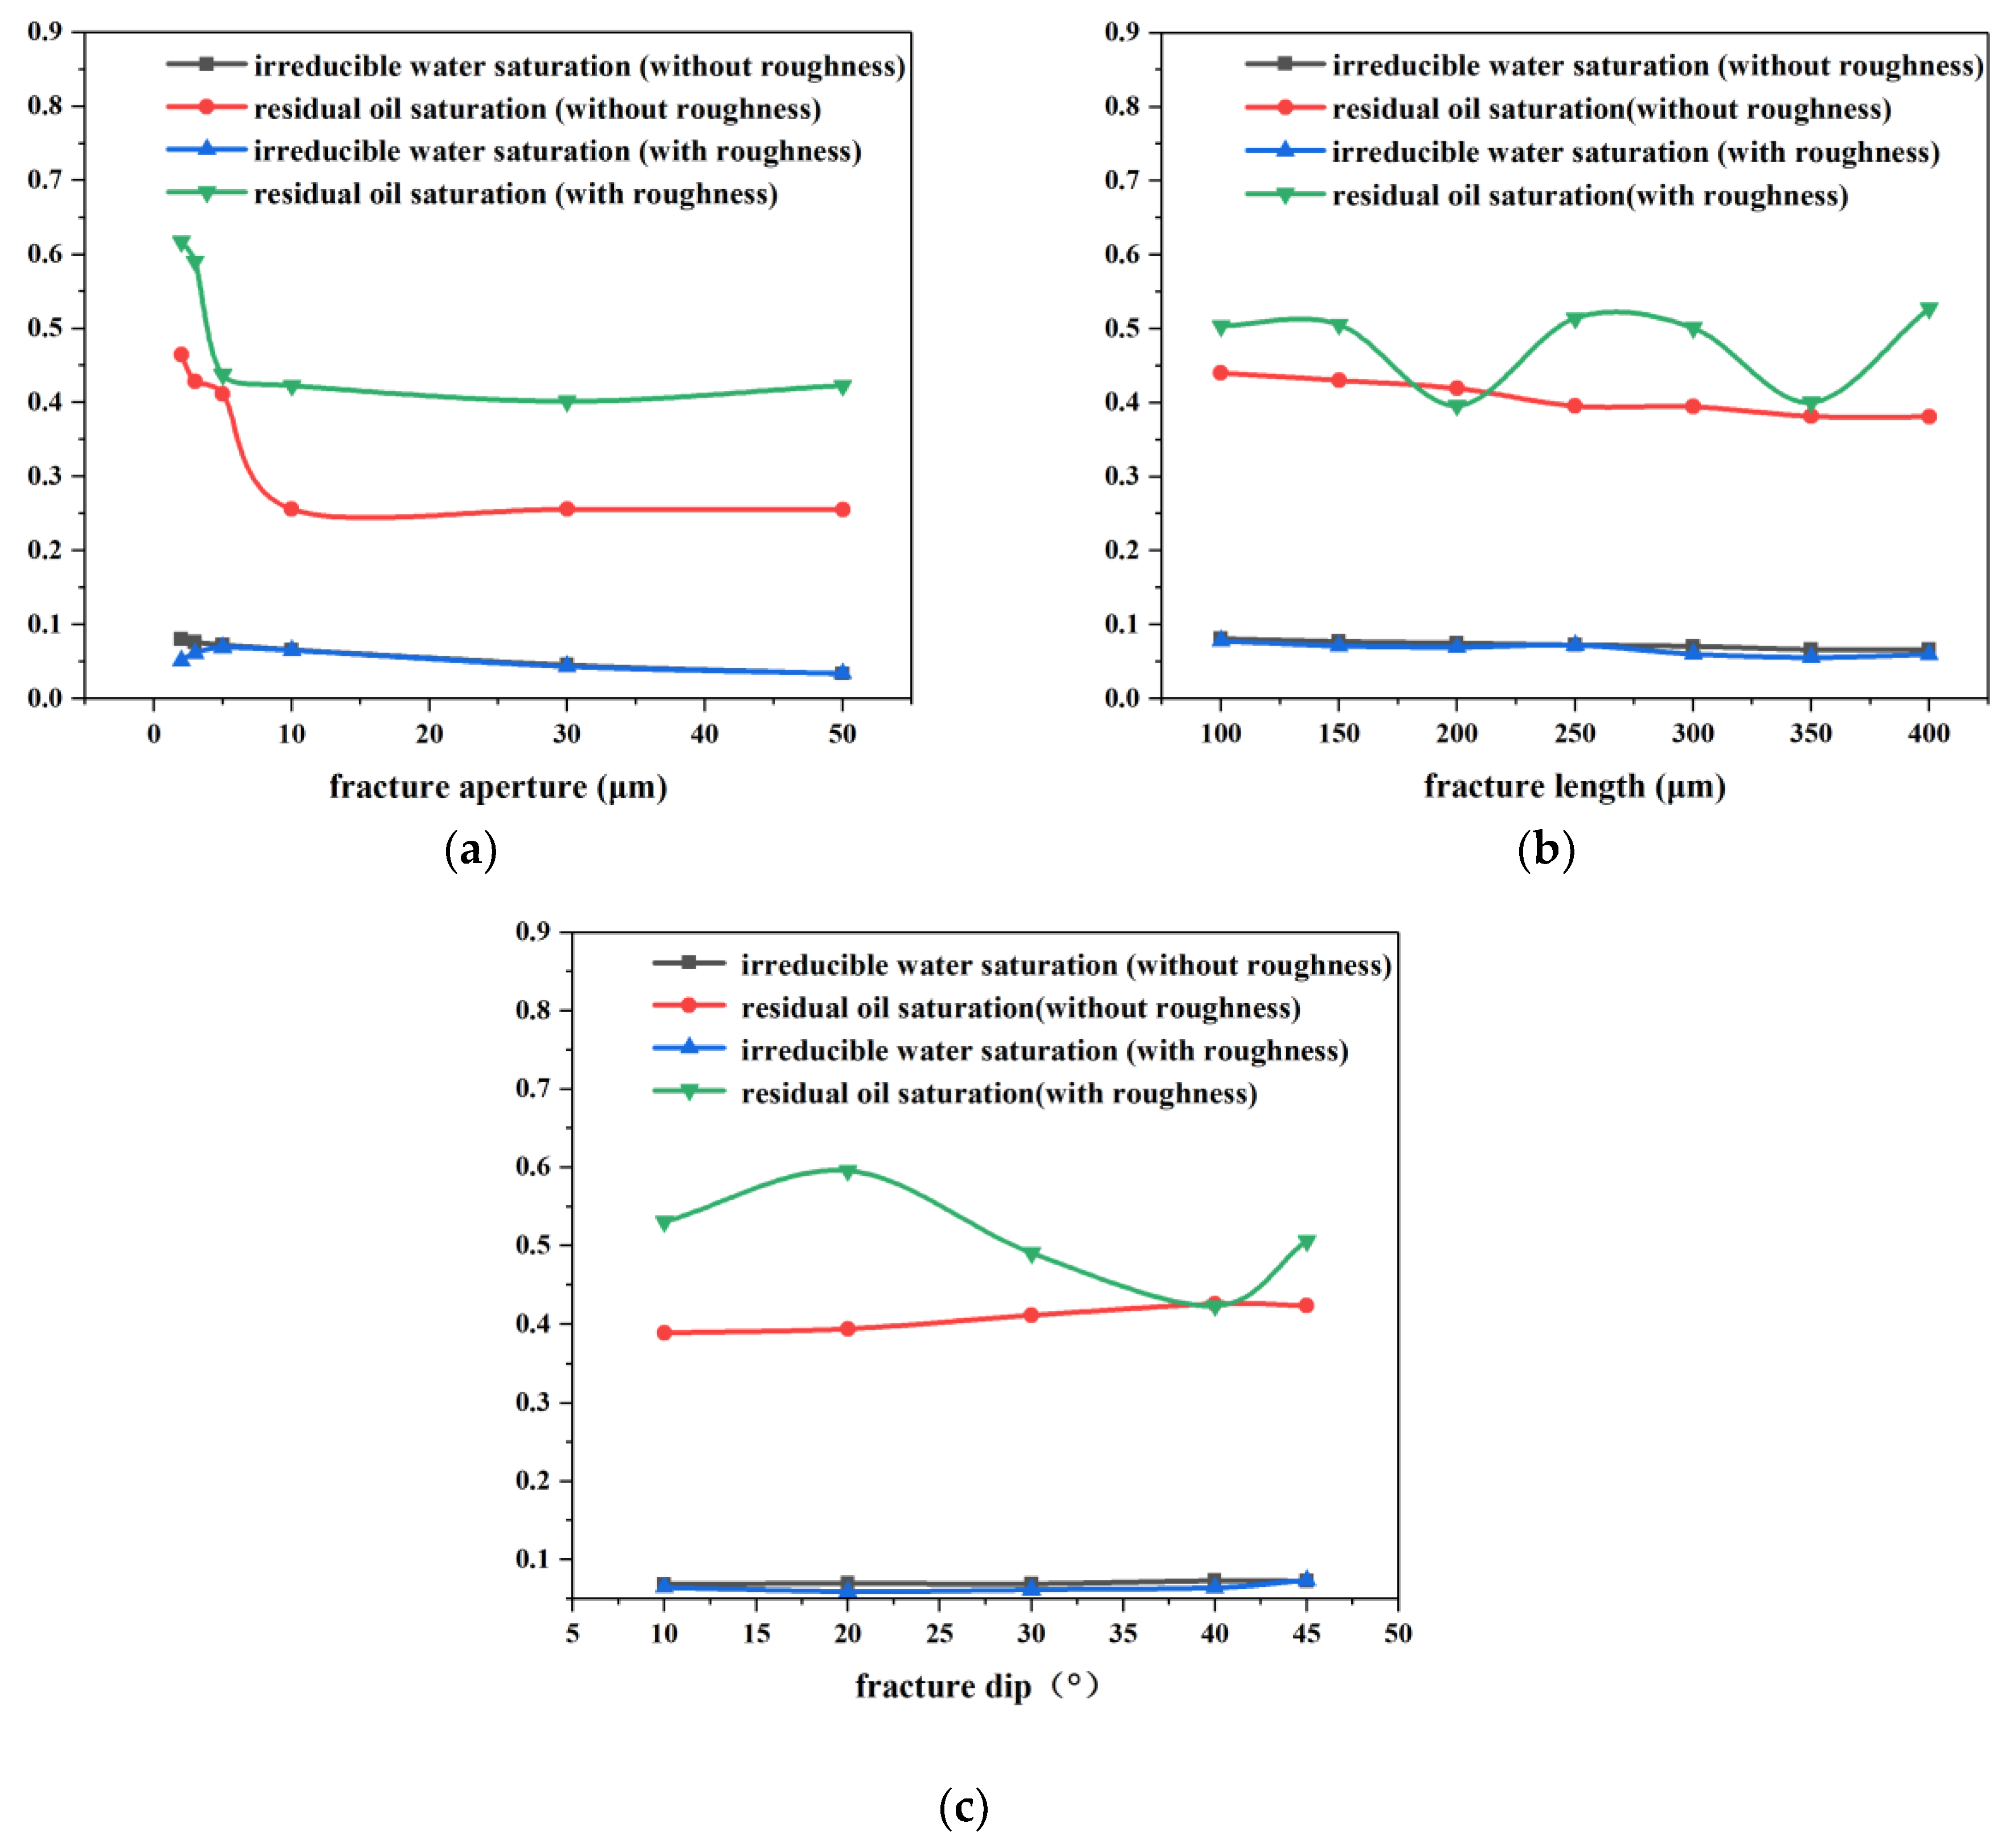
3.3. Effects of Micro-Fractures on Two-Phase Flow

The relative permeability of two-phase flow is also studied, as shown in Figure 17. As the fracture aperture increases, the irreducible water saturation and the residual oil saturation decrease, and the isotonic point shifts to the right. With the same fracture aperture, the relative permeability of the oil phase and the water phase has no noticeable change with the different fracture length or dip angle. Therefore, the fracture aperture has the most significant influence on the micro-fracture of the two-phase flow.
As the fracture aperture increases under water saturation, the seepage capacity of the water phase is weakened and the seepage capacity of the oil phase is enhanced. However, with the further increase of the fracture aperture, the relative permeability of the oil phase decreases slightly. The main reason is that the further increase of the fracture aperture makes the flow velocity of the water phase become larger. Additionally, it is easy to capture the oil phase, which makes the oil phase prone to discontinuity, resulting in a decrease in the relative permeability of the oil phase.
The irreducible water and residual oil saturation with varying fracture parameters are simulated, as shown in Figure 18.
It can be seen that the irreducible water saturation of the tight core remains basically unchanged, and the residual oil saturation is mainly related to the aperture due to the variation range. As the aperture increases, the residual oil saturation of the tight core decreases, and the decrease rate is high at the first stage and low at the second stage. With roughness, the residual oil saturation may have fluctuations when the aperture is relatively small, but with the increase of apertures, it shows the same variation tendency as that of the core with a smooth fracture.
The residual oil saturation firstly decreases at a fast rate, because the permeability of the oil phase increases remarkably with the increase of the micro-fracture aperture. The further increase of the fracture aperture makes the flow speed of the water phase become larger. Capturing the oil phase makes the oil phase prone to discontinuity, which hinders the flow of the oil phase, so the residual oil saturation decreases at a low rate at the second stage with the further increase of the aperture.
Meanwhile, compared with the core with a smooth fracture, on the condition of the same fracture aperture, the residual oil saturation of the core with a rough fracture is higher, and the irreducible water saturation is lower. The reason for this phenomenon is as follows. In hydrophilic rock, water is distributed on the surface of micro-fractures or particles, and flows along the surface, so the flow resistance is large. However, oil flows in the middle of micro-fractures or pores, and the resistance is small. When the degree of roughness is high, the actual area which the fluid flows through a section of the fracture wall is relatively large. Due to the hydrophobic effect of the rough surface on the fluid, the apparent contact angle is increased, and the hydrophilicity of the rock is weakened. The relative permeability of oil tends to decrease, and the relative permeability of water tends to increase, so the isotonic point moves to the left. Therefore, in the hydrophilic channel, the residual core has a higher residual oil saturation and a lower irreducible water saturation than those in the core with a smooth fracture as a whole. In addition, the presence of voids in each rough fracture wall causes a small portion of the oil to be trapped, which also increases the residual oil saturation.

4. Conclusions

In this paper, the effects of the micro-fracture aperture, length and dip angle on the pore-throat structure, single-phase flow, and two-phase flow with/without surface roughness are studied on the microscopic scale. While the aperture, length, and dip angle of micro-fractures all influence the flow, the fracture aperture is the most significant factor. Meanwhile, the roughness of the micro-fracture makes a difference.
For a micro-fracture without roughness, as the fracture aperture (or length) increases, the distribution of pore radius and throat radius becomes wider. The contribution of the pore and throat radius to the permeability is mainly distributed in the area where the pore and throat radius are large. For a single-phase flow, the absolute permeability in the fracture penetration direction is in a power–law relationship with the micro-fracture aperture, linear with the micro-fracture length, and linear with the cosine of the micro-fracture dip angle. For a two-phase flow, the irreducible water saturation basically remains unchanged, and the residual oil saturation is mainly related to the fracture aperture. As the aperture increases, the residual oil saturation decreases, and the rate of decrease is high at the first stage and low at the second stage.
For a micro-fracture with roughness, the pore throat structure is more diversified due to the roughness. The distribution of the radius of pores and throats is wider. The contribution of the pore and throat radius to the permeability is mainly distributed in the area where the pore and throat radius are small. For a single-phase flow, the resistance of the fluid increases due to the retention and drag effects on the fluid of the rough fracture surface, thereby causing the absolute permeability to be smaller. For a two-phase flow, a small portion of the oil is trapped in the void due to the existence of voids in each rough fracture wall, and the residual oil saturation is higher.

Author Contributions

Conceptualization, H.S., L.D., W.F., D.F., L.Z., Y.Y. and J.Z.; Data curation, L.D.; Formal analysis, H.S., L.D., L.L., W.F., D.F., L.Z., Y.Y. and J.Z.; Funding acquisition, J.Y.; Investigation, L.D., D.F. and J.Z.; Methodology, H.S., L.D., L.L., W.F., D.F., L.Z. and Y.Y.; Project administration, H.S. and J.Y.; Resources, H.S., L.L. and J.Y.; Software, L.D., L.L., W.F. and L.Z.; Supervision, H.S., D.F. and J.Y.; Validation, L.D. and W.F.; Writing—original draft, L.D.; Writing—review and editing, H.S. and L.D.

Funding

This research was funded by the Major Projects of the National Science and Technology (No. 2016ZX05061, No. 2016ZX05060 and No. 2017ZX05009), National Natural Science Foundation of China (No. 51490654), the Fundamental Research Funds for the Central Universities (No. 17CX02008A).

Acknowledgments

The authors thank the editor and reviewers for the careful reading and valuable suggestions in the process of manuscript revision.

Conflicts of Interest

The authors declare no conflict of interest.

References

  1. Xuming, B.; Shenghui, Y.; Zedan, W.; Jingguo, C.; Xiaodong, W.; Qing, H. Digital geophones and exploration of tight oil. In SEG Technical Program Expanded Abstracts 2014; Society of Exploration Geophysicists: Tulsa, OK, USA, 2014; pp. 254–258. [Google Scholar]
  2. Kathel, P.; Mohanty, K.K. EOR in Tight Oil Reservoirs through Wettability Alteration. Society of Petroleum Engineers. In Proceedings of the SPE Annual Technical Conference and Exhibition, New Orleans, LA, USA, 30 September–2 October 2013; Society of Petroleum Engineers: Richardson, TX, USA, 2013. [Google Scholar]
  3. Gao, H.; Li, H. Determination of movable fluid percentage and movable fluid porosity in ultra-low permeability sandstone using nuclear magnetic resonance (NMR) technique. J. Pet. Sci. Eng. 2015, 133, 258–267. [Google Scholar] [CrossRef]
  4. Bennion, D.B.; Thomas, F.B.; Bietz, R.F. Low permeability gas reservoirs: Problems, opportunities and solutions for drilling, completion, stimulation and production. In Proceedings of the SPE Gas Technology Symposium, Calgary, AB, Canada, 28 April–1 May 1996; Society of Petroleum Engineers: Richardson, TX, USA, 1996. [Google Scholar]
  5. Yao, J.; Sun, H.; Huang, Z.; Zhang, L.; Zeng, Q.; Sui, H.; Fan, D. Key mechanical problems in the development of shale gas reservoirs. Sci. Sin. Phys. Mech. Astron. 2013, 43, 1527. [Google Scholar]
  6. Fan, W.; Sun, H.; Yao, J.; Fan, D.; Yang, Y. An upscaled transport model for shale gas considering multiple mechanisms and heterogeneity based on homogenization theory. J. Pet. Sci. Eng. 2019, 183, 106392. [Google Scholar] [CrossRef]
  7. Liu, L.; Yao, J.; Sun, H.; Zhang, L.; Yang, Y. Reconstruction of digital rock considering micro-fracture based on multi-point statistics. Chin. Sci. Bull. 2018, 63, 3146–3157. [Google Scholar] [CrossRef] [Green Version]
  8. Aguilera, R. Flow units: From conventional to tight gas to shale gas reservoirs. In Proceedings of the Trinidad and Tobago Energy Resources Conference, Port of Spain, Trinidad, 27–30 June 2010; Society of Petroleum Engineers: Richardson, TX, USA, 2010. [Google Scholar]
  9. Fischer, T.; Tomizawa, H. Interaction of tribochemistry and microfracture in the friction and wear of silicon nitride. Wear 1985, 105, 29–45. [Google Scholar] [CrossRef]
  10. Perez, J.; Poston, S.; Edwards, C. The effect of micro-fractures on oil recovery from low-permeability reservoirs. In Proceedings of the Low Permeability Reservoirs Symposium, Denver, CO, USA, 26–28 April 1993; Society of Petroleum Engineers: Richardson, TX, USA, 1993. [Google Scholar]
  11. Wang, X.; Yao, J.; Gong, L.; Sun, H.; Yang, Y.; Zhang, L.; Li, Y.; Liu, W. Numerical simulations of proppant deposition and transport characteristics in hydraulic fractures and fracture networks. J. Pet. Sci. Eng. 2019, 183, 106401. [Google Scholar] [CrossRef]
  12. Yao, J.; Sun, H.; Fan, D.; Wang, C.; Sun, Z. Numerical simulation of gas transport mechanisms in tight shale gas reservoirs. Pet. Sci. 2013, 10, 528–537. [Google Scholar] [CrossRef] [Green Version]
  13. Yang, Y.; Wang, K.; Zhang, L.; Sun, H.; Zhang, K.; Ma, J. Pore-scale simulation of shale oil flow based on pore network model. Fuel 2019, 251, 683–692. [Google Scholar] [CrossRef]
  14. Xiaomin, Z.; Lei, S.; Lei, W. Large-scale visible water/oil displacing physical modeling experiment and mechanism research of fracture vuggy reservoir. Geol. Sci. Technol. Inf. 2010, 29, 77–81. [Google Scholar]
  15. Zhao, Z.; Li, B.; Jiang, Y. Effects of fracture surface roughness on macroscopic fluid flow and solute transport in fracture networks. Rock Mech. Rock Eng. 2014, 47, 2279–2286. [Google Scholar] [CrossRef]
  16. Luo, S.; Zhao, Z.; Peng, H.; Pu, H. The role of fracture surface roughness in macroscopic fluid flow and heat transfer in fractured rocks. Int. J. Rock Mech. Min. Sci. 2016, 87, 29–38. [Google Scholar] [CrossRef]
  17. Wu, K.; Li, X.; Wang, C.; Chen, Z.; Yu, W. A model for gas transport in microfractures of shale and tight gas reservoirs. AIChE J. 2015, 61, 2079–2088. [Google Scholar] [CrossRef]
  18. Yang, Y.; Liu, Z.; Yao, J.; Zhang, L.; Ma, J.; Hejazi, S.H.; Luquot, L.; Ngarta, T.D. Flow Simulation of Artificially Induced Microfractures Using Digital Rock and Lattice Boltzmann Methods. Energies 2018, 11, 2145. [Google Scholar] [CrossRef]
  19. Blunt, M.J. Flow in porous media—Pore-network models and multiphase flow. Curr. Opin. Colloid Interface Sci. 2001, 6, 197–207. [Google Scholar] [CrossRef]
  20. An, S.; Yao, J.; Yang, Y.; Zhang, L.; Zhao, J.; Gao, Y. Influence of pore structure parameters on flow characteristics based on a digital rock and the pore network model. J. Nat. Gas Sci. Eng. 2016, 31, 156–163. [Google Scholar] [CrossRef]
  21. Al-Marzouqi, H. Digital rock physics: Using CT scans to compute rock properties. IEEE Signal Process. Mag. 2018, 35, 121–131. [Google Scholar] [CrossRef]
  22. Sun, H.; Yao, J.; Cao, Y.C.; Fan, D.Y.; Zhang, L. Characterization of gas transport behaviors in shale gas and tight gas reservoirs by digital rock analysis. Int. J. Heat Mass Transf. 2017, 104, 227–239. [Google Scholar] [CrossRef]
  23. Wang, M.; Chen, Y.F.; Ma, G.W.; Zhou, J.Q.; Zhou, C.B. Influence of surface roughness on nonlinear flow behaviors in 3D self-affine rough fractures: Lattice Boltzmann simulations. Adv. Water Resour. 2016, 96, 373–388. [Google Scholar] [CrossRef]
  24. Brown, S.R. A note on the description of surface roughness using fractal dimension. Geophys. Res. Lett. 1987, 14, 1095–1098. [Google Scholar] [CrossRef]
  25. Zhu, H.; Ge, S.; Huang, X.; Zhang, D.; Liu, J. Experimental study on the characterization of worn surface topography with characteristic roughness parameter. Wear 2003, 255, 309–314. [Google Scholar] [CrossRef]
  26. Wang, J.S.; Stauffer, D. Fractal dimension of 3D Ising droplets. Z. Phys. B Condens. Matter 1990, 78, 145–146. [Google Scholar] [CrossRef]
  27. Sjodin, B. How to Generate Random Surfaces in COMSOL Multiphysics®. Available online: https://www.comsol.com/blogs/how-to-generate-random-surfaces-in-comsol-multiphysics/ (accessed on 2 June 2017).
  28. Silin, D.; Patzek, T. Pore space morphology analysis using maximal inscribed spheres. Phys. A Stat. Mech. Appl. 2006, 371, 336–360. [Google Scholar] [CrossRef]
  29. Bin, B.; Rukai, Z.; Songtao, W.; Wenjing, Y.; Gelb, J.; Gu, A.; Zhang, X.; Ling, S. Multi-scale method of Nano (Micro)-CT study on microscopic pore structure of tight sandstone of Yanchang Formation, Ordos Basin. Pet. Explor. Dev. 2013, 40, 354–358. [Google Scholar]
  30. Joekar-Niasar, V.; Hassanizadeh, S. Analysis of fundamentals of two-phase flow in porous media using dynamic pore-network models: A review. Crit. Rev. Environ. Sci. Technol. 2012, 42, 1895–1976. [Google Scholar] [CrossRef]
  31. Blunt, M.J.; Jackson, M.D.; Piri, M.; Valvatne, P.H. Detailed physics, predictive capabilities and macroscopic consequences for pore-network models of multiphase flow. Adv. Water Resour. 2002, 25, 1069–1089. [Google Scholar] [CrossRef]
  32. Bakke, S.; Øren, P.E. 3-D pore-scale modelling of sandstones and flow simulations in the pore networks. SPE J. 1997, 2, 136–149. [Google Scholar] [CrossRef]
  33. Patankar, S.V.; Spalding, D.B. A calculation procedure for heat, mass and momentum transfer in three-dimensional parabolic flows. Int. J. Heat Mass Transf. 1972, 15, 1787–1806. [Google Scholar] [CrossRef]
  34. Guo, Y.; Zhang, L.; Zhu, G.; Yao, J.; Sun, H.; Song, W.; Yang, Y.; Zhao, J. A Pore-Scale Investigation of Residual Oil Distributions and Enhanced Oil Recovery Methods. Energies 2019, 12, 3732. [Google Scholar] [CrossRef]
  35. Zhang, L.; Jing, W.; Yang, Y.; Yang, H.; Guo, Y.; Sun, H.; Zhao, J.; Yao, J. The Investigation of Permeability Calculation Using Digital Core Simulation Technology. Energies 2019, 12, 3273. [Google Scholar] [CrossRef]
  36. Fan, W.; Sun, H.; Yao, J.; Fan, D.; Yang, Y. Homogenization approach for liquid flow within shale system considering slip effect. J. Clean. Prod. 2019, 235, 146–157. [Google Scholar] [CrossRef]
  37. Zhu, G.; Chen, H.; Yao, J.; Sun, S. Efficient energy-stable schemes for the hydrodynamics coupled phase-field model. Appl. Math. Model. 2019, 70, 82–108. [Google Scholar] [CrossRef]
Figure 1. Digital cores of tight sandstones with smooth fracture (a) and with rough fracture (b).
Energies 12 04104 g001
Figure 2. Fluid flow of the pore-network model.
Energies 12 04104 g002
Figure 3. The pressure field in the 3D model (a) and velocity field in the outlet (b) calculated by OpenFOAM®.
Energies 12 04104 g003
Figure 4. The pore-network model of the digital core.
Energies 12 04104 g004
Figure 5. The digital cores of the tight sandstone with fracture aperture 2 μm (a), 10 μm (b), 30 μm (c) and 50 μm (d).
Energies 12 04104 g005
Figure 6. The pore-network models of the tight sandstone with fracture aperture 2 μm (a), 10 μm (b), 30 μm (c) and 50 μm (d).
Energies 12 04104 g006
Figure 7. The digital cores of the tight sandstone with fracture length 50 μm (a), 200 μm (b), 300 μm (c) and 450 μm (d).
Energies 12 04104 g007
Figure 8. The pore-network models of the tight sandstone with fracture length 50 μm (a), 200 μm (b), 300 μm (c) and 450 μm (d).
Energies 12 04104 g008
Figure 9. The digital cores of the tight sandstone with fracture dip angle 10° (a), 20° (b), 30° (c) and 40° (d).
Energies 12 04104 g009
Figure 10. The pore-network models of the tight sandstone with fracture dip angle 10° (a), 20° (b), 30° (c) and 40° (d).
Energies 12 04104 g010
Figure 11. Pore radius distribution with different fracture apertures (a) and lengths (b).
Energies 12 04104 g011
Figure 12. Contribution rate of pore radius to permeability with different fracture apertures (a) and lengths (b).
Energies 12 04104 g012
Figure 13. Throat radius distribution with different fracture apertures (a) and lengths (b).
Energies 12 04104 g013
Figure 14. Contribution rate of throat radius to permeability with different fracture apertures (a) and lengths (b).
Energies 12 04104 g014
Figure 15. Absolute permeability with different fracture apertures (a), lengths (b) and dip angles (c).
Energies 12 04104 g015
Figure 16. The digital cores with the fracture of length 300μm without roughness (a) and with roughness (c); the pore-network models with the fracture of length 300 μm without roughness (b) and with roughness (d).
Energies 12 04104 g016
Figure 17. Relative permeability curves with different fracture apertures (a), lengths (b) and dip angles (c).
Energies 12 04104 g017
Figure 18. Irreducible water and residual oil saturation with different fracture apertures (a), lengths (b) and dip angles (c).
Energies 12 04104 g018
Table 1. The comparison between the two methods.
Permeability by Method 1 (md)Permeability by Method 2 (md)Relative Error (%)
K110.319.398.92
K210.629.669.04
K311.5310.528.76
K412.4511.259.64
K513.5612.368.85

