Application Assessment of Pumped Storage and Lithium-Ion Batteries on Electricity Supply Grid

Abstract
1. Introduction
2. Storage Capacity Review
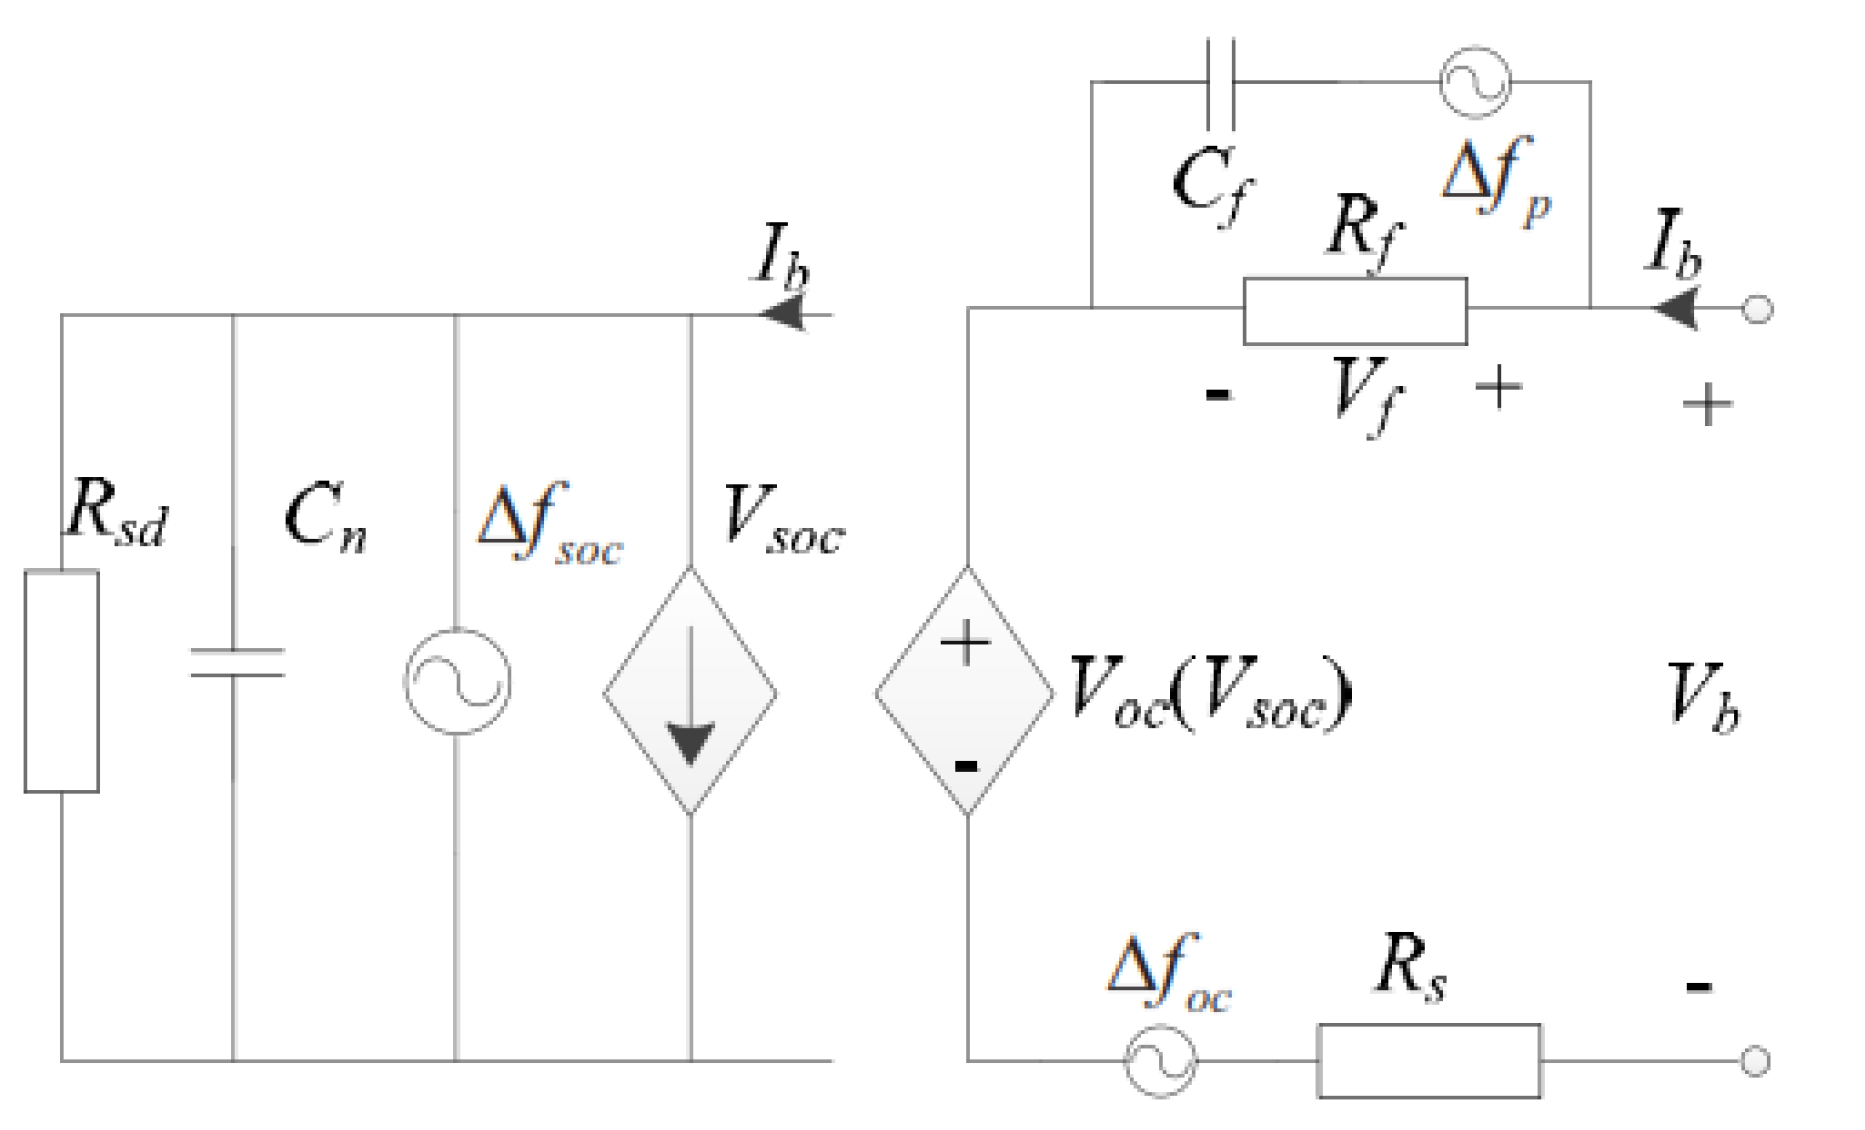
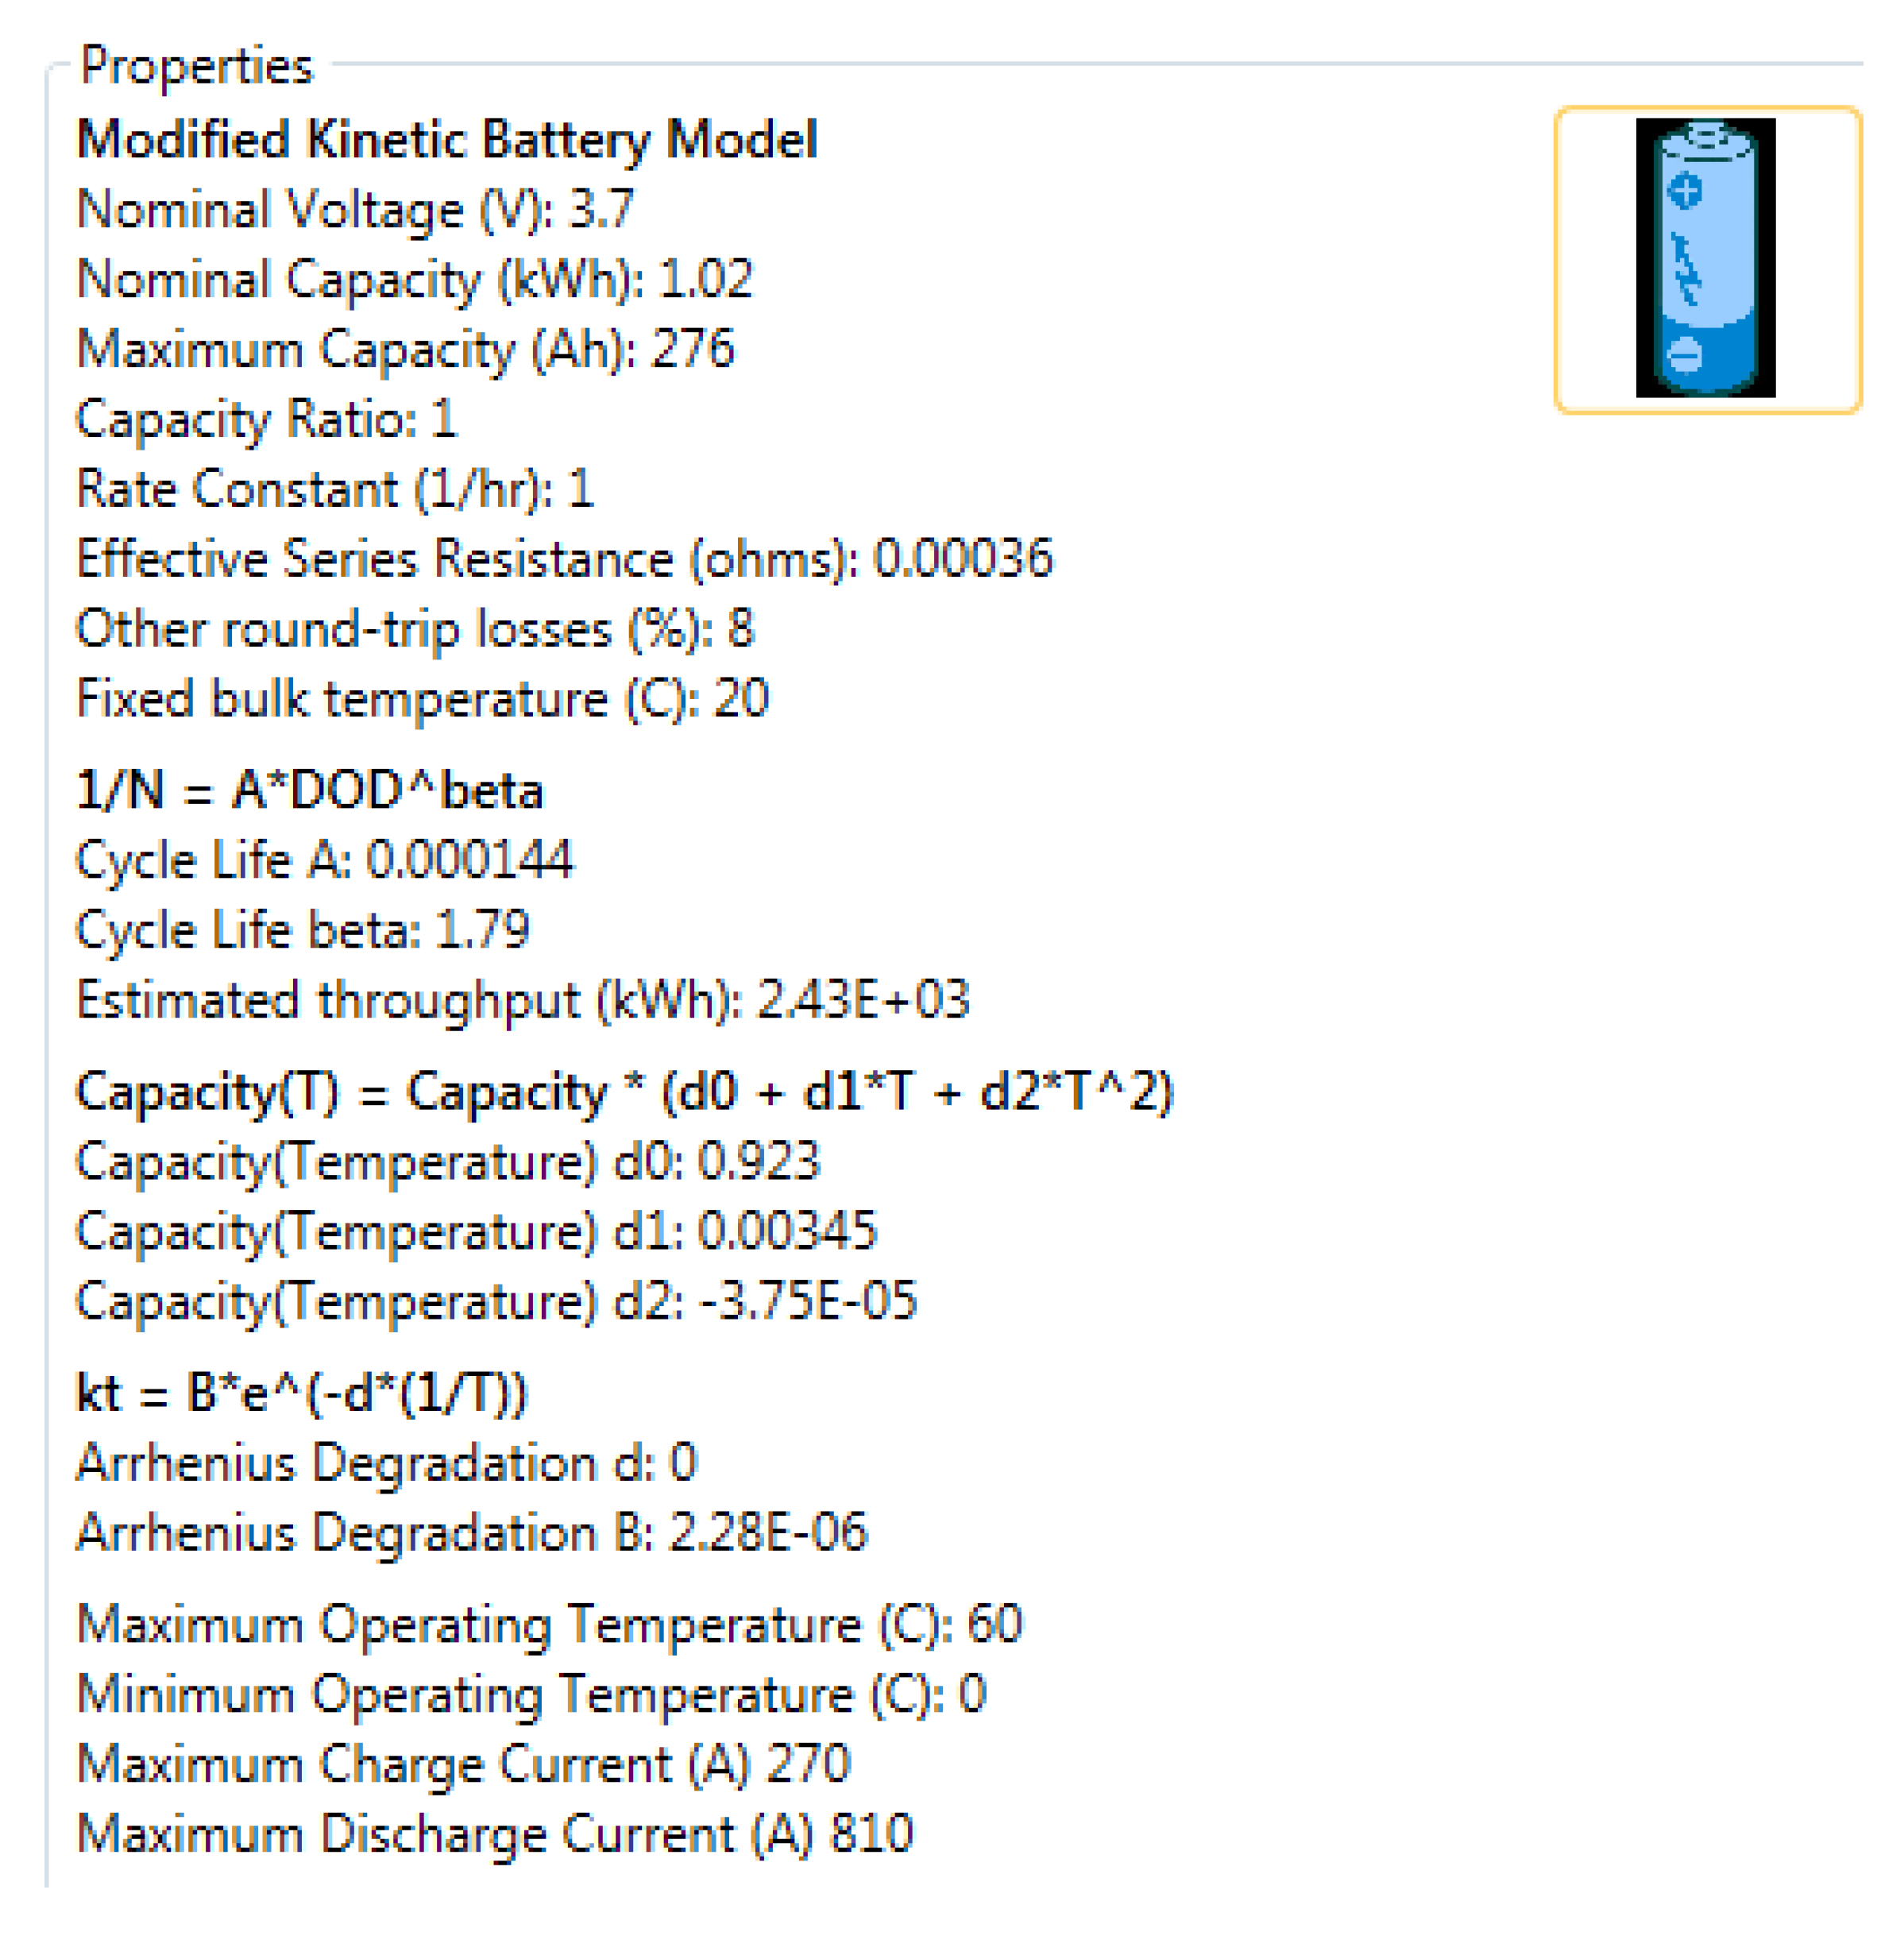
2.1. Lithium-Ion Batteries
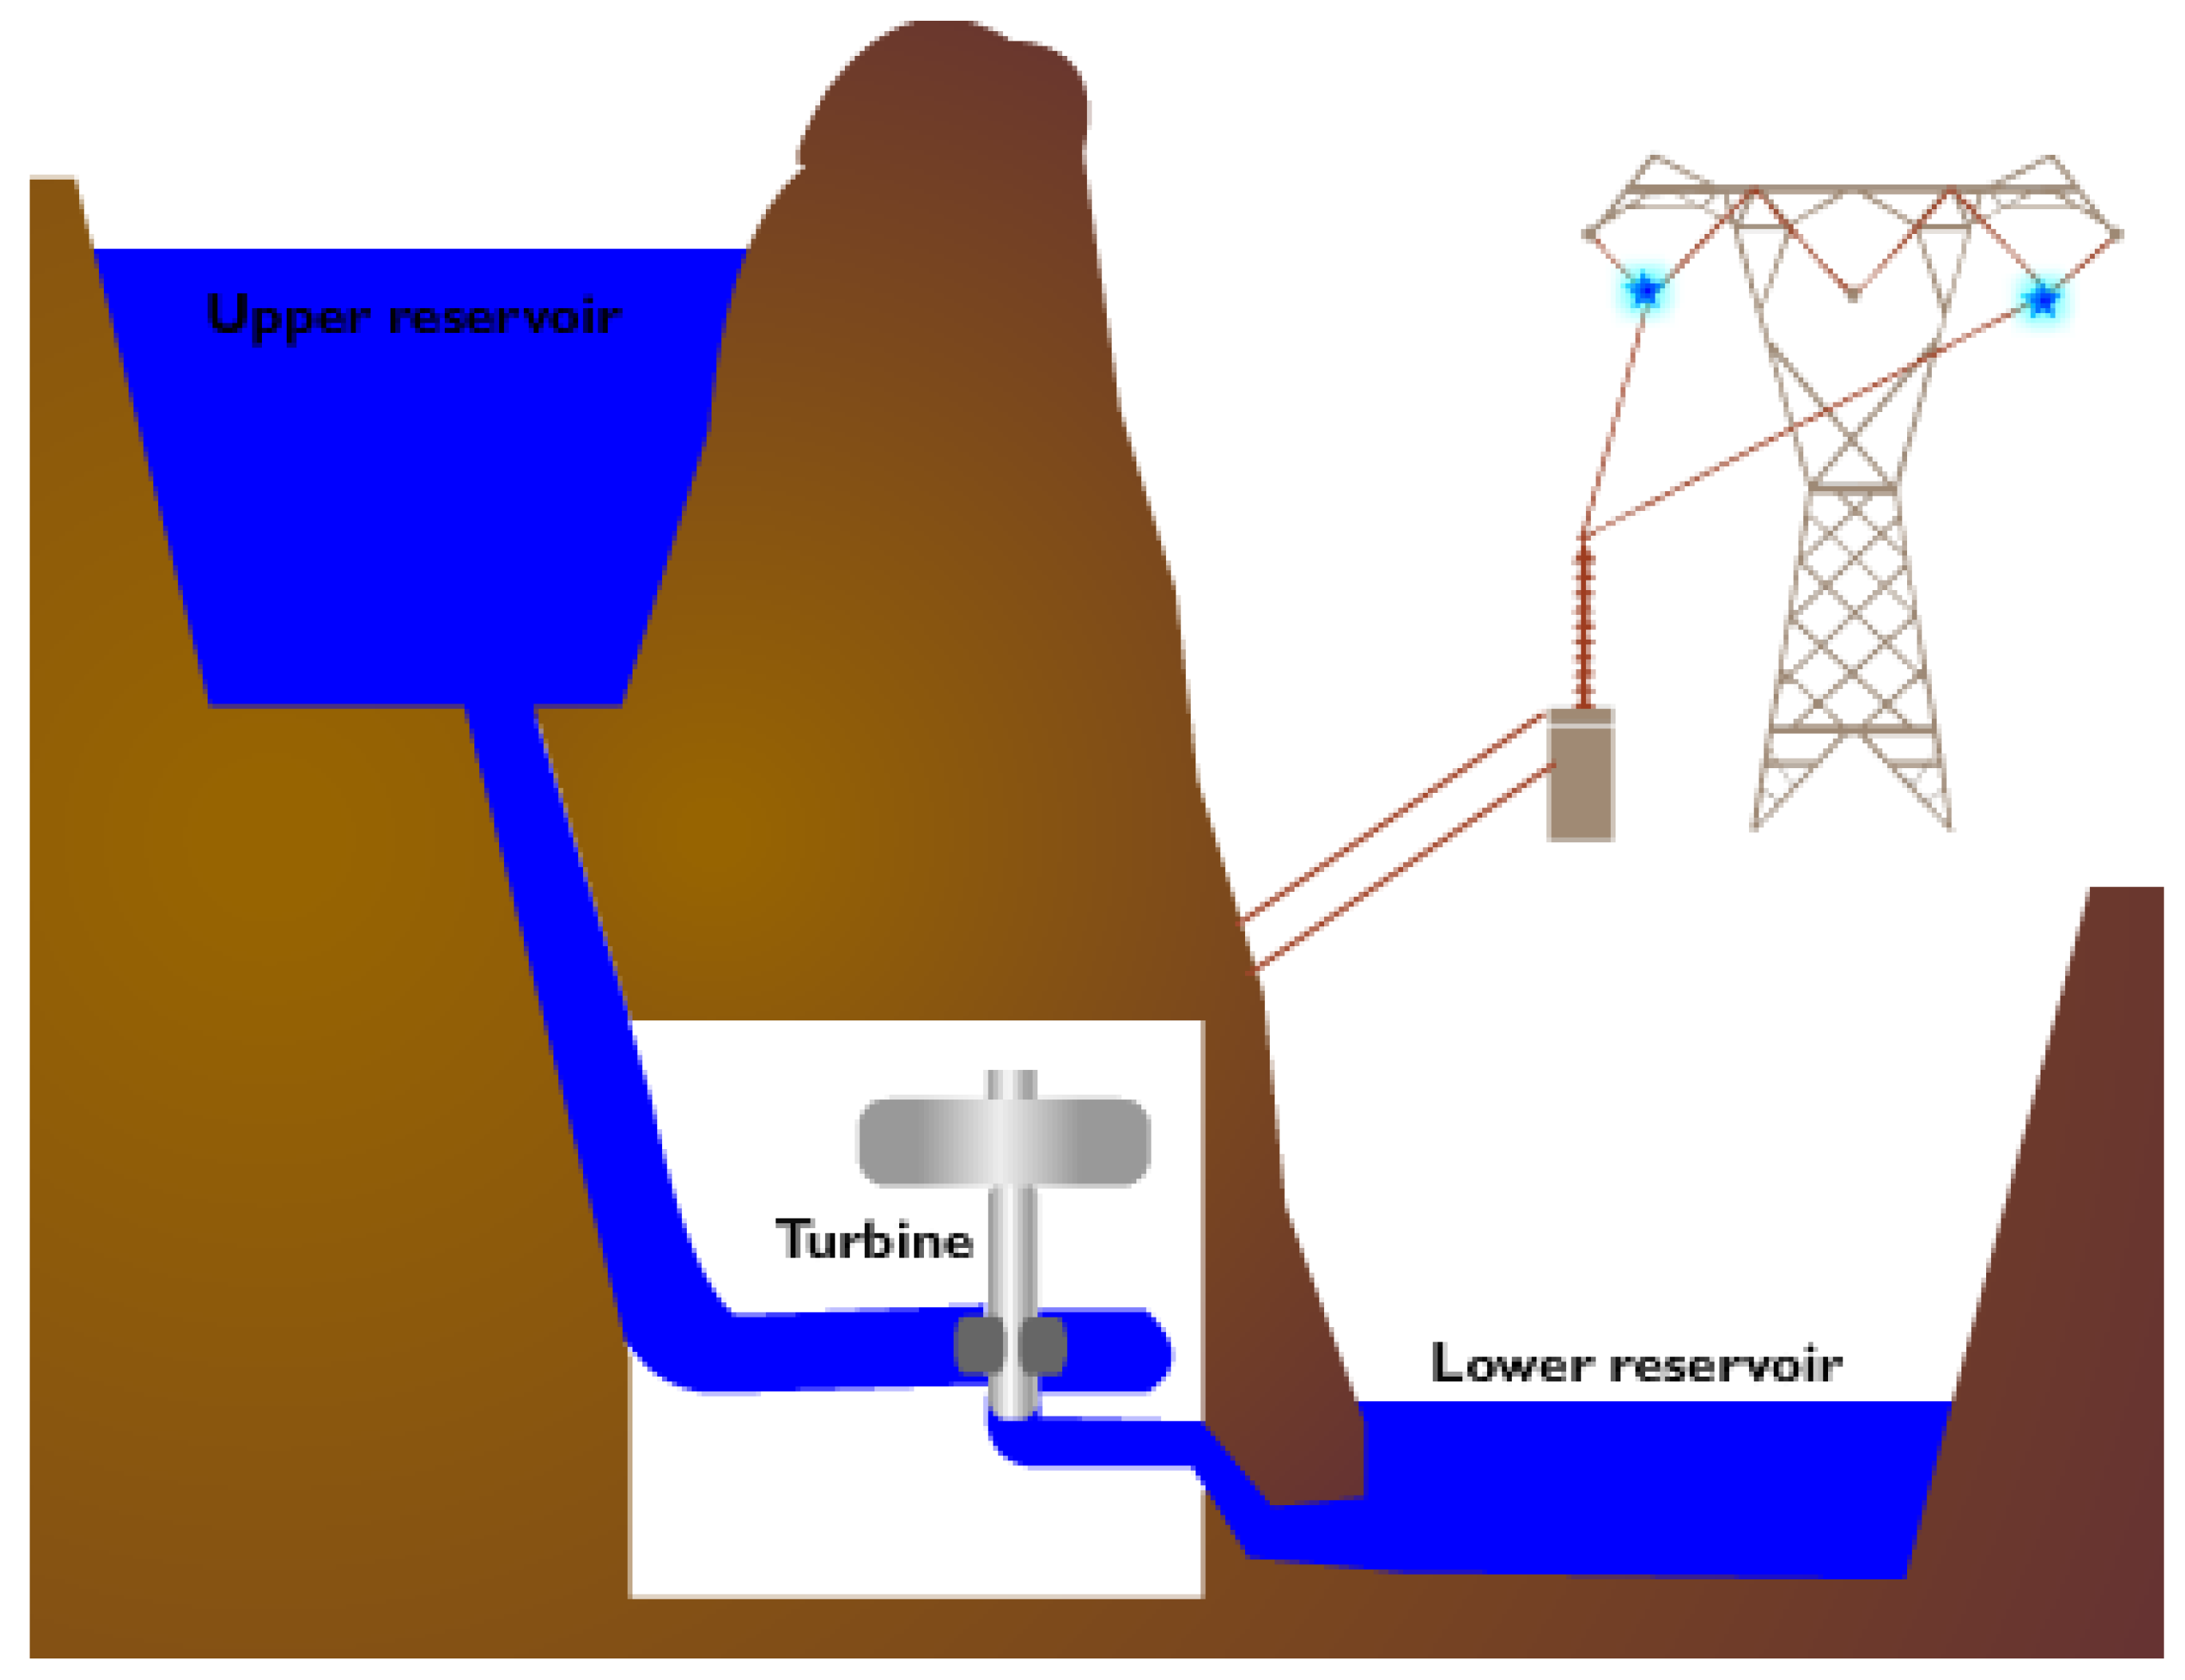
2.2. Pumped Storage
2.3. Supercapacitors
2.4. Lead Acid Batteries
2.5. Battery Management System
Cost Reduction on Storage Batteries
2.6. Storage Capacity Review Conclusion
3. Investigation Approach and Methodology
4. Simulation, Results and Discussion with Investigation
- Case study 1: 5 MW Load, PV Plant and 20% Storage Battery Capacity.
- Case study 2: 5 MW Load, PV Plant and 20% Pump Storage Plant.
- Case study 3: 3 MW Load, PV Plant and 20% Storage Battery Capacity.
- Case study 4: 3 MW Load, PV Plant and 20% Pump Storage Plant.
- Case study 5: 1 MW Load, PV Plant and 20% Storage Battery Capacity.
- Case study 6: 1 MW Load, PV Plant and 20% Pump Storage Plant.
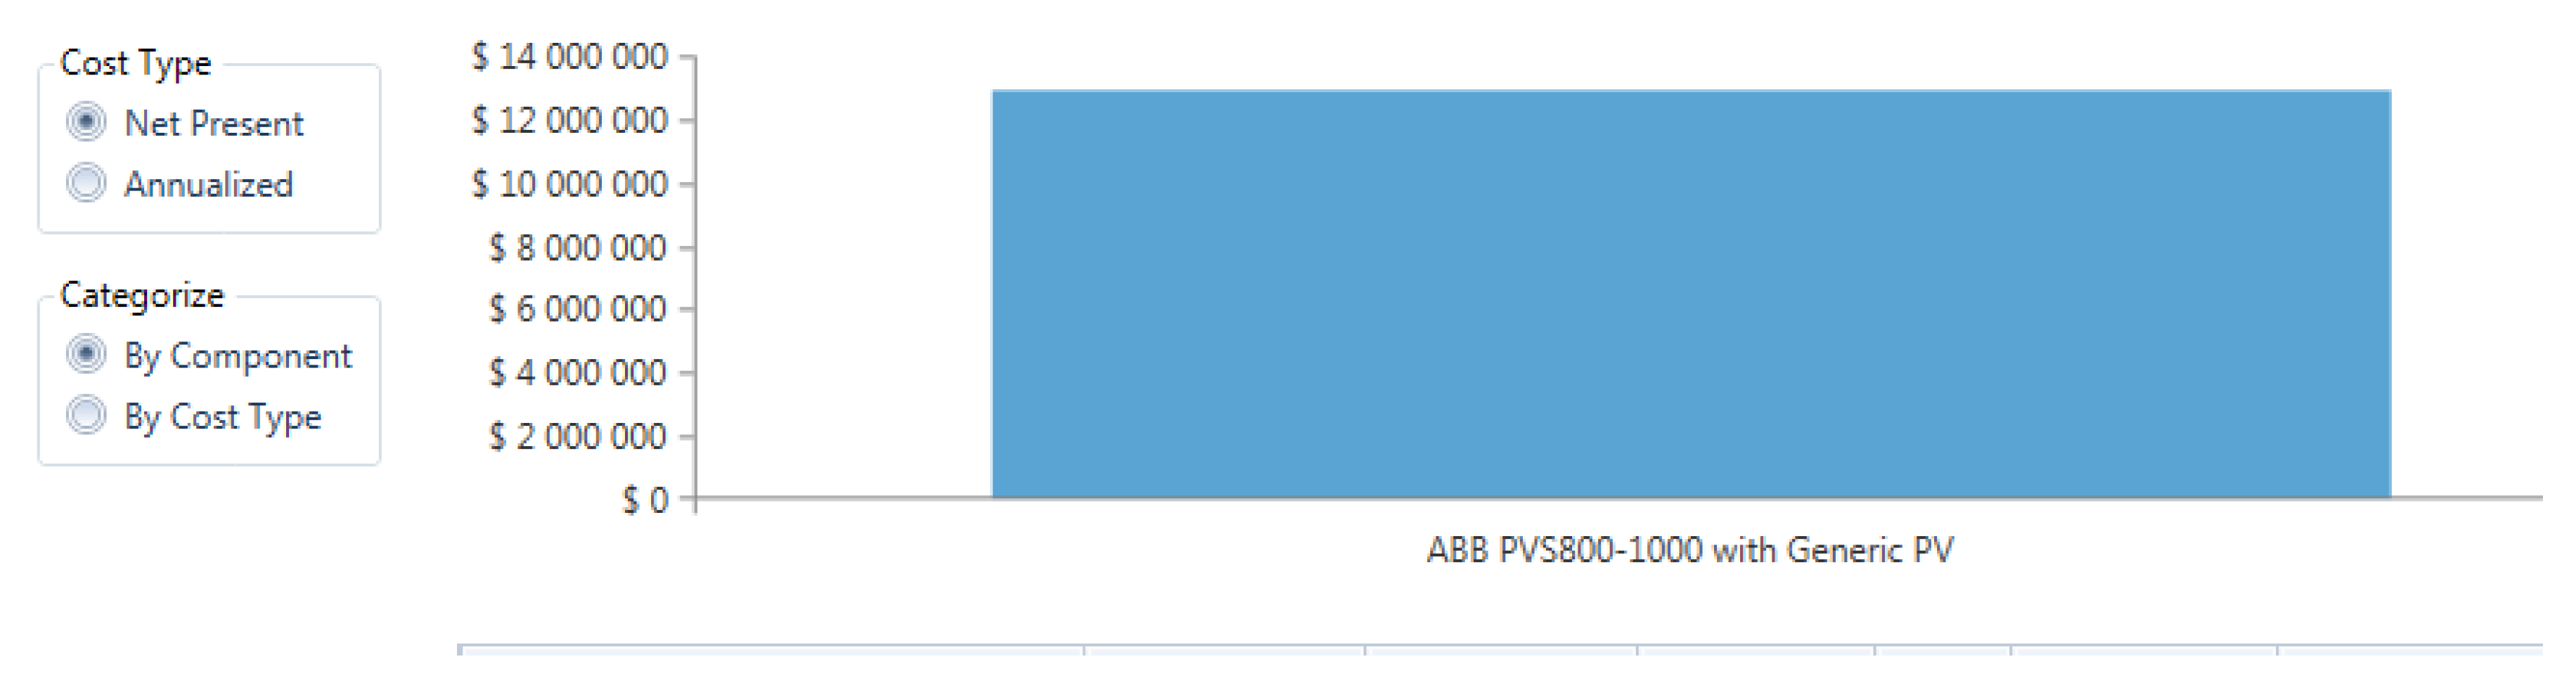
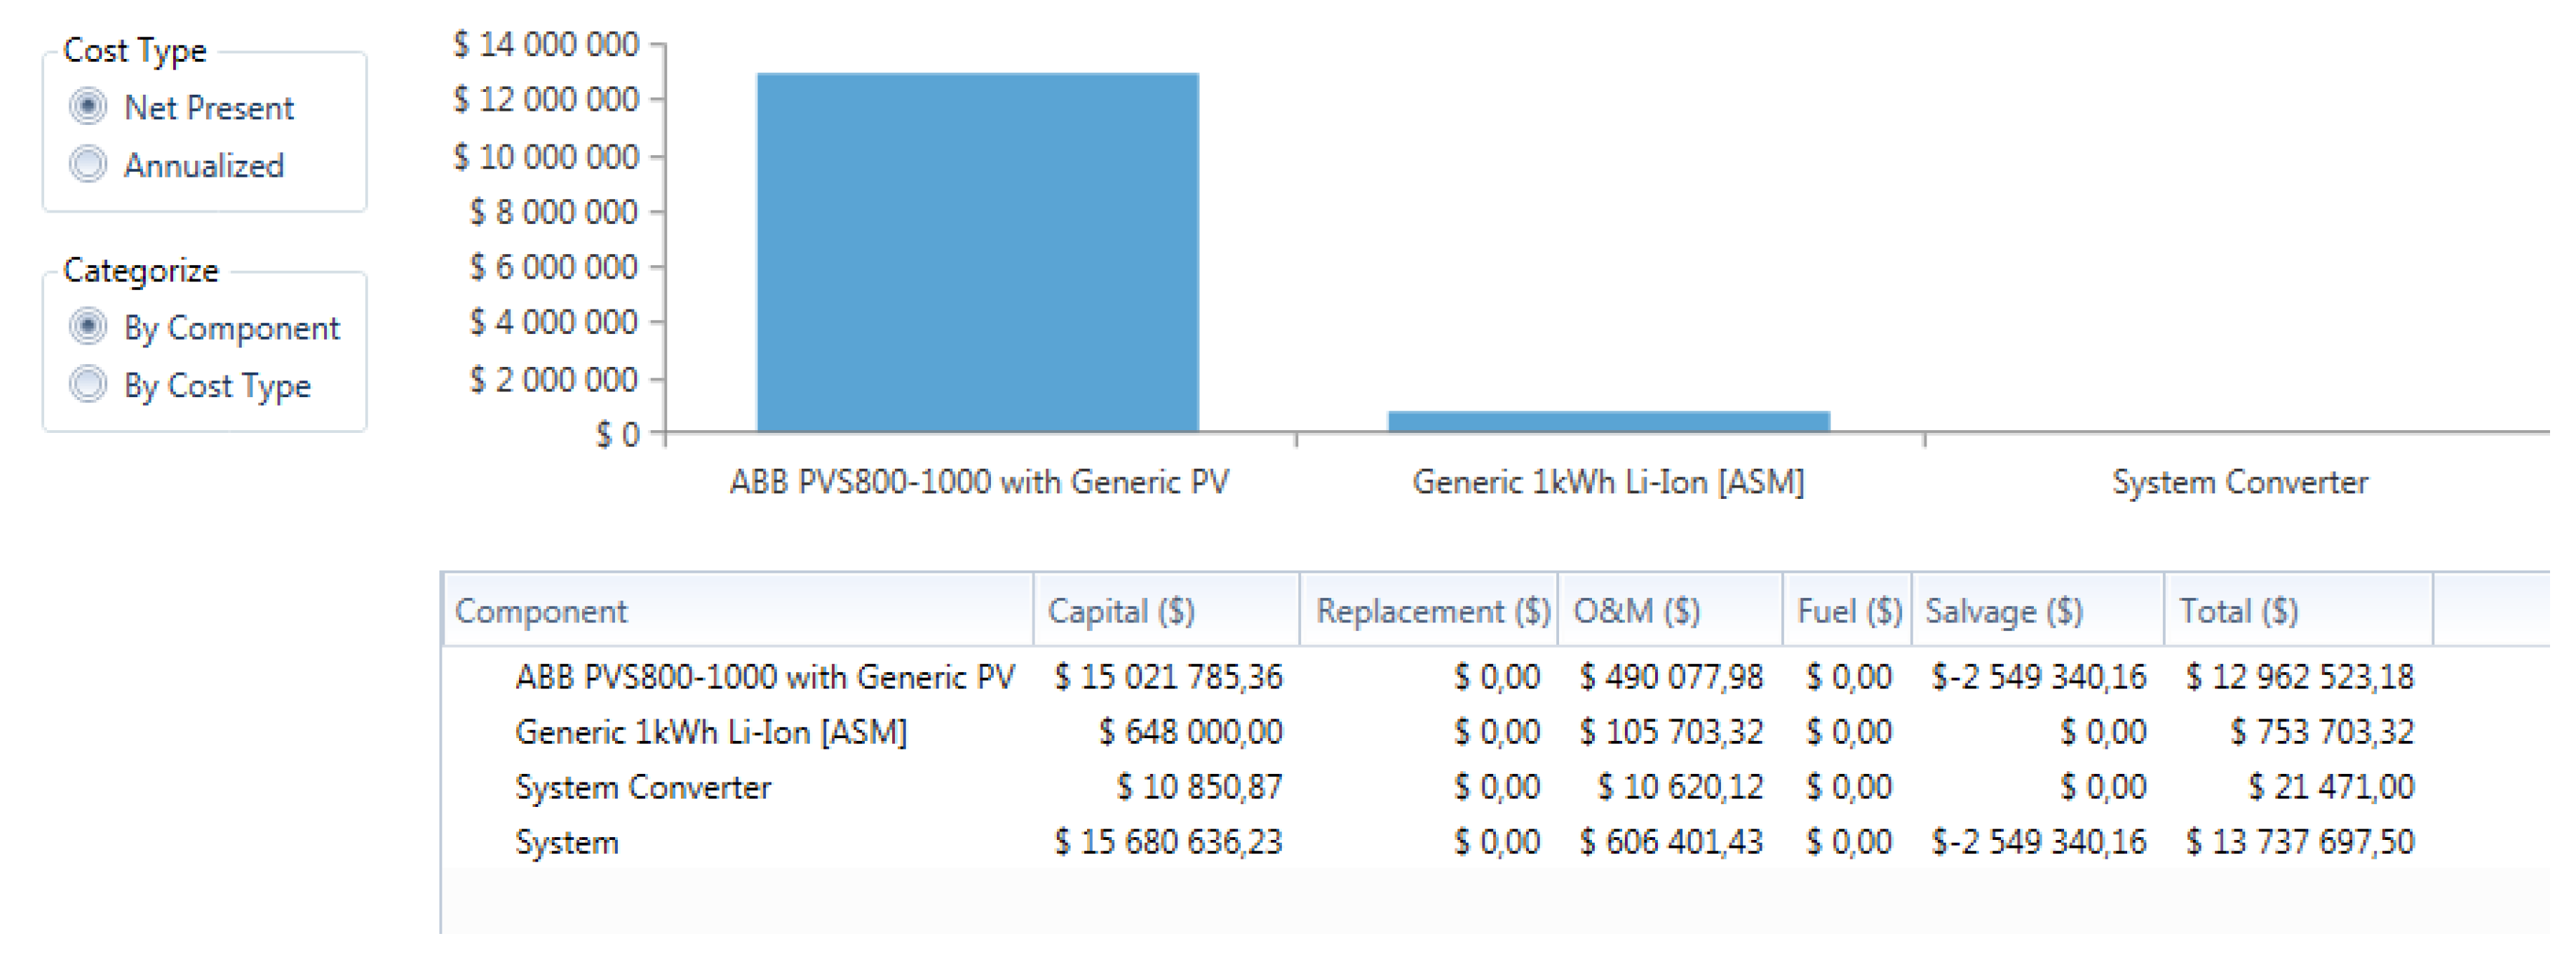
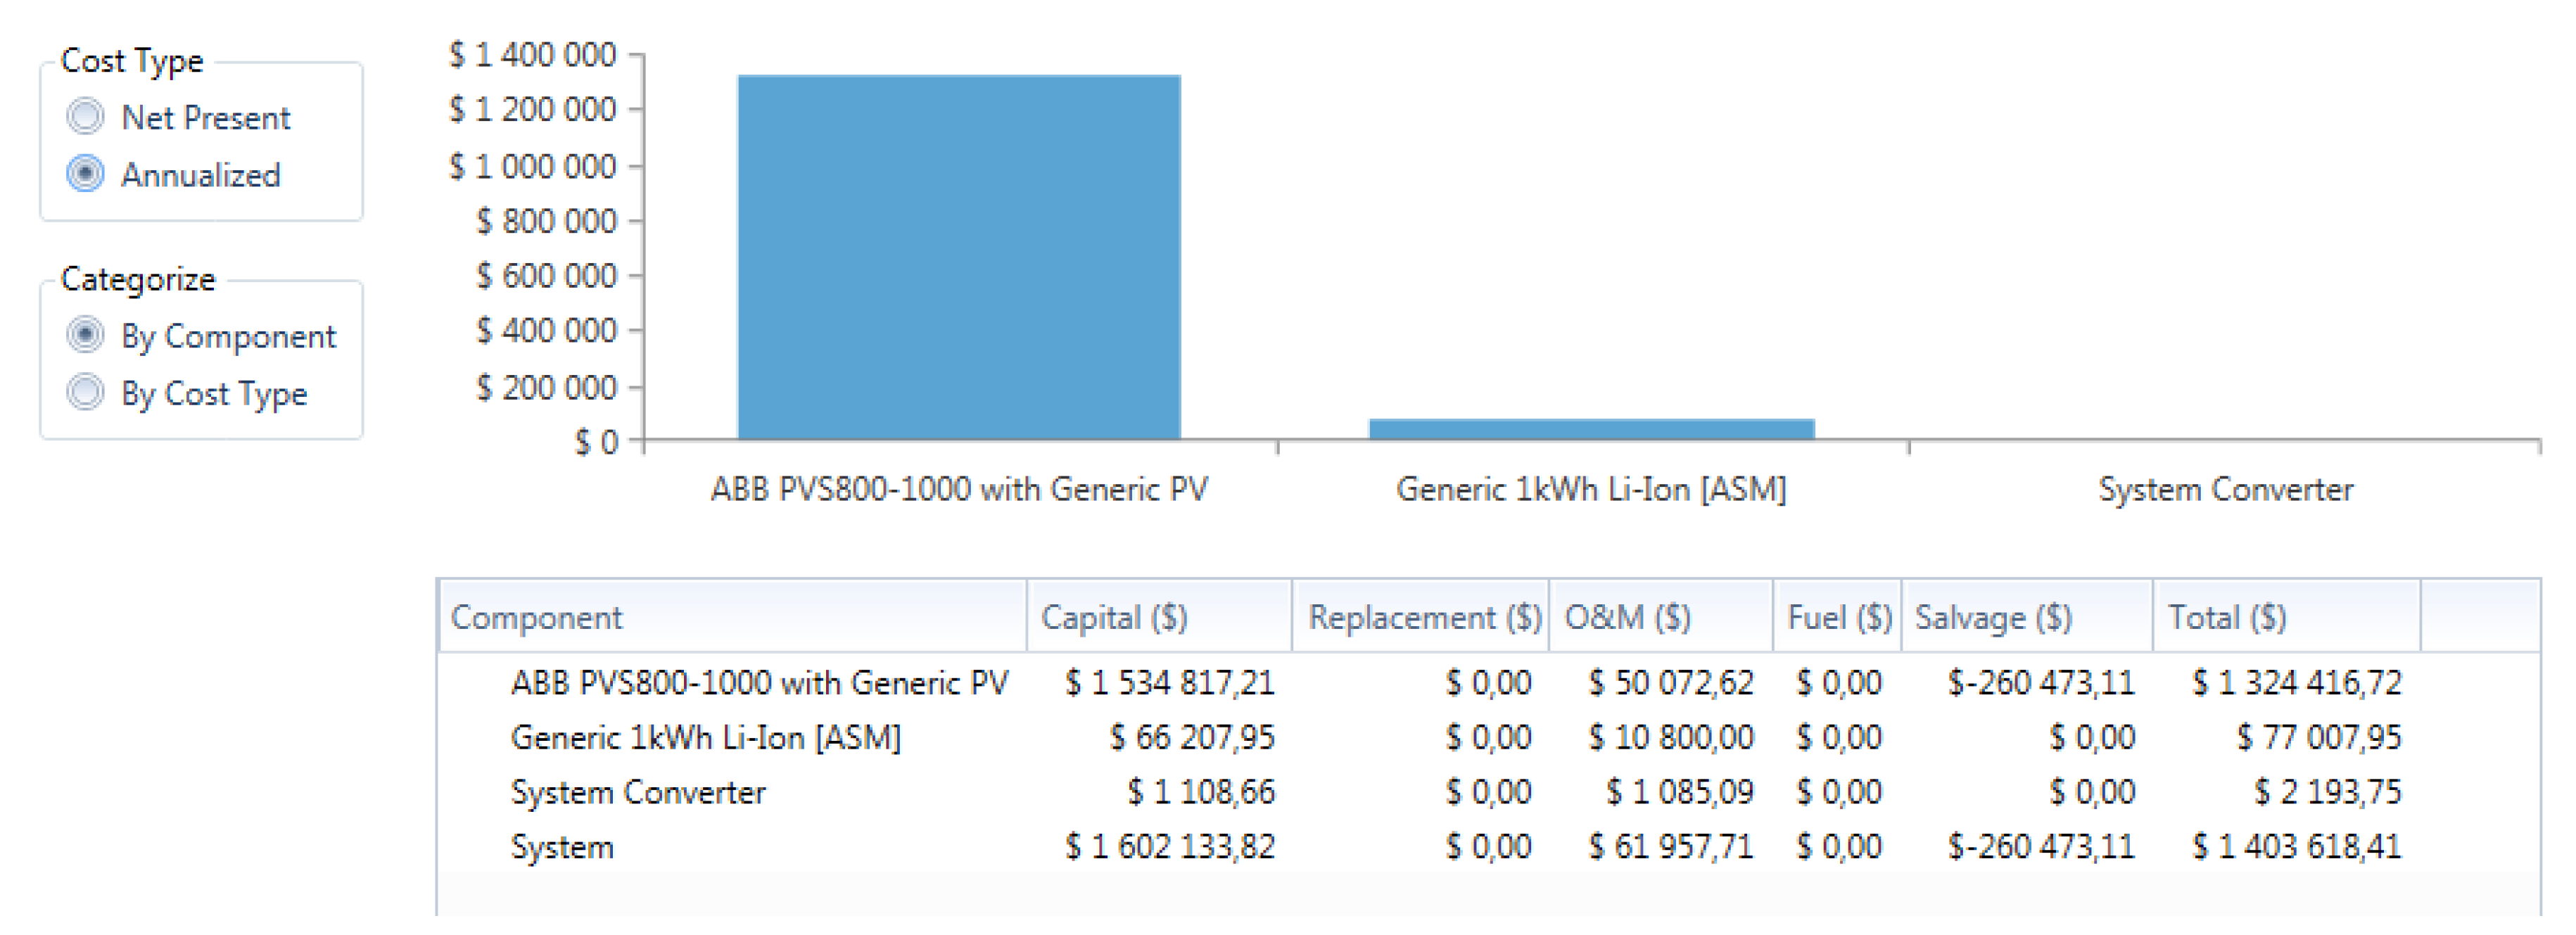
4.1. Photovoltaic (PV)–Battery Plant Off-Grid Cost Analysis
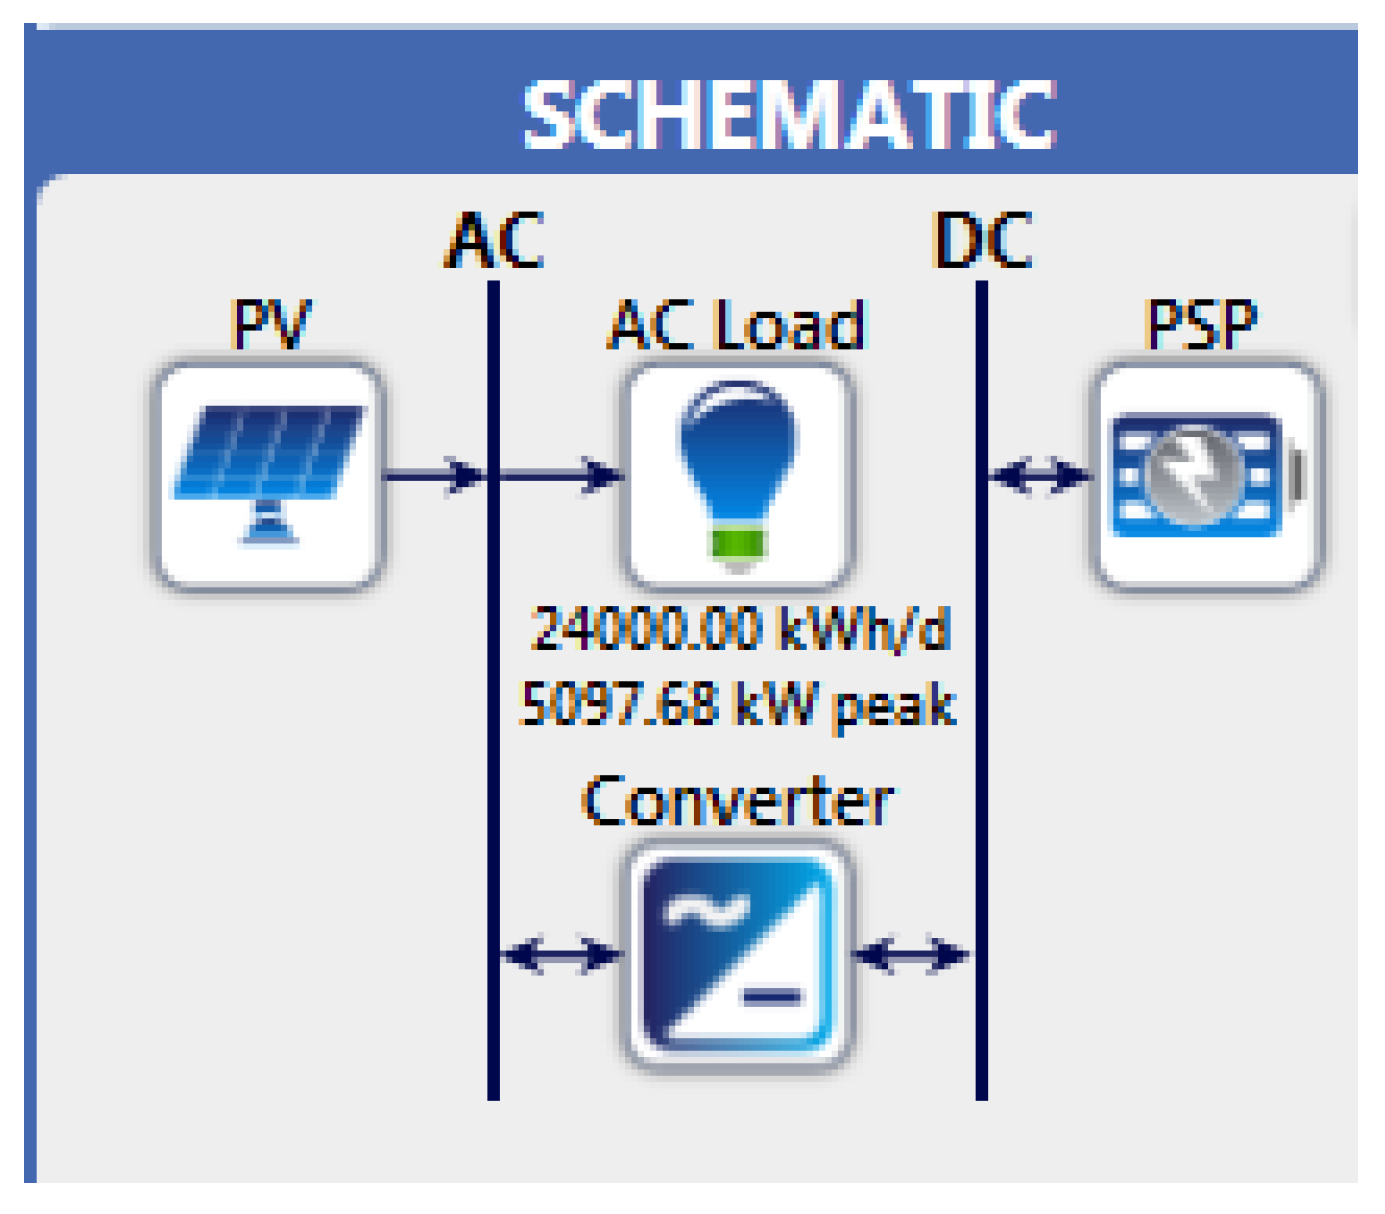
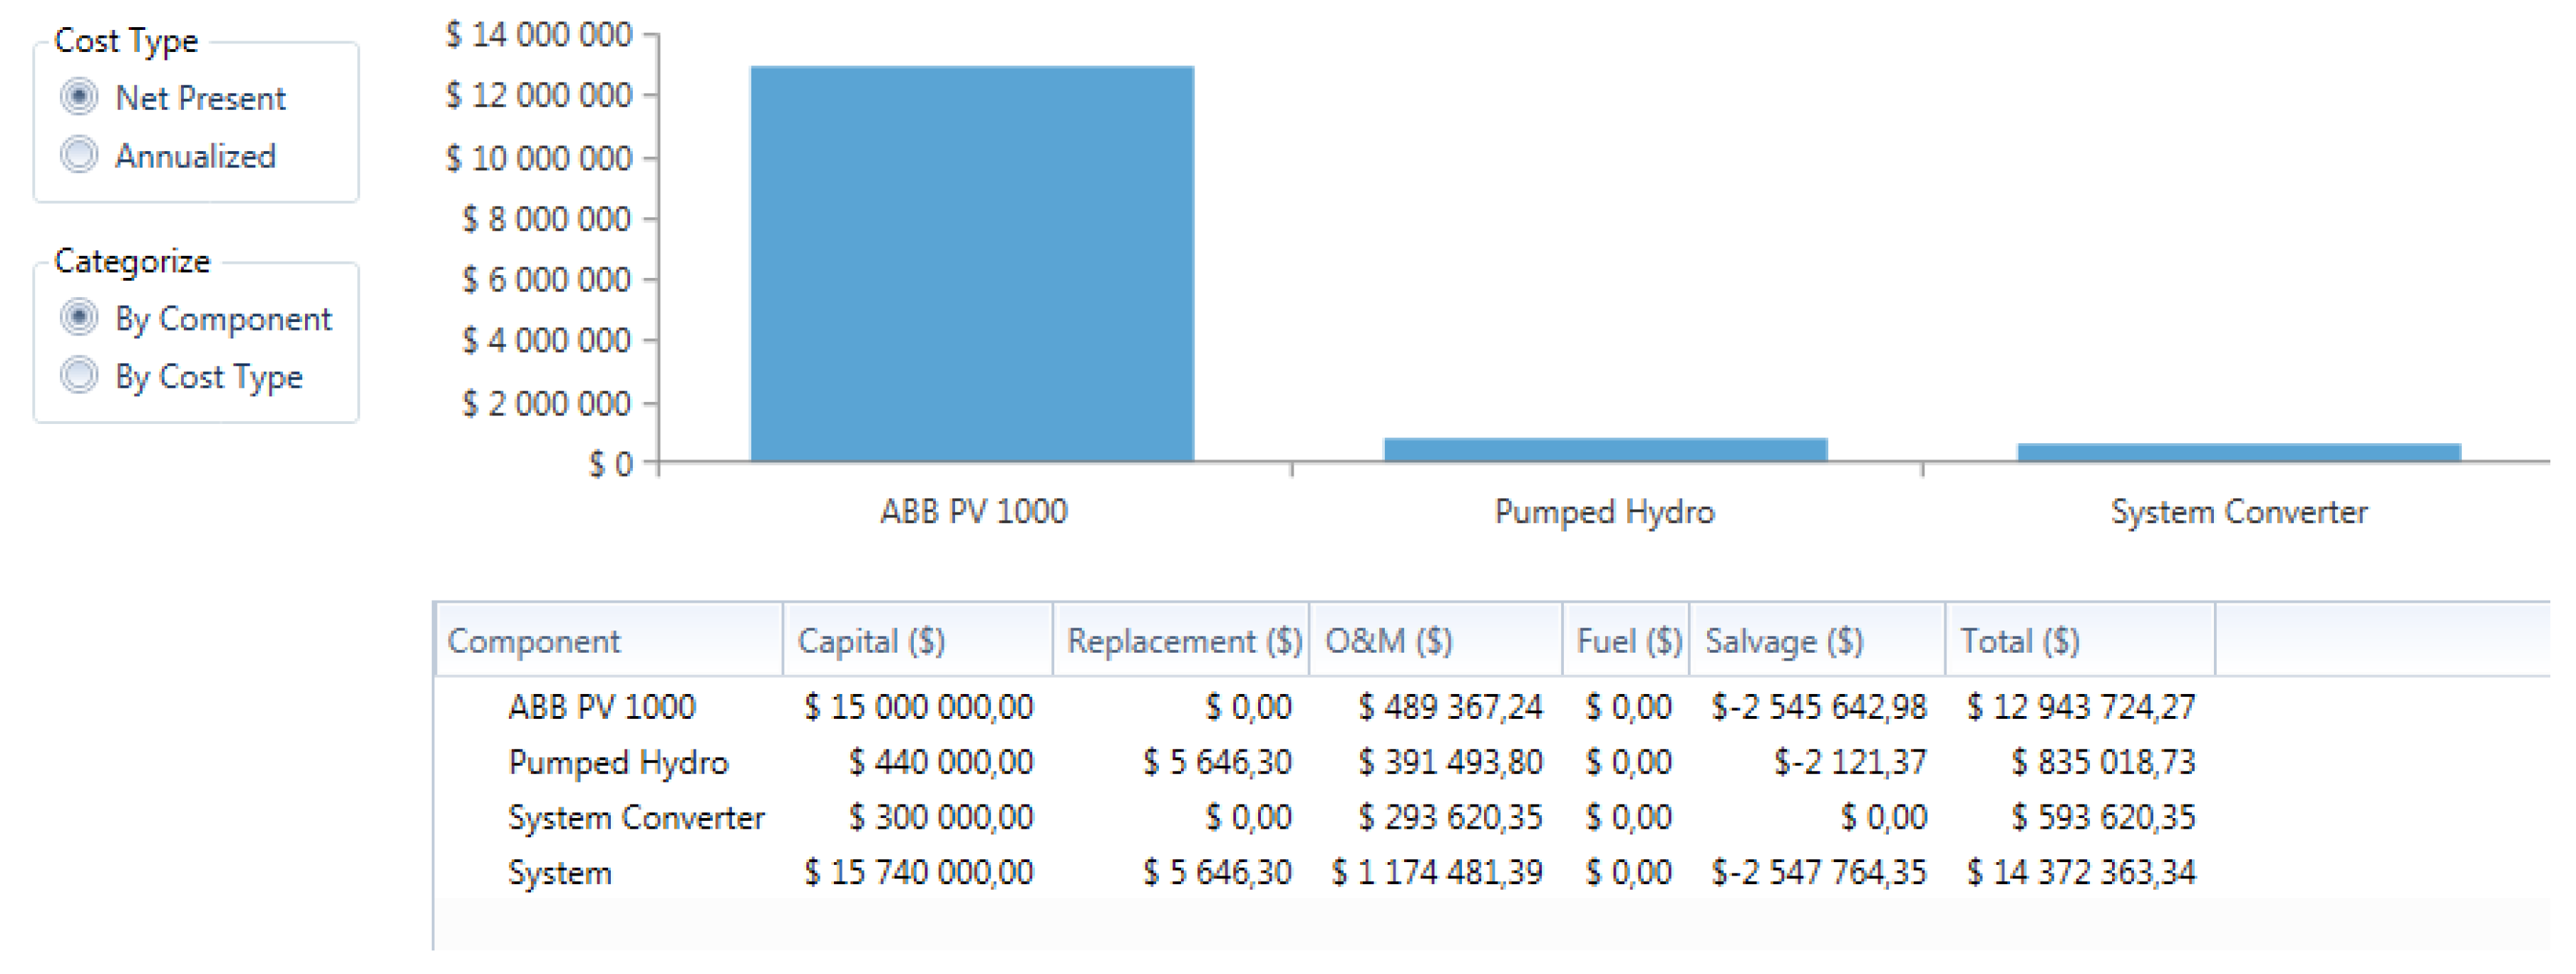
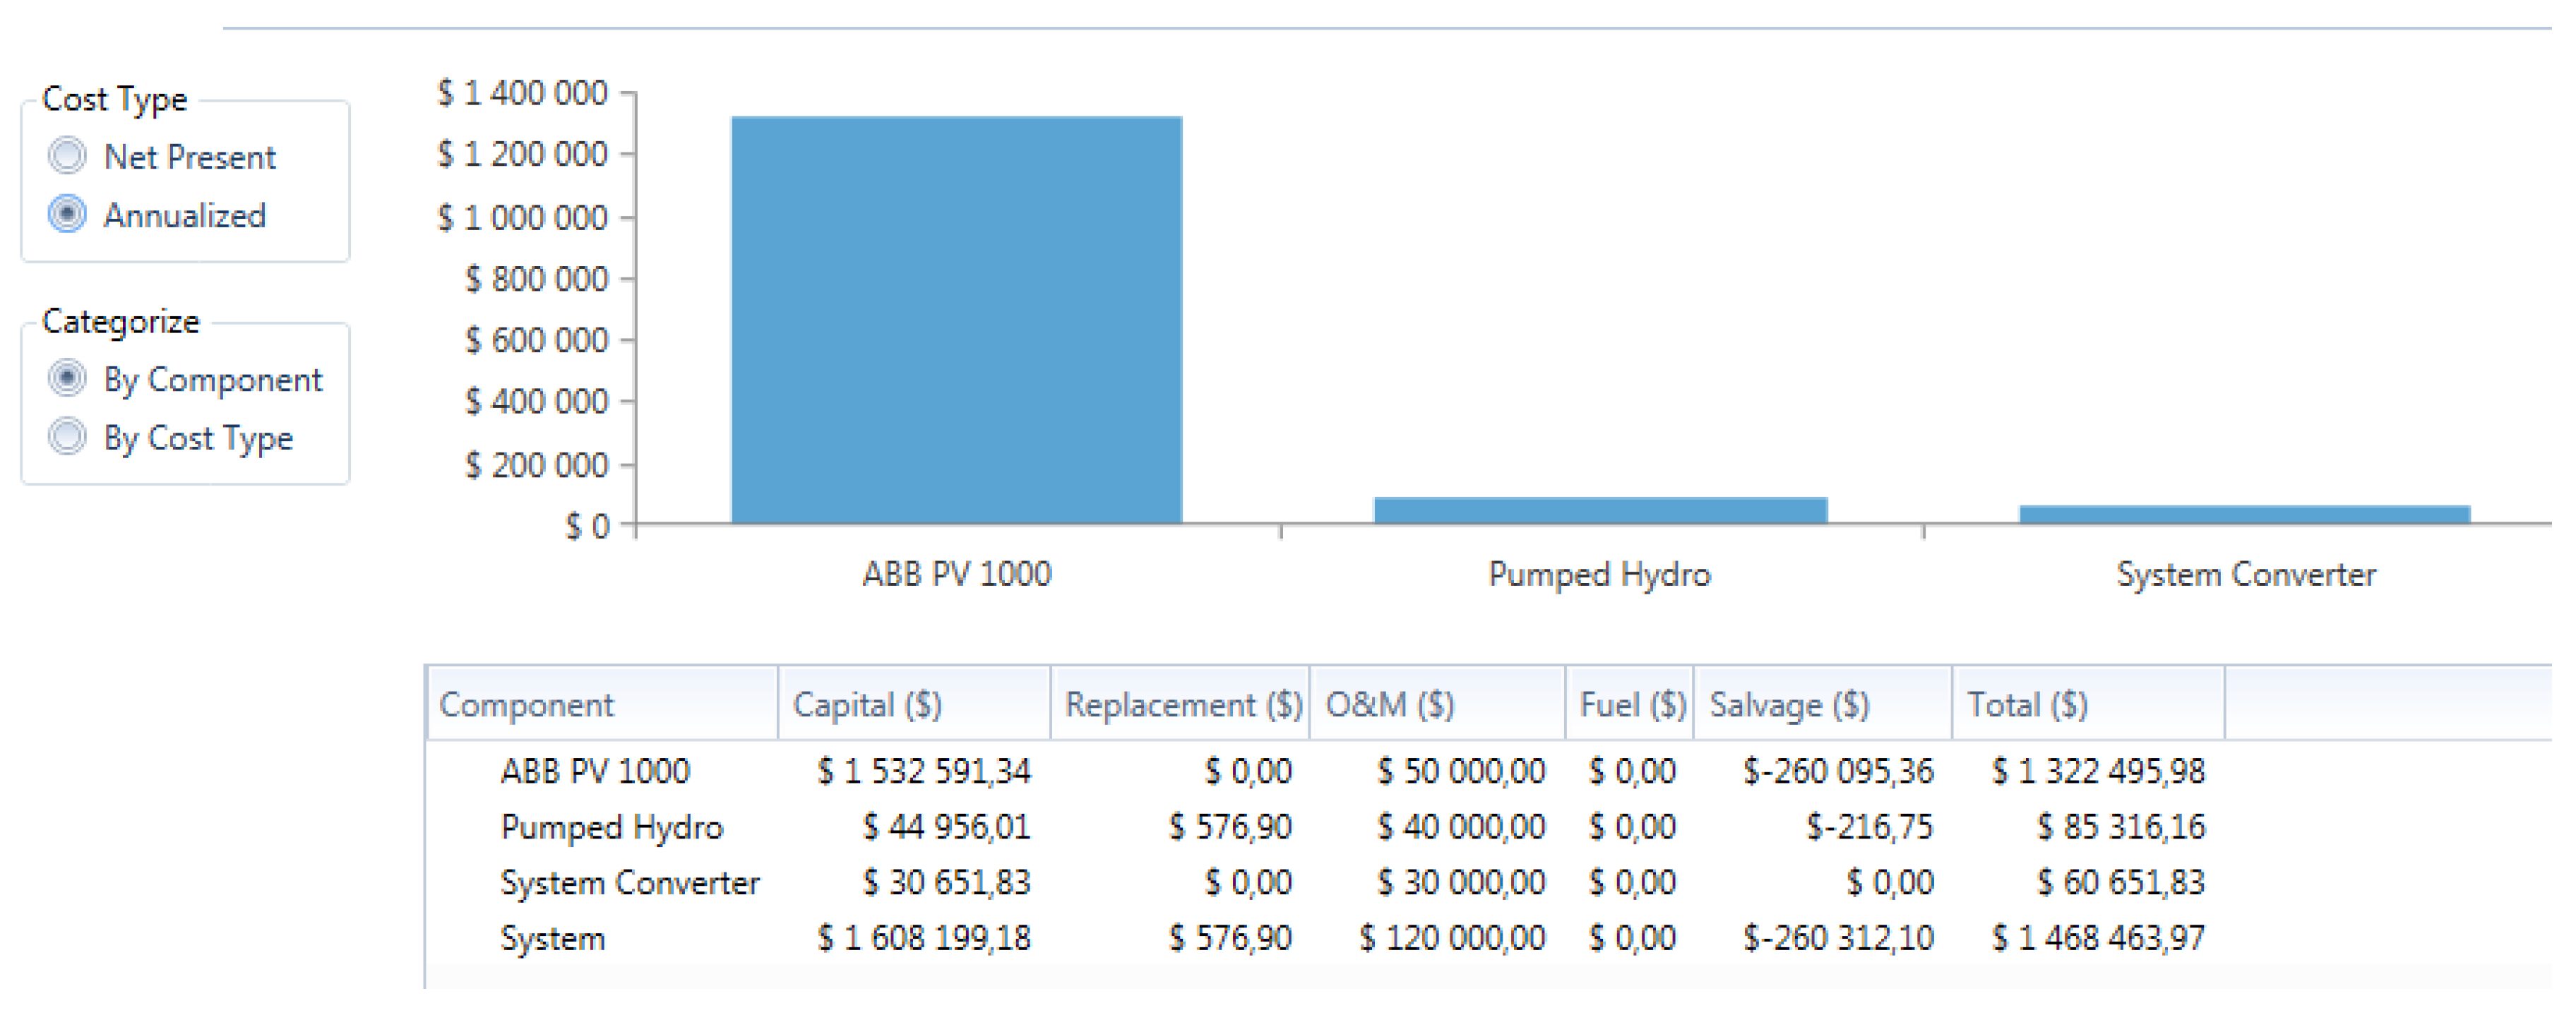
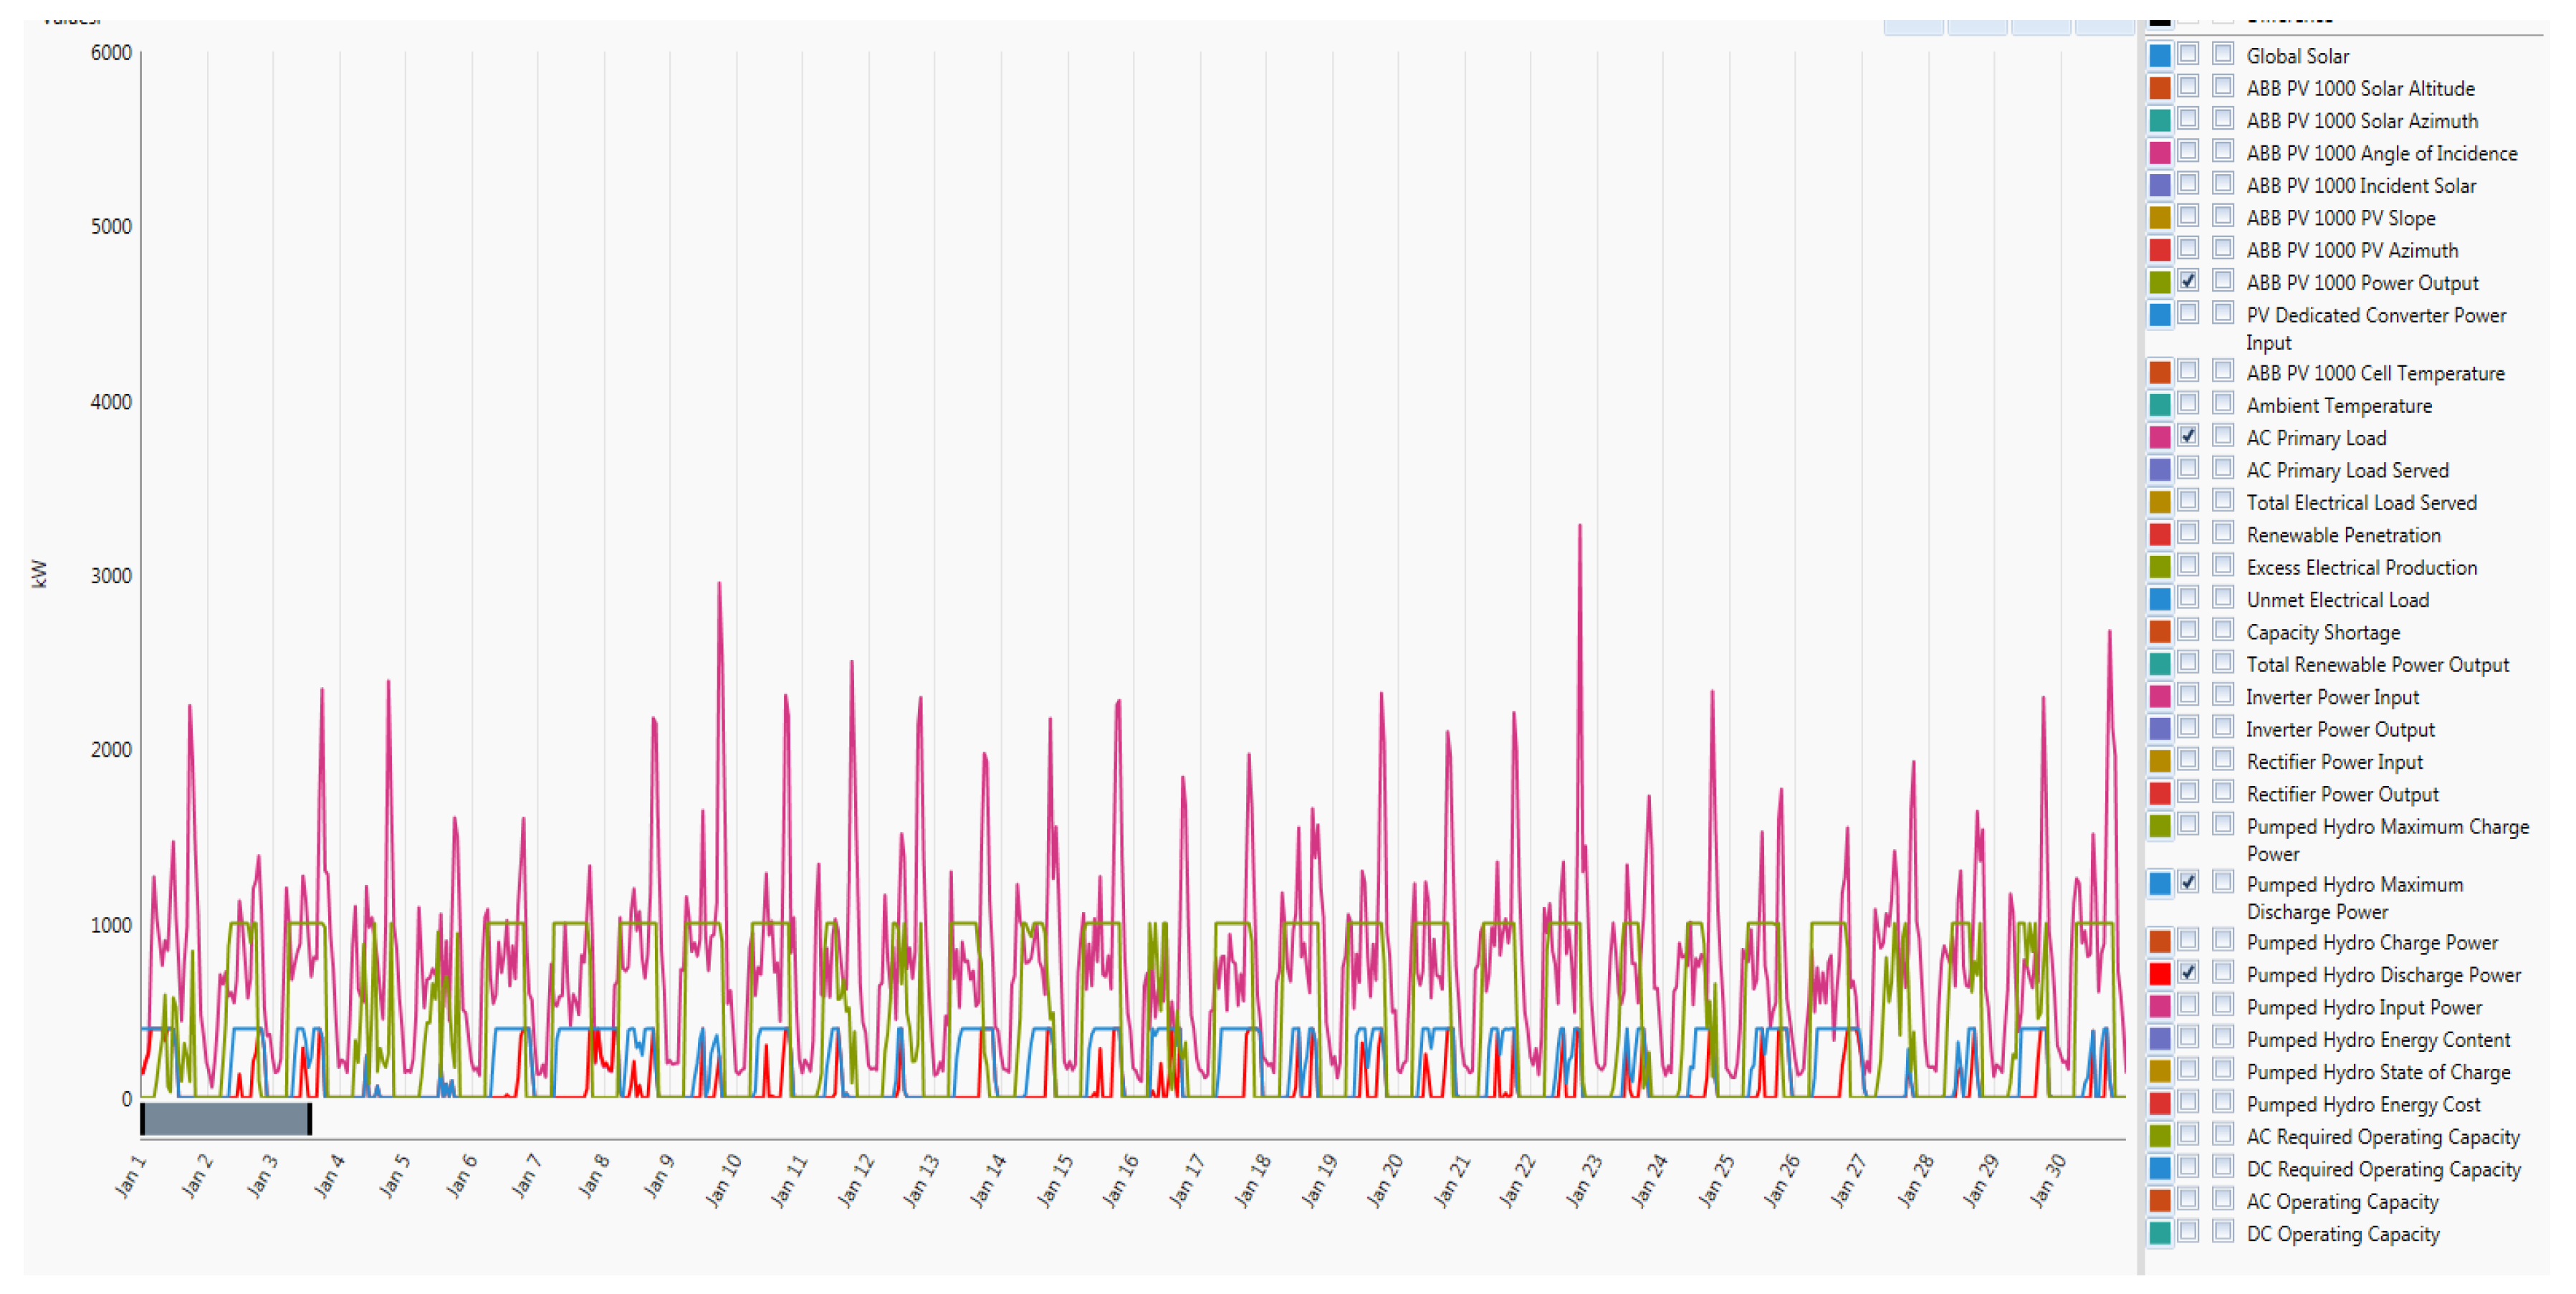
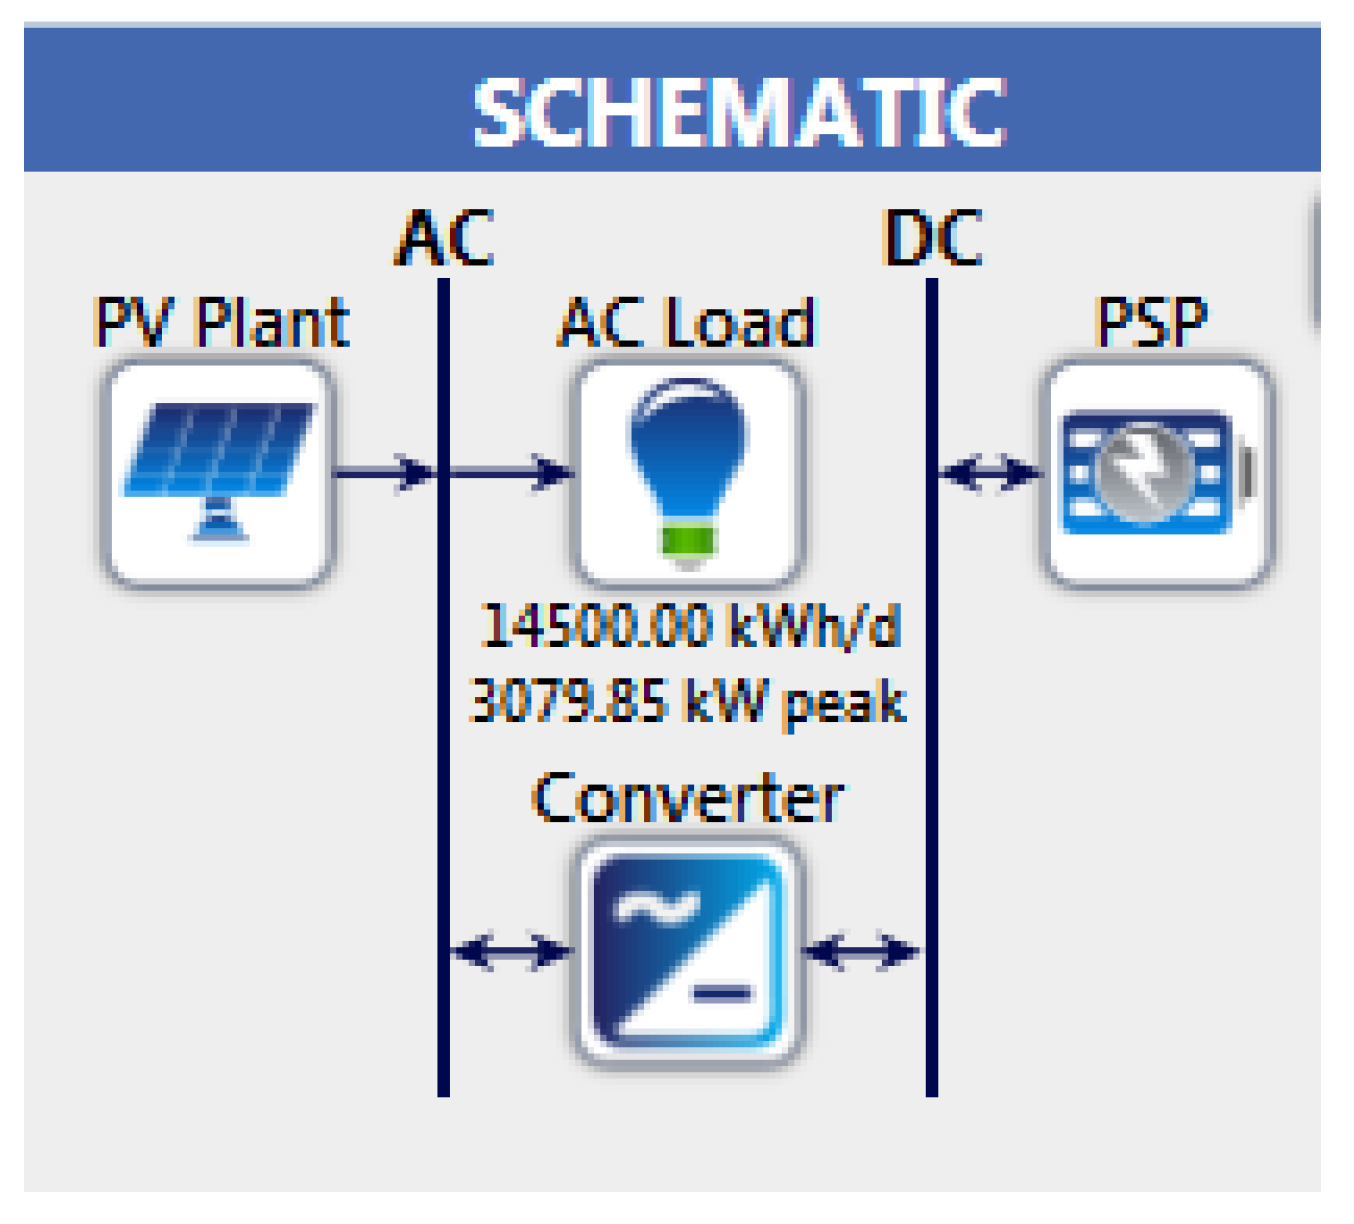
4.2. Case Study 2: 5 MW Load, PV Plant and 20% Pump Storage Plant
- is the Dam Capacity (upper and lower) to be calculated
- is the time required to discharge and restore water to upper dam = 12 h, since this water had to be available for electrical production the next day
- is the effective head = 150 m
- is the generator efficiency = 90%
- g is the gravitational force = 9.81 m/s2
- is the discharge rate/flow = 0.03 cubic metres per s.
- is the peak load = 5 MWh
- PPS rating to be 20% of the load = 1 MWh.
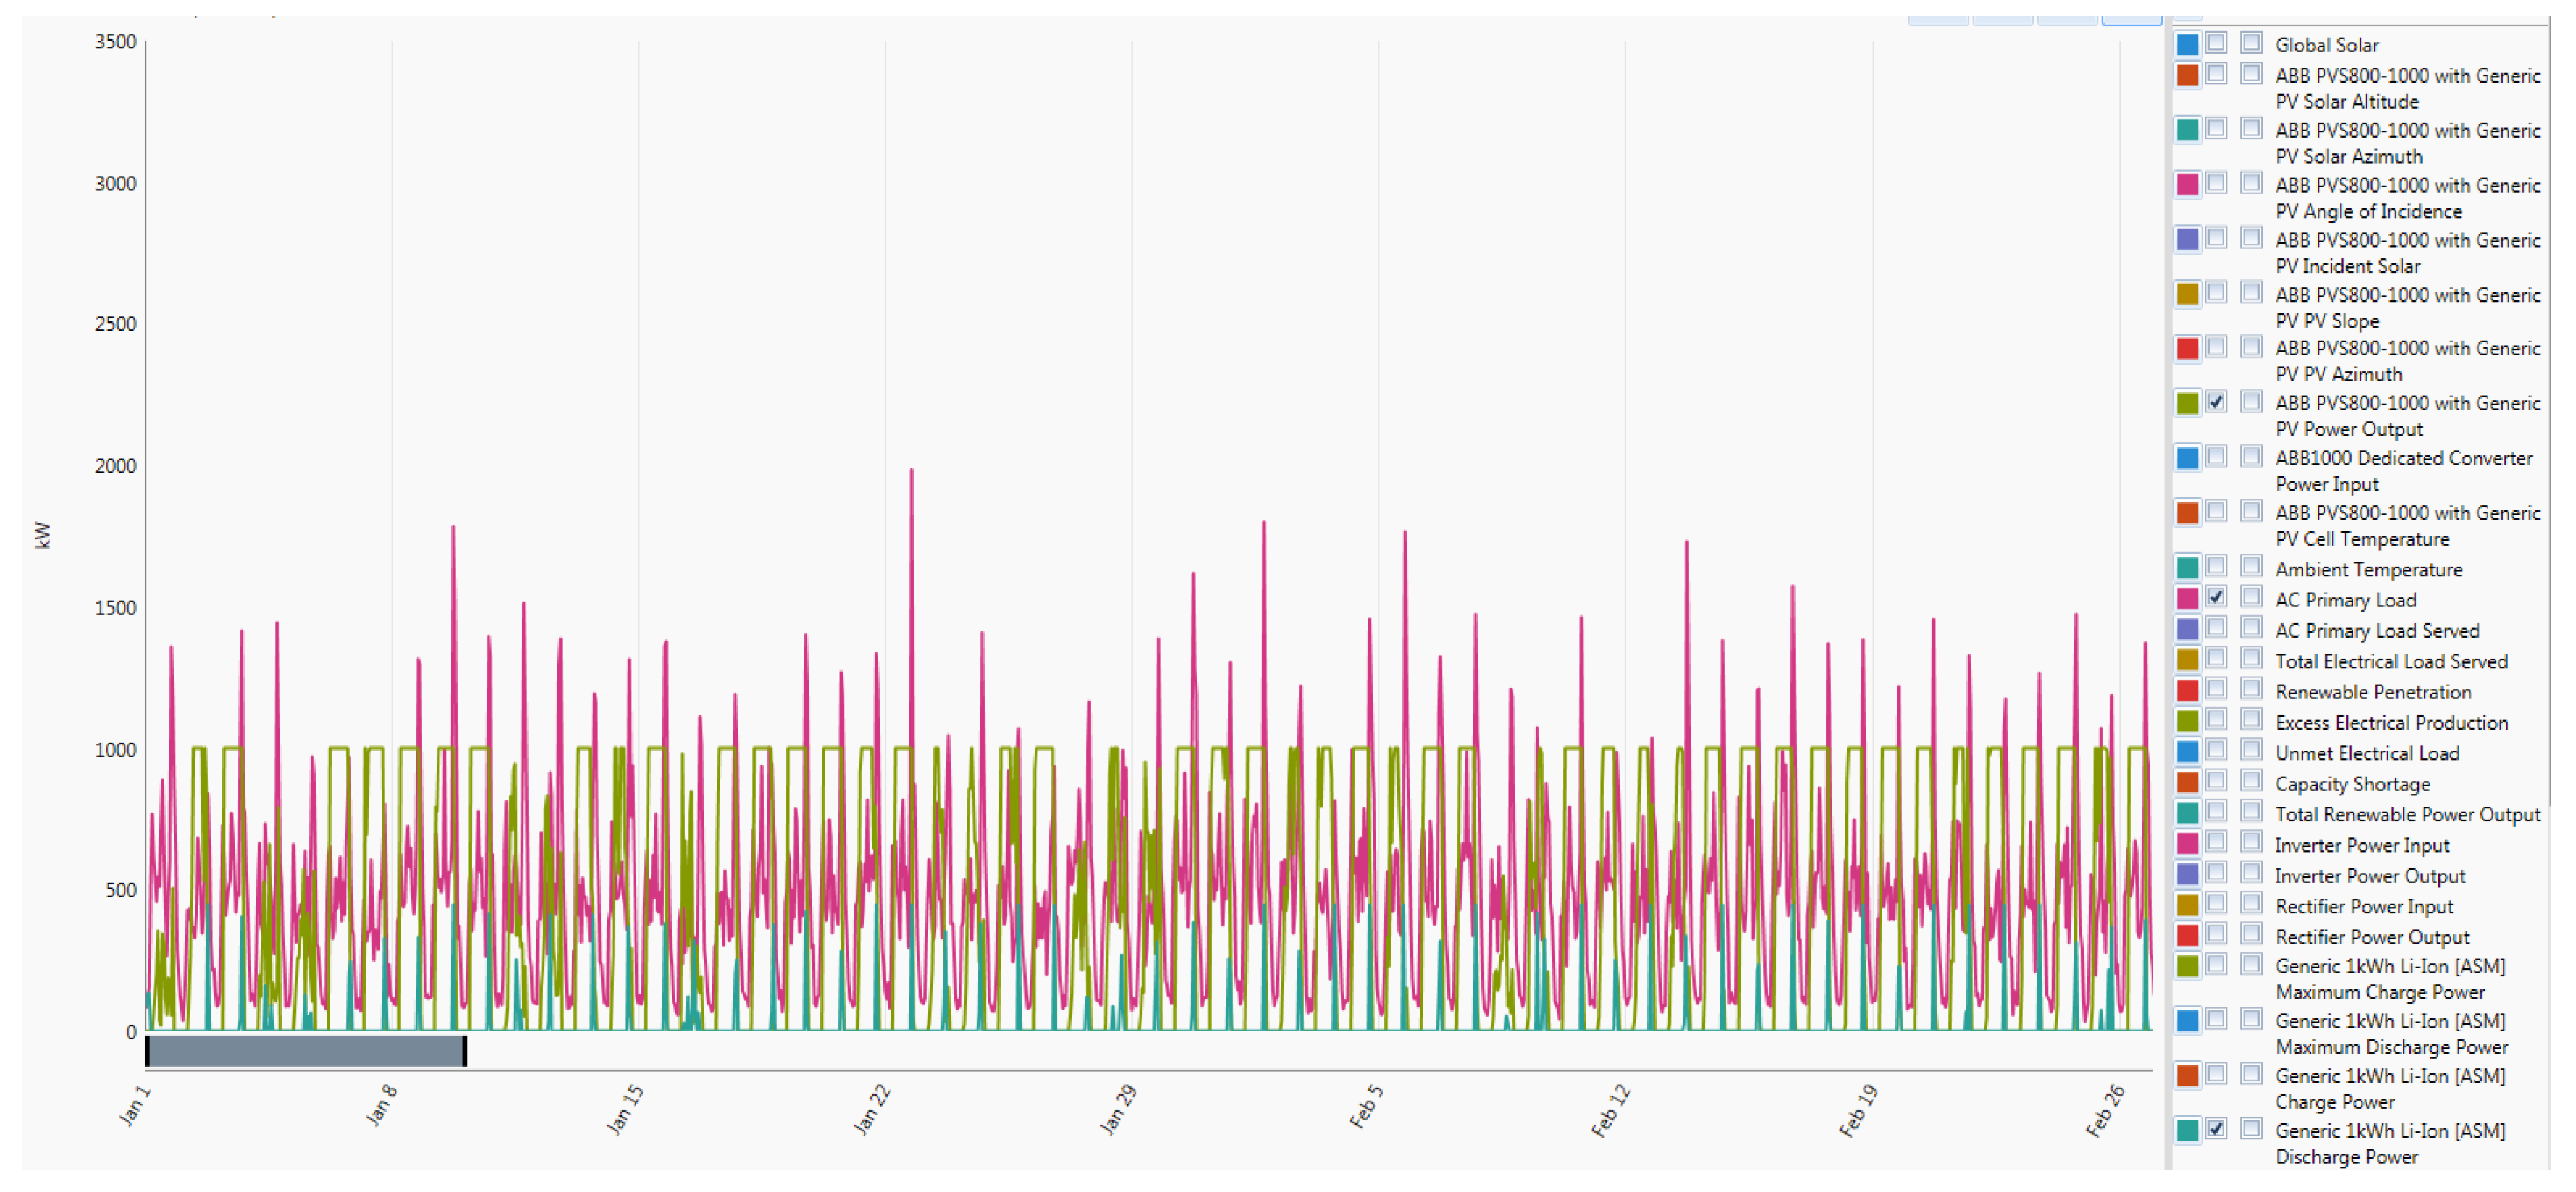
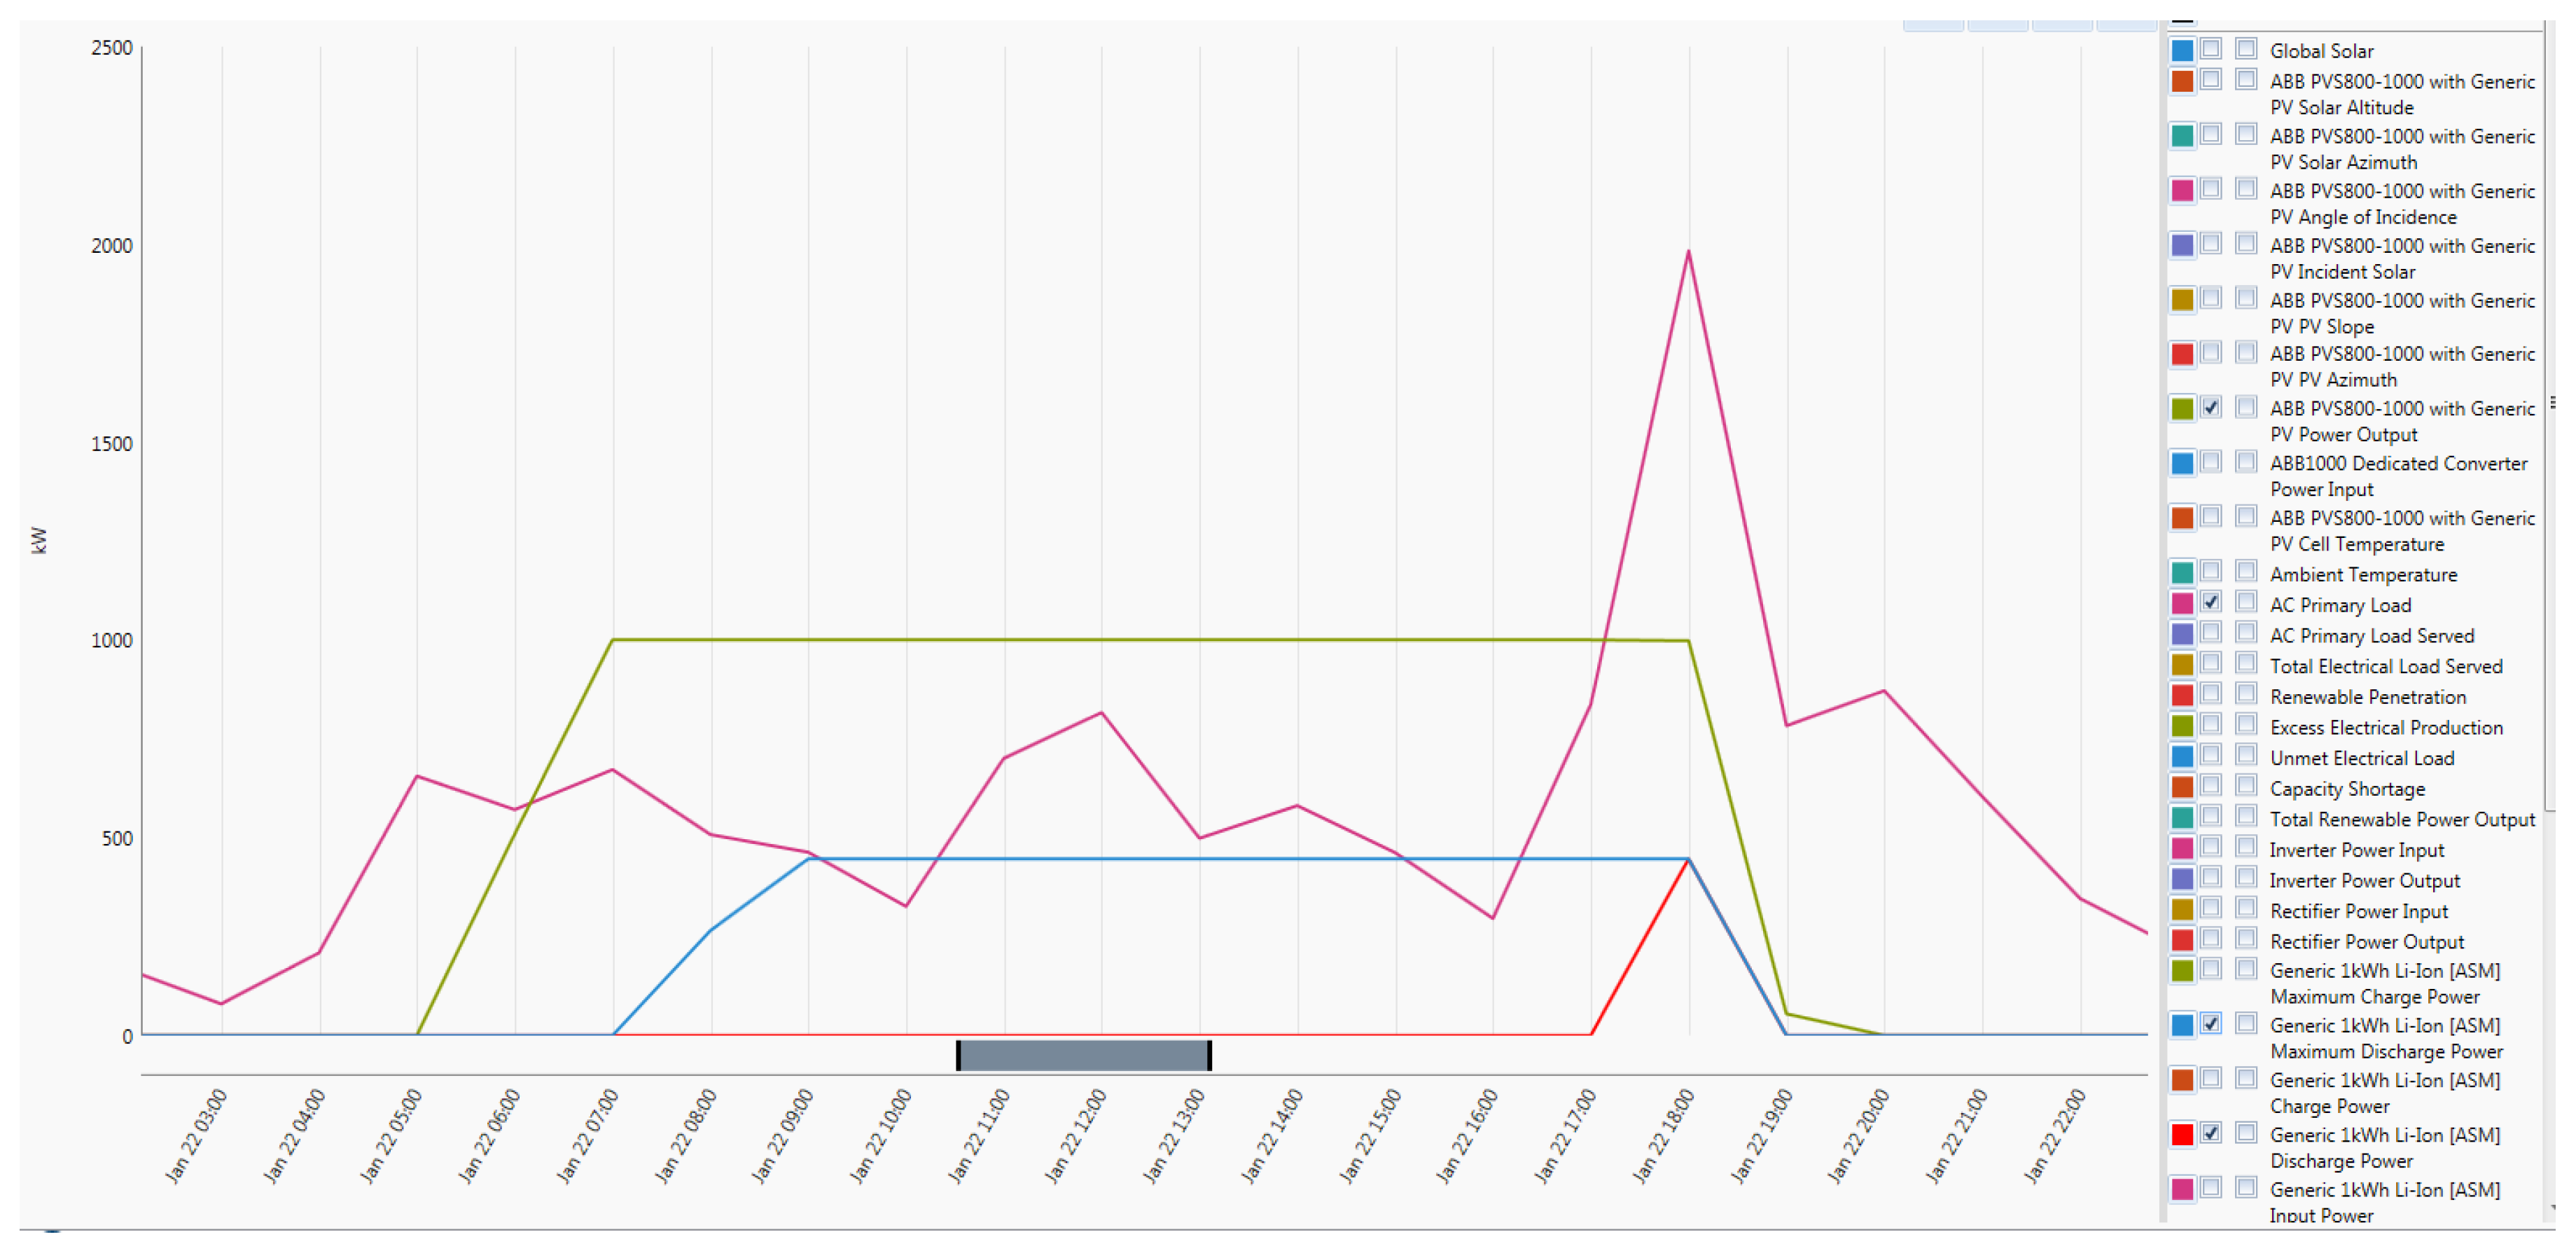
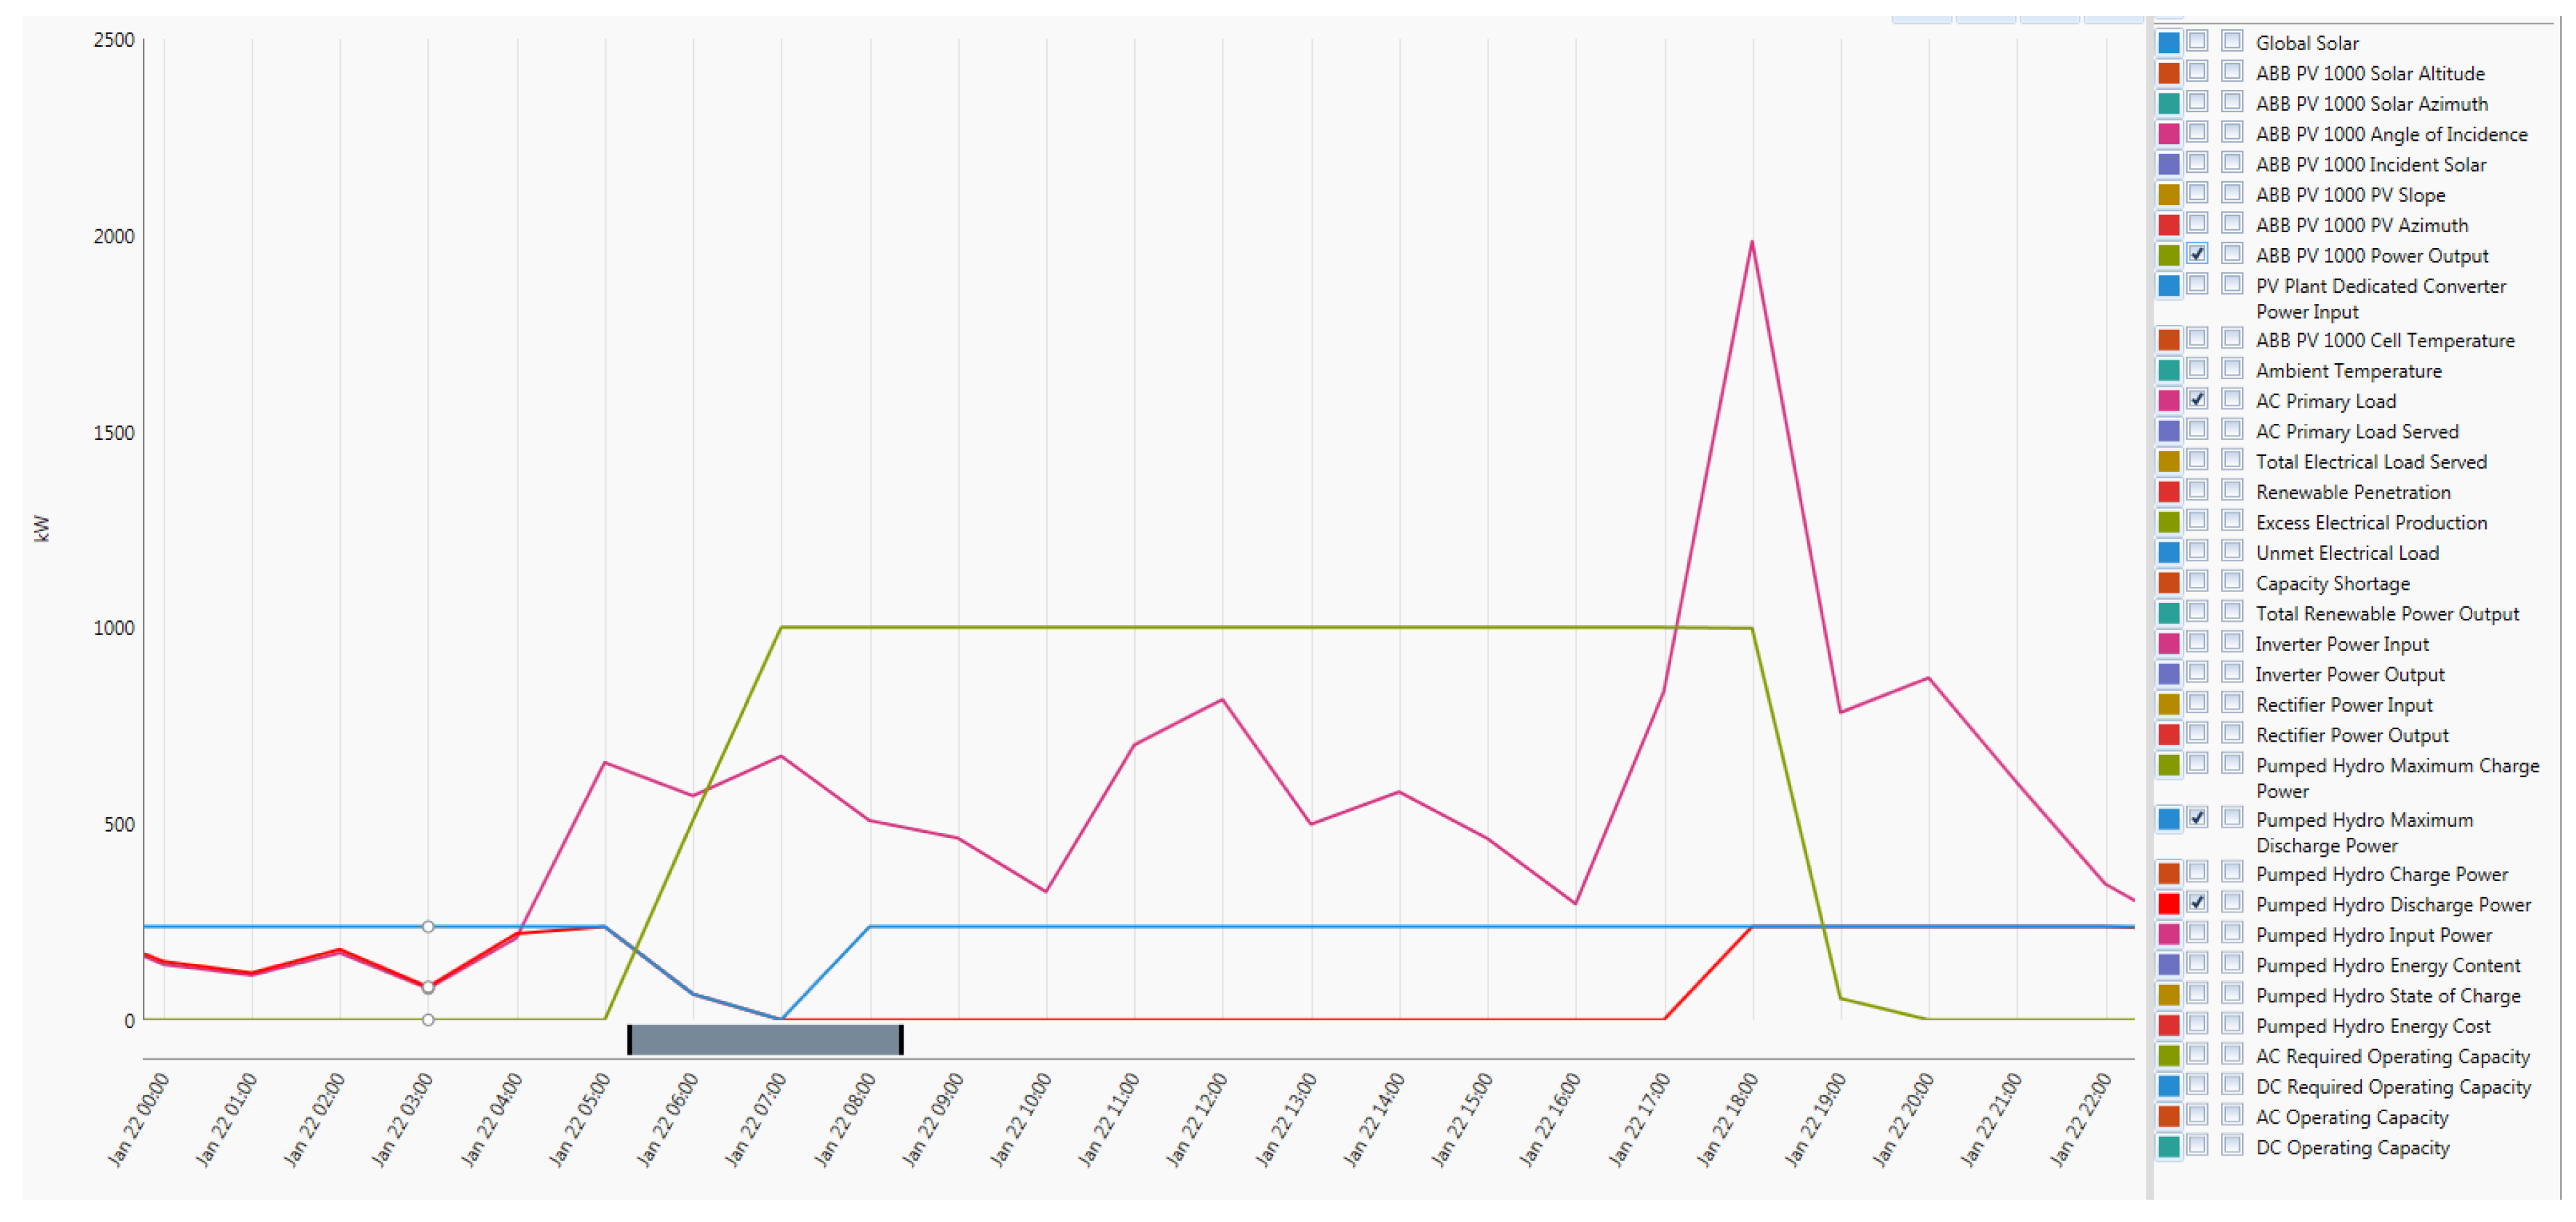
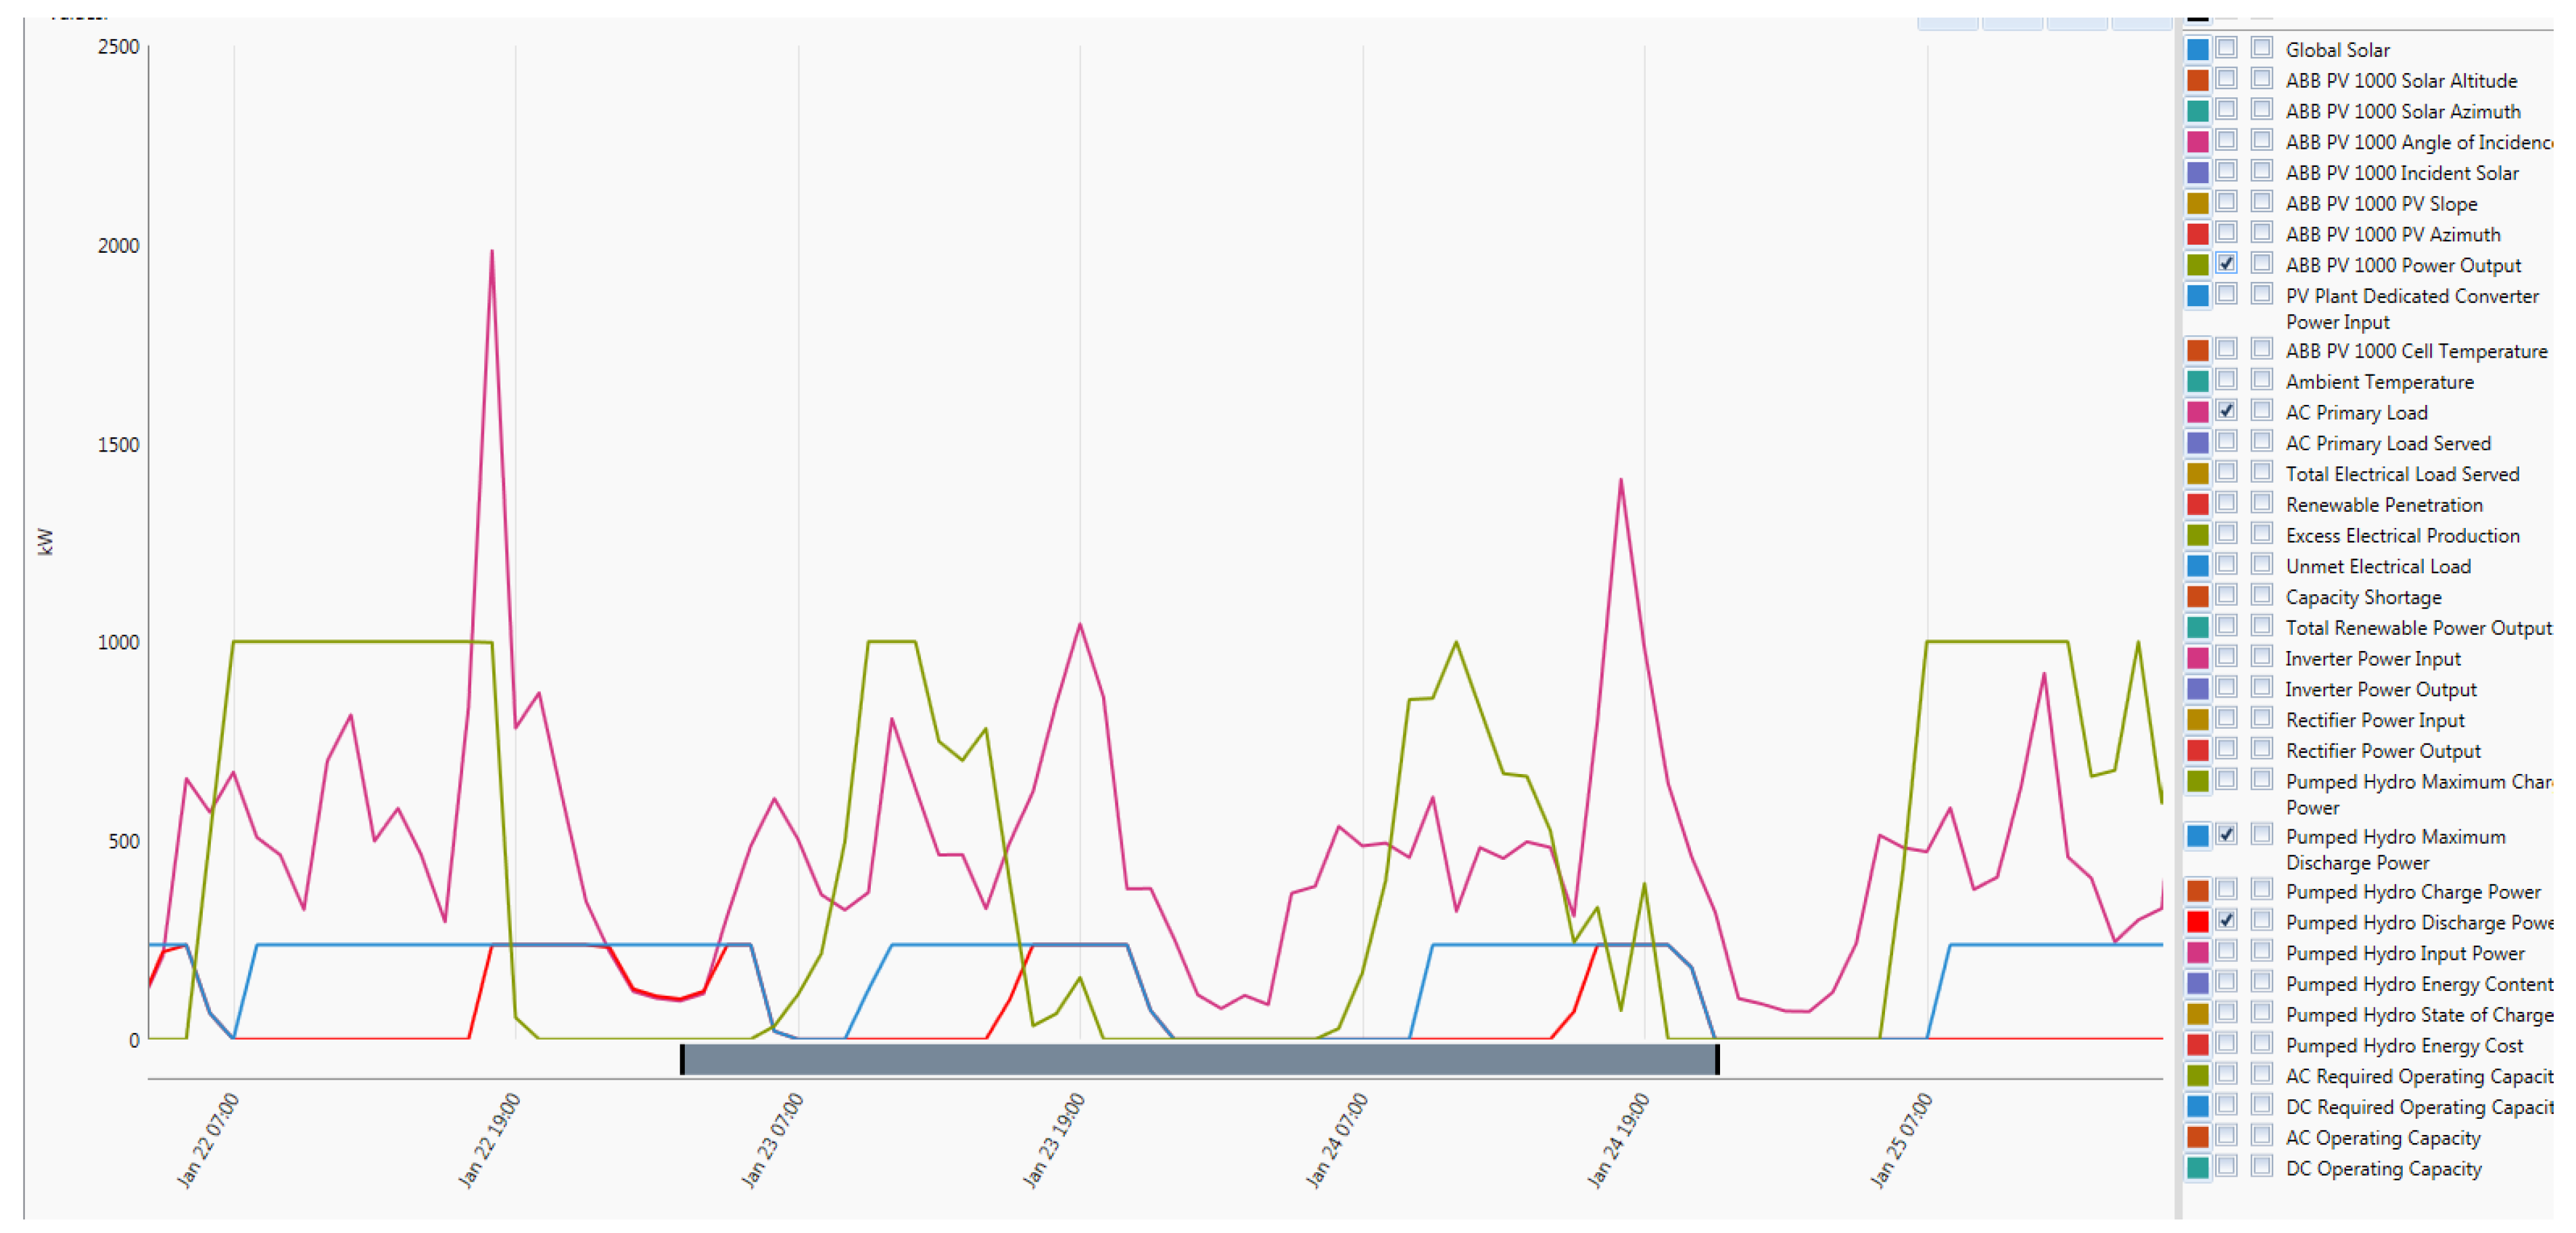
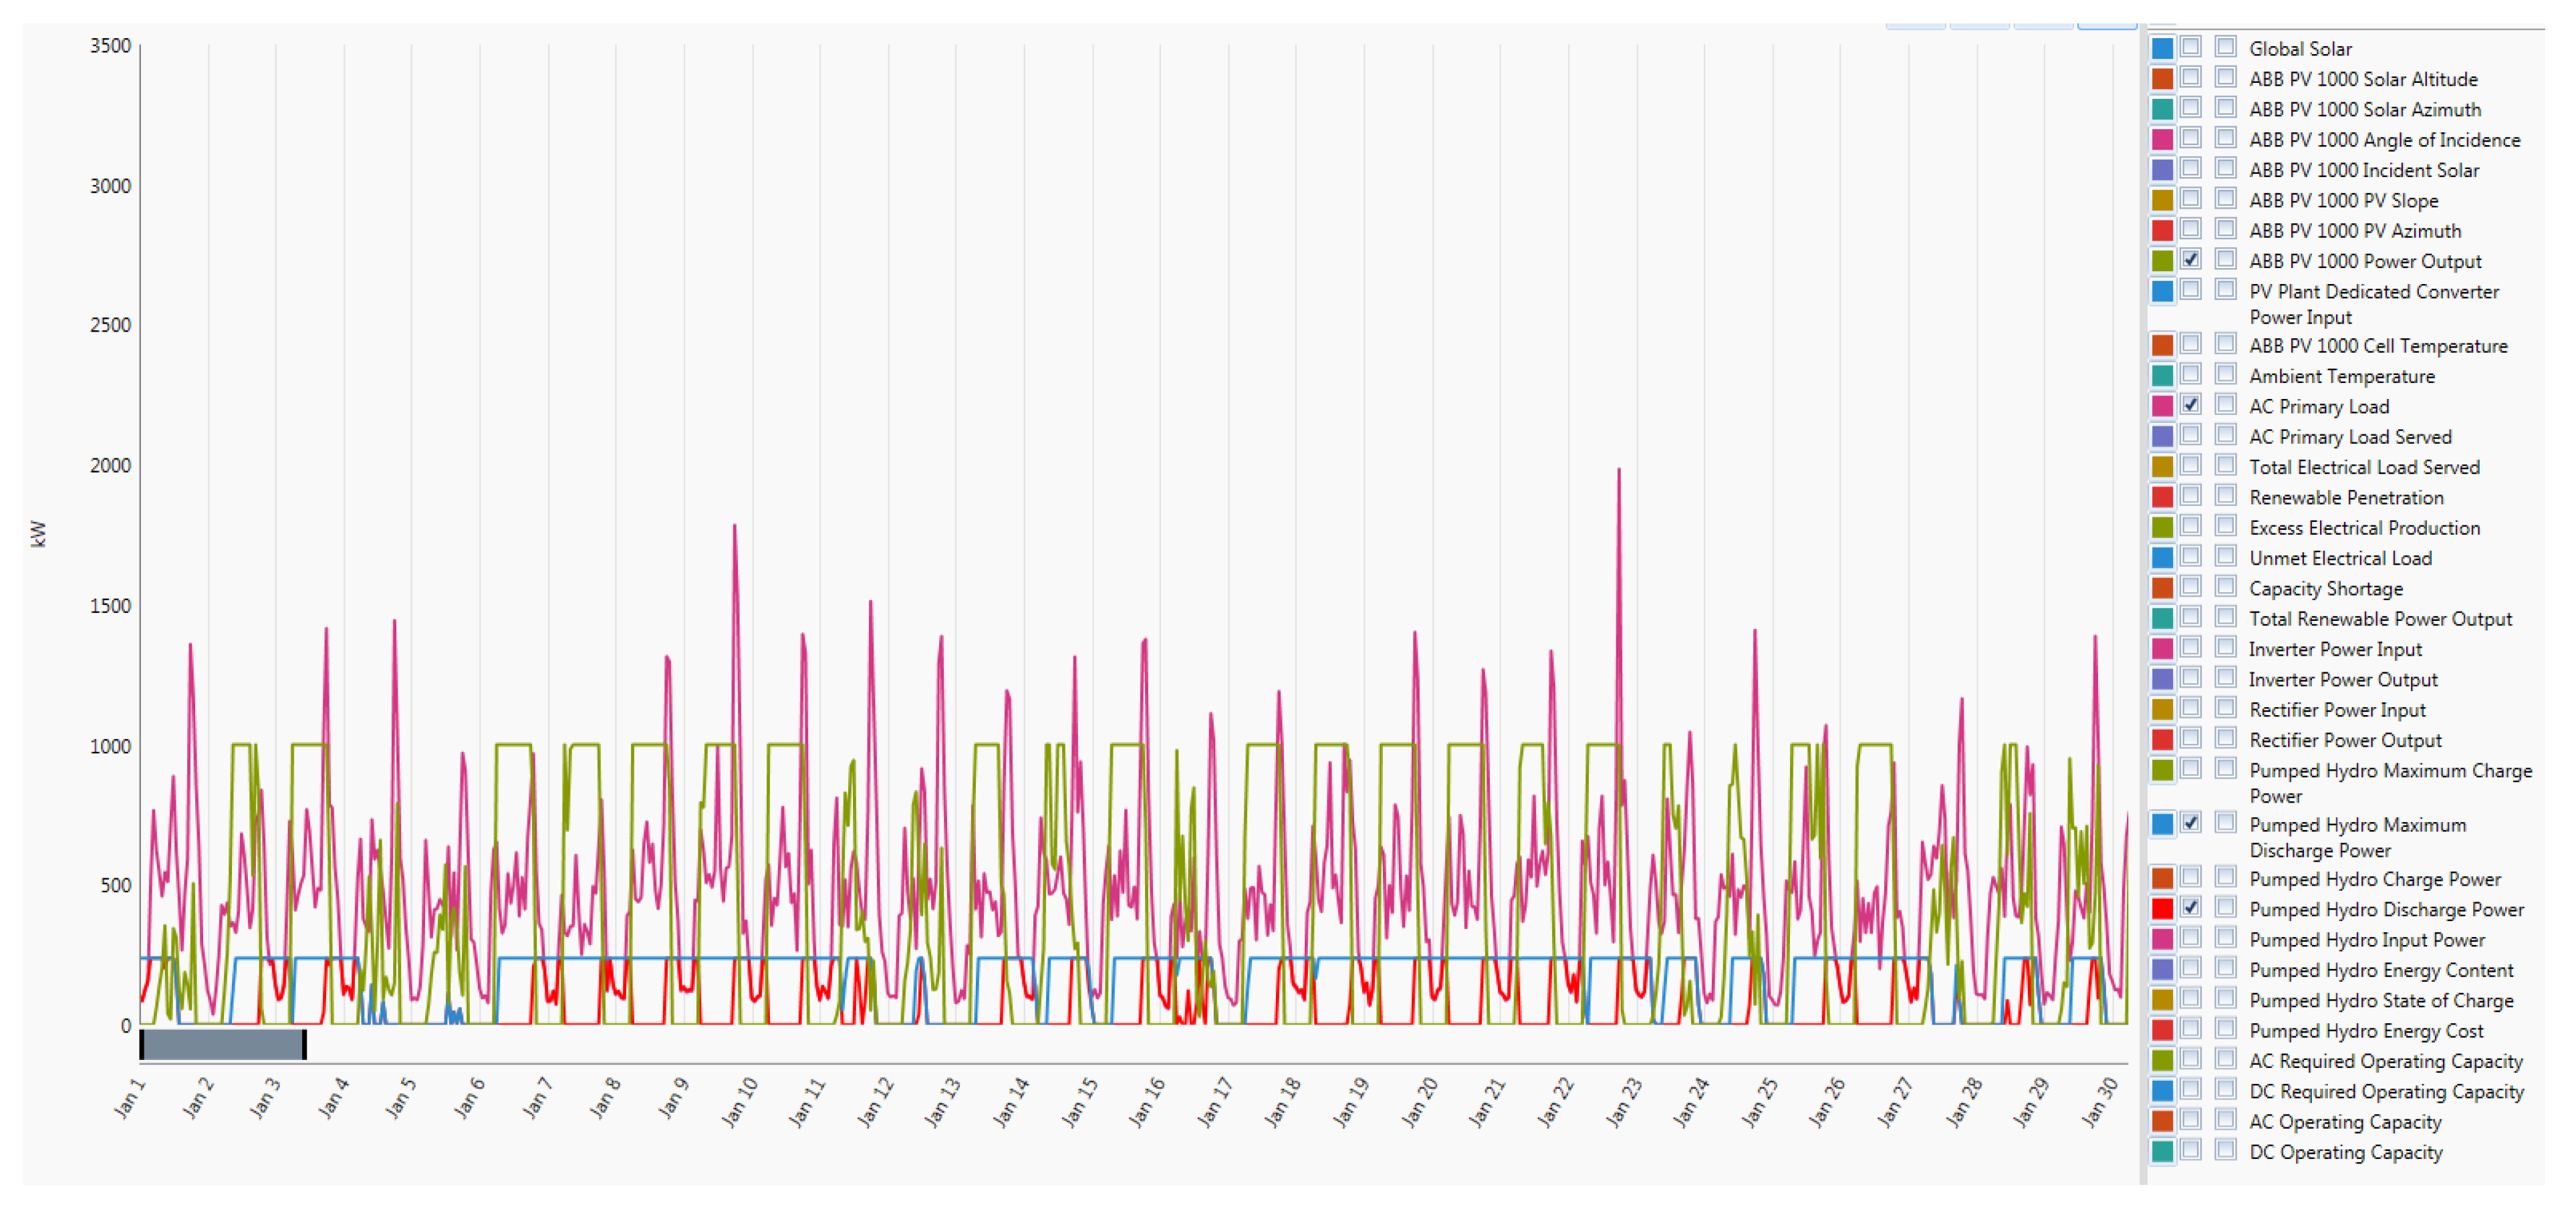
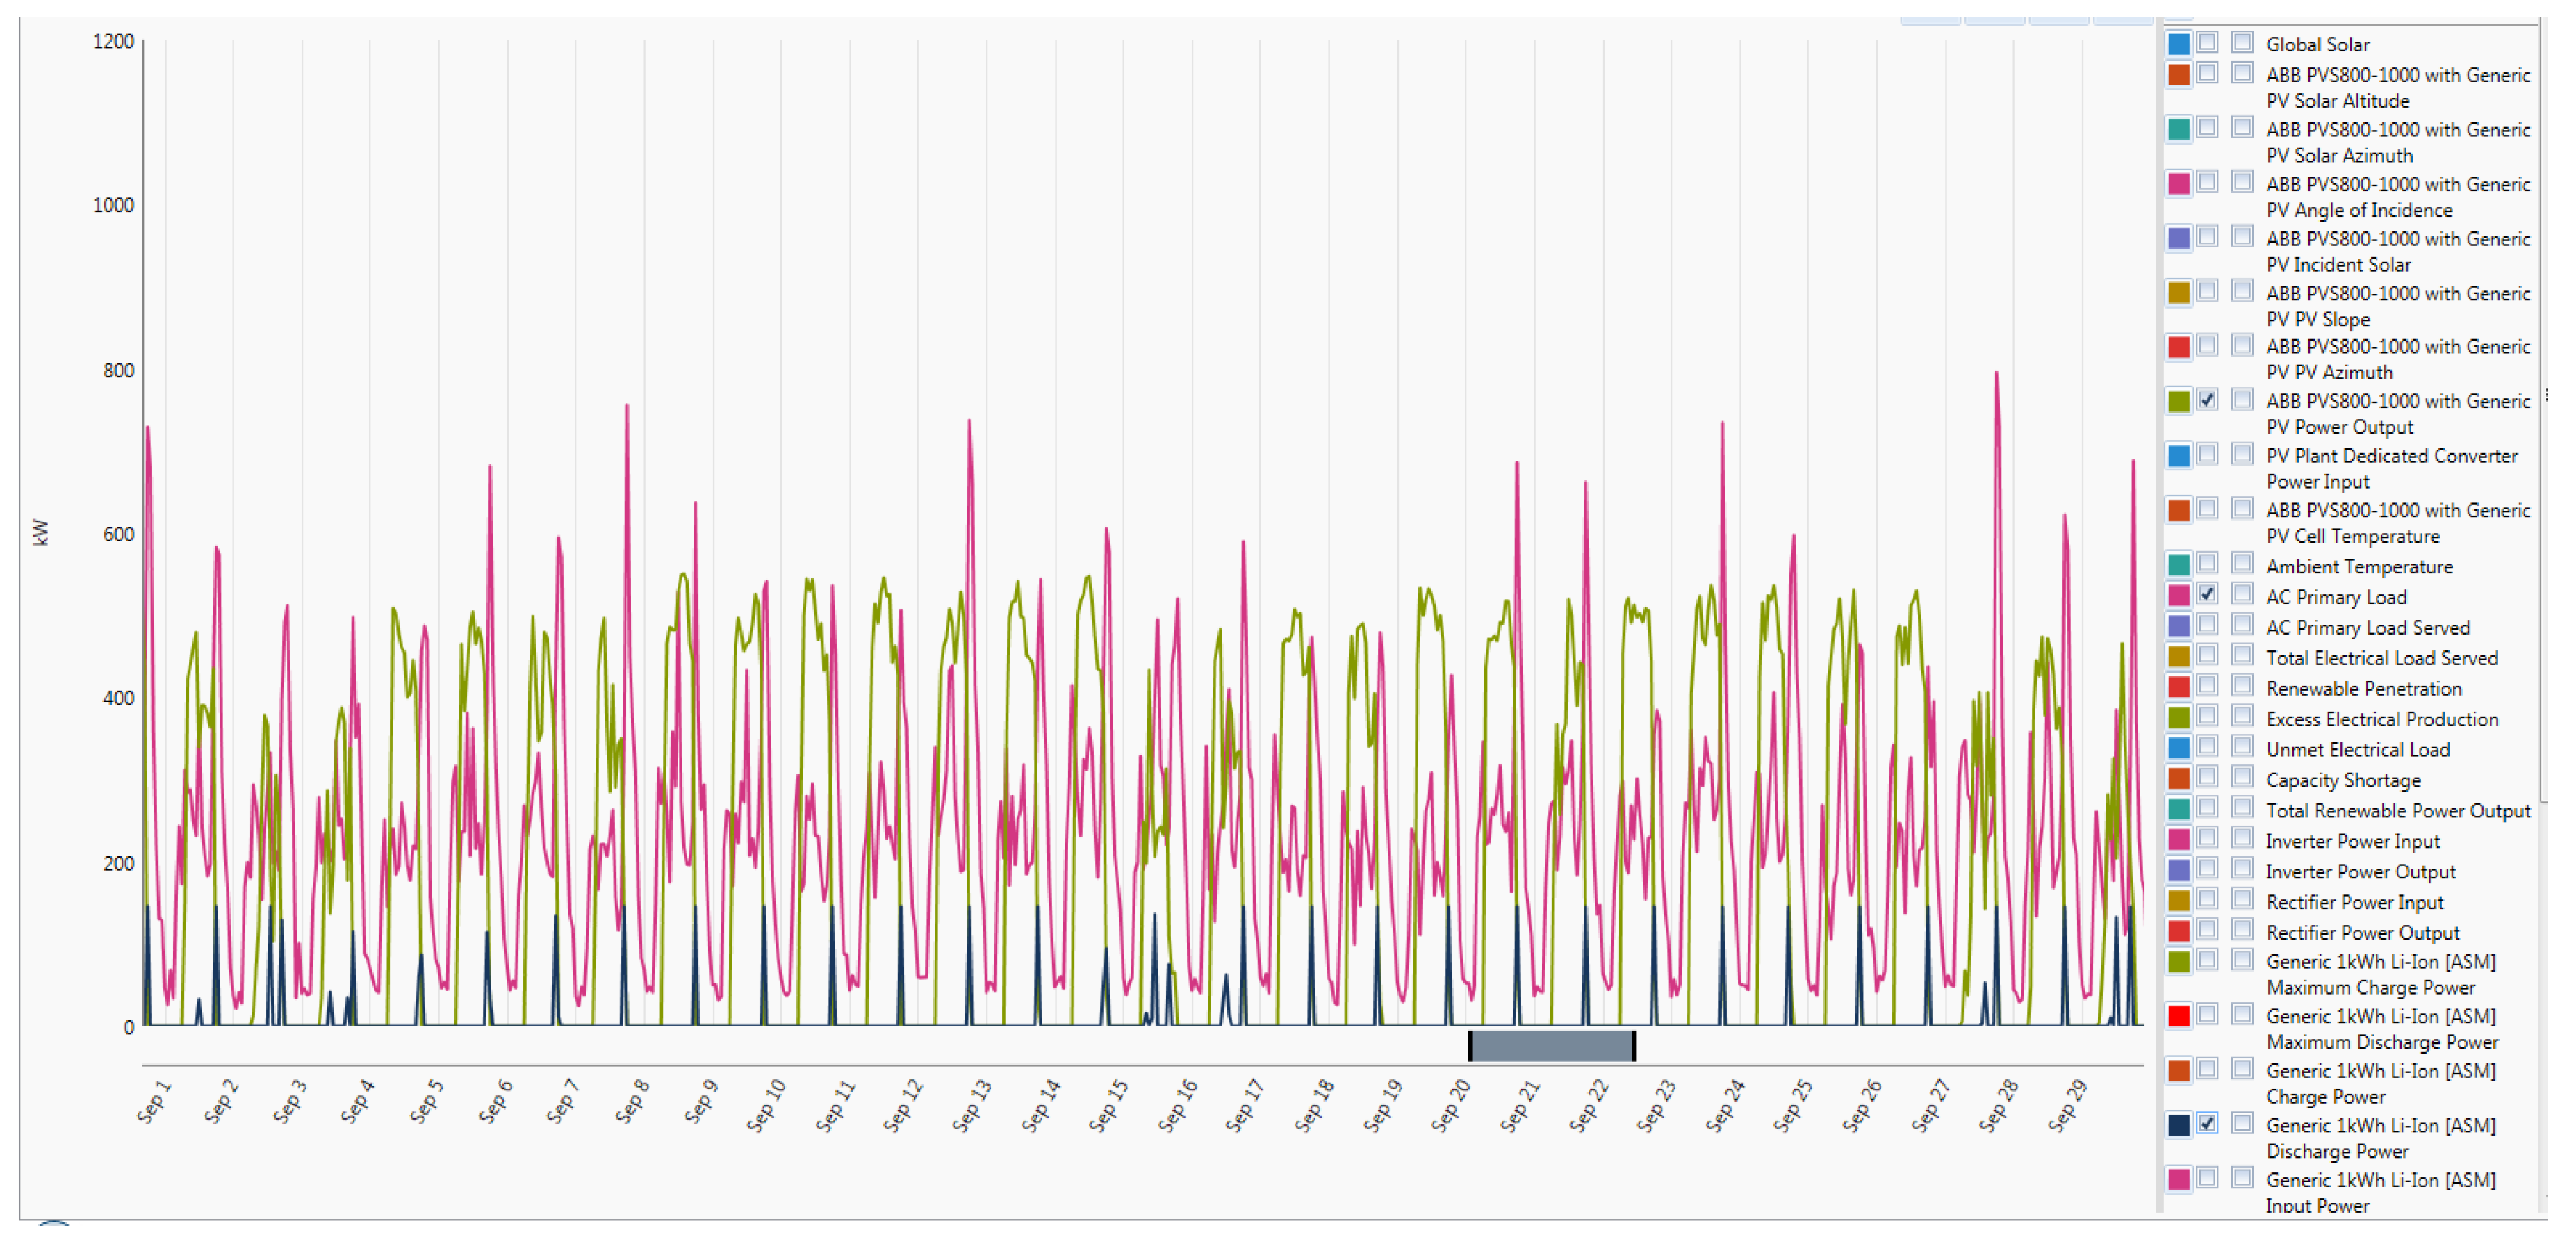
4.3. Case Study 3: 3 MW Load, PV Plant and 20% Storage Battery Capacity
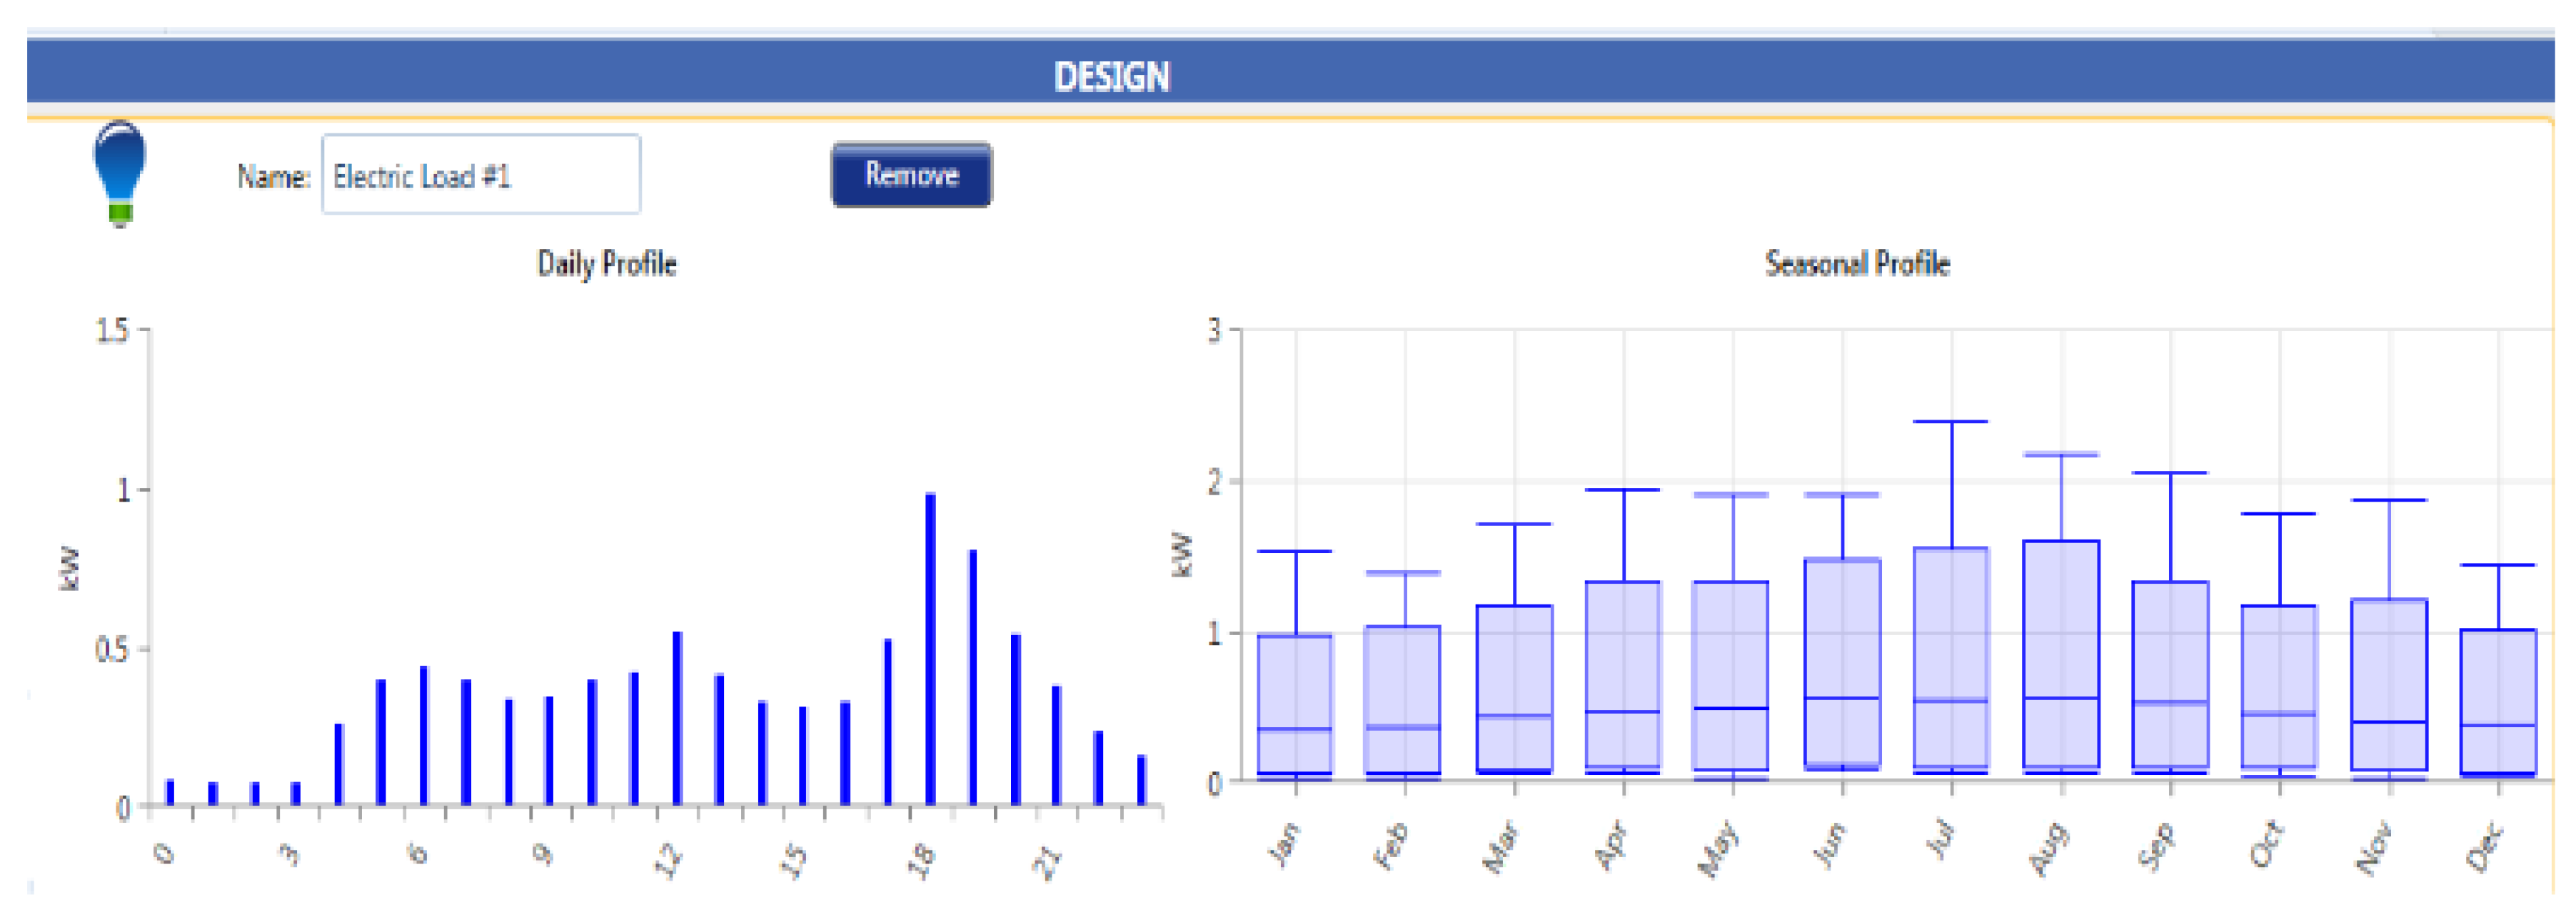
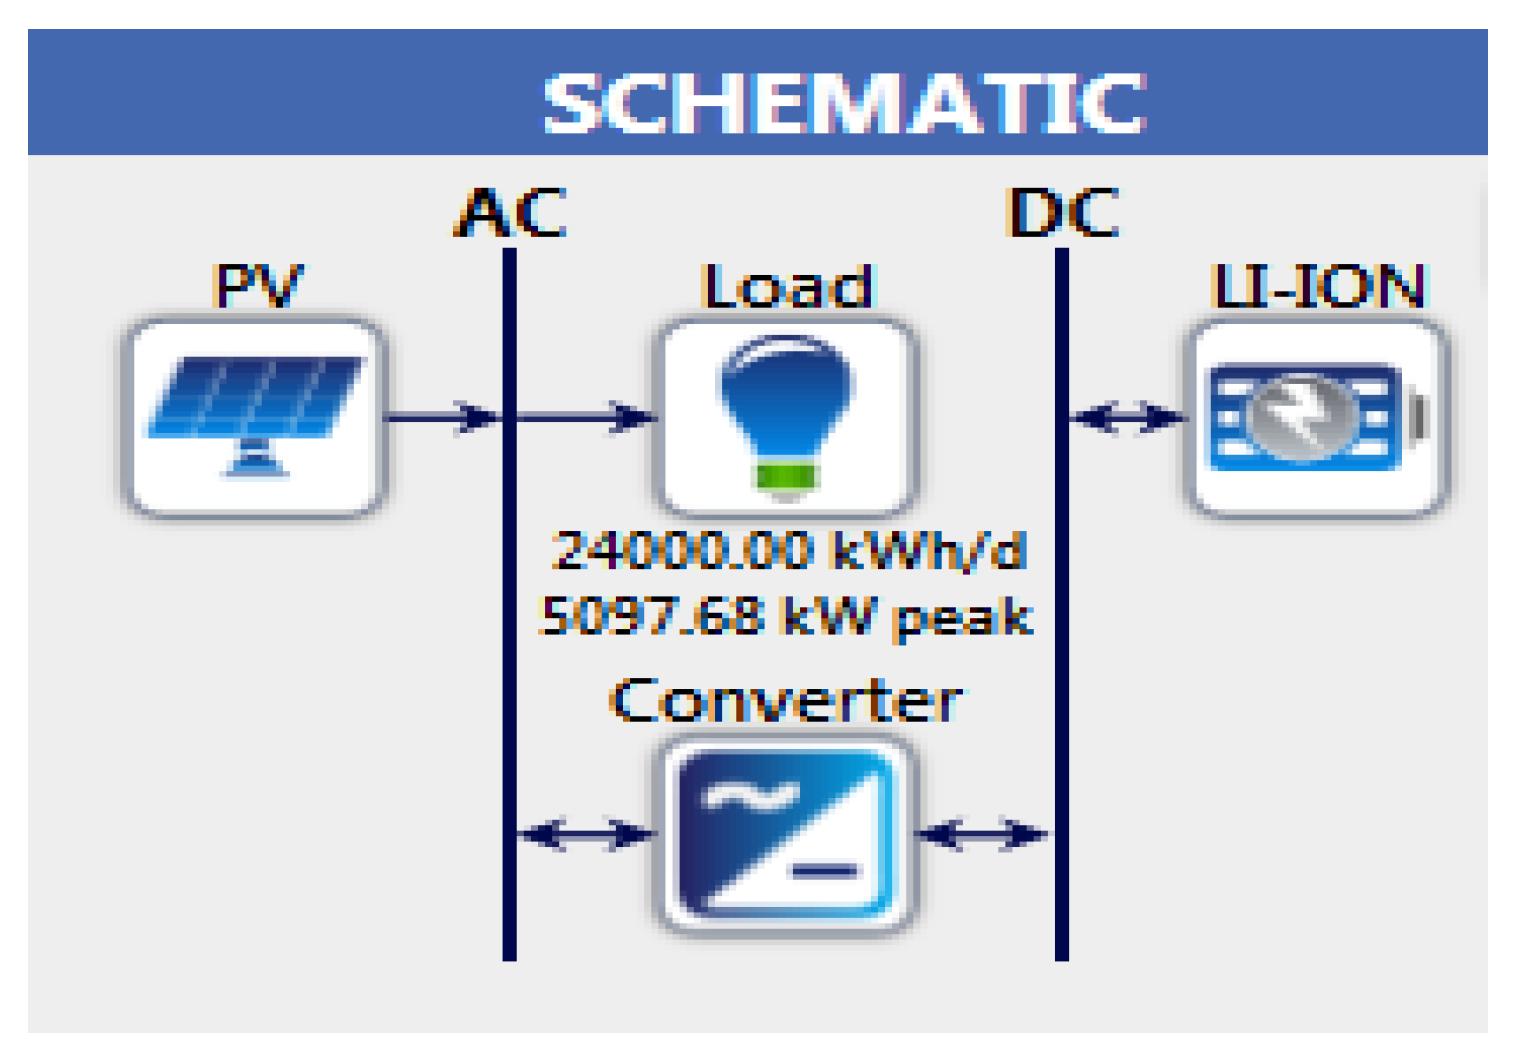
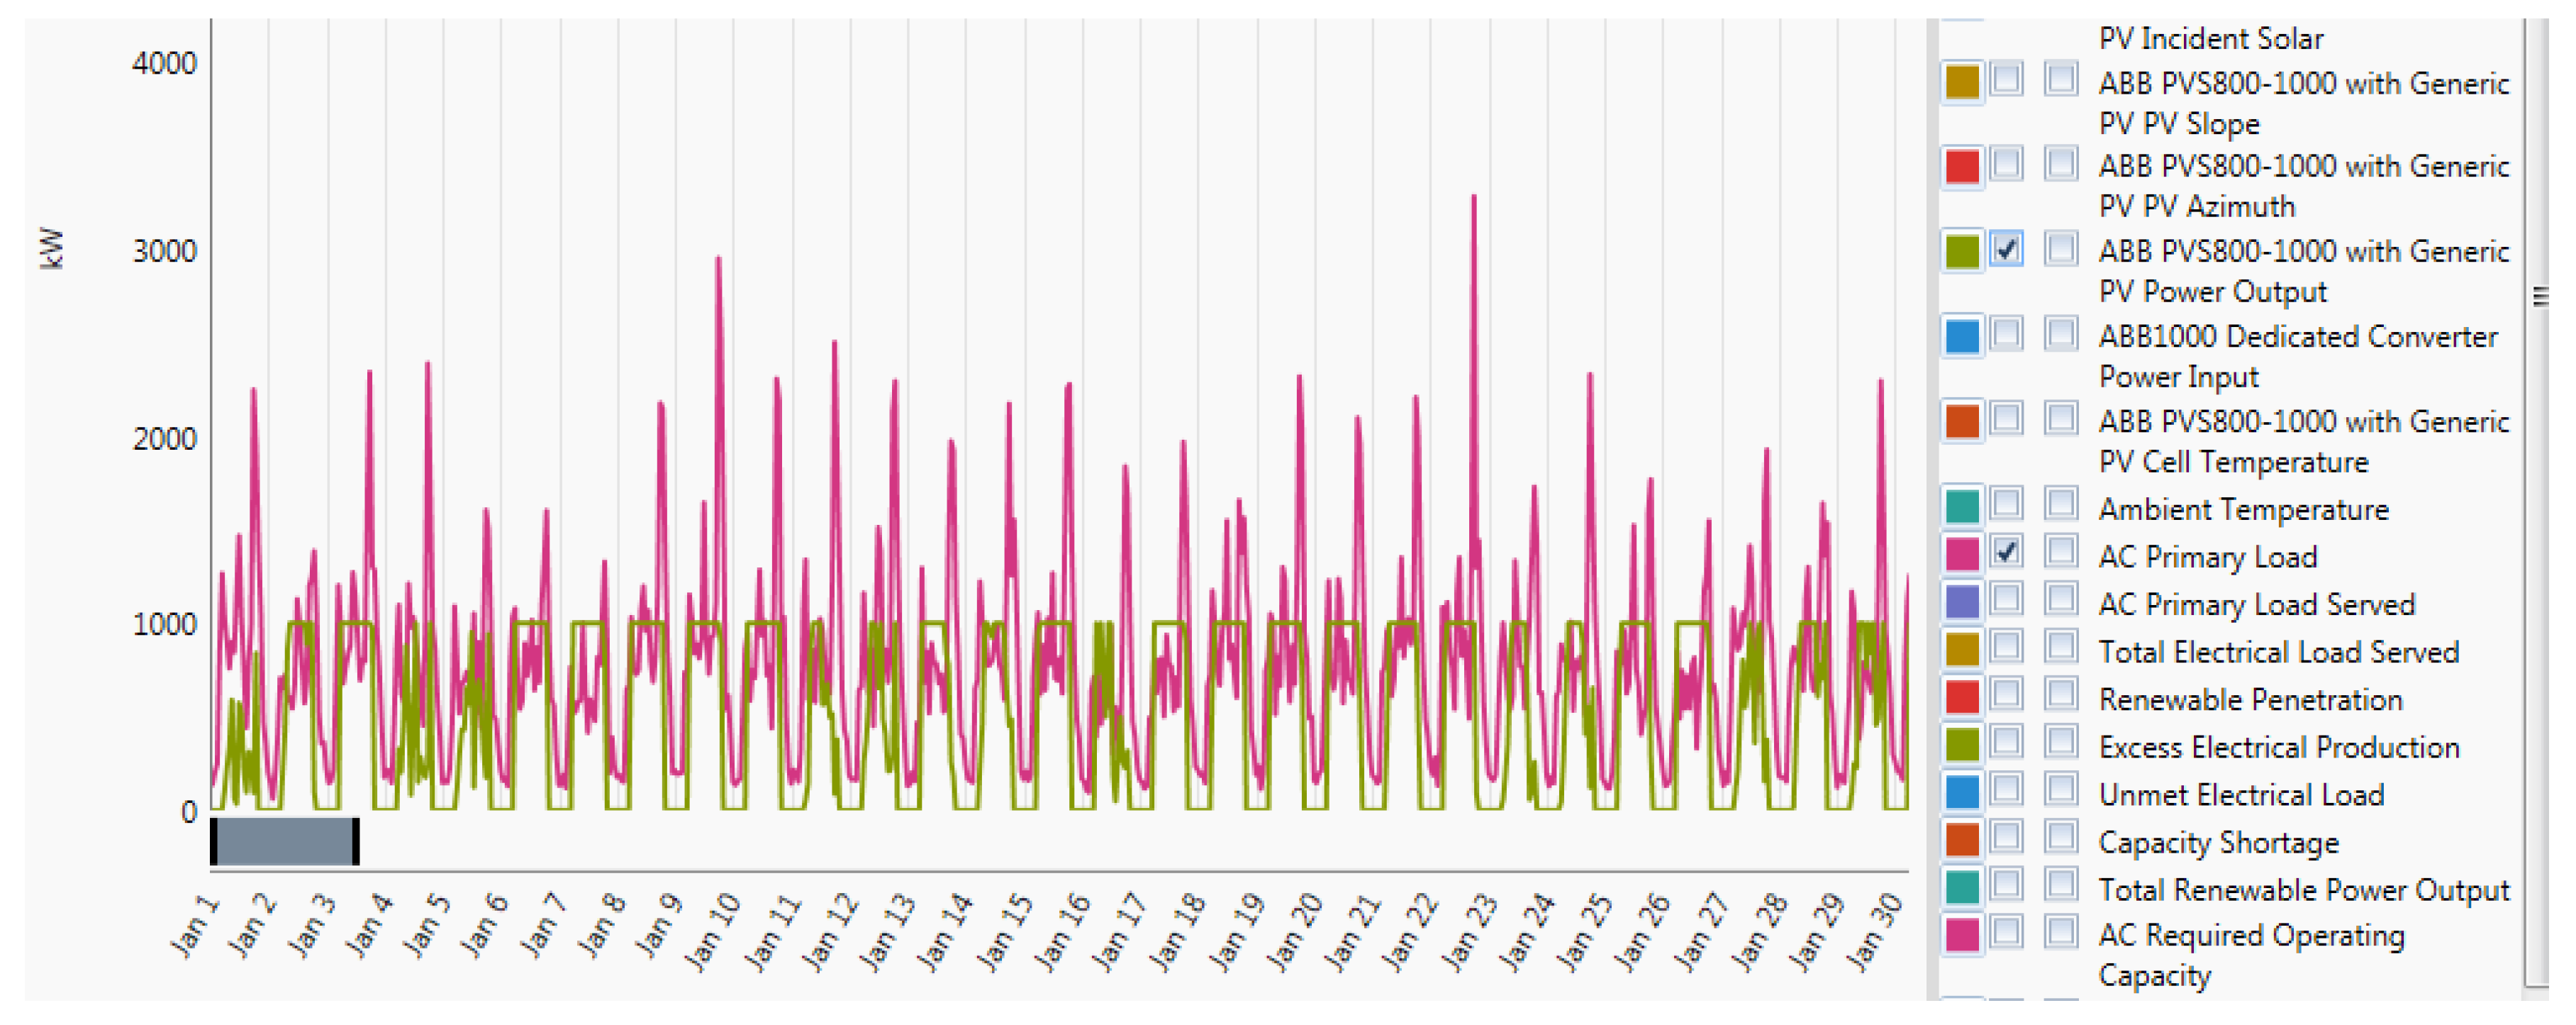
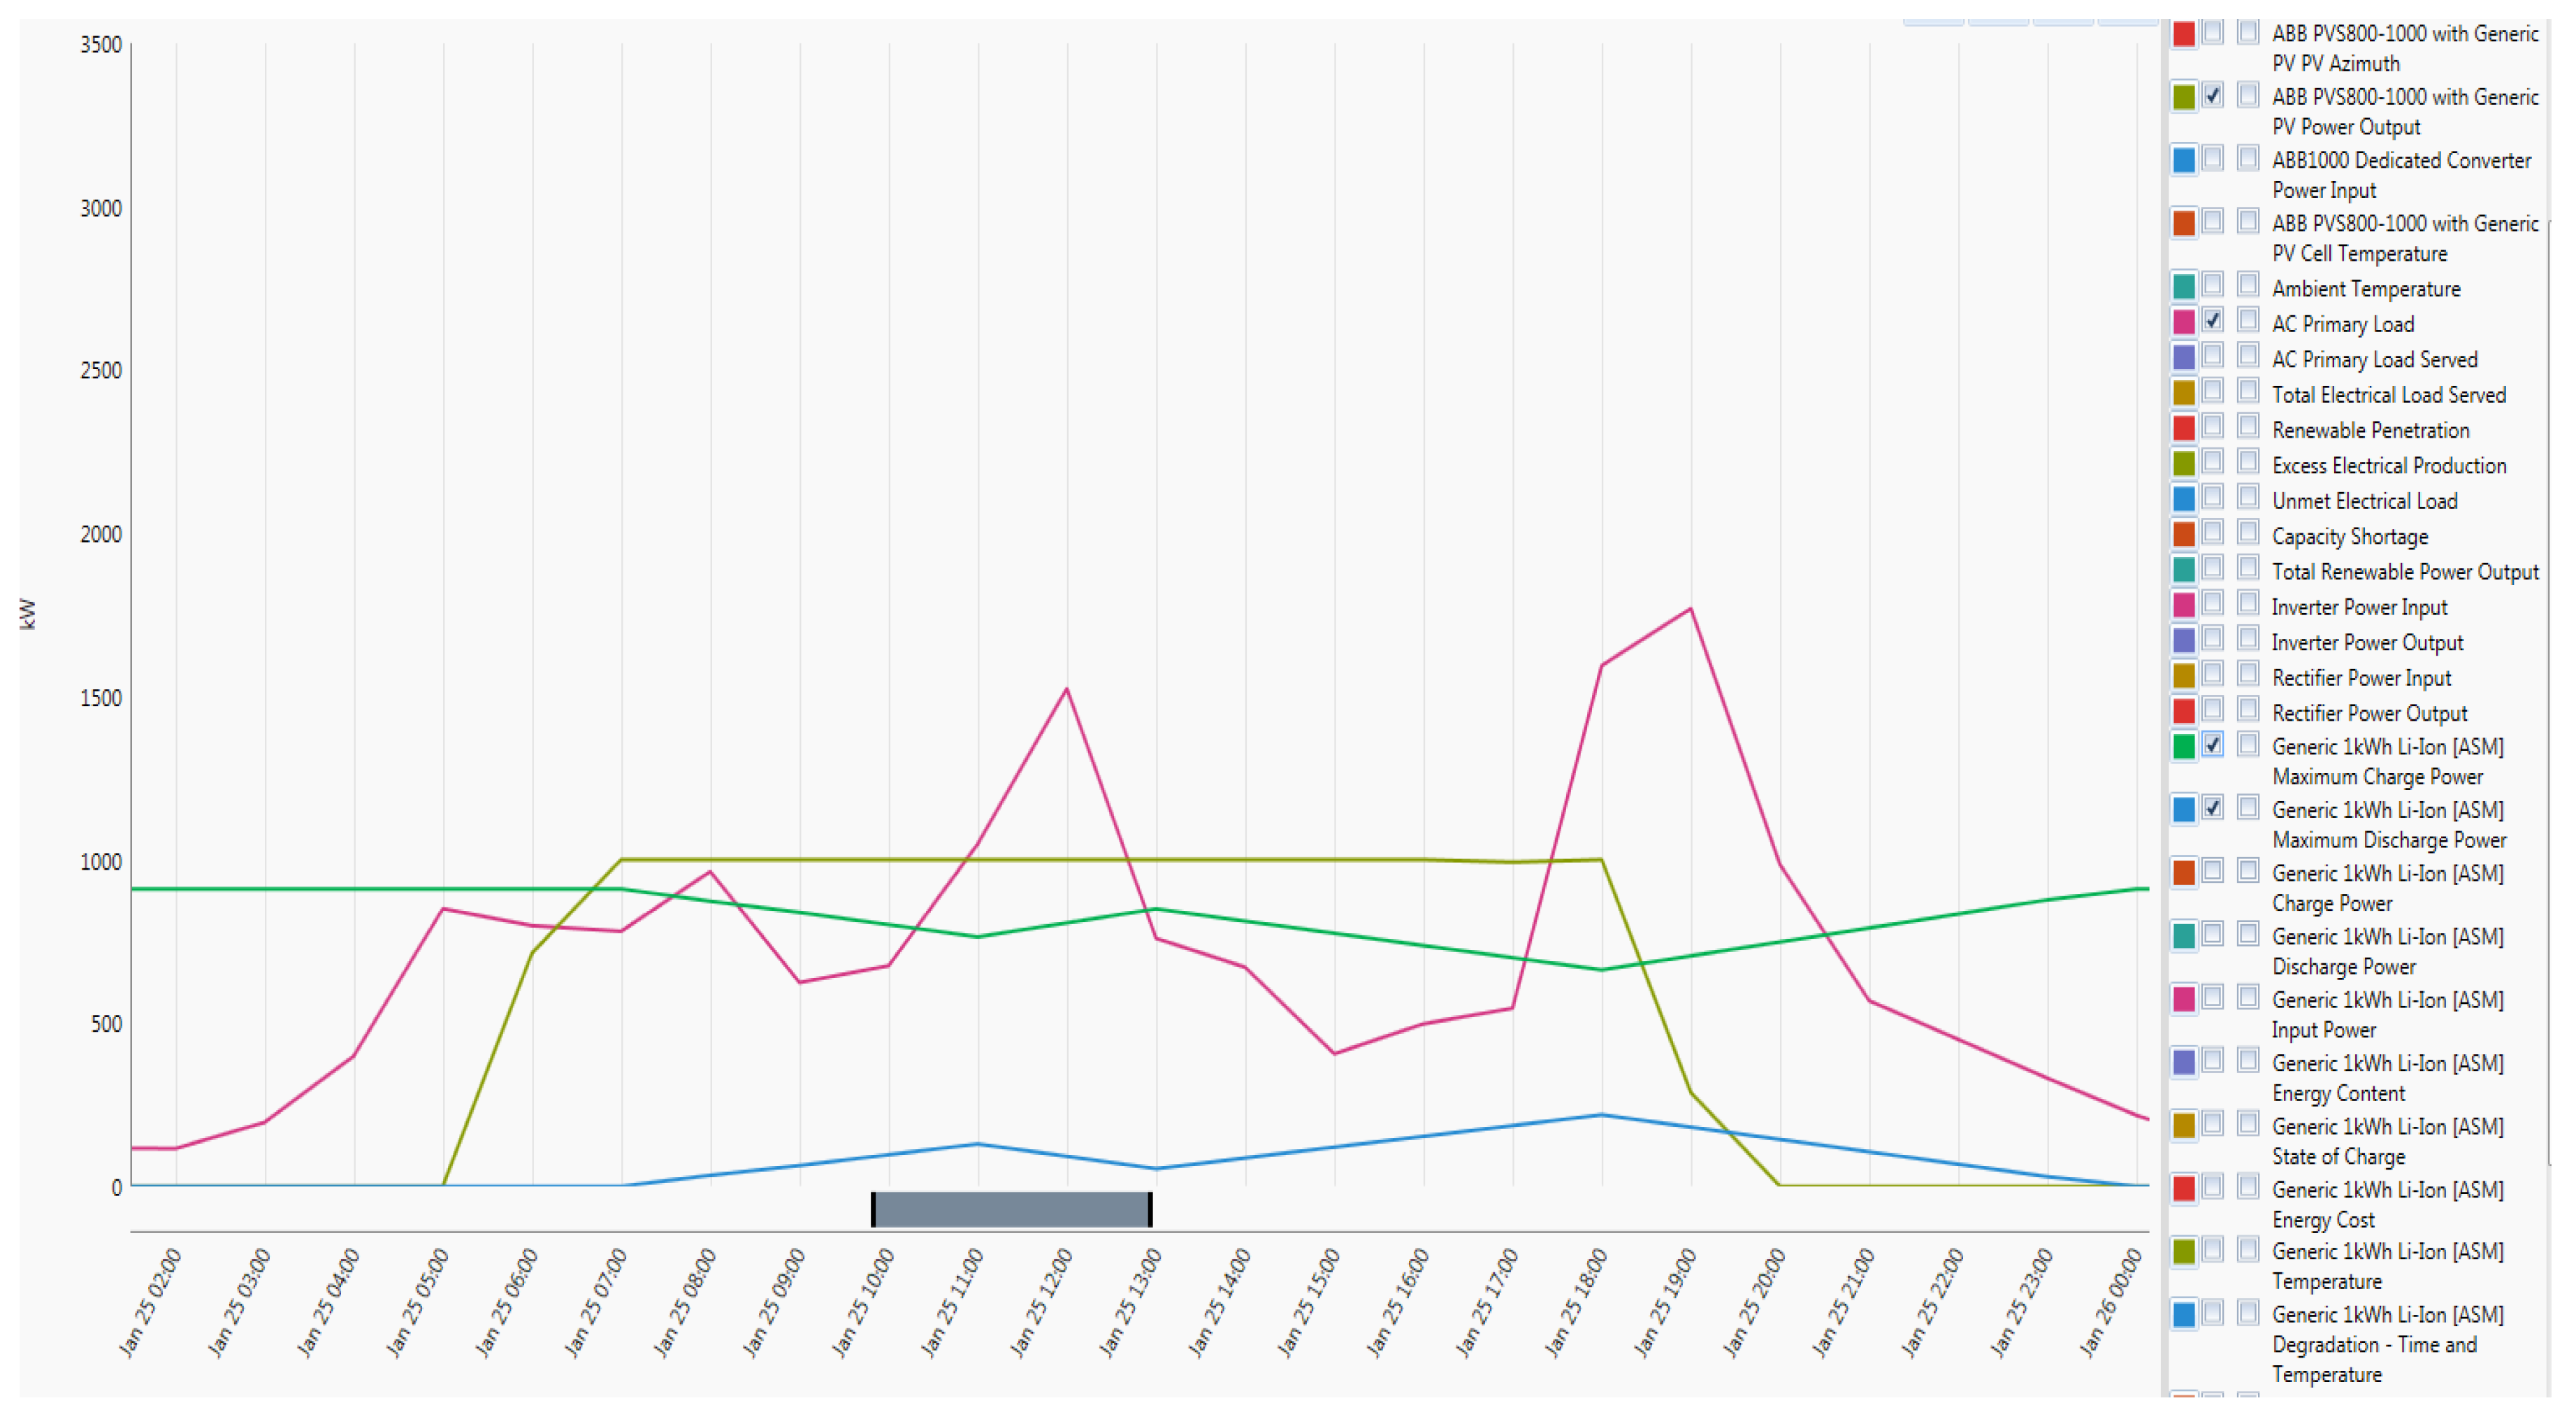
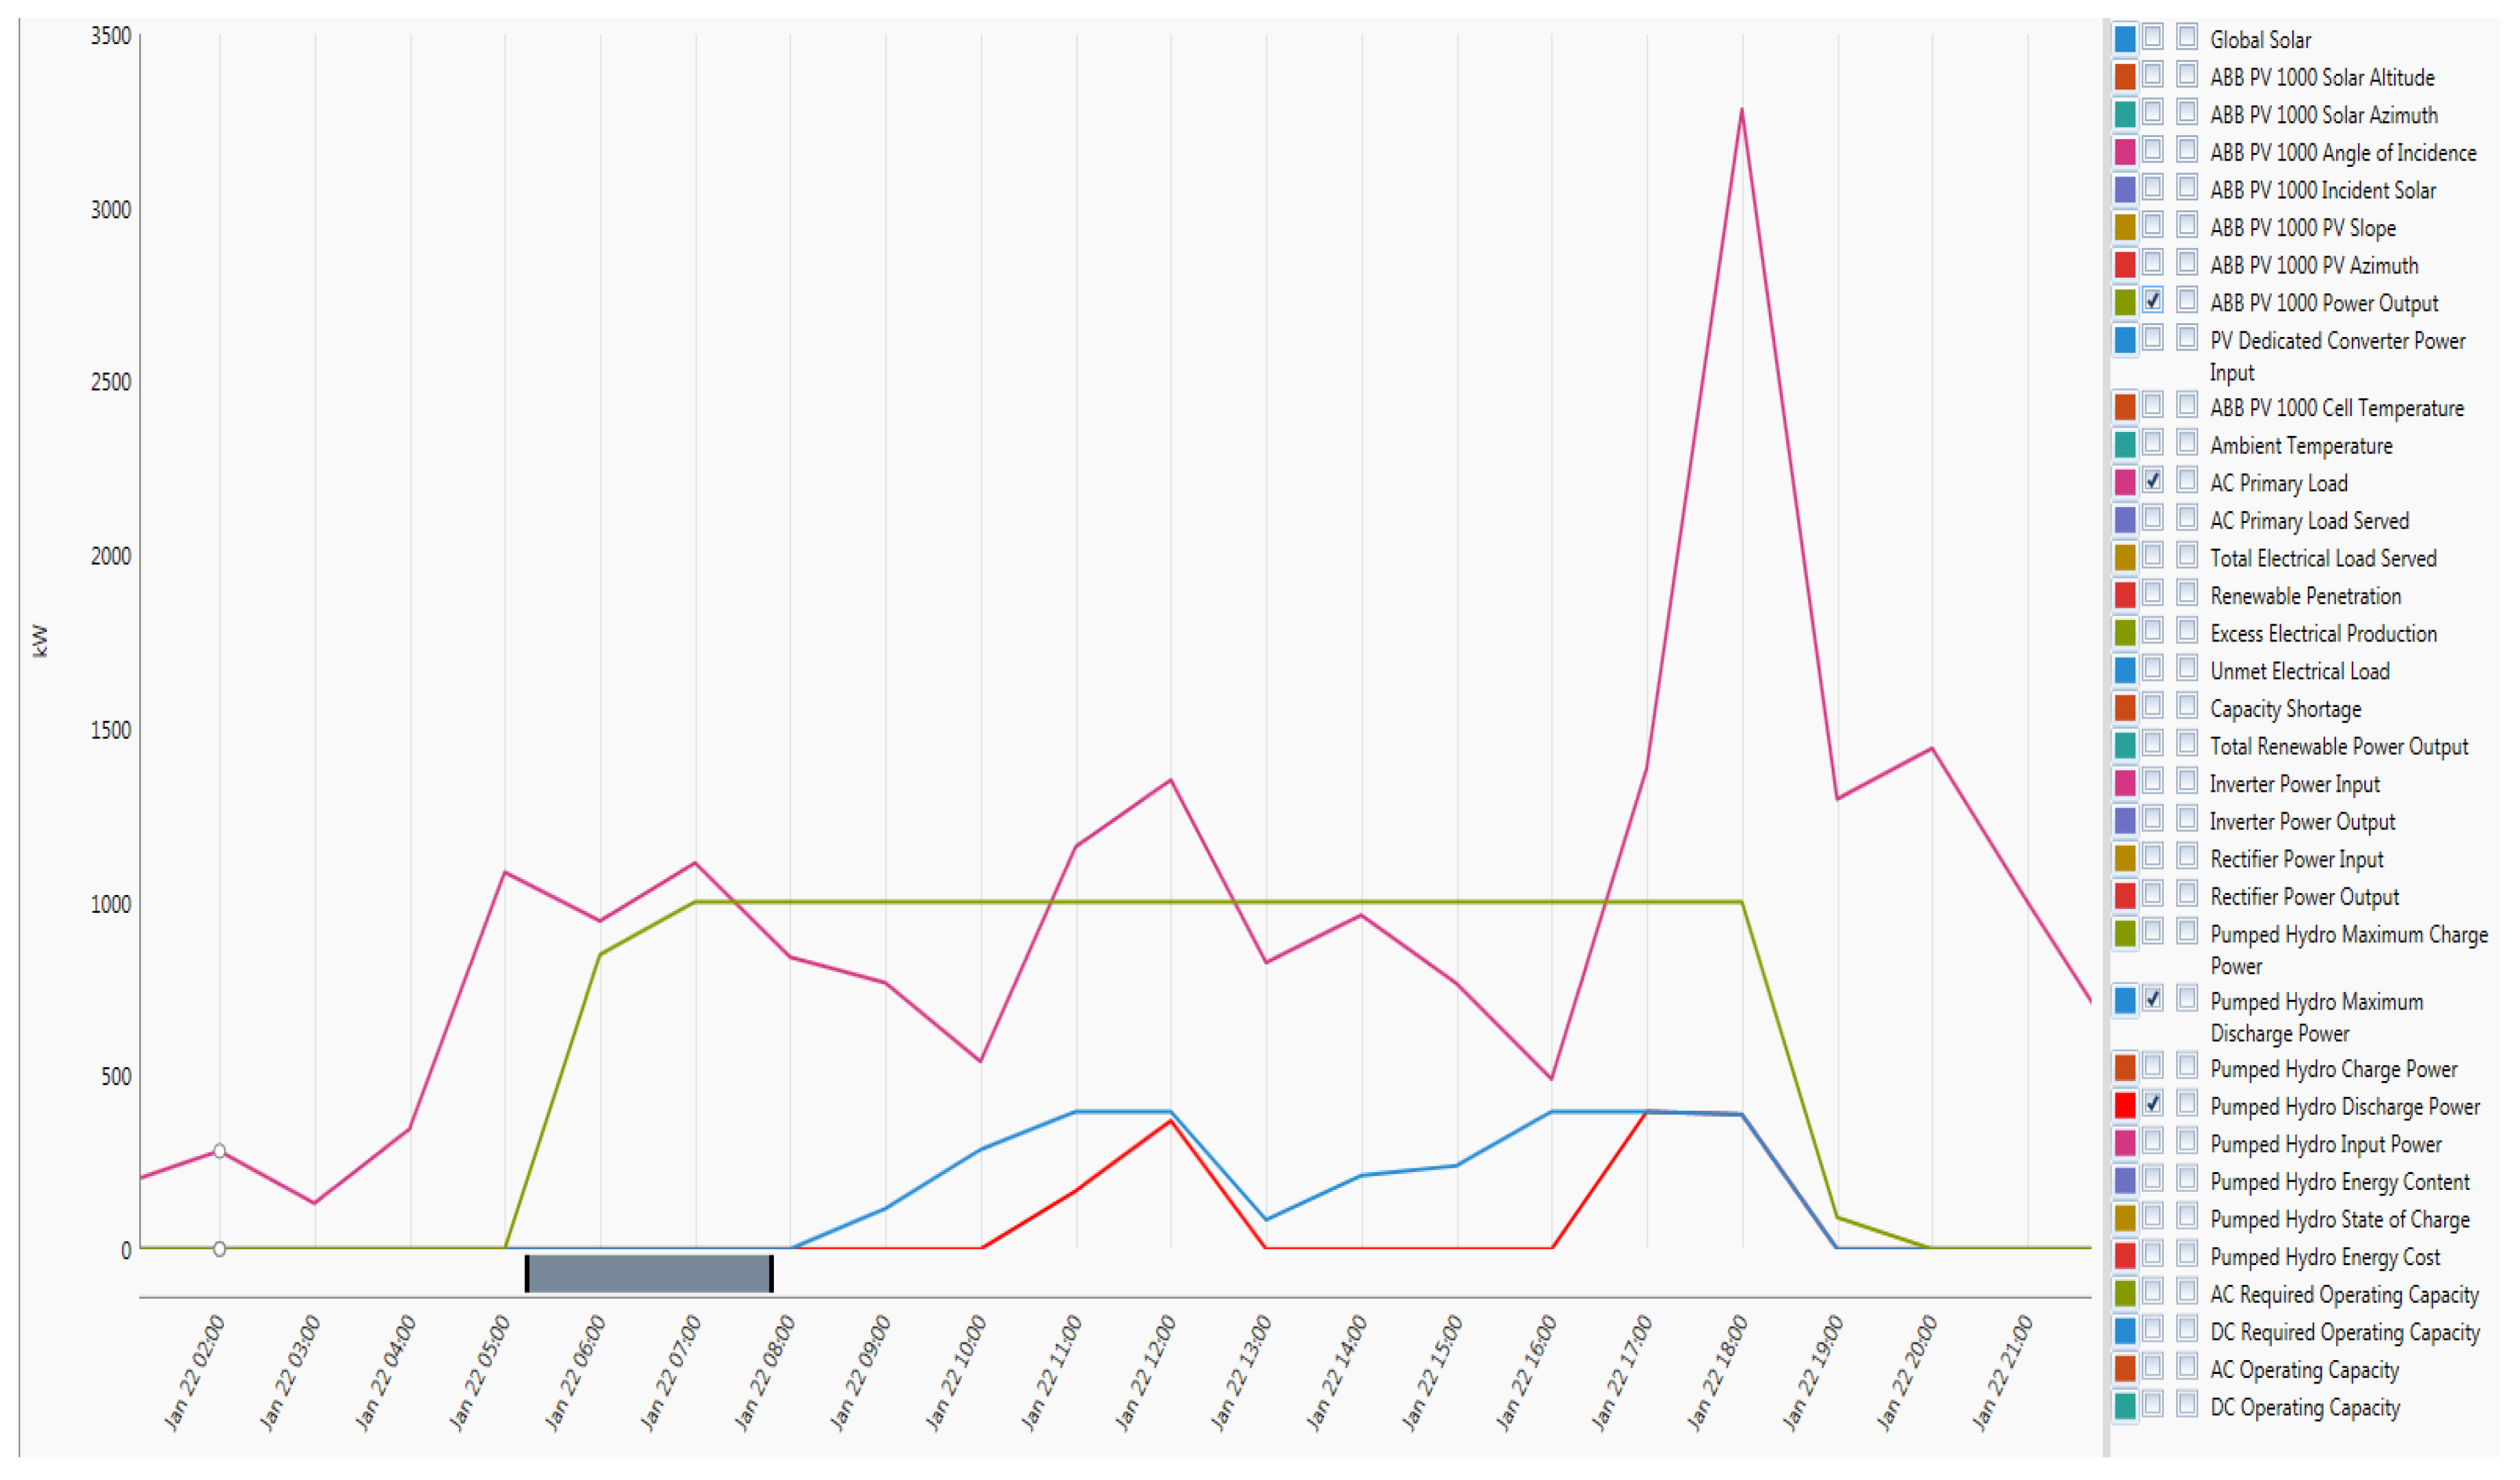
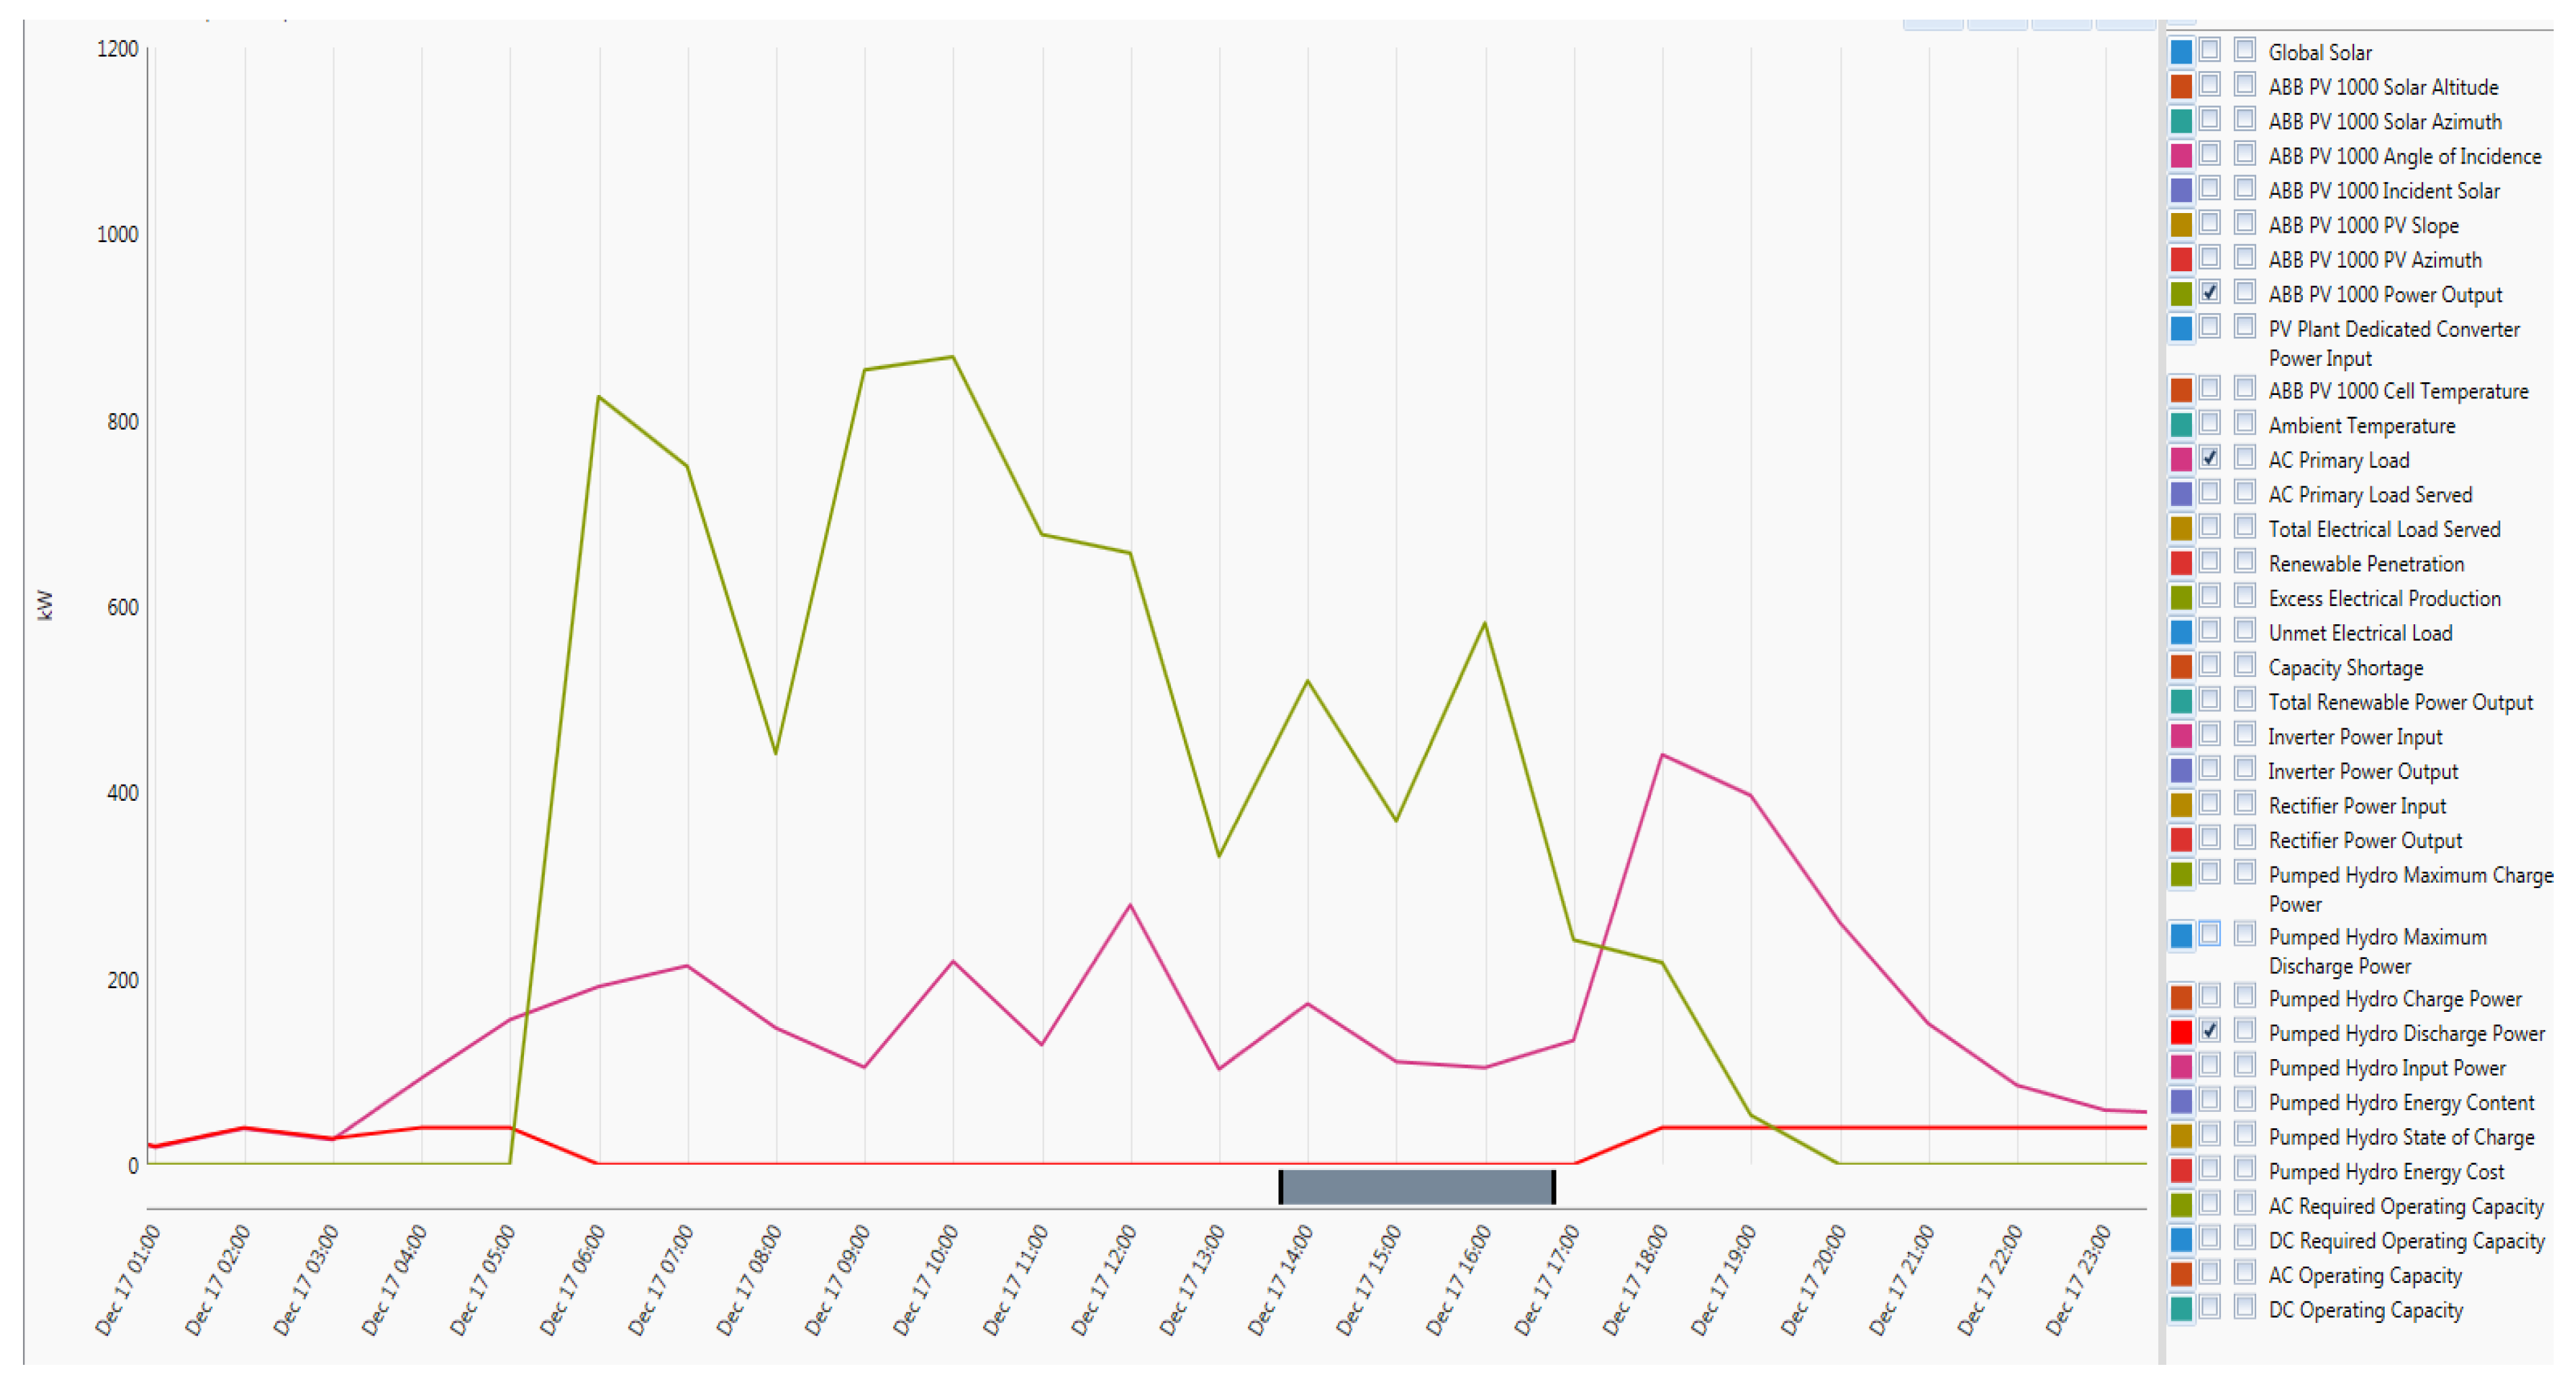
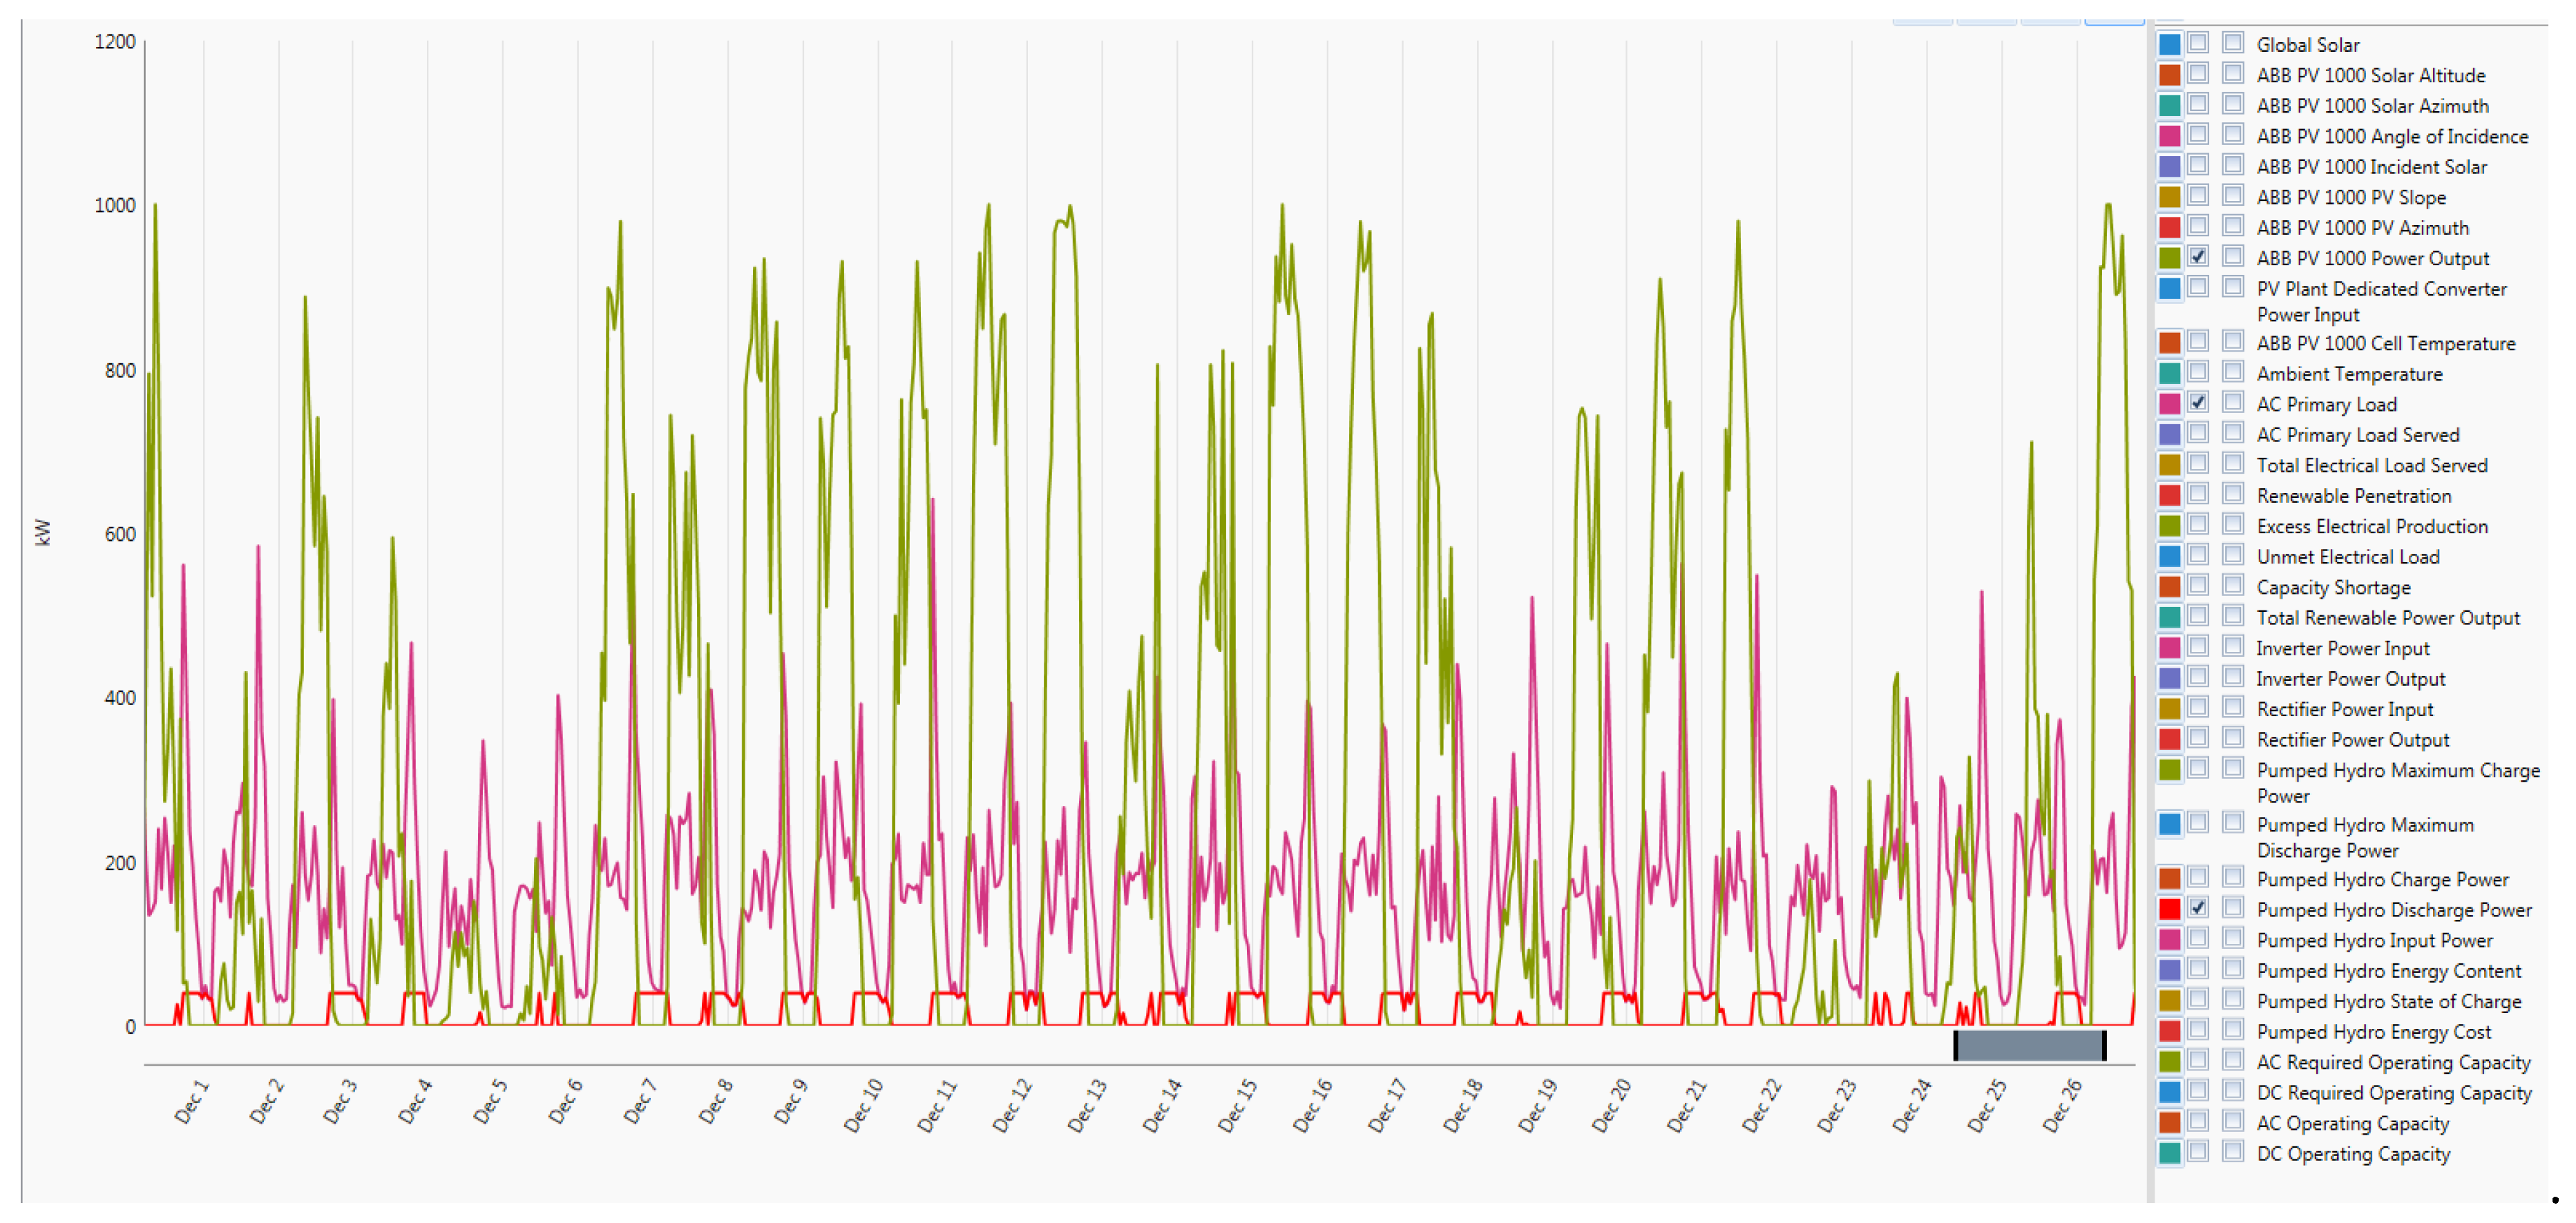
- PV power output is drawn as a green line in the graph;
- The load is the purple line in the graph;
- Maximum discharge battery output is drawn as a blue line; and
- The operating discharge output is in red on the graph.
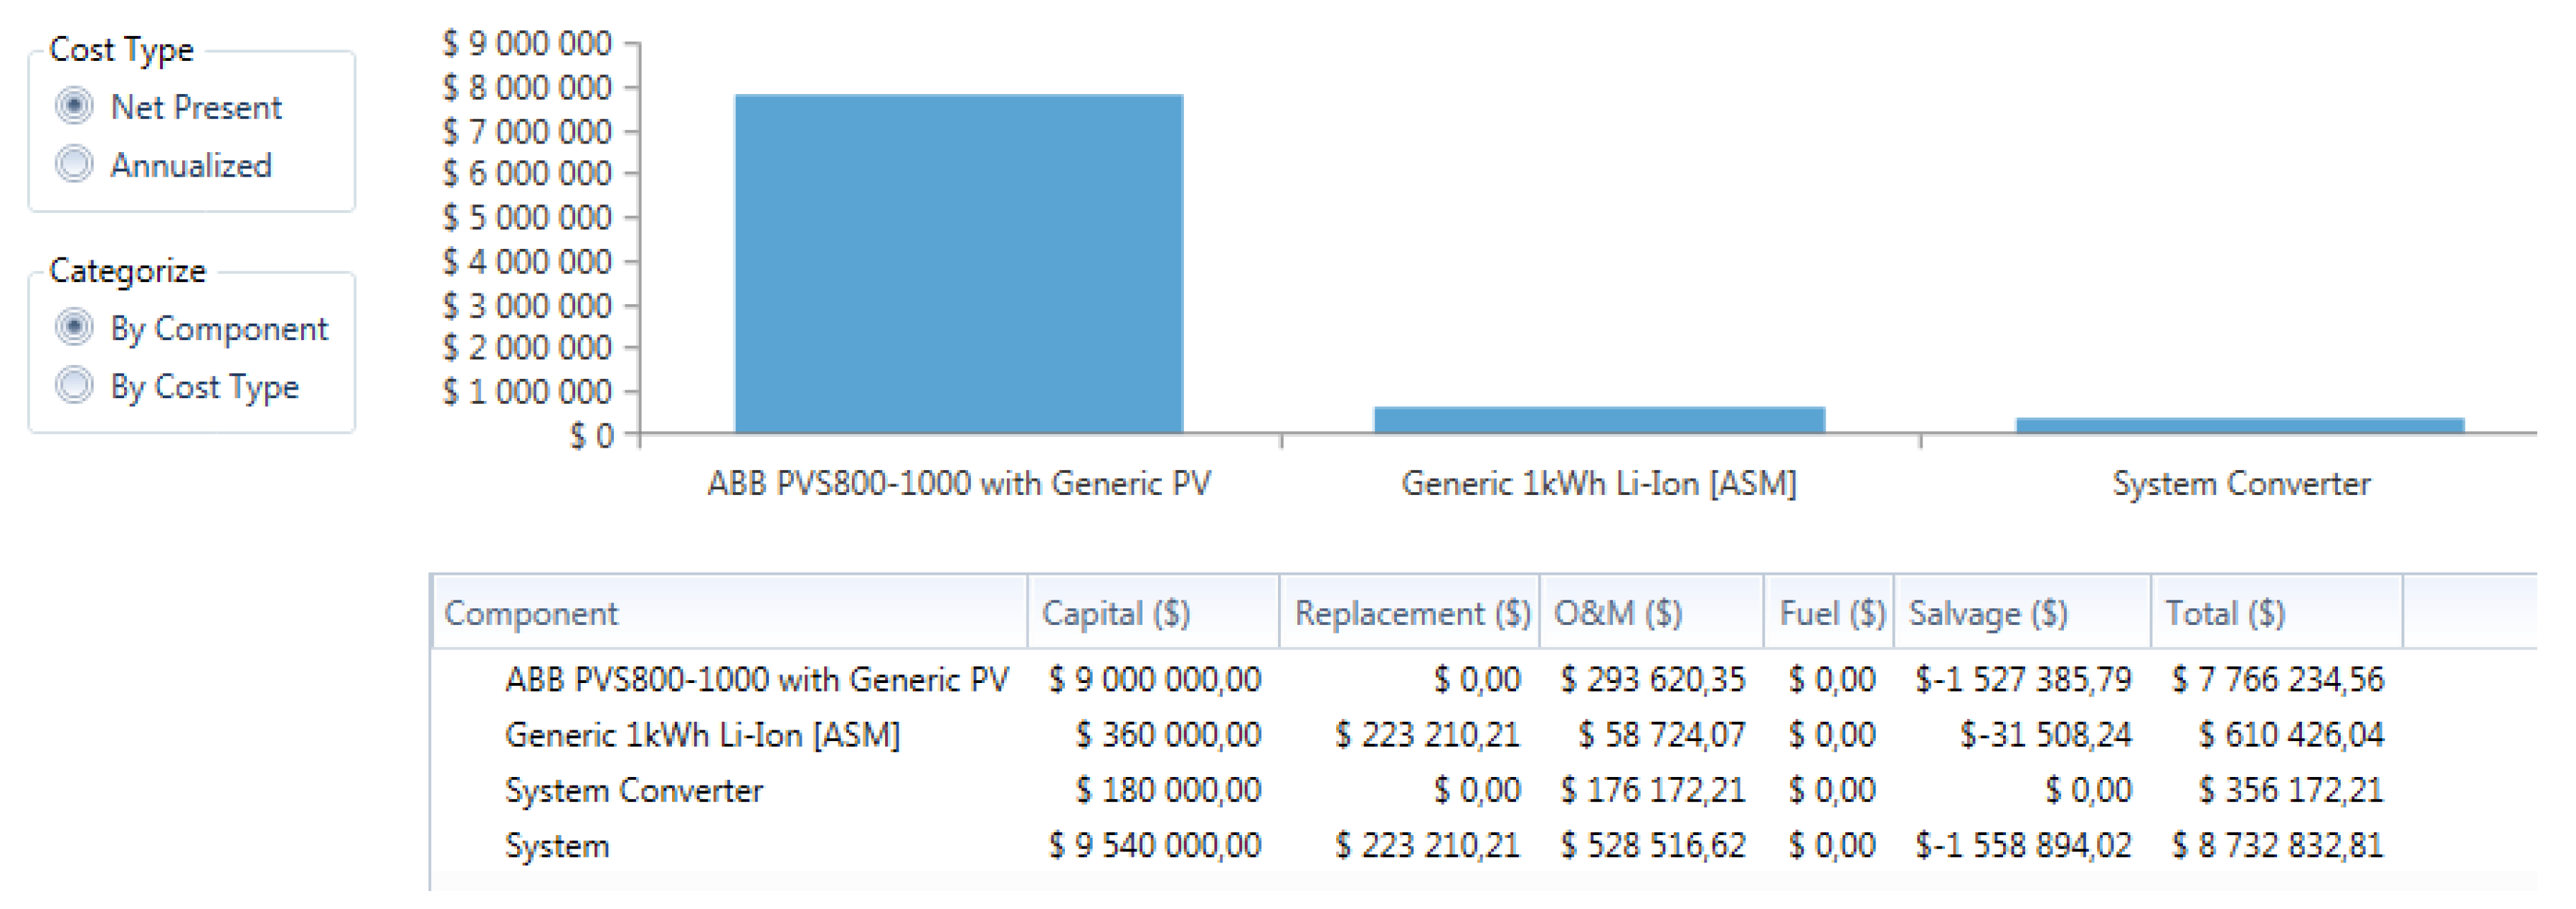
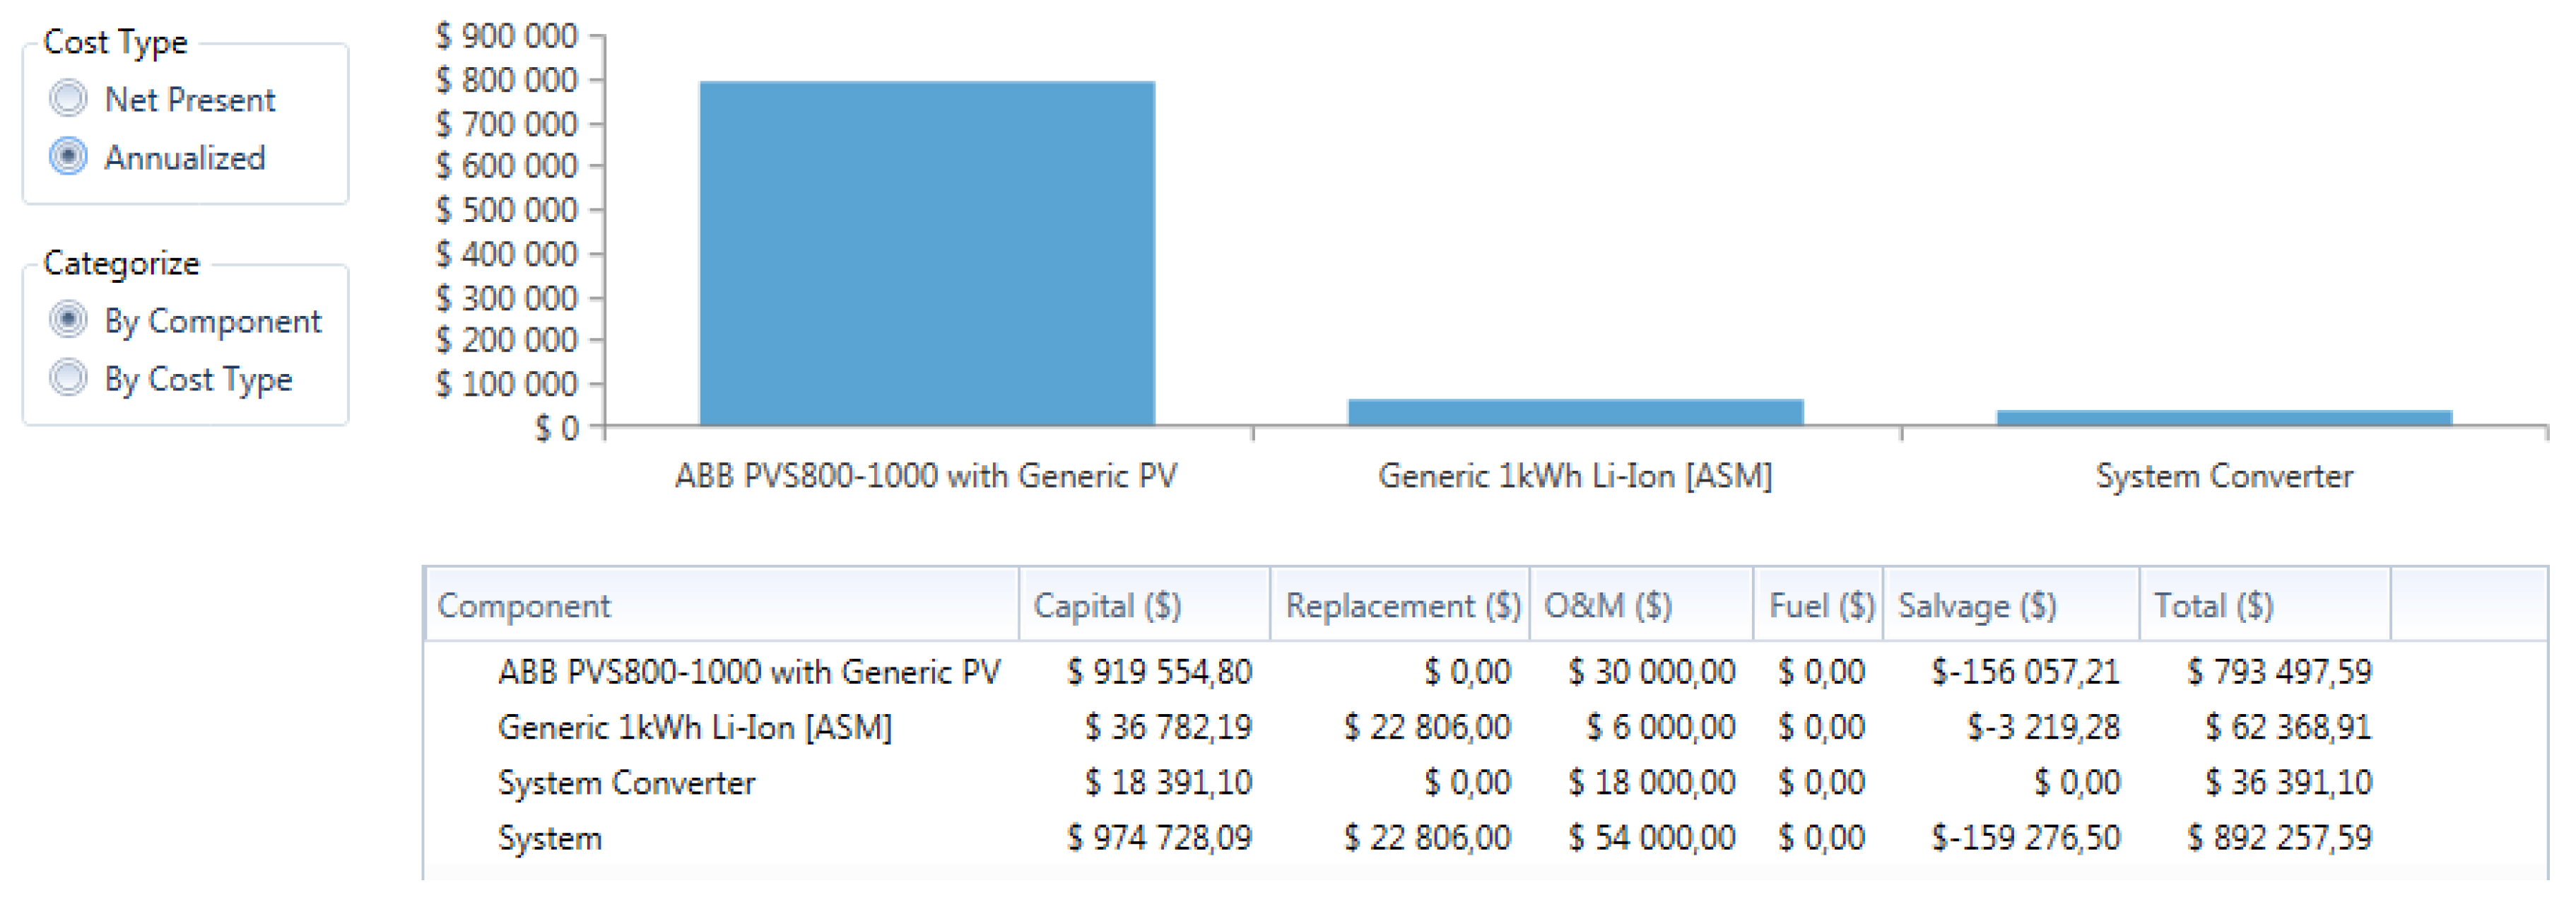
4.4. PV-Battery Plant Off-Grid Cost Analysis
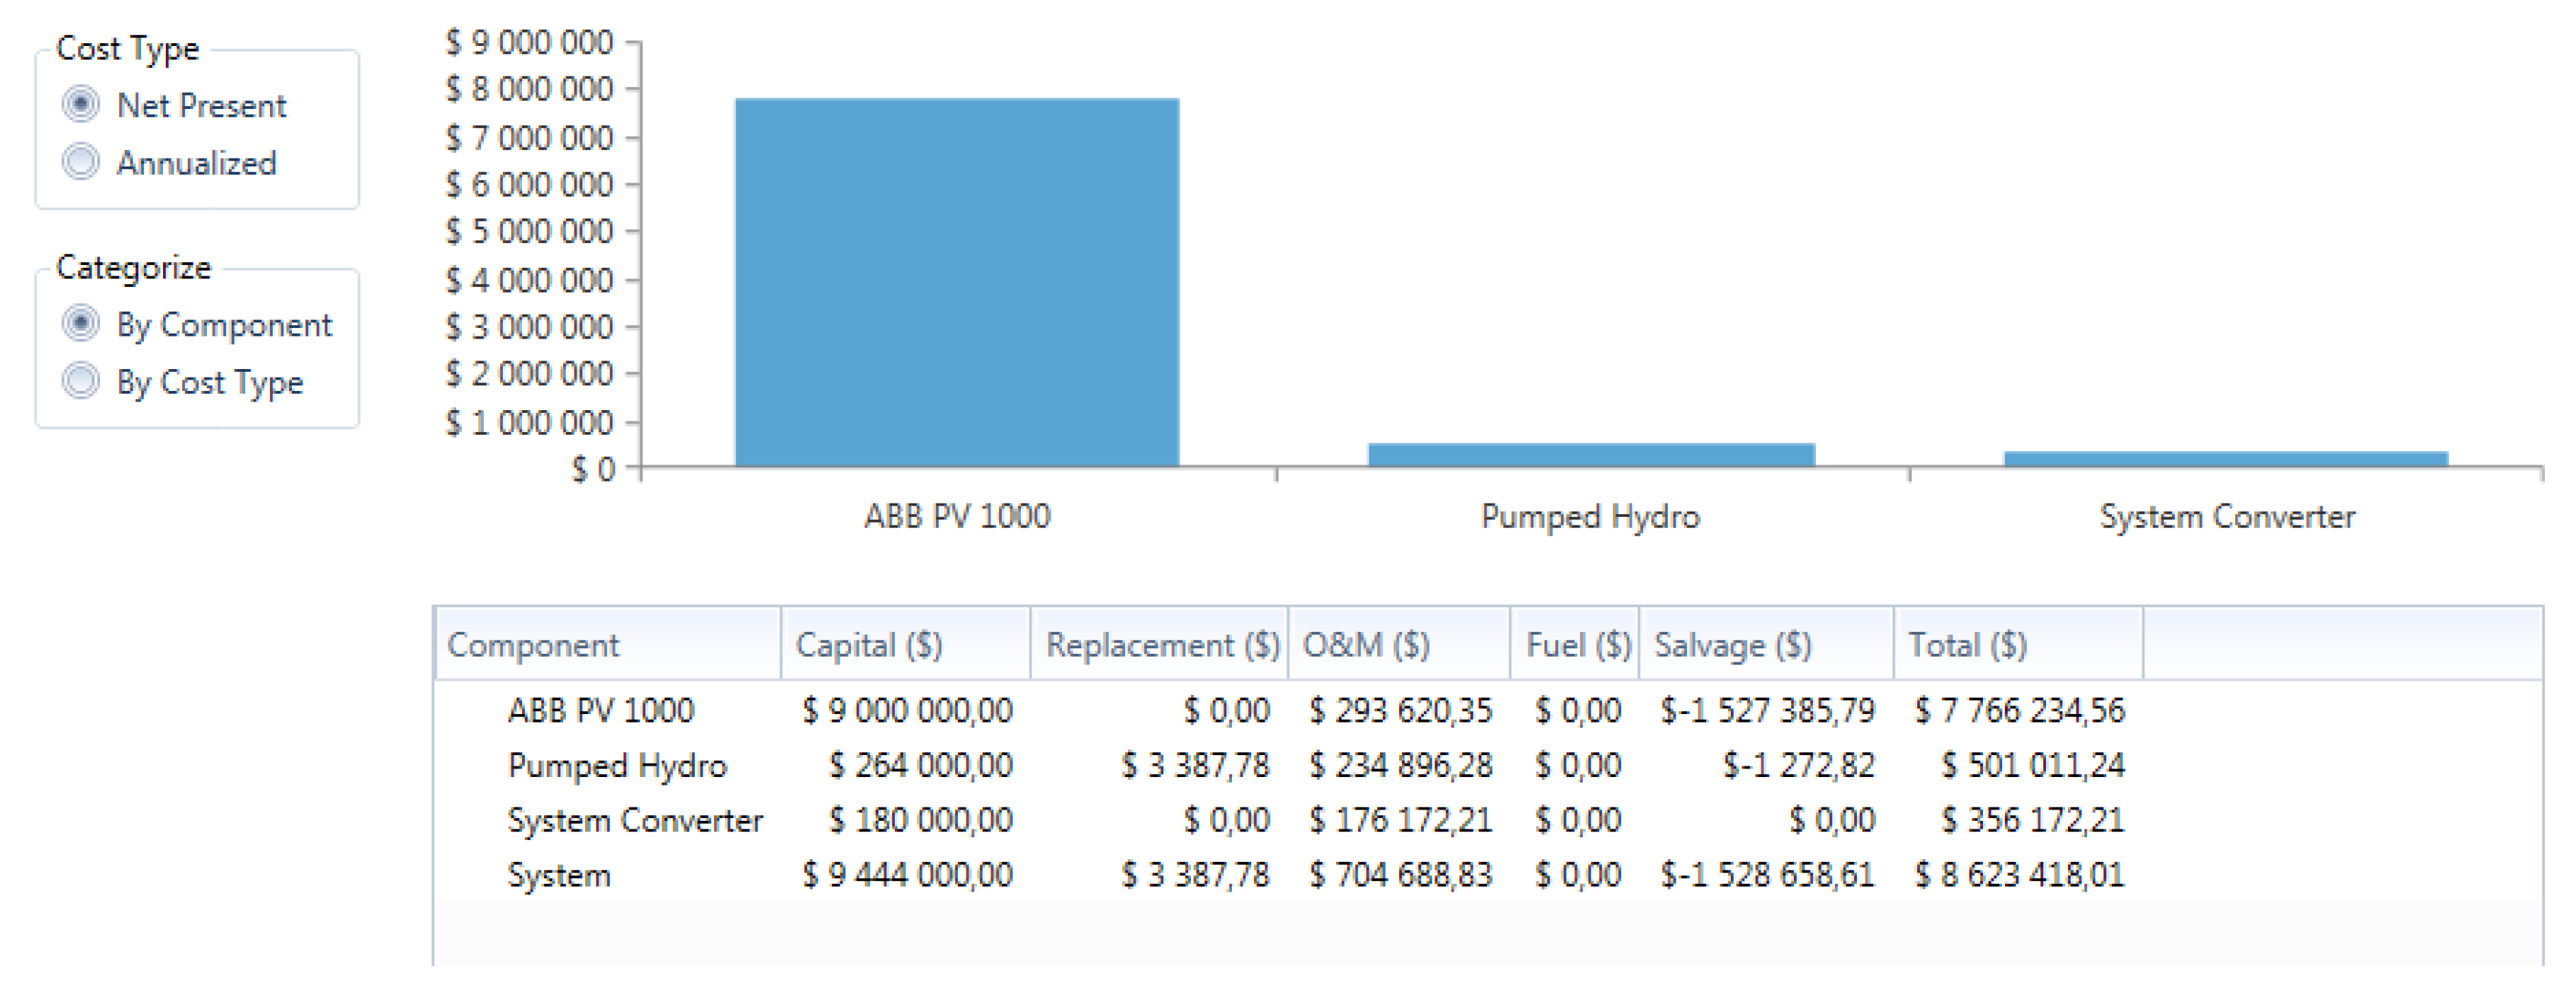
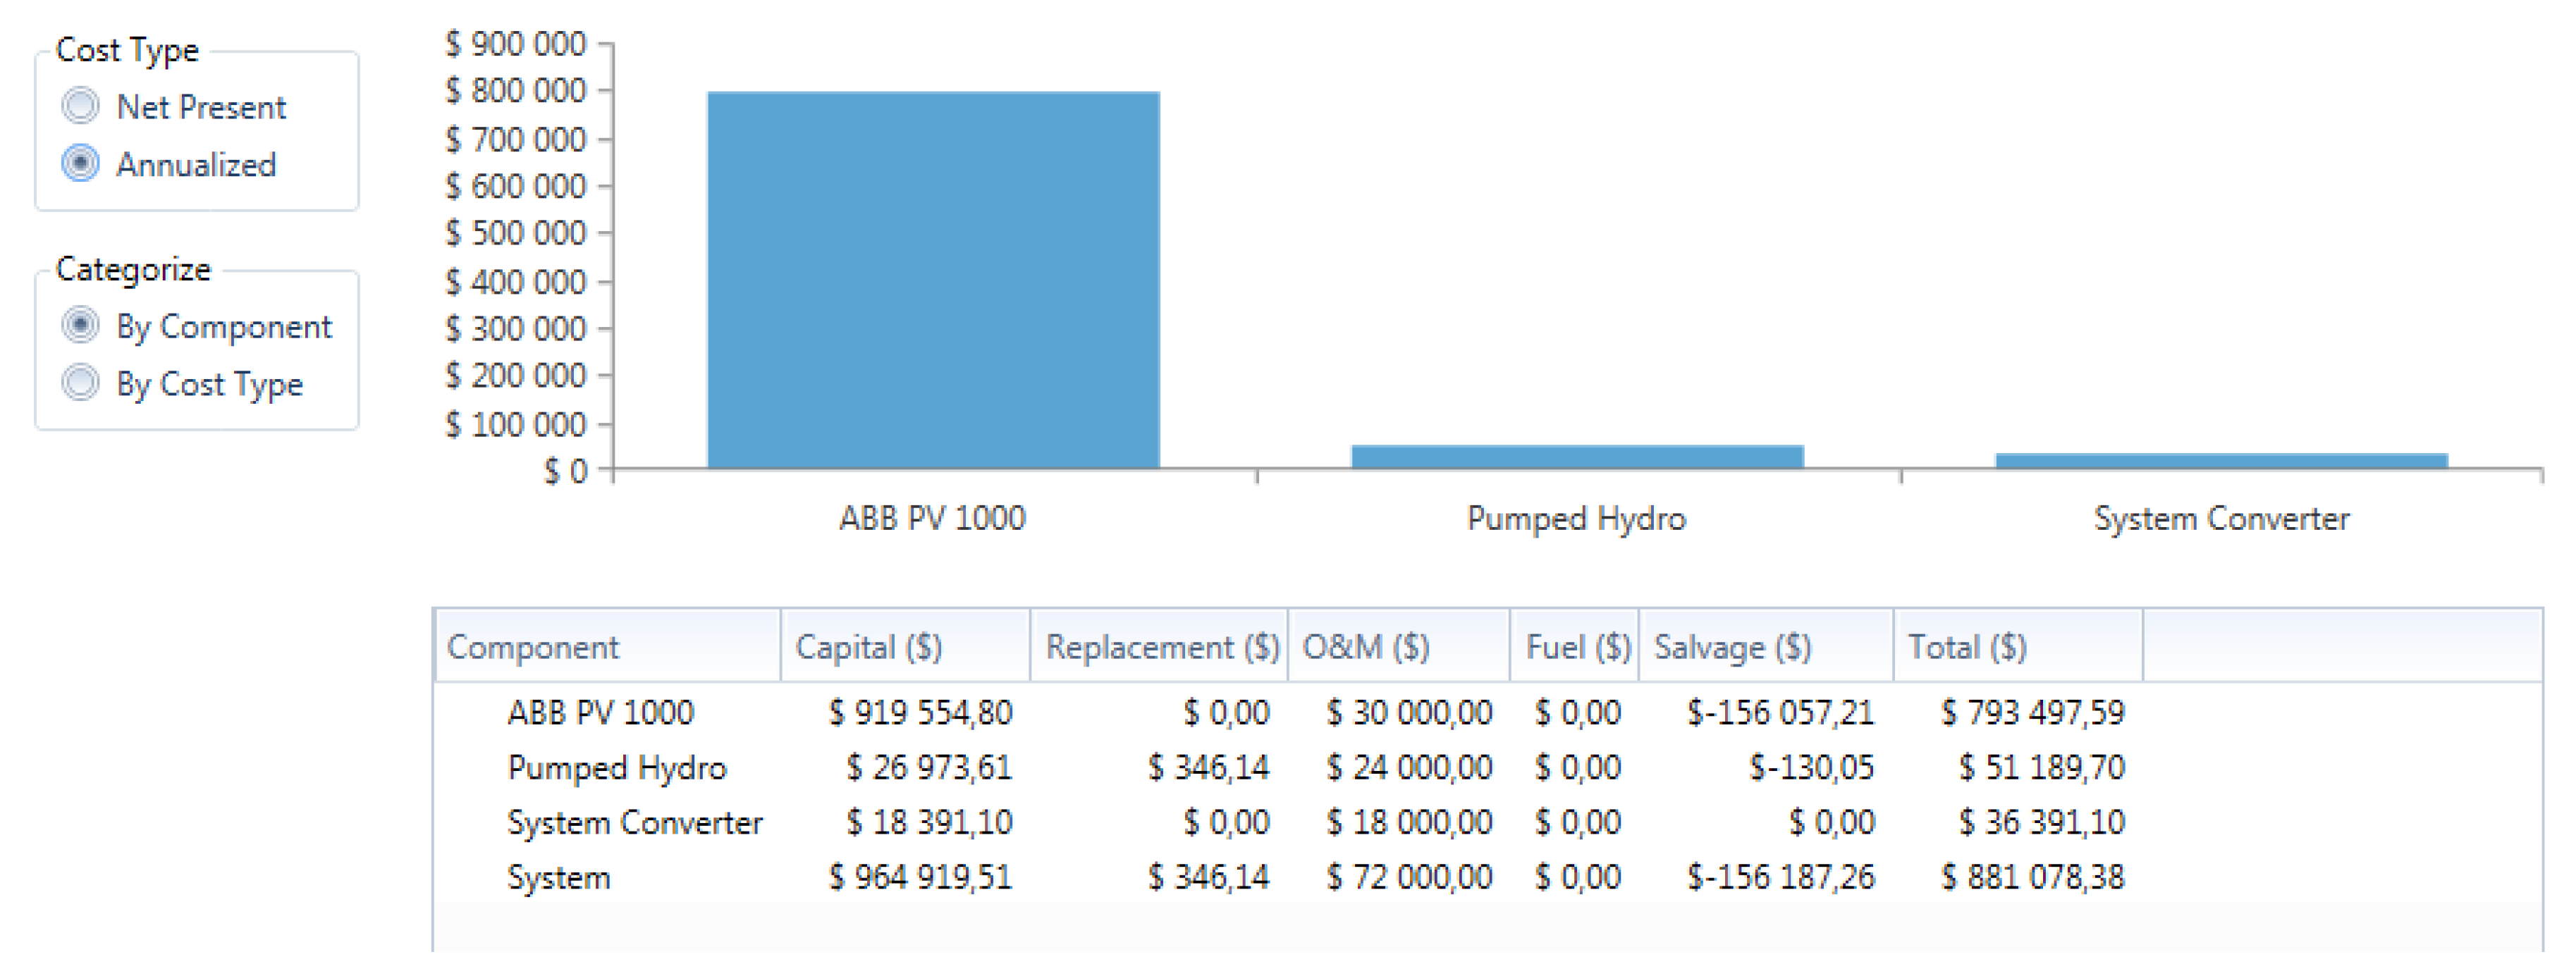
4.5. Case Study 4: 3 MW Load, PV Plant and 20% Pump Storage Plant
- is the Dam Capacity (upper and lower) to be calculated.
- is the time required to discharge and restore water to upper dam, which is 12 h, since this water had to be available for electrical production the next day.
- is the effective head = 150 m
- is the Generator efficiency = 90%
- g is the gravitational force = 9.81 m/s2
- is the discharge rate/flow = 0.03 cubic metres per s.
- From Equation (20); flow rate = =
- = = 0.031 m3 per s
- Time required to refill the upper dam, using Equation (21) =
- From Equation (22); Electrical energy required = 50 kW × 5.82 h = 291 kWh
- Round trip efficiency of the PPS = ratio of discharging electrical energy output to the charging electrical input = 0.6/0.291 = 2.06
- Maximum capacity using Equation (23) = = 2500 Amp hours. This is the maximum electrical output divided by the nominal voltage.
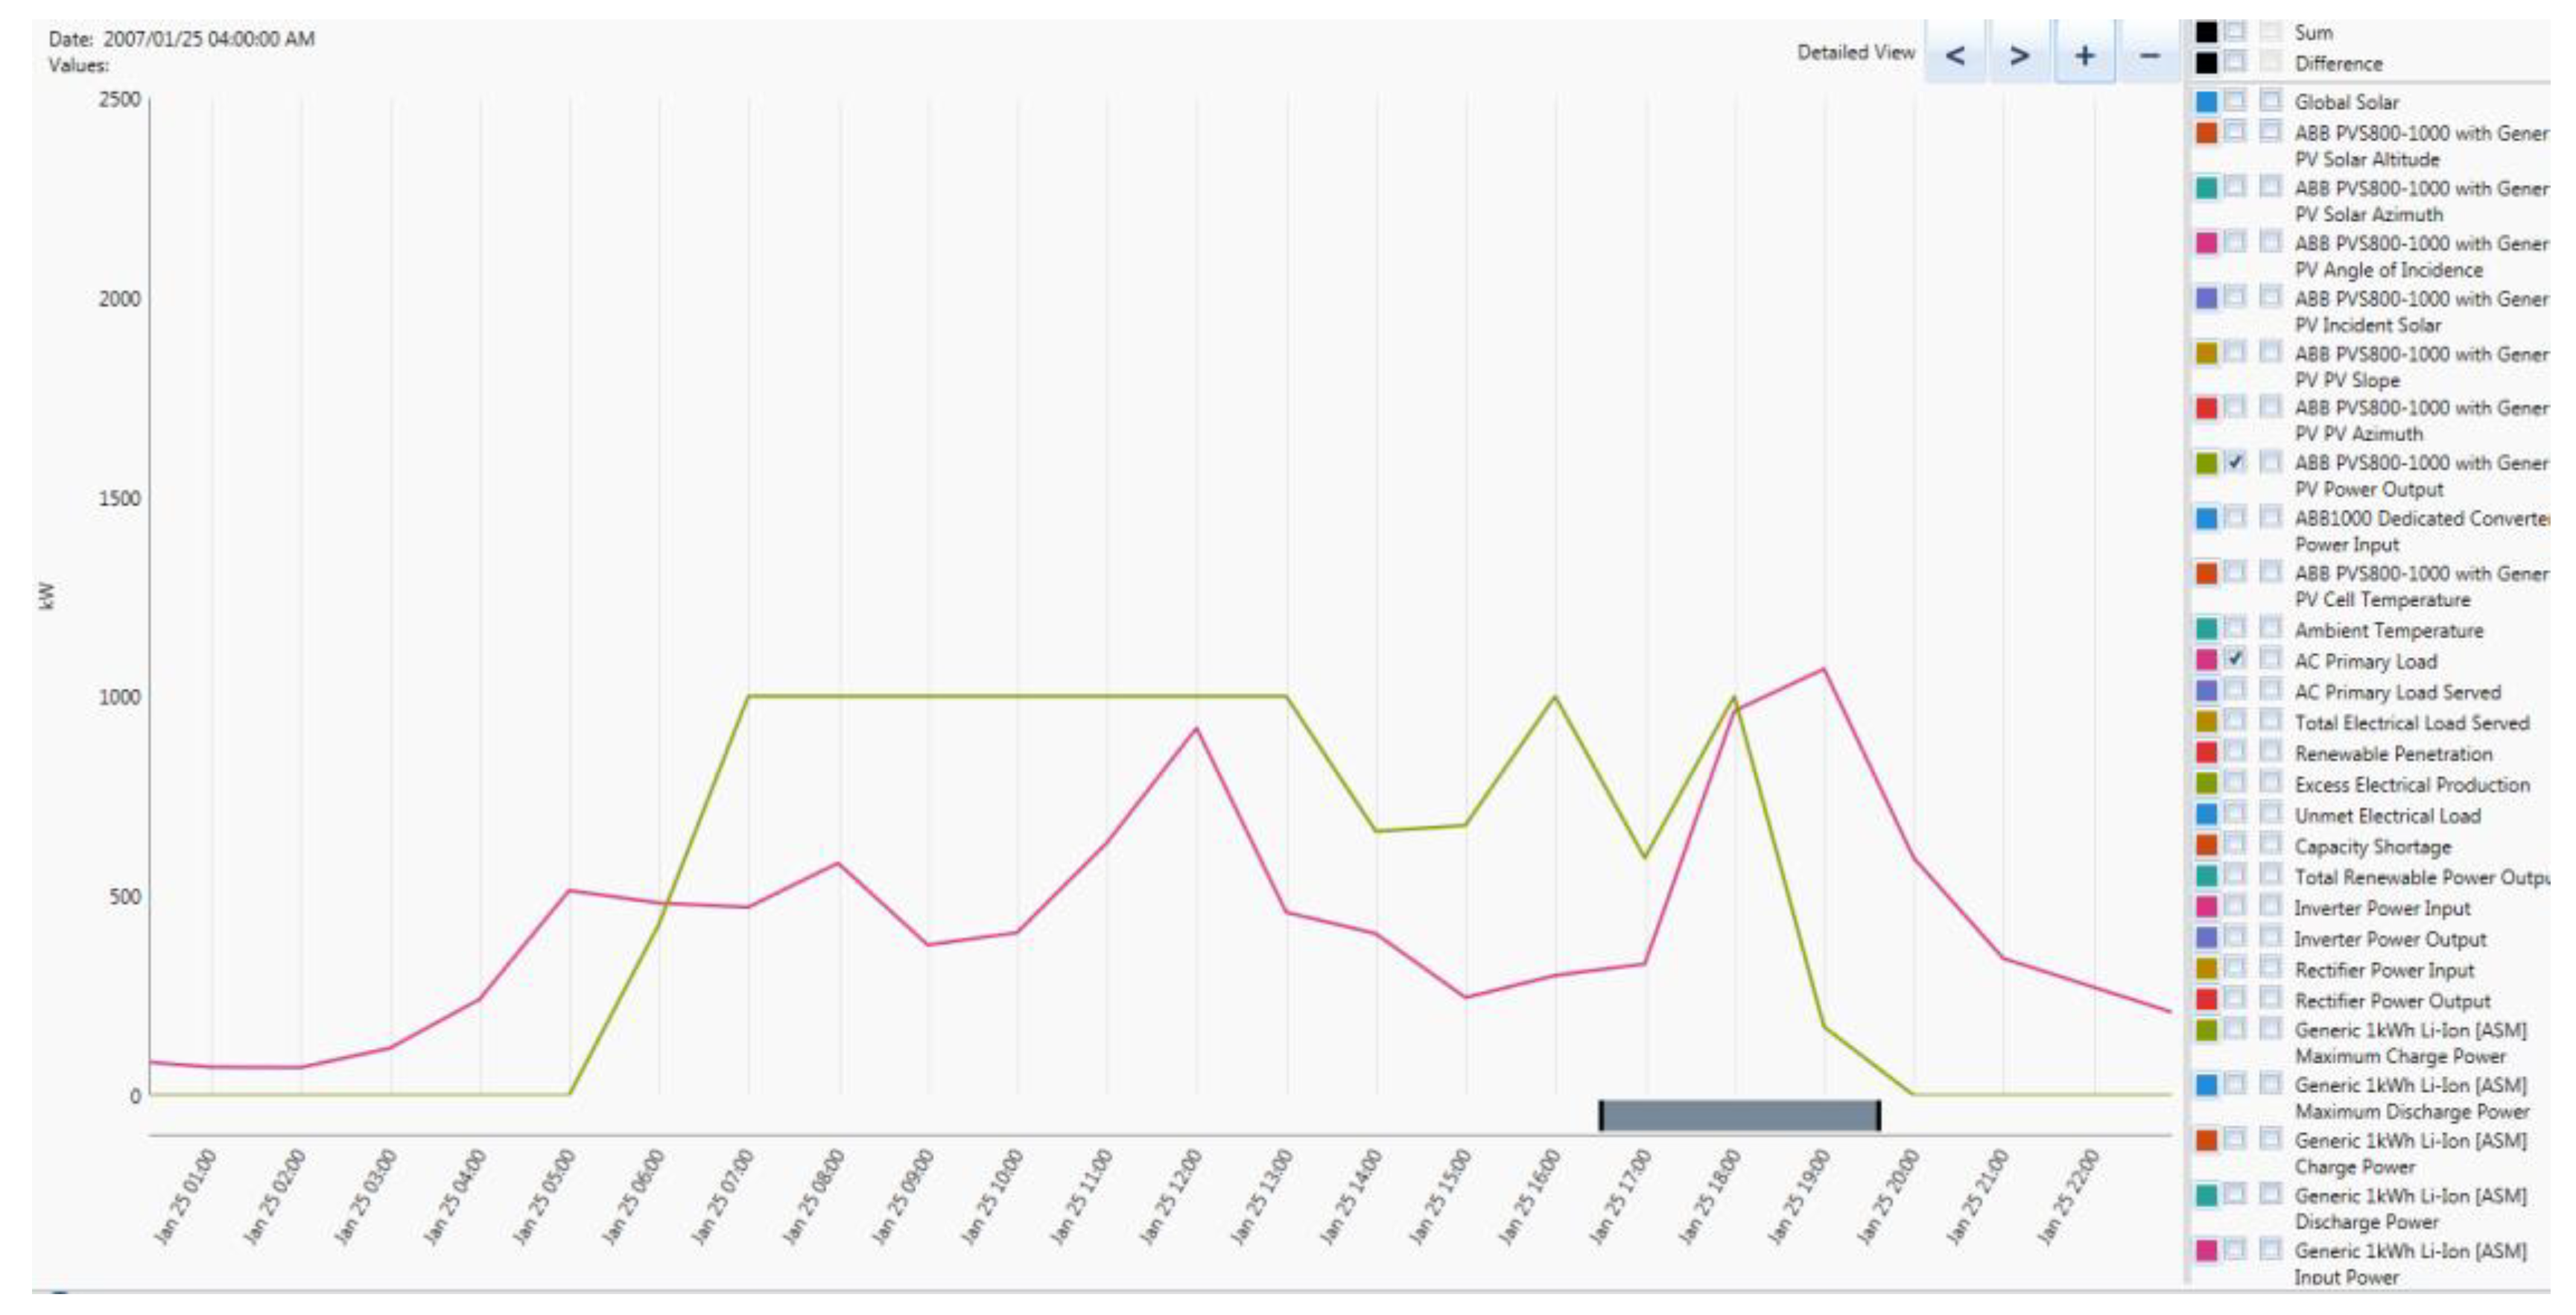
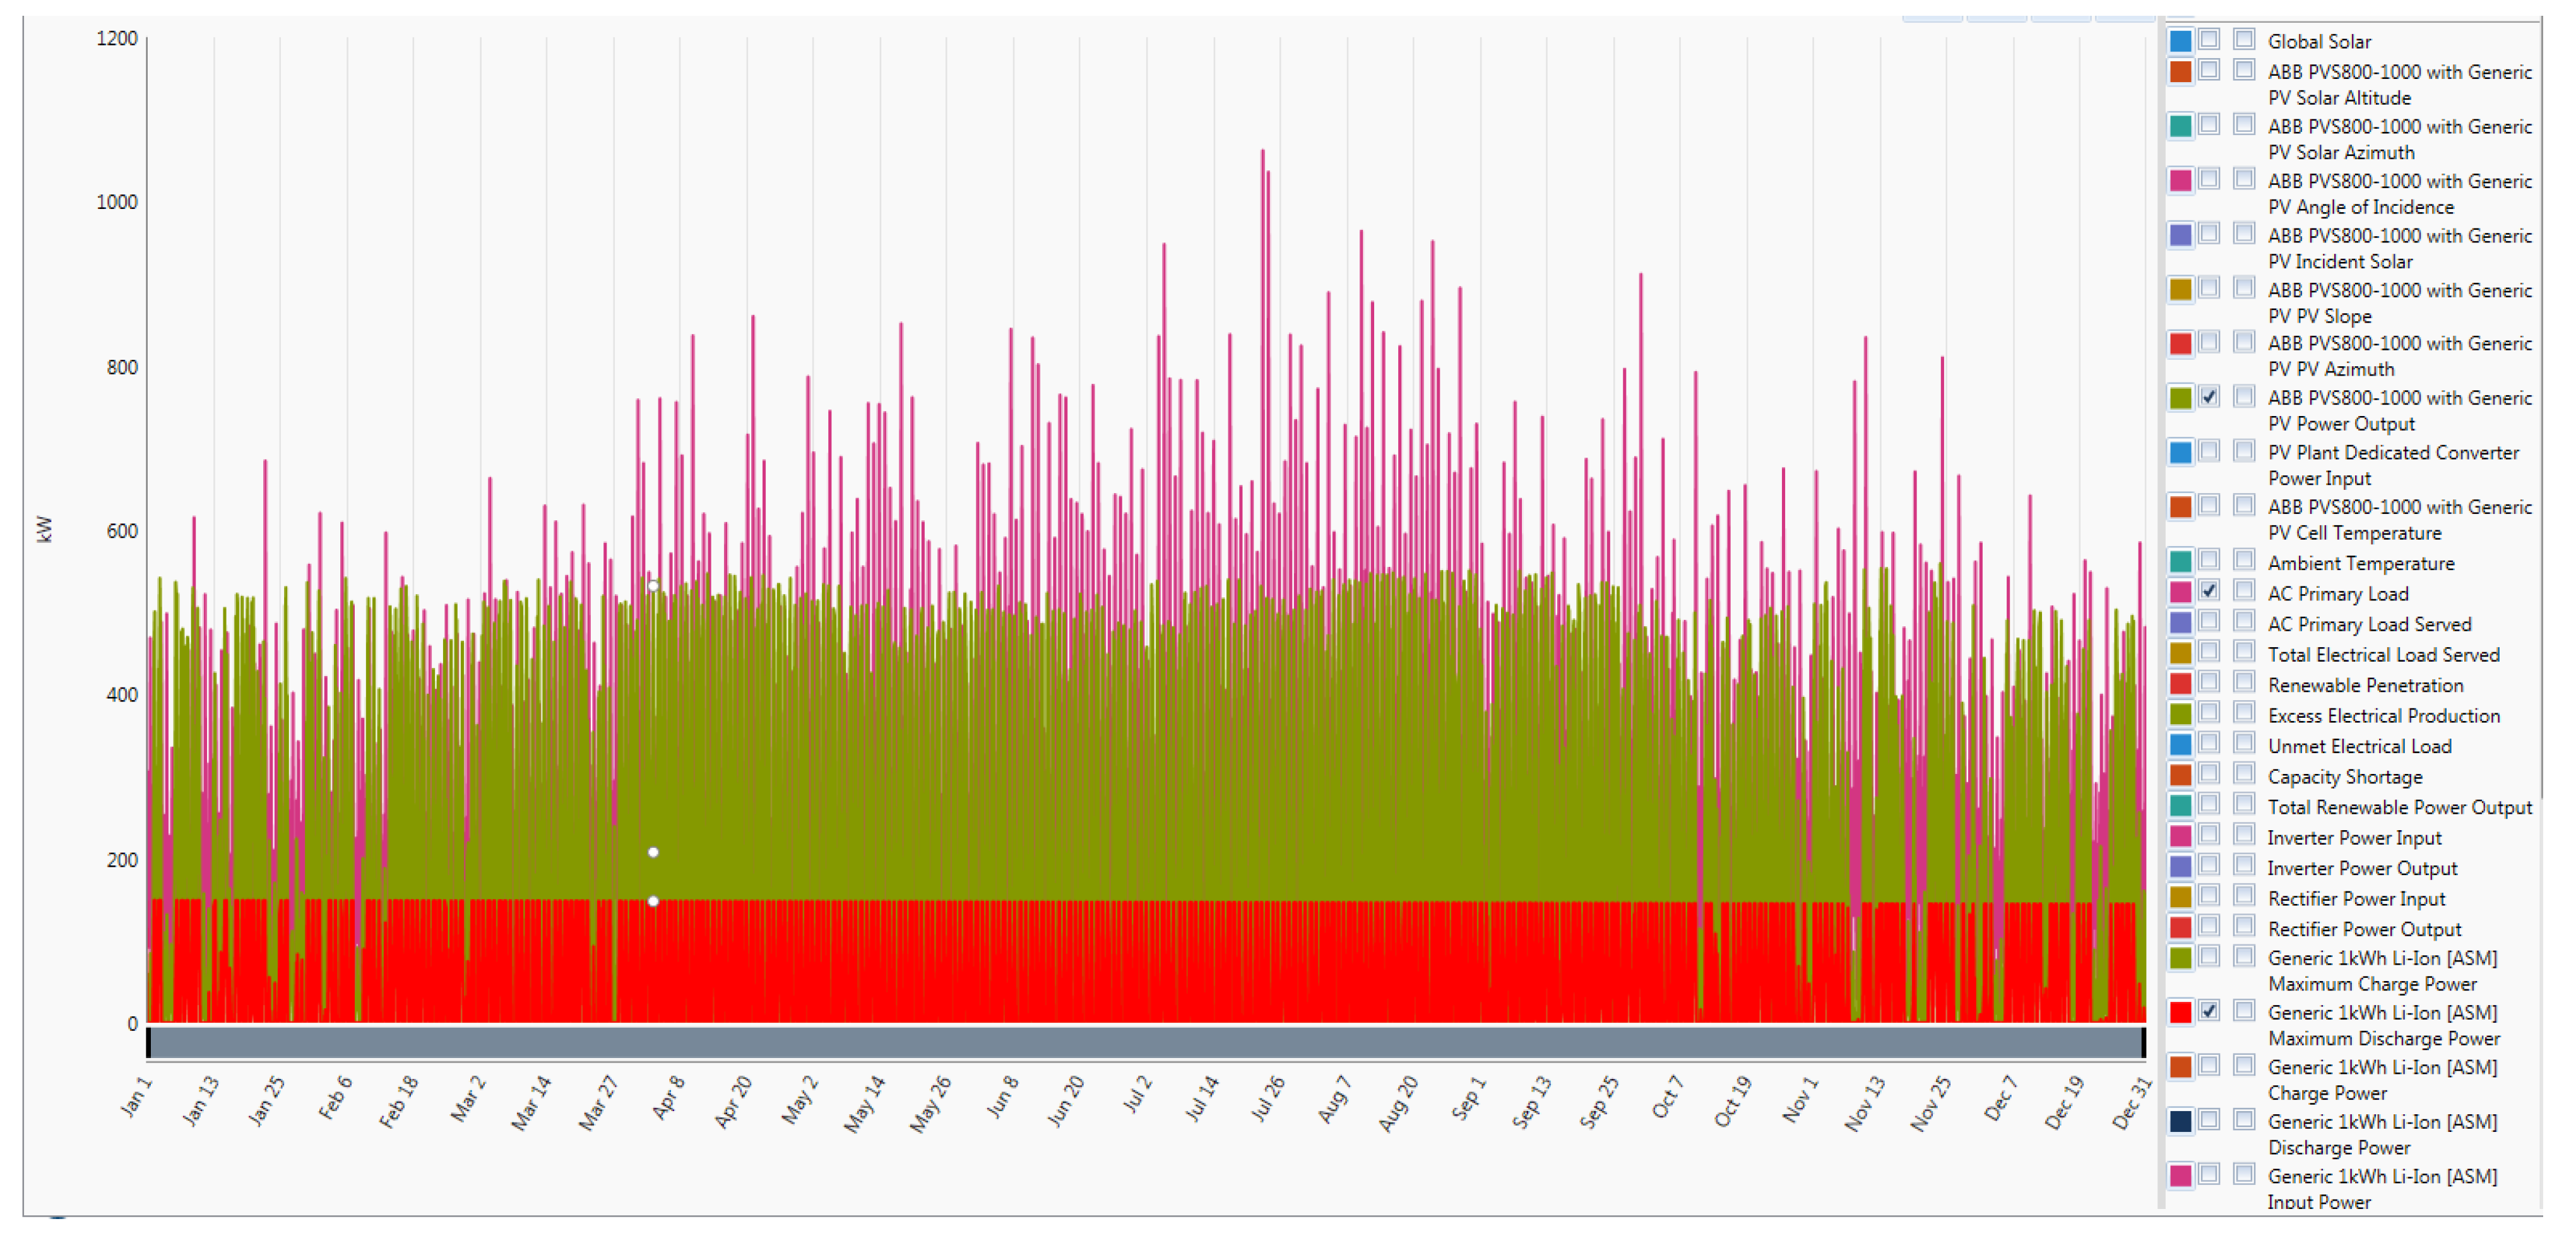
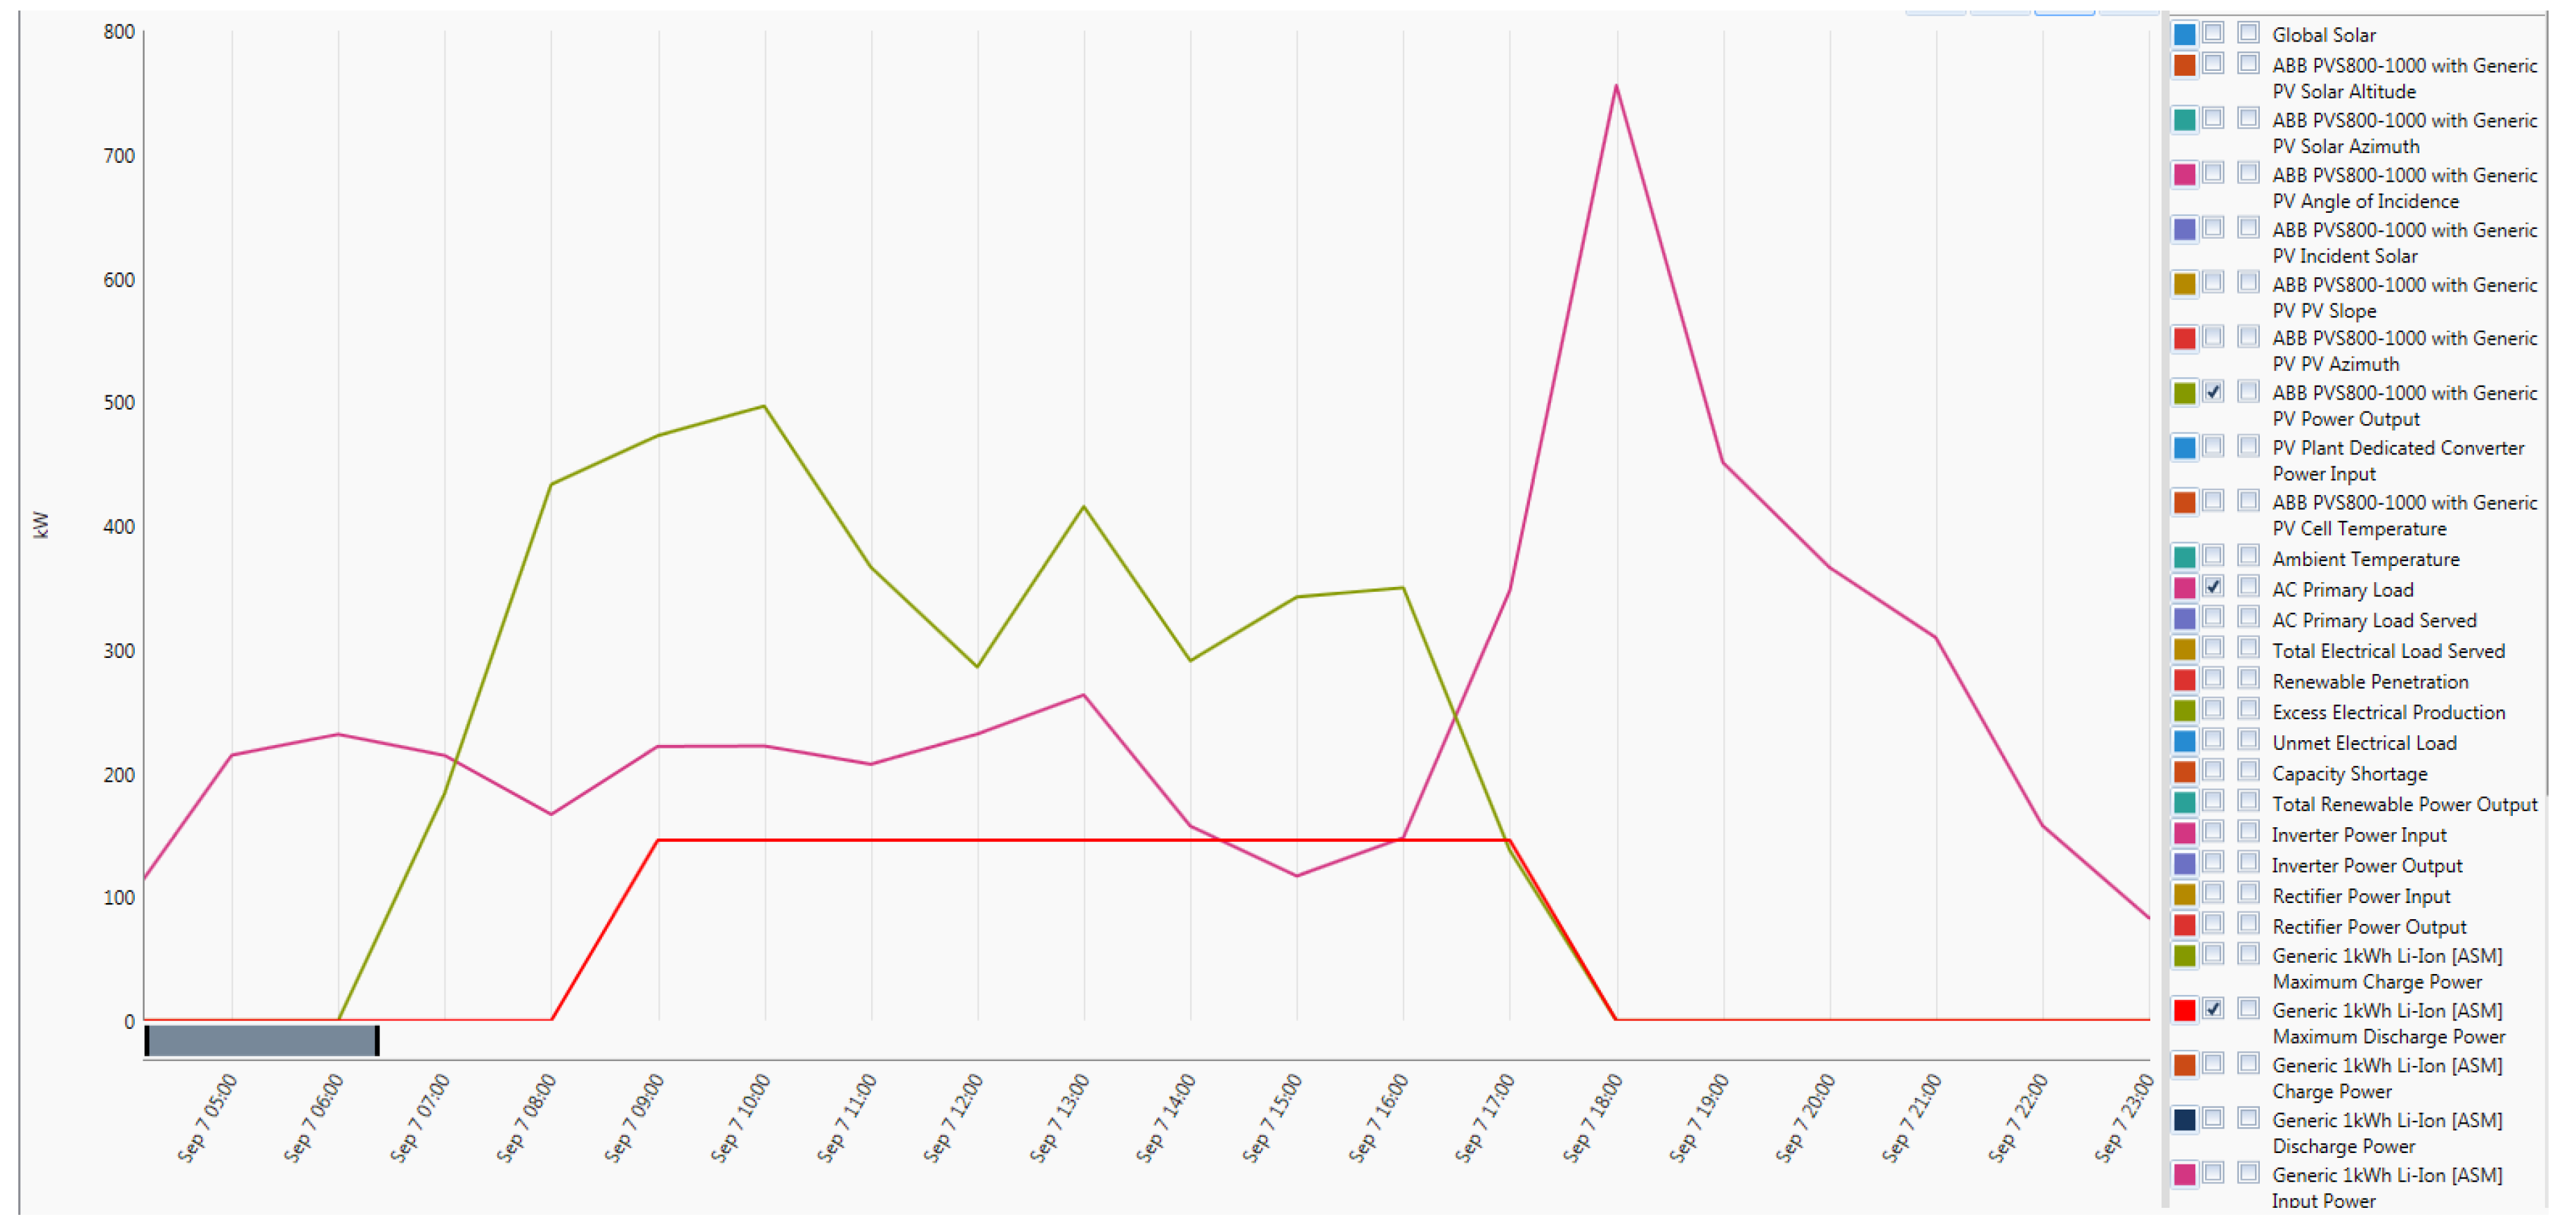
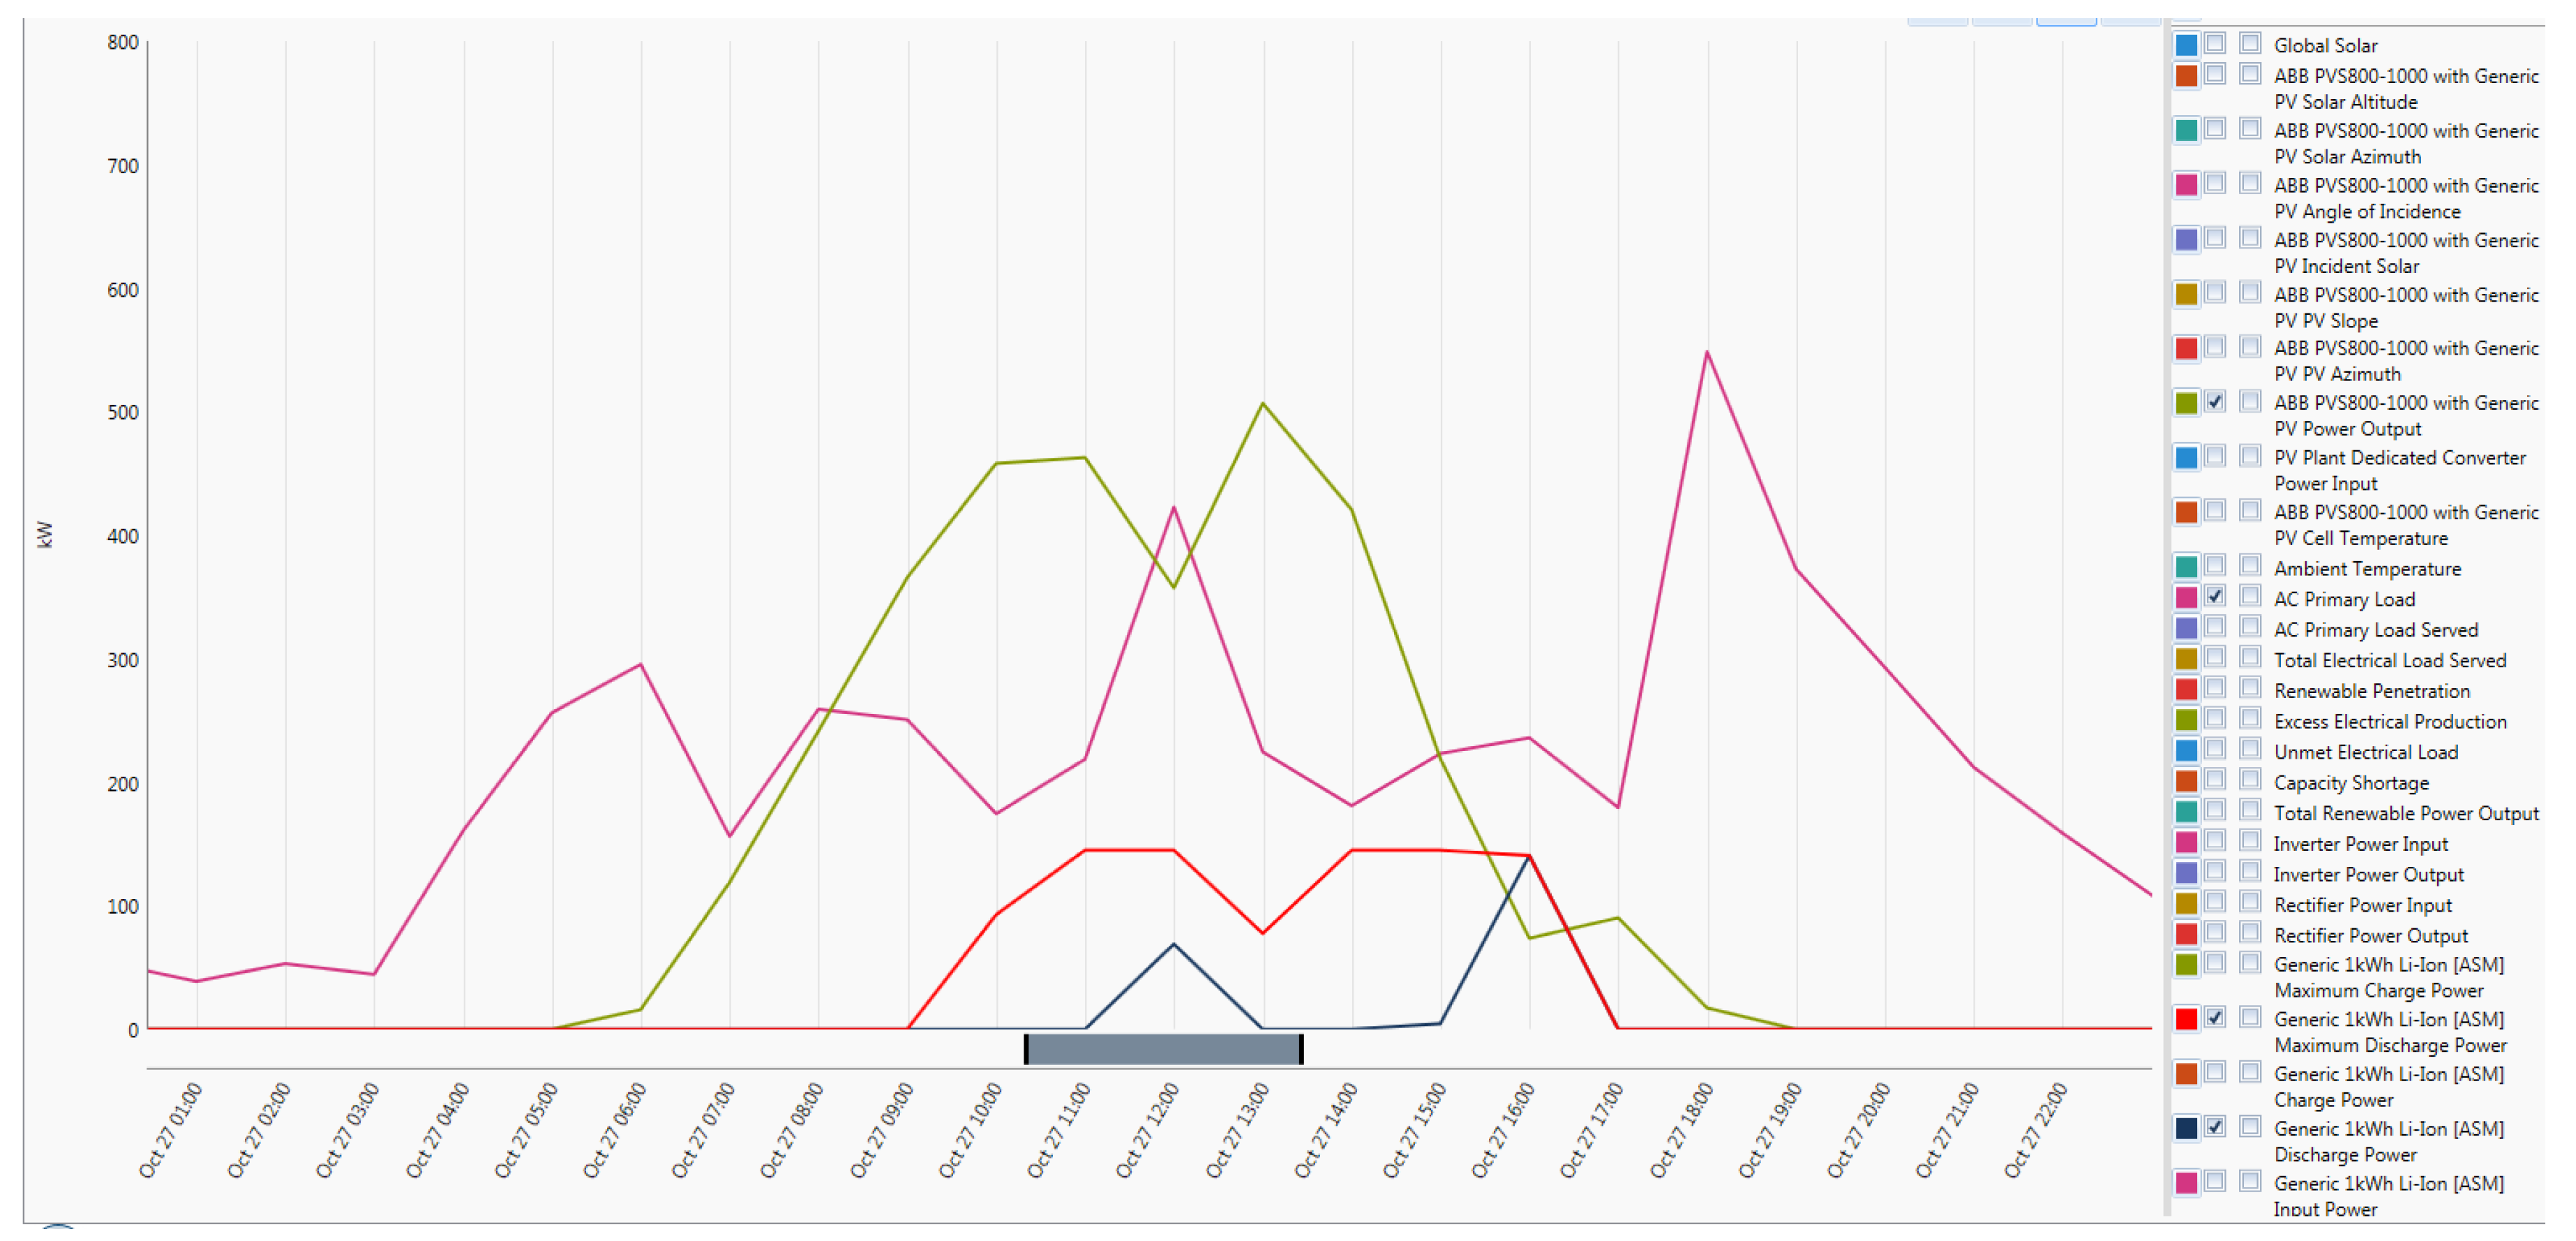
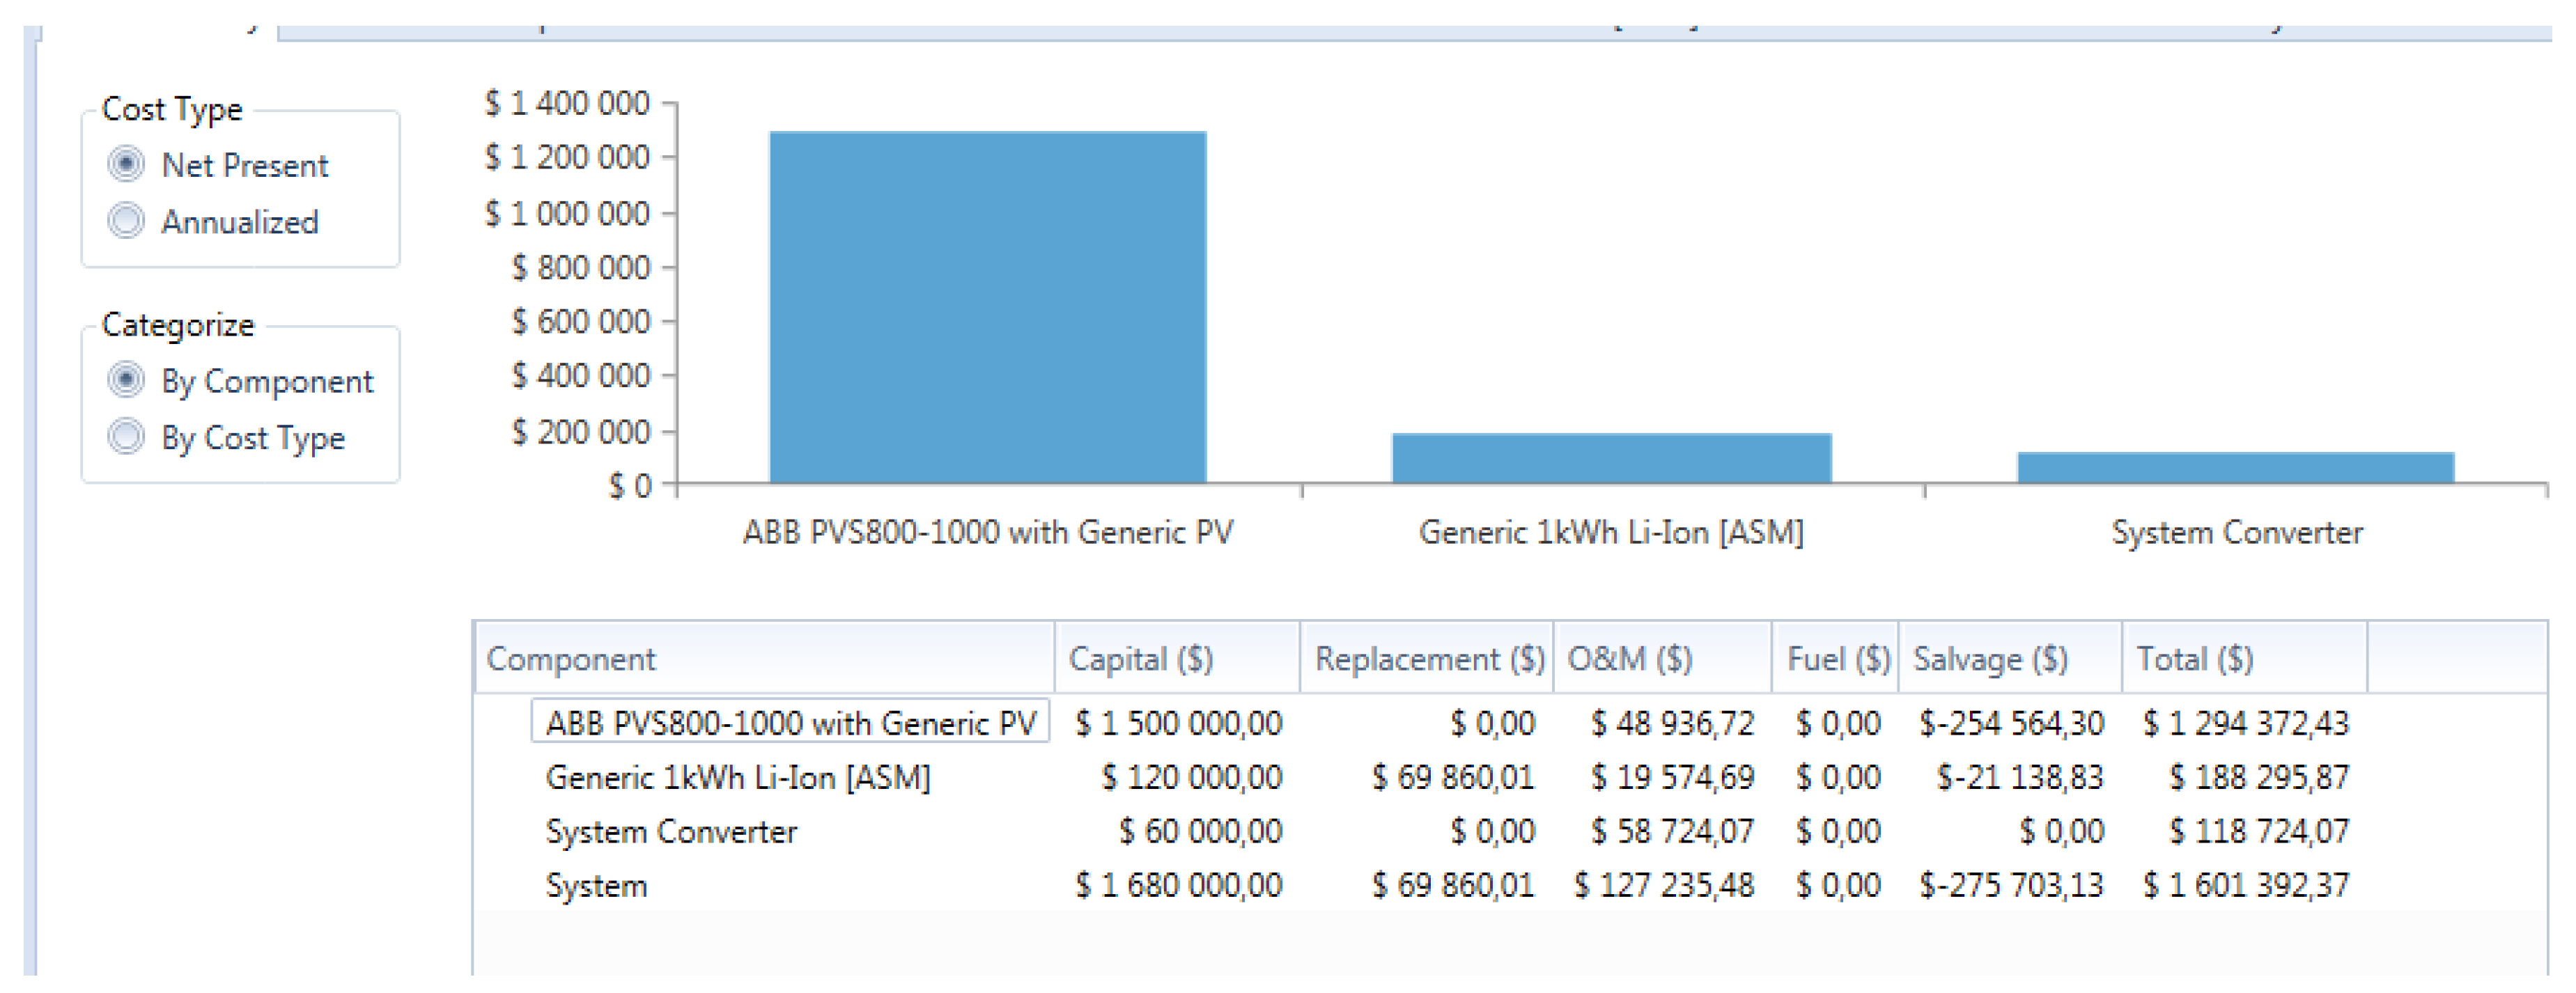
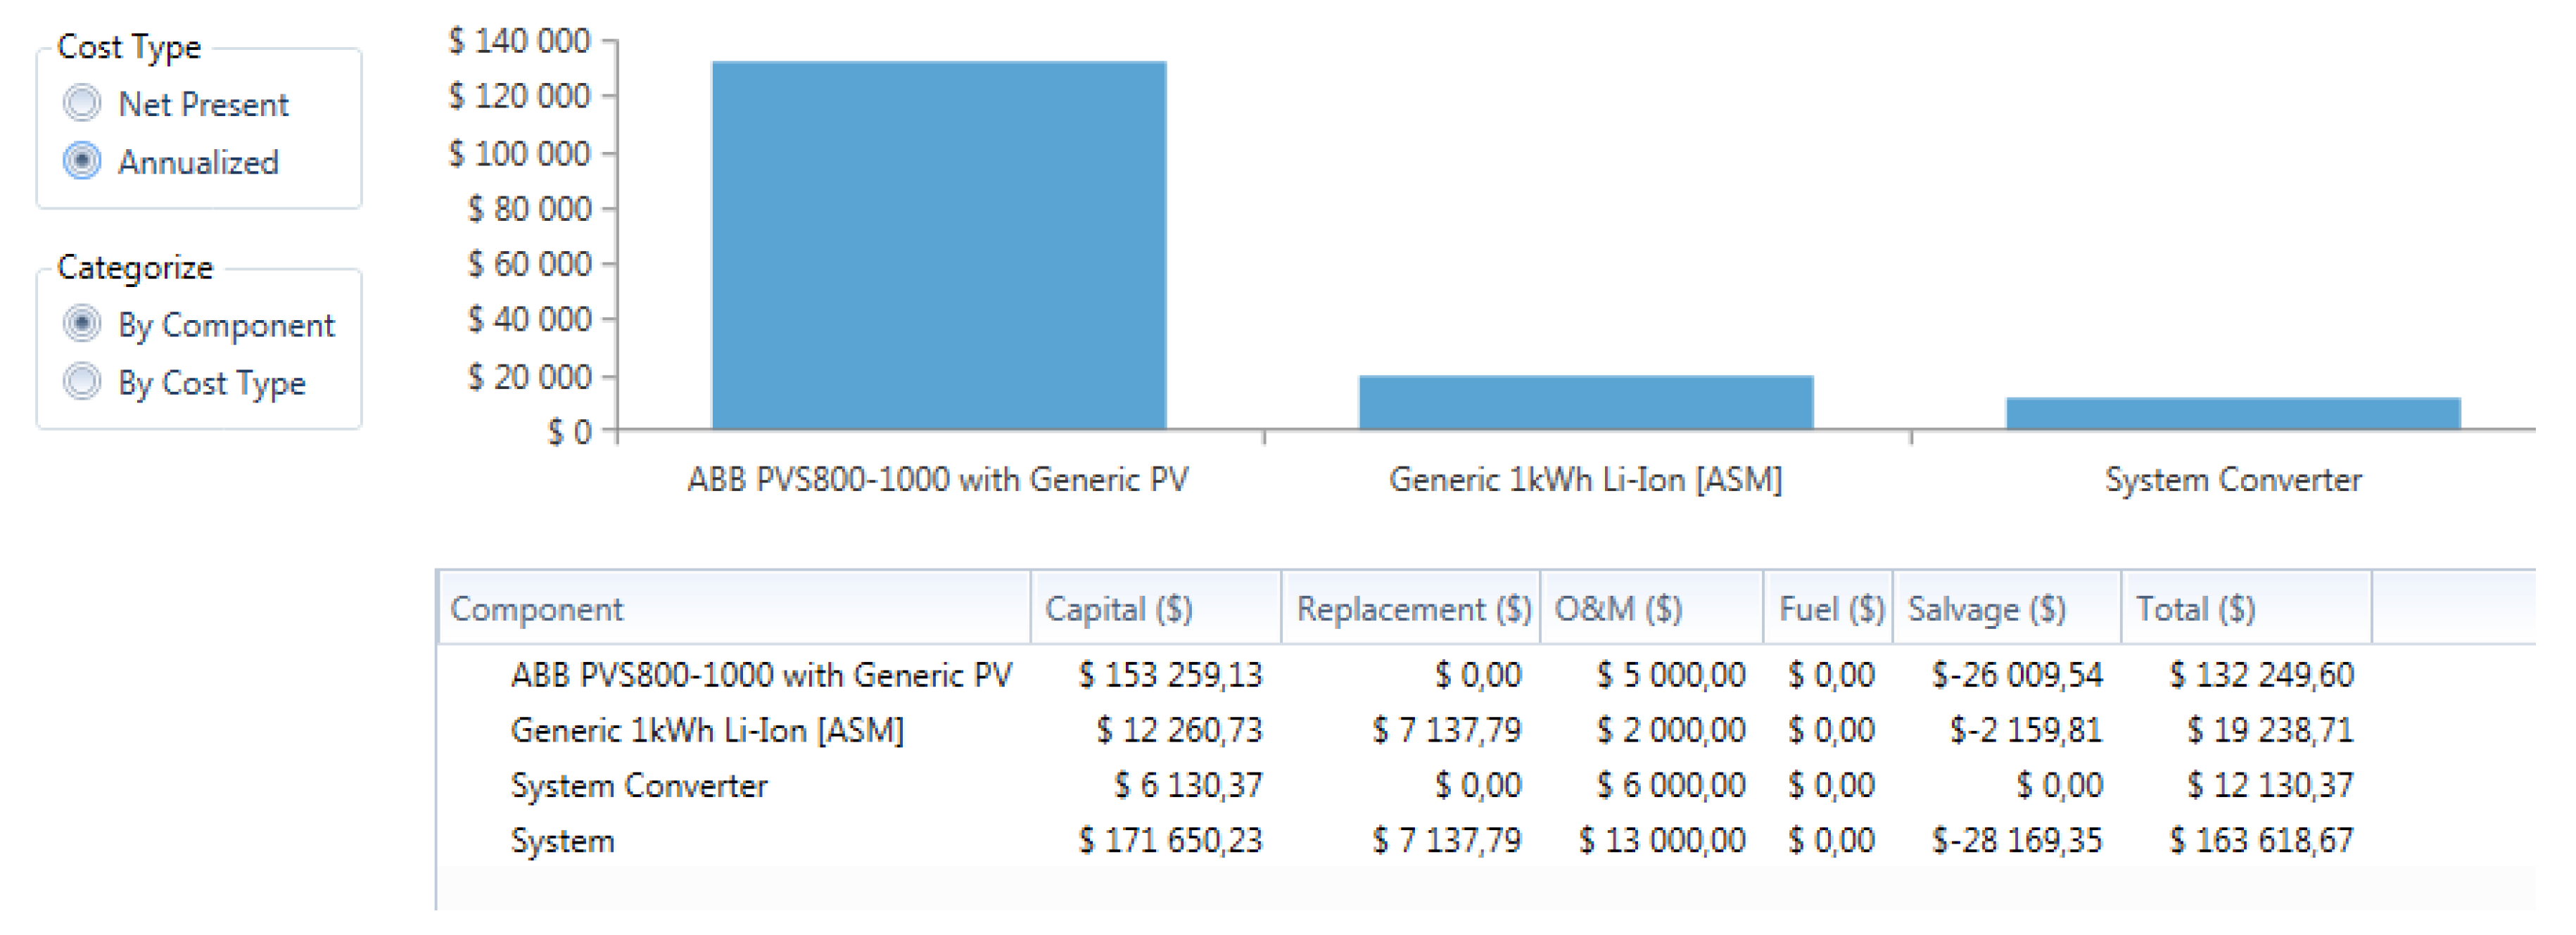
4.6. Case Study 5: 1 MW Load, PV Plant and 20% Storage Battery Capacity
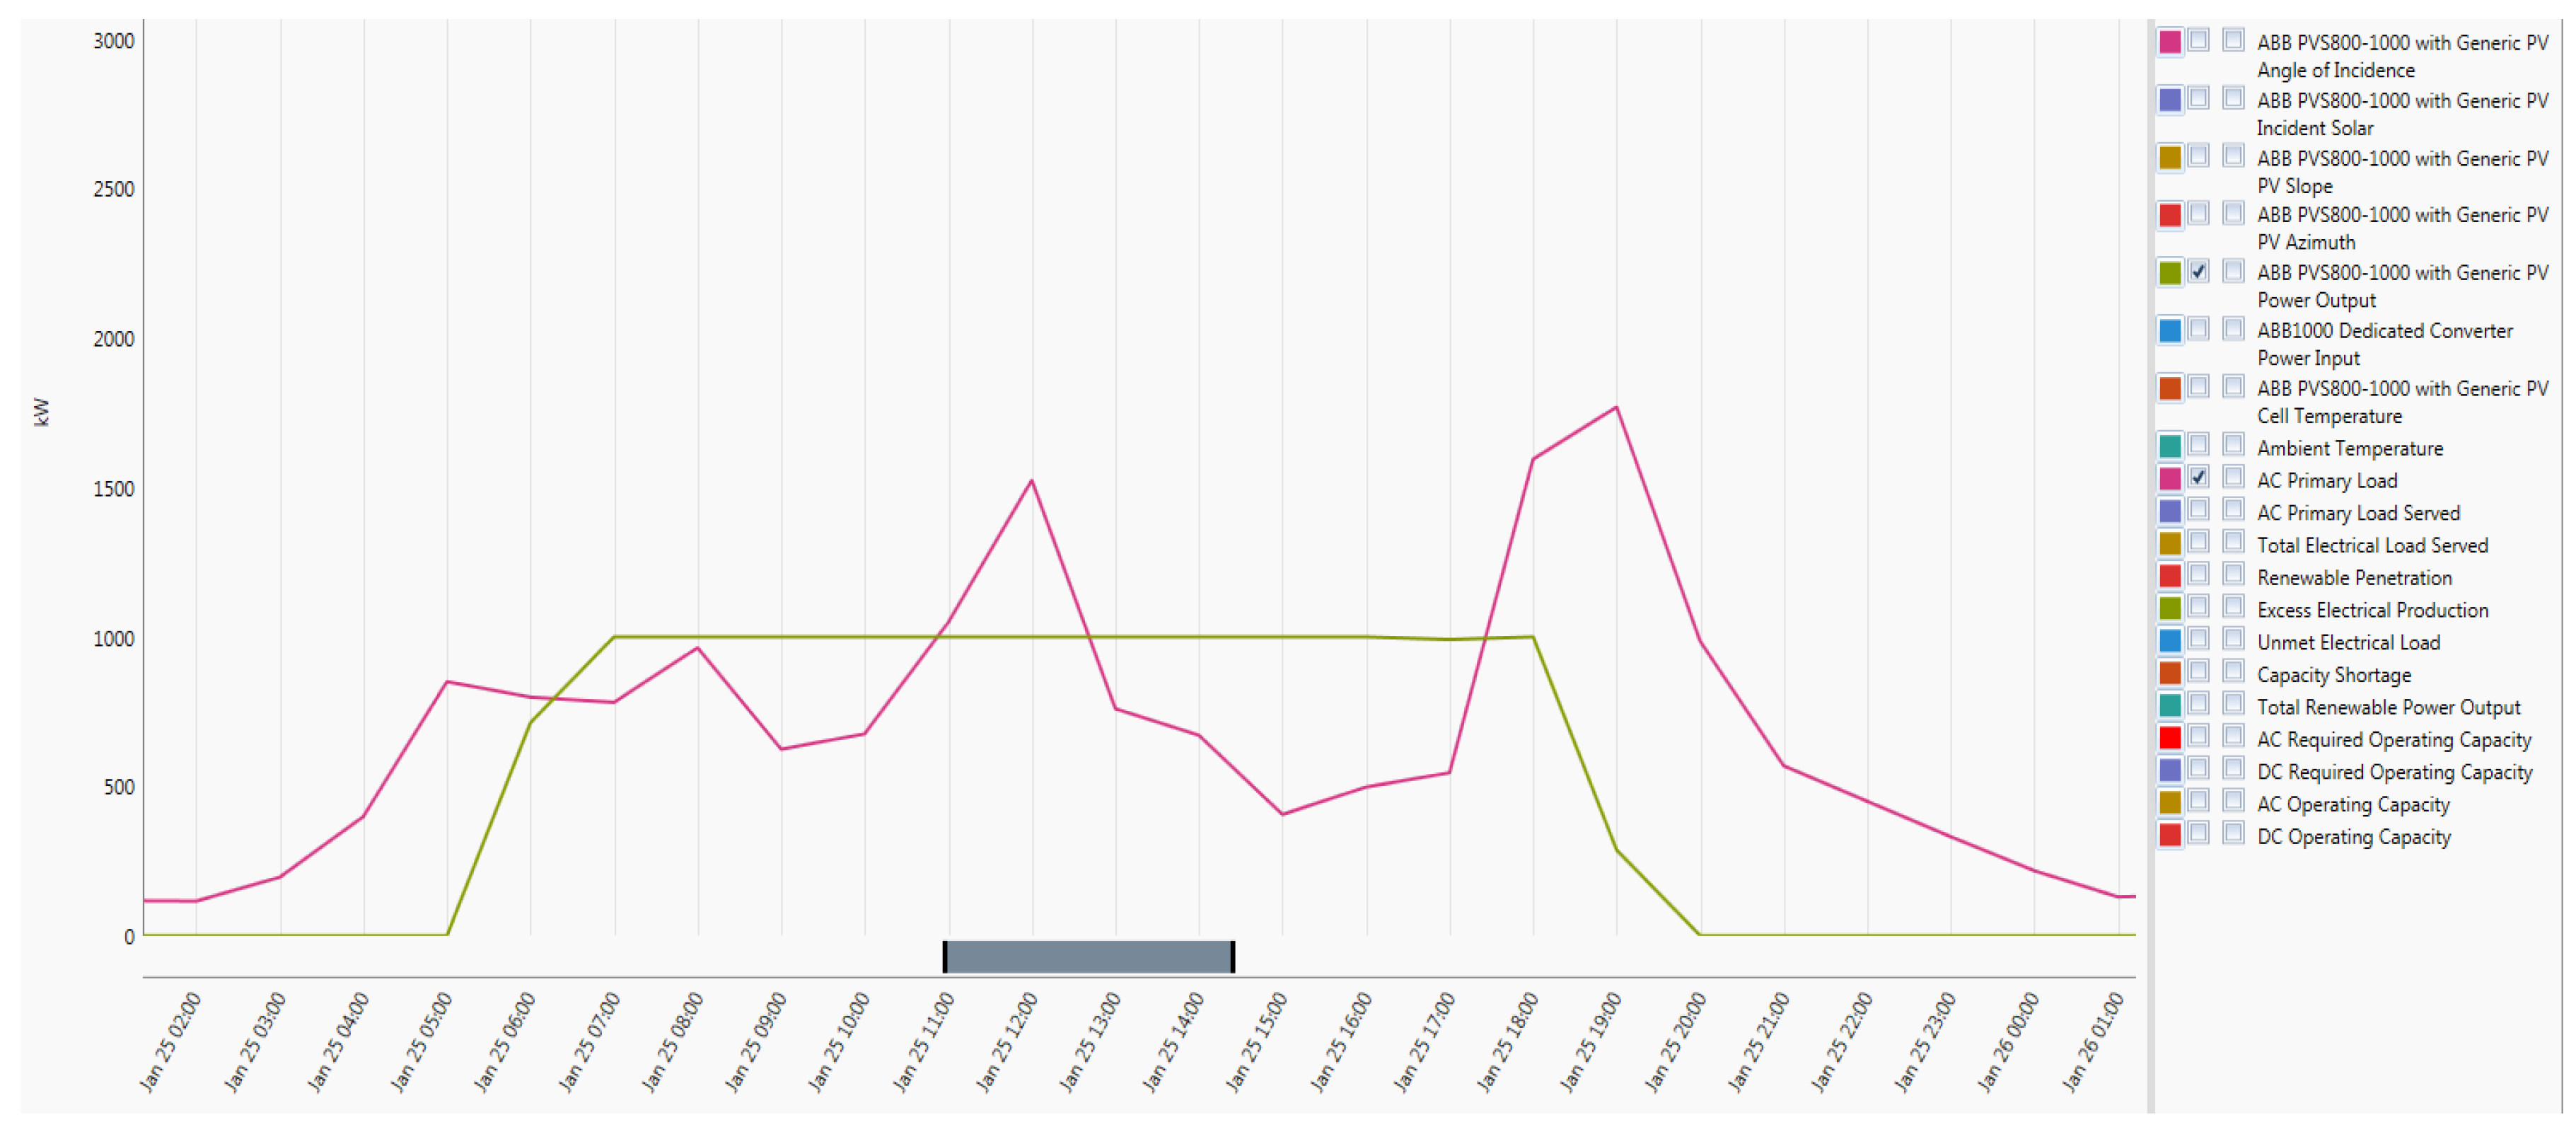
- PV power output is drawn in a green line in the graph;
- The load is drawn in purple in the graph;
- Maximum discharge battery output is the red line in the graph; and
- The operating discharge output is the blue line in the graph.
4.7. PV-Battery Plant Off-Grid Cost Analysis
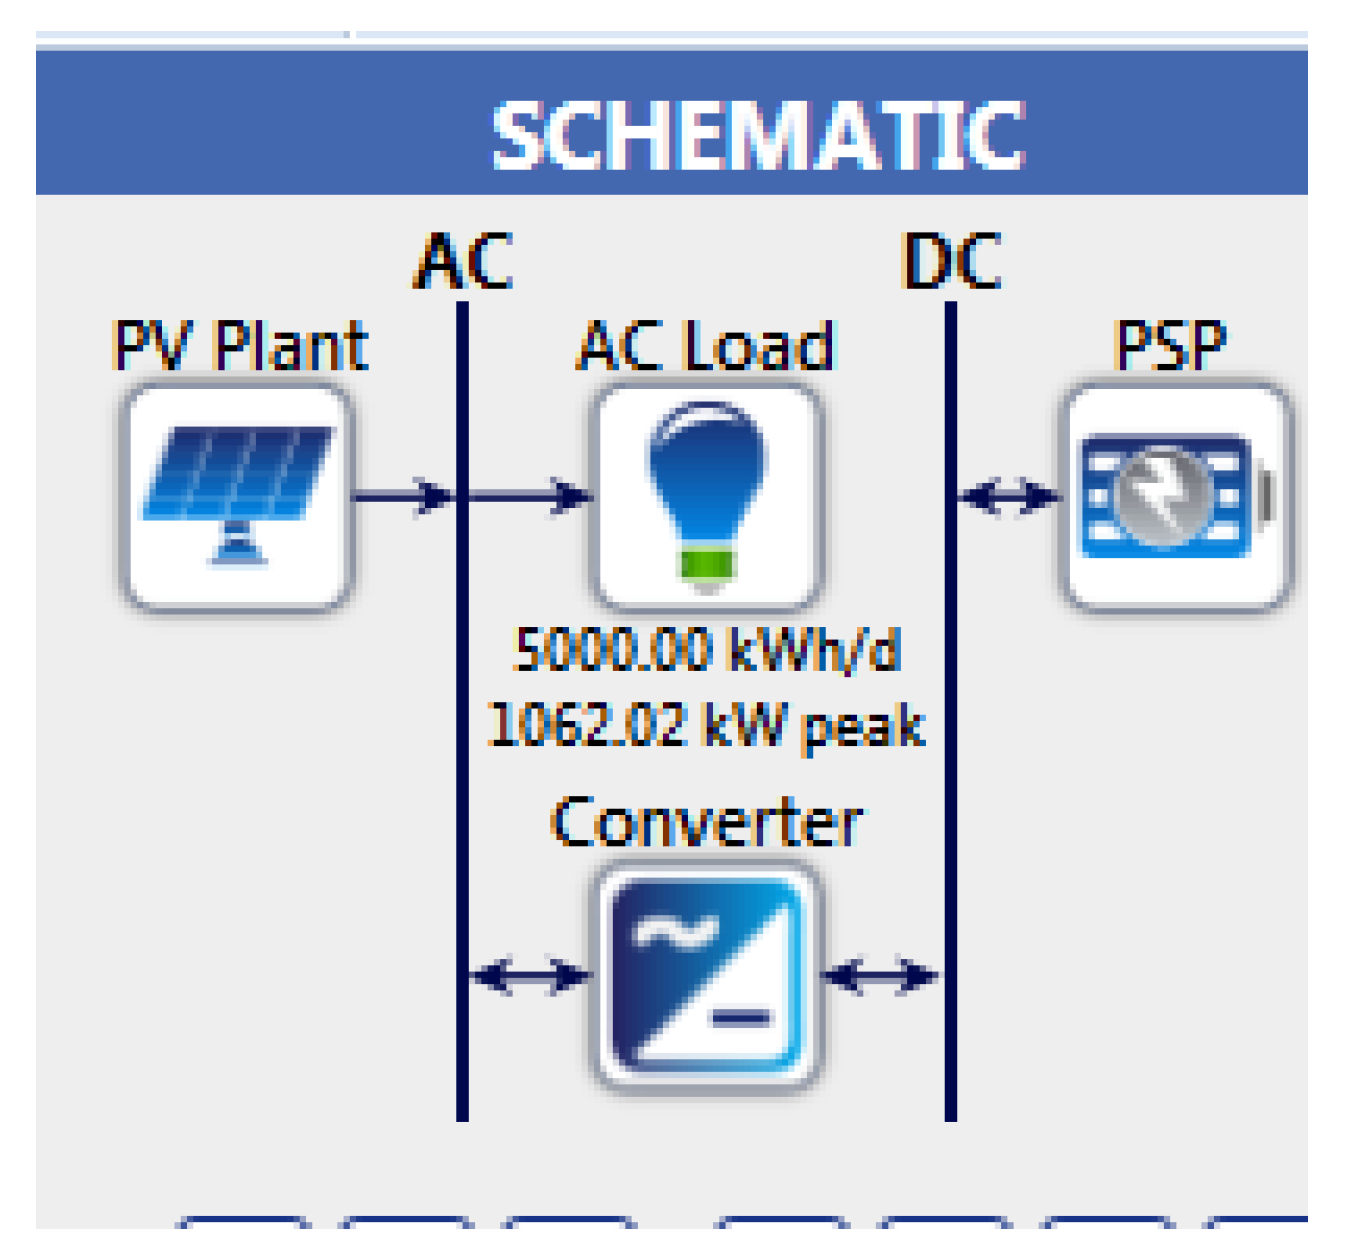
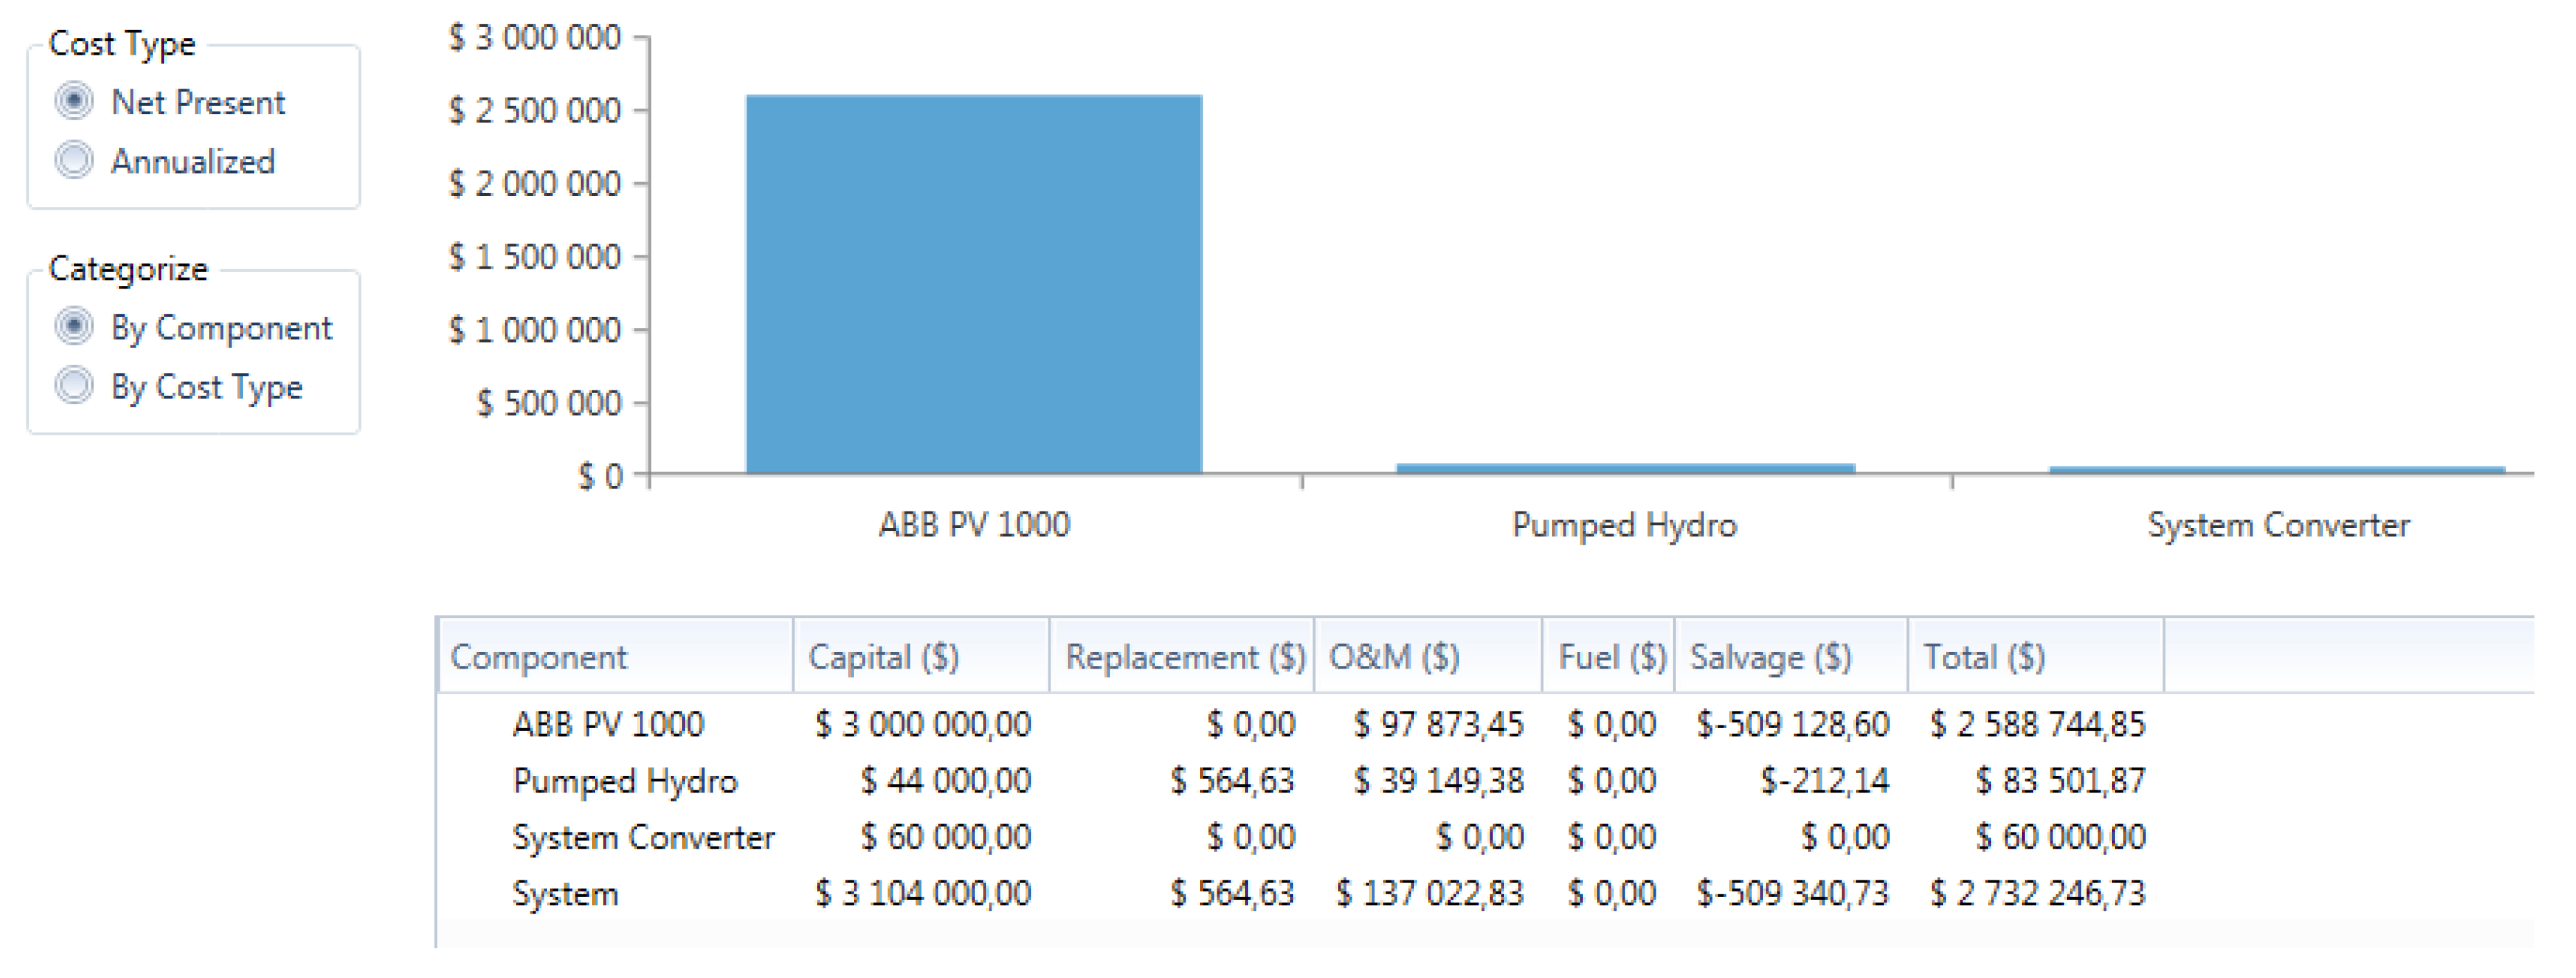
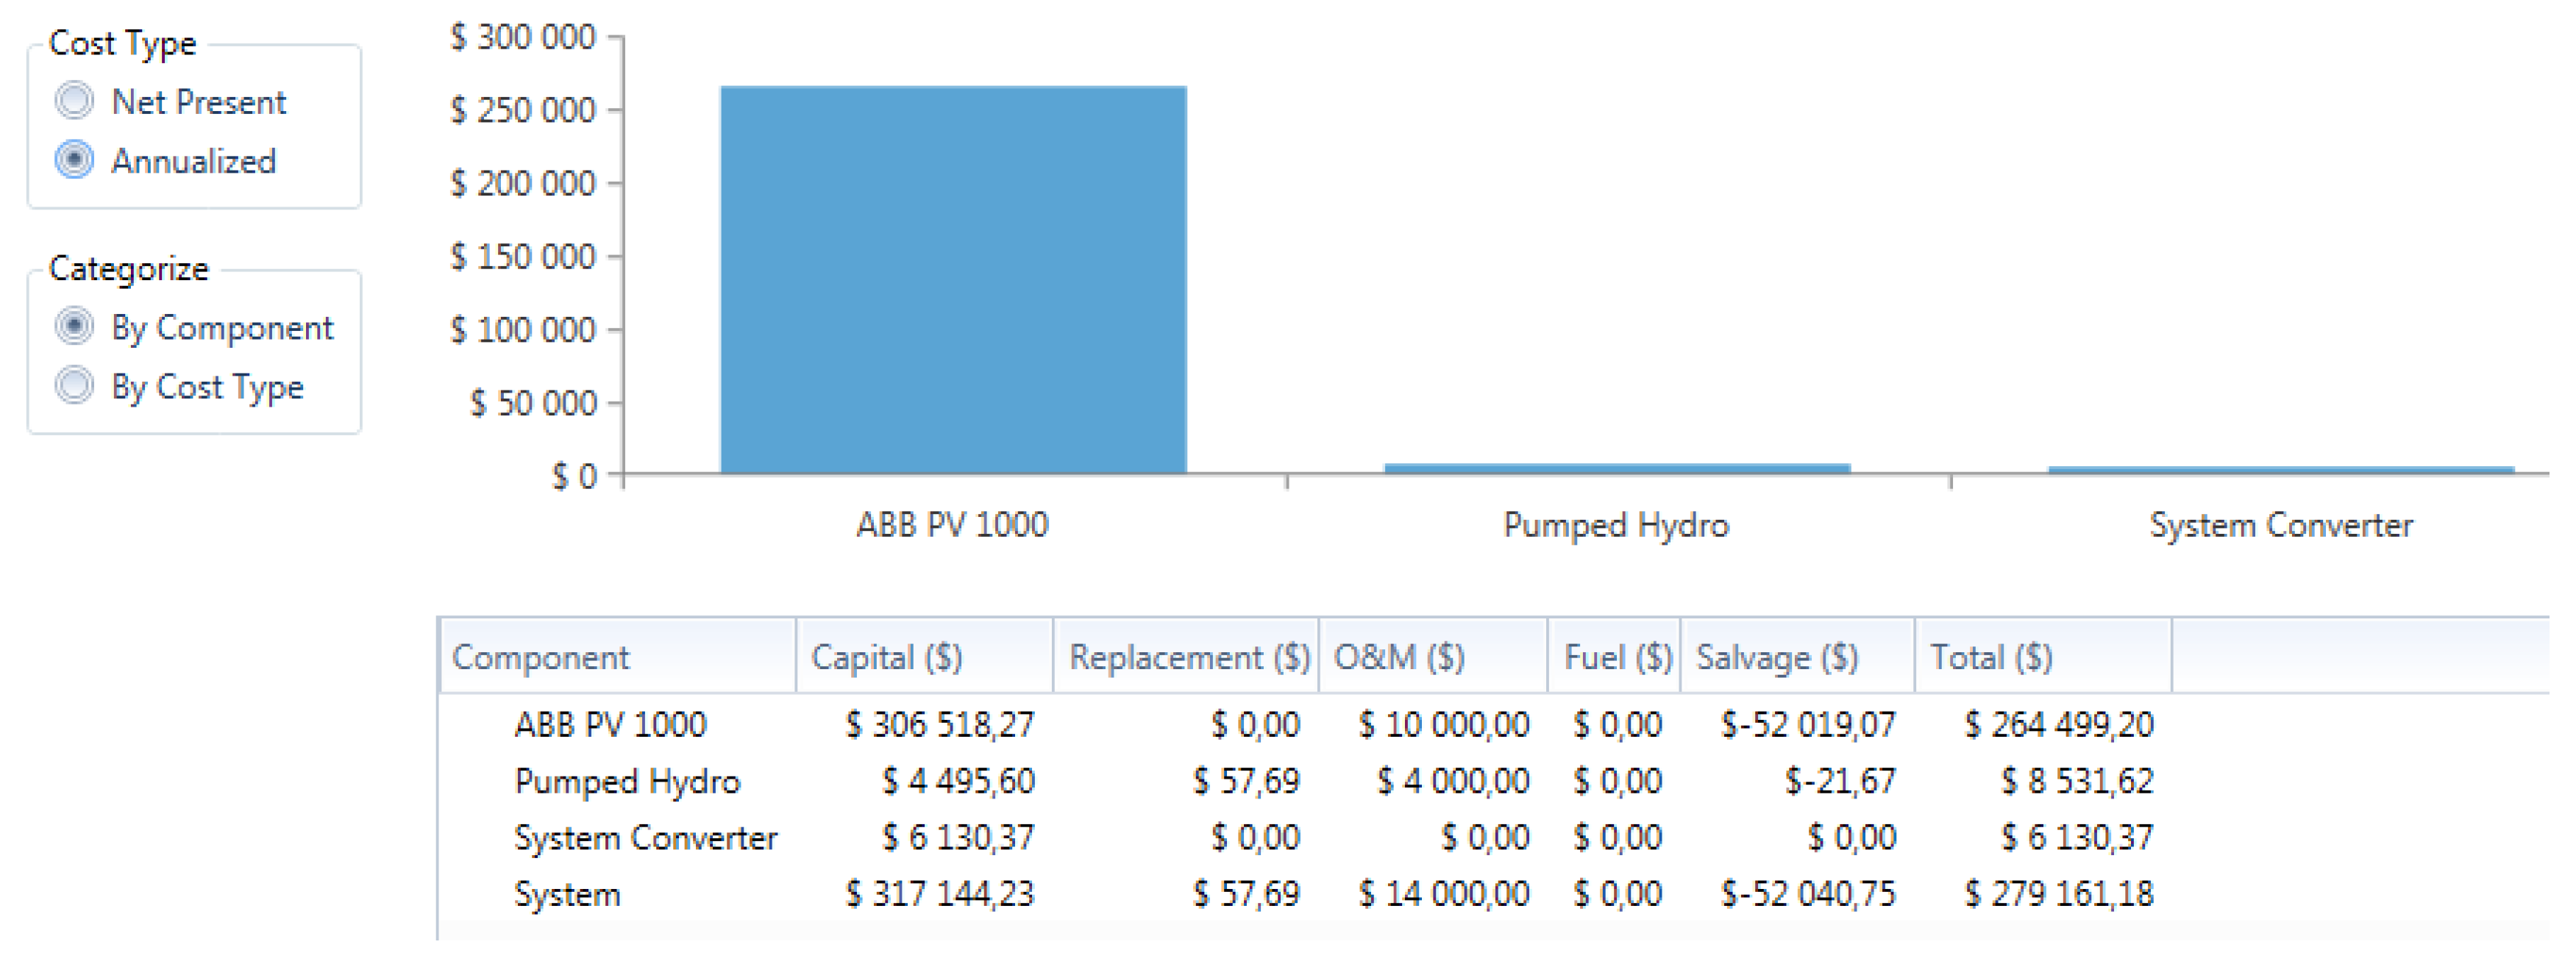
4.8. Scenario 6: 1 MW Load, PV Plant and 20% Pump Storage Plant
- is the Dam Capacity (upper and lower) to be calculated.
- is the time required to discharge and restore water to upper dam = 12 h, since this water had to be available for electrical production the next day.
- is the effective head = 150 m
- is the Generator efficiency = 90%
- g is the gravitational force = 9.81 m/s2
- is the Discharge rate/flow = 0.03 cubic metres per s.
- Using Equation (20); flow rate = = = = 0.0104 m3 per s.
- Using Equation (21); time required to refill the upper dam =
5. Conclusions
Author Contributions
Funding
Acknowledgments
Conflicts of Interest
References
- PPIAF. South Africa’s Renewable Energy IPP Procurement Program: Success Factors and Lessons; PPIAF: Washington, DC, USA, May 2014; Available online: http://www.gsb.uct.ac.za/files/ppiafreport.pdf (accessed on 25 July 2016).
- Harque, A.; Rahman, M.A. Study of a solar PV-powered mini-grid pumped hydroelectric storage & its comparison with battery storage. In Proceedings of the 2012 7th International Conference Electrical & Computer Engineering (ICECE), Dhaka, Bangladesh, 20–22 December 2012; pp. 626–629. [Google Scholar]
- Chen, G.Z.; Liu, D.Y.; Wang, F.; Ou, C.Q. Determination of installed capacity of pumped storage stations in WSP hybrid power supply system. In Proceedings of the Sustainable Power Generation and Supply (SUPERGEN’09), International Conference, Nanjing, China, 6–7 April 2009; pp. 1–29. [Google Scholar]
- Hill, C.A.; Such, M.C.; Chen, D.; Gonzalez, J.; Grady, W.M. Battery Energy Storage for Enabling Integration of Distributed Solar Power Generation. IEEE Trans. Smart Grid. 2012, 3, 850–857. [Google Scholar]
- Gong, X.; Huang, Z.; Li, L.; Lu, H.; Liu, S.; Wu, Z. A New State Of Charge Estimating For Lithium Ion Battery Based On Sliding-Mode Observer And Battery Status. In Proceedings of the 35th Chinese Control Conference, Chengdu, China, 27–29 July 2016; pp. 8693–8697. [Google Scholar]
- Pham, V.L.; Khan, A.B.; Nguyen, T.T.; Choi, W. A low cost, small ripple and fast balancing circuit for lithium-ion batteries strings. In Proceedings of the IEEE Transportation Electrification Conference and Expo, Asia-Pacific, (ITEC), Busan, Korea, 1–4 June 2016; pp. 861–865. [Google Scholar]
- Hemmati, R.; Saboori, H. Emergency of hybrid energy storage systems in renewable energy and transport applications—A review. Renew. Sustain. Energy Rev. 2016, 65, 11–23. [Google Scholar]
- Rodrigues, E.M.; Godina, R.; Osório, G.J.; Lujano-Rojas, J.M.; Matias, J.C.; Catalão, J.P. Assessing Lead-Acid Battery design parameters for energy storage applications on insular grids: A Case Study of Crete and Sao Miguel Islands. In Proceedings of the IEEE International Conference on Computer as Tool (EUROCON), Salamanca, Spain, 8–11 September 2015; pp. 1–6. [Google Scholar]
- Venkatesh, J.; Chen, S.; Tinnakornsrisuphap, P.; Rosing, T.S. Lifetime-dependent Battery Usage Optimization for Grid-Connected Residential Systems. In Proceedings of the Modelling and Simulation of Cyber-Physical Energy Workshop, Seattle, WA, USA, 13 April 2015; pp. 1–6. [Google Scholar]
- Serna-Suárez, I.D.; Ordóñez-Plata, G.; Petit-Suárez, J.F.; Caicedo, G.C. Storage systems scheduling effects on the life of lead-acid batteries. In Proceedings of the IEEE PES Innovative Smart Grid Technologies Latin America (ISGT LATAM), Montevideo, Uruguay, 5–7 October 2015; pp. 740–745. [Google Scholar]
- Yan, W.; Tian-ming, Y.; Bao-jie, L. Lead-acid Power Battery Management System Based on Kalman Filtering. In Proceedings of the IEEE Vehicle Power and Propulsion (VPPC), Harbin, China, 3–5 September 2008; pp. 1–6. [Google Scholar]
- Khayat, N.; Karami, N. Adaptive Techniques Used for Lifetime Estimation of Lithium-Ion Batteries. In Proceedings of the Third International Conference on Electrical, Electronics, Computer Engineering and their Applications (EECEA), Beirut, Lebanon, 21–23 April 2016; pp. 98–103. [Google Scholar]
- Khatibi, M.; Jazaeri, M. An analysis for increasing the Penetration of Renewable Energies by Optimal Sizing of Pumped-Storage Power Plants. In Proceedings of the IEEE Electrical Power & Energy Conference, Vancouver, BC, Canada, 6–7 October 2008; pp. 1–5. [Google Scholar]
- Seo, H.R.; Kim, G.H.; Kim, S.Y.; Kim, N.; Lee, H.G.; Hwang, C.; Park, M.; Yu, I.K. Power Quality Control Strategy for Grid-connected Renewable Energy Soures Using PV array and Supercapacitor. In Proceedings of the Electrical Machines and Systems (ICEMS) Conference, Incheon, Korea, 10–13 October 2010; pp. 437–441. [Google Scholar]
- Delimustafic, D.; Islambegovic, J.; Aksamovic, A.; Masic, S. Model of a hybrid renewable energy system: Control, supervision and energy distribution. In Proceedings of the 2011 IEEE International Symposium Industrial Electronics (ISIE), Gdansk, Poland, 27–30 June 2011; pp. 1081–1086. [Google Scholar]
- Belhadji, L.; Bacha, S.; Munteanu, I.; Roye, D. Control of a small variable speed pumped- storage power plant. In Proceedings of the 2013 Fourth International Conference Power Engineering, Energy and Electrical Drives (POWERENG), Istanbul, Turkey, 13–17 May 2013; pp. 787–792. [Google Scholar]
- Thounthong, P.; Sikkabut, S.; Sethakul, P.; Davat, B. Control Algorithm of Renewable Energy Power Plant Supplied By Fuel Cell/Solar Cell/ Supercapacitor Power Source. In Proceedings of the International Power Electronics Conference, Sapporo, Japan, 21–24 June 2010; pp. 1155–1162. [Google Scholar]
- Farhadi, M.; Mohammed, O. Energy Storage Systems for High Power Applications. In Proceedings of the Industry Applications Society, Annual Meeting, Addison, TX, USA, 18–22 October 2015; pp. 1–7. [Google Scholar]
- Alhamad, I.M. A feasibility study of rood mounted grid-connected PV solar system under Abu Dhabi net metering scheme using HOMER. In Proceedings of the Advances in Science and Engineering Technology International Conference, (ASET), Abu Dhabi, United Arab Emirates, 6 February–5 April 2018; pp. 1–4. [Google Scholar]
- Pan, C.; Liang, Y.; Chen, L.; Chen, L. Optimal Control for Hybrid Energy Storage Electric Vehicle to Achieve Energy Saving Using Dynamic Programming Approach. Energies 2019, 12, 588. [Google Scholar]
- Werkstetter, S. Existing and Future Ultra-capacitor Applications in the Renewable Energy Market. In Proceedings of the PCIM Europe International Exhibition and Conference for Power Electronics, Intelligent Motion, Renewable Energy and Energy Management, Nuremberg, Germany, 20–22 May 2014; pp. 1–7. [Google Scholar]
- Chotia, I.; Chowdhury, S. Battery Storage and Hybrid battery supercapacitor storage systems: A Cooperative critical review. In Proceedings of the Smart Grid Technologies–Asia (ISGT ASIA) Innovative, Bangkok, Thailand, 3–6 November 2015; pp. 1–6. [Google Scholar]
- Zhou, H.; Bhattacharya, T.; Tran, D.; Siew, T.S.T.; Khambadkone, A.M. Composite Energy Storage System Involving Battery and Ultra Capacitor with Dynamic Energy Management in Microgrid Applications. IEEE Trans. Power Electron. 2011, 26, 923–930. [Google Scholar]
- Harpool, S.; von Jouanne, A.; Yokochi, A. Supercapacitor Performance Characterization for Renewable Applications. In Proceedings of the IEEE Conference on Technologies for Sustainability, (SusTech), Portland, OR, USA, 24–26 July 2014; pp. 160–164. [Google Scholar]
- Keshan, H.; Thornburg, J.; Ustun, T.S. Comparison of Lead-Acid and Lithium Ion Batteries for Stationery Storage in Off-Grid Energy. In Proceedings of the IET Clean Energy and Technology Conference, (CEAT 2016), Kuala Lumpur, Malaysia, 14–15 November 2016. [Google Scholar]
- Dutt, D. Life cycle analysis and recycling techniques of batteries used in renewable energy applications. In Proceedings of the International Conference on New Concepts in Smart Cities: Fostering Public and Private Alliances (Smart MILE), Gijon, Spain, 11–13 December 2013; pp. 1–7. [Google Scholar]
- Tian, Y.; Li, D.; Tian, J.; Xia, B. A comparative study of state of charge estimation algorithms for lithium ion batteries in wireless charging electric vehicles. In Proceedings of the 2016 IEEE PELS Workshop on Emerging Technologies: Wireless Power Transfer (WoW), Knoxville, TN, USA, 4–6 October 2016; pp. 186–190. [Google Scholar]
- Rivera-Barrera, J.; Muñoz-Galeano, N.; Sarmiento-Maldonado, H. Sarmiento-Maldonado. SOC Estimation for Lithium-ion Batteries: Review and Future Challenges. Electronics 2017, 6, 102. [Google Scholar]
- He, H.; Xiong, R.; Fan, J. Evaluation of Lithium-Ion Battery Equivalent Circuit Models for State of Charge Estimation by and Experimental Approach. Energies 2011, 4, 582–589. [Google Scholar]
- Zhang, C.; Jiang, J.; Zhang, L.; Liu, S.; Wang, L.; Loh, P.A. Generalized SOC-OCV Model for Lithium-Ion Batteries and the SOC Estimation for LNMCO Battery. Energies 2016, 9, 900. [Google Scholar]
- Eckhouse, B.; Pogkas, D.; Chediak, M. How Batteries Went from Primitive Power to Global Domination. 13 June 2018. Available online: https://www.bloomberg.com/news/articles/2018-06-13/how-batteries-went-from-primitive-power-to-global-domination (accessed on 20 July 2018).
- Curry, C. Lithium-ion Battery Costs and Market. 5 July 2017. Available online: https://data.bloomberglp.com/bnef/sites/14/2017/07/BNEF-Lithium-ion-battery-costs-and-market.pdf (accessed on 4 August 2018).
- Independent, Tesla’s Giant Battery Reduces Cost of Power Outages by 90 per cent in South Australia. 12 May 2018. Available online: https://www.independent.co.uk/news/world/australasia/tesla-giant-battery-south-australia-reduce-cost-power-outage-backup-system-fcas-a8348431.html (accessed on 16 July 2018).
- Asif, A.; Singh, R. Further Cost Reduction of Battery Manufacturing. Batteries 2017, 3, 17. [Google Scholar]
- Nko, M.; Chowdhury, S.P.D. Storage Batteries the Future for Energy Storage. In Proceedings of the 2018 IEEE PES/IAS Power Africa, Cape Town, South Africa, 28–29 June 2018; pp. 705–709. [Google Scholar]
- Diouf, B.; Pode, R. Potential of Lithium-Ion Batteries in Renewable Energy. Renew. Energy 2015, 76, 375–380. [Google Scholar]
- Mirsaeidi, S.; Gandomkar, M.; Miveh, M.R.; Gharibdoost, M.R. Power system Load Regulation by Pumped Storage Power Plants. In Proceedings of the 17th Conference on Electrical Power Distribution Networks (EPDC), Tehran, Iran, 2–3 May 2012; pp. 1–5. [Google Scholar]
- Banshwar, A.; Sharma, N.K.; Sood, Y.R.; Srivastava, R. Determination of Optimal Capacity of Pumped Storage Plant by Efficient Management of Renewable Energy Sources. In Proceedings of the IEEE Students Conference on Engineering and Systems (SCES), Allahabad, India, 6–8 November 2015; pp. 1–5. [Google Scholar]
- Koussa, D.S.; Koussa, M. HOMER Analysis for Integrating Wind Energy into the Grid in Southern of Algeria. In Proceedings of the International Renewable and Sustainable Energy Conference (IRSEC), Ouarzazate, Morocco, 17–19 October 2014; pp. 360–366. [Google Scholar]
- Kumari, J.; Subathra, P.; Moses, J.E.; Shruthi, D. Economic analysis of hybrid energy system for rural electrification using HOMER. In Proceedings of the International Conference on Innovations in Electrical, Electronics, Instrumentation and Media Technology, Coimbatore, India, 3–4 February 2017; pp. 151–156. [Google Scholar]
- Sureshkumar, U.; Manoharan, P.S.; Ramalakshmi, A.P.S. Economic cost analysis of hybrid renewable energy system using HOMER. In Proceedings of the IEEE-International Conference on Advances in Engineering, Science and Management (ICAESM-2012), Nagapattinam, Tamil Nadu, India, 30–31 March 2012; pp. 94–99. [Google Scholar]


| Cost Type | Storage Batteries System (Case Study 1) | PPS System (Case Study 2) | System Difference = (Battery − PPS) |
|---|---|---|---|
| Net Present Cost | USD 13,737,697.00 | USD 14,372,363.34 | USD −6,346,666.34 |
| Annualised Cost | USD 1,403,618.41 | USD 1,468,463.77 | USD −64,845.3 |
| Cost Type | Storage Battery Bank | PPS Storage Bank | Component Difference = (Battery − PPS) |
|---|---|---|---|
| Net Present Cost | USD 753,703.22 | USD 835,018.73 | USD −81,315.51 |
| Annualised Cost | USD 77,007.95 | USD 85,316.16 | USD −8,308.71 |
| Cost Type | Storage Batteries (Case Study 3) | PPS (Case Study 4) | Difference = (Battery − PPS) |
|---|---|---|---|
| Net Present Cost | USD 8,732,832.81 | USD 8,623,418.01 | USD 109,414.80 |
| Annualised Cost | USD 892,257.59 | USD 881,078.38 | USD 11,179.21 |
| Cost Type | Storage Battery Bank | PPS Storage Bank | Component Difference = (Battery − PPS) |
|---|---|---|---|
| Net Present Cost | USD 610,426.04 | USD 501,011.24 | USD 109,414.80 |
| Annualised Cost | USD 62,368.91 | USD 51,189.70 | USD 11,196.4 |
| Cost Type | Storage Batteries (Case Study 5) | PPS (Case Study 6) | Difference = (Battery − PPS) |
|---|---|---|---|
| Net Present Cost | USD 1,601,392.37 | USD 2,732,246.73 | USD −1,130,854.36 |
| Annualised Cost | USD 163,618.67 | USD 279,161.18 | USD −115,542.51 |
| Cost Type | Storage Battery Bank | PPS Storage Bank | Component Difference = (Battery − PPS) |
|---|---|---|---|
| Net Present Cost | USD 188,295.87 | USD 83,501.87 | USD 104,794.00 |
| Annualized Cost | USD 19,238.71 | USD 8,531.62 | USD 10,707.09 |
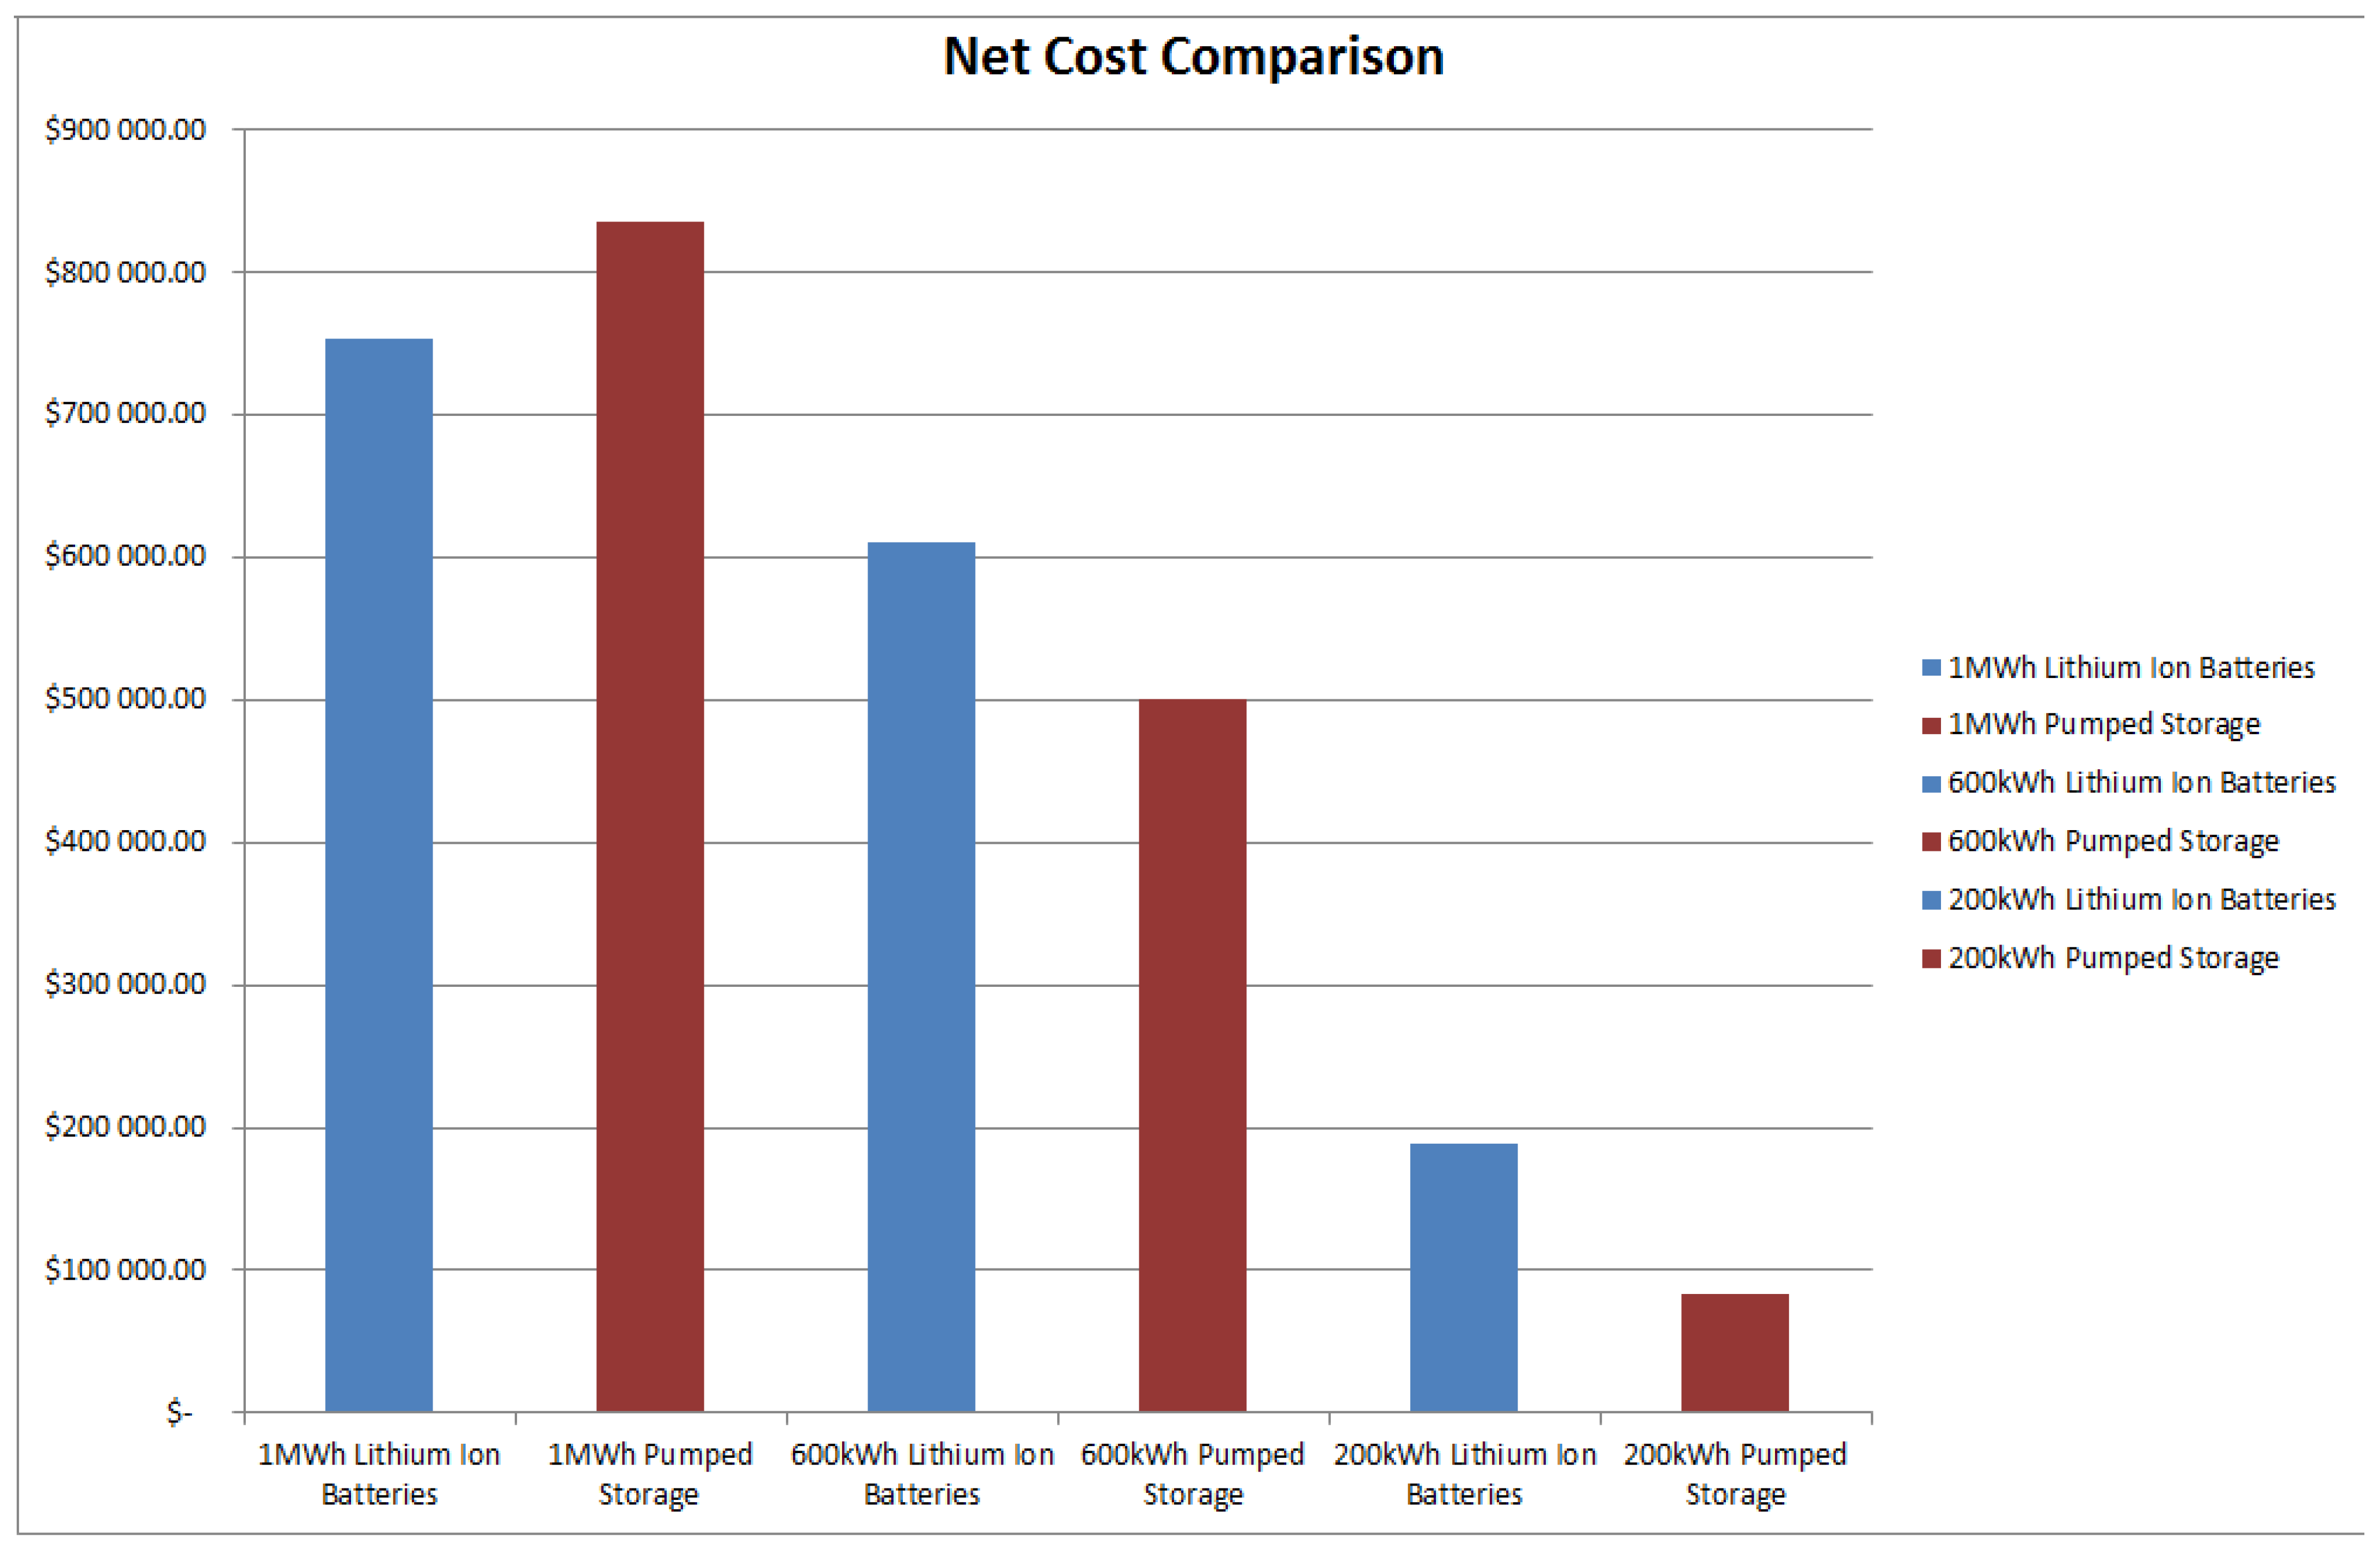
| Scenario Type | Net Cost | Annualised Cost |
|---|---|---|
| 1 MWh Lithium Ion Batteries | USD 753,703.32 | USD 77,007.95 |
| 1 MWh Pumped Storage | USD 835,018.73 | USD 85,316.16 |
| 600 kWh Lithium Ion Batteries | USD 610,426.04 | USD 62,368.91 |
| 600 kWh Pumped Storage | USD 501,011.24 | USD 51,189.70 |
| 200 kWh Lithium Ion Batteries | USD 188,295.87 | USD 19,238.71 |
| 200 kWh Pumped Storage | USD 83,501.87 | USD 8,531.62 |
© 2019 by the authors. Licensee MDPI, Basel, Switzerland. This article is an open access article distributed under the terms and conditions of the Creative Commons Attribution (CC BY) license (http://creativecommons.org/licenses/by/4.0/).
Share and Cite
Nko, M.; Chowdhury, S.P.D.; Popoola, O. Application Assessment of Pumped Storage and Lithium-Ion Batteries on Electricity Supply Grid. Energies 2019, 12, 2855. https://doi.org/10.3390/en12152855
Nko M, Chowdhury SPD, Popoola O. Application Assessment of Pumped Storage and Lithium-Ion Batteries on Electricity Supply Grid. Energies. 2019; 12(15):2855. https://doi.org/10.3390/en12152855
Chicago/Turabian StyleNko, Macdonald, S.P. Daniel Chowdhury, and Olawale Popoola. 2019. "Application Assessment of Pumped Storage and Lithium-Ion Batteries on Electricity Supply Grid" Energies 12, no. 15: 2855. https://doi.org/10.3390/en12152855
APA StyleNko, M., Chowdhury, S. P. D., & Popoola, O. (2019). Application Assessment of Pumped Storage and Lithium-Ion Batteries on Electricity Supply Grid. Energies, 12(15), 2855. https://doi.org/10.3390/en12152855