Influence Mechanism of Geometric Characteristics of Water Conveyance System on Extreme Water Hammer during Load Rejection in Pumped Storage Plants


Abstract
:
1. Introduction
2. Theoretical Analysis and Mathematical Model
2.1. Theoretical Analysis
2.2. Mathematical Model
2.2.1. Basic Equations of RPT
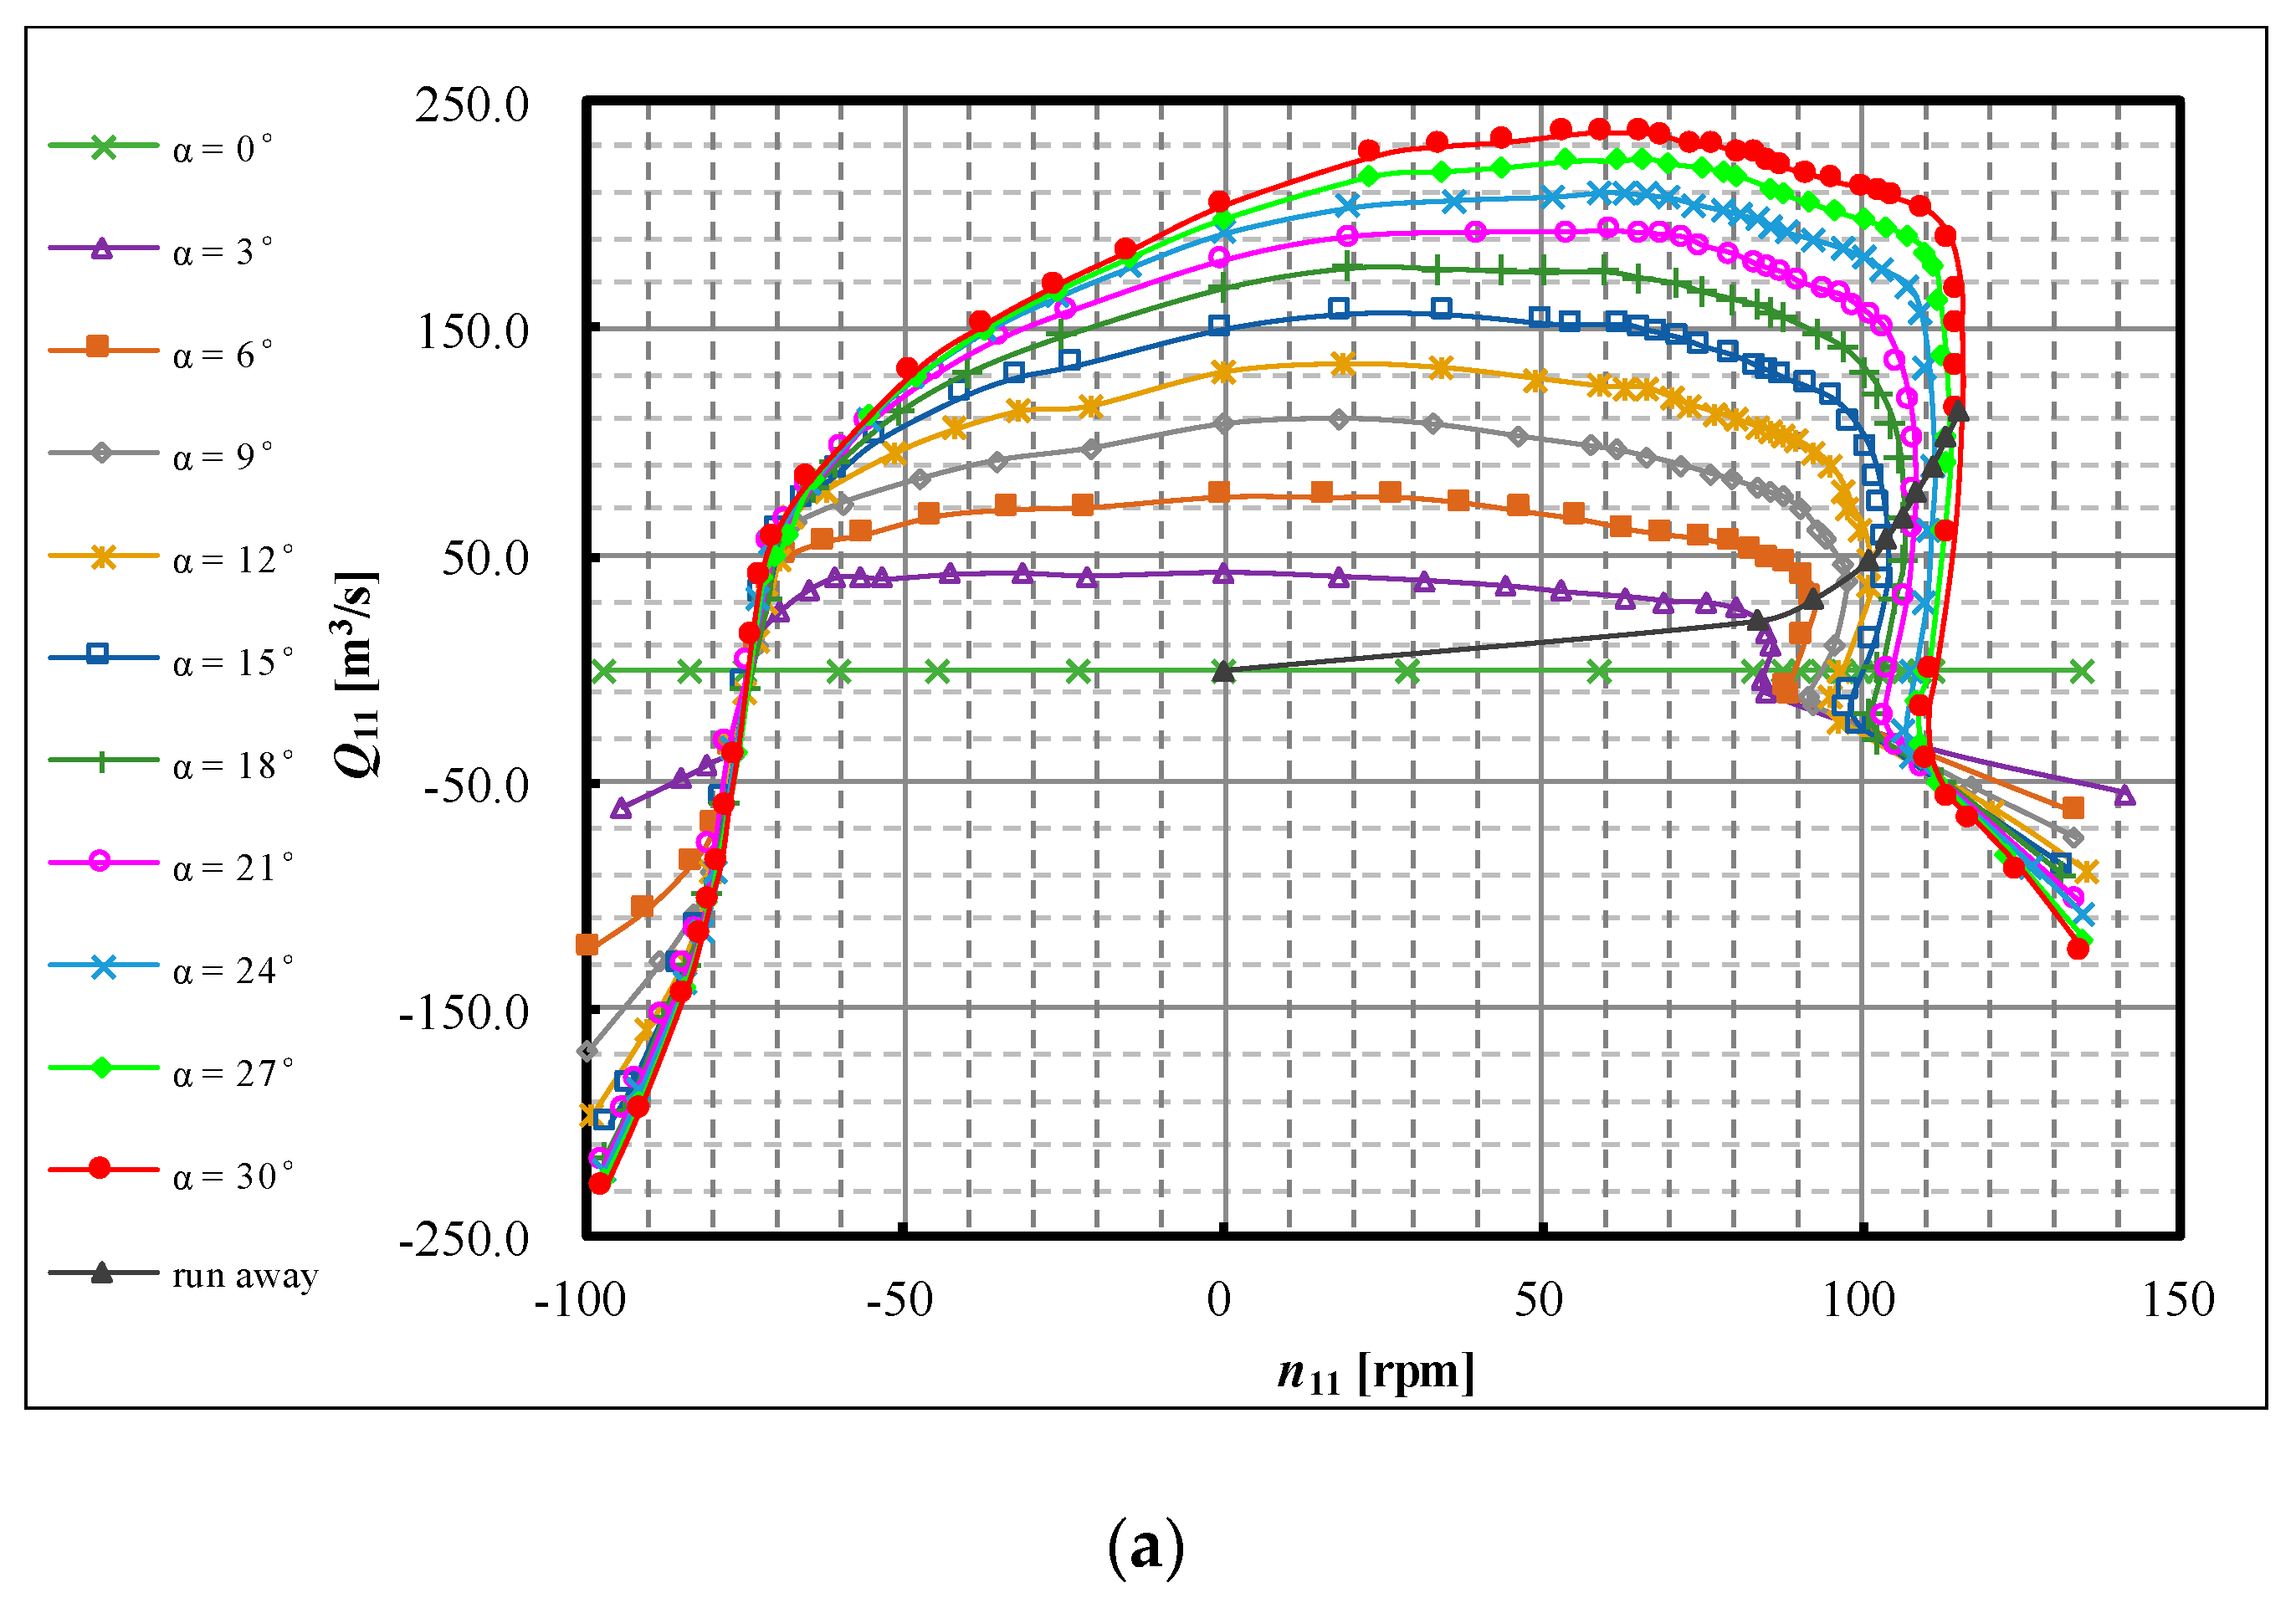
2.2.2. Modified Suter Transformation for RPT Characteristics
2.2.3. Technical Parameters
3. Numerical Simulation and Results
3.1. Scenario 1: Changing Length of Both Main and Branch Pipes
3.2. Scenario 2: Changing Diameter of Branch Pipe
3.3. Scenario 3: Changing Length and Area of Both Main and Branch Pipes Simultaneously
4. Discussion
5. Conclusions
Author Contributions
Funding
Conflicts of Interest
Nomenclature
| c | Constant selected between 1 and 1.5 | - |
| D | Diameter of runner | m |
| fi | Cross-sectional area of i-th pipeline | m2 |
| fsc | Area at spiral case end | m2 |
| fdt | Area at draft tube inlet | m2 |
| g | Gravitational acceleration | m/s2 |
| H | Working head of RPT | m |
| HFu | Piezometric head at upstream bifurcation | m |
| Hr | Rated head | m |
| h | Dimensionless head | - |
| htu | Dimensionless head at spiral case end | - |
| Htu1 | Piezometric head at the spiral case of RPT 1 | m |
| Htu2 | Piezometric head at the spiral case of RPT 2 | m |
| i | Number of pipeline reaches, =1–3 | - |
| I | Inertia polar moment | kg·m2 |
| Li | Length of i-th pipeline reach | m |
| M | Shaft torque | N·m |
| Mr | Rated shaft torque | N·m |
| M11 | Unit torque | N·m |
| N | Rotational speed | r/min |
| Nr | Rated rotational speed | r/min |
| n | Dimensionless rotational speed | r/min |
| n0 | Result of a previous time step of n | r/min |
| n11 | Unit speed | r/min |
| n11r | Rated unit speed | r/min |
| P | Power generated by RPT | kW |
| Pg | Power absorbed by generator | kW |
| Q | Demand discharge of RPT | m3/s |
| q | Dimensionless discharge | - |
| q1 | Dimensionless demand discharge of RPT 1 | - |
| Q1 | Demand discharge of RPT 1 | m3/s |
| Q11 | Unit discharge | m3/s |
| Q11r | Rated unit discharge | m3/s |
| q2 | Dimensionless demand discharge of RPT 2 | - |
| Q2 | Demand discharge of RPT 2 | m3/s |
| Qr | Rated discharge | m3/s |
| qT | Dimensionless rated discharge | - |
| QT | Discharge of headrace tunnel | m3/s |
| Rg | Gyration radius | m |
| t | Time | s |
| tc | Worst interval time | s |
| Ta | Mechanical starting time | s |
| Tw,u | Water inertia time constant of upstream pipelines | s |
| Twm,u | Water inertia time constant of upstream main pipe | s |
| Twb,u | Water inertia time constant of upstream branch pipe | s |
| W | Weight | kg |
| WB | Turbine torque characteristics | - |
| WH | Turbine head characteristics | - |
| x | Polar angle | rad |
| y | Dimensionless guide vane opening | - |
| z | Dimensionless water level | - |
| zu | Dimensionless upstream reservoir water level | - |
| Zu | Upstream reservoir water level | M |
| αi | Head loss coefficient of i-th pipeline reach | - |
| α0 | Wicket gate opening | ° |
| β | Dimensionless torque | - |
| β0 | Result of a previous time step of β | - |
| ω | Angular velocity | rad/s |
| η1 | Proportion of water inertia of branch pipe to that of upstream pipelines | - |
| Δt | Time step | s |
| Dimensionless rate of discharge change of RPT 1 | S−1 | |
| Dimensionless rate of discharge change of RPT 2 | s−1 | |
| Dimensionless rate of discharge change of headrace tunnel | s−1 | |
| Rate of discharge change of RPT 1 | s−1 | |
| Rate of discharge change of RPT 2 | s−1 | |
| Rate of discharge change of headrace tunnel | s−1 |
Abbreviations
| DTP | Draft tube pressure |
| MOC | Method of characteristic |
| PSP | Pumped storage plant |
| RES | Renewable energy sources |
| RPT | Reversible pump turbine |
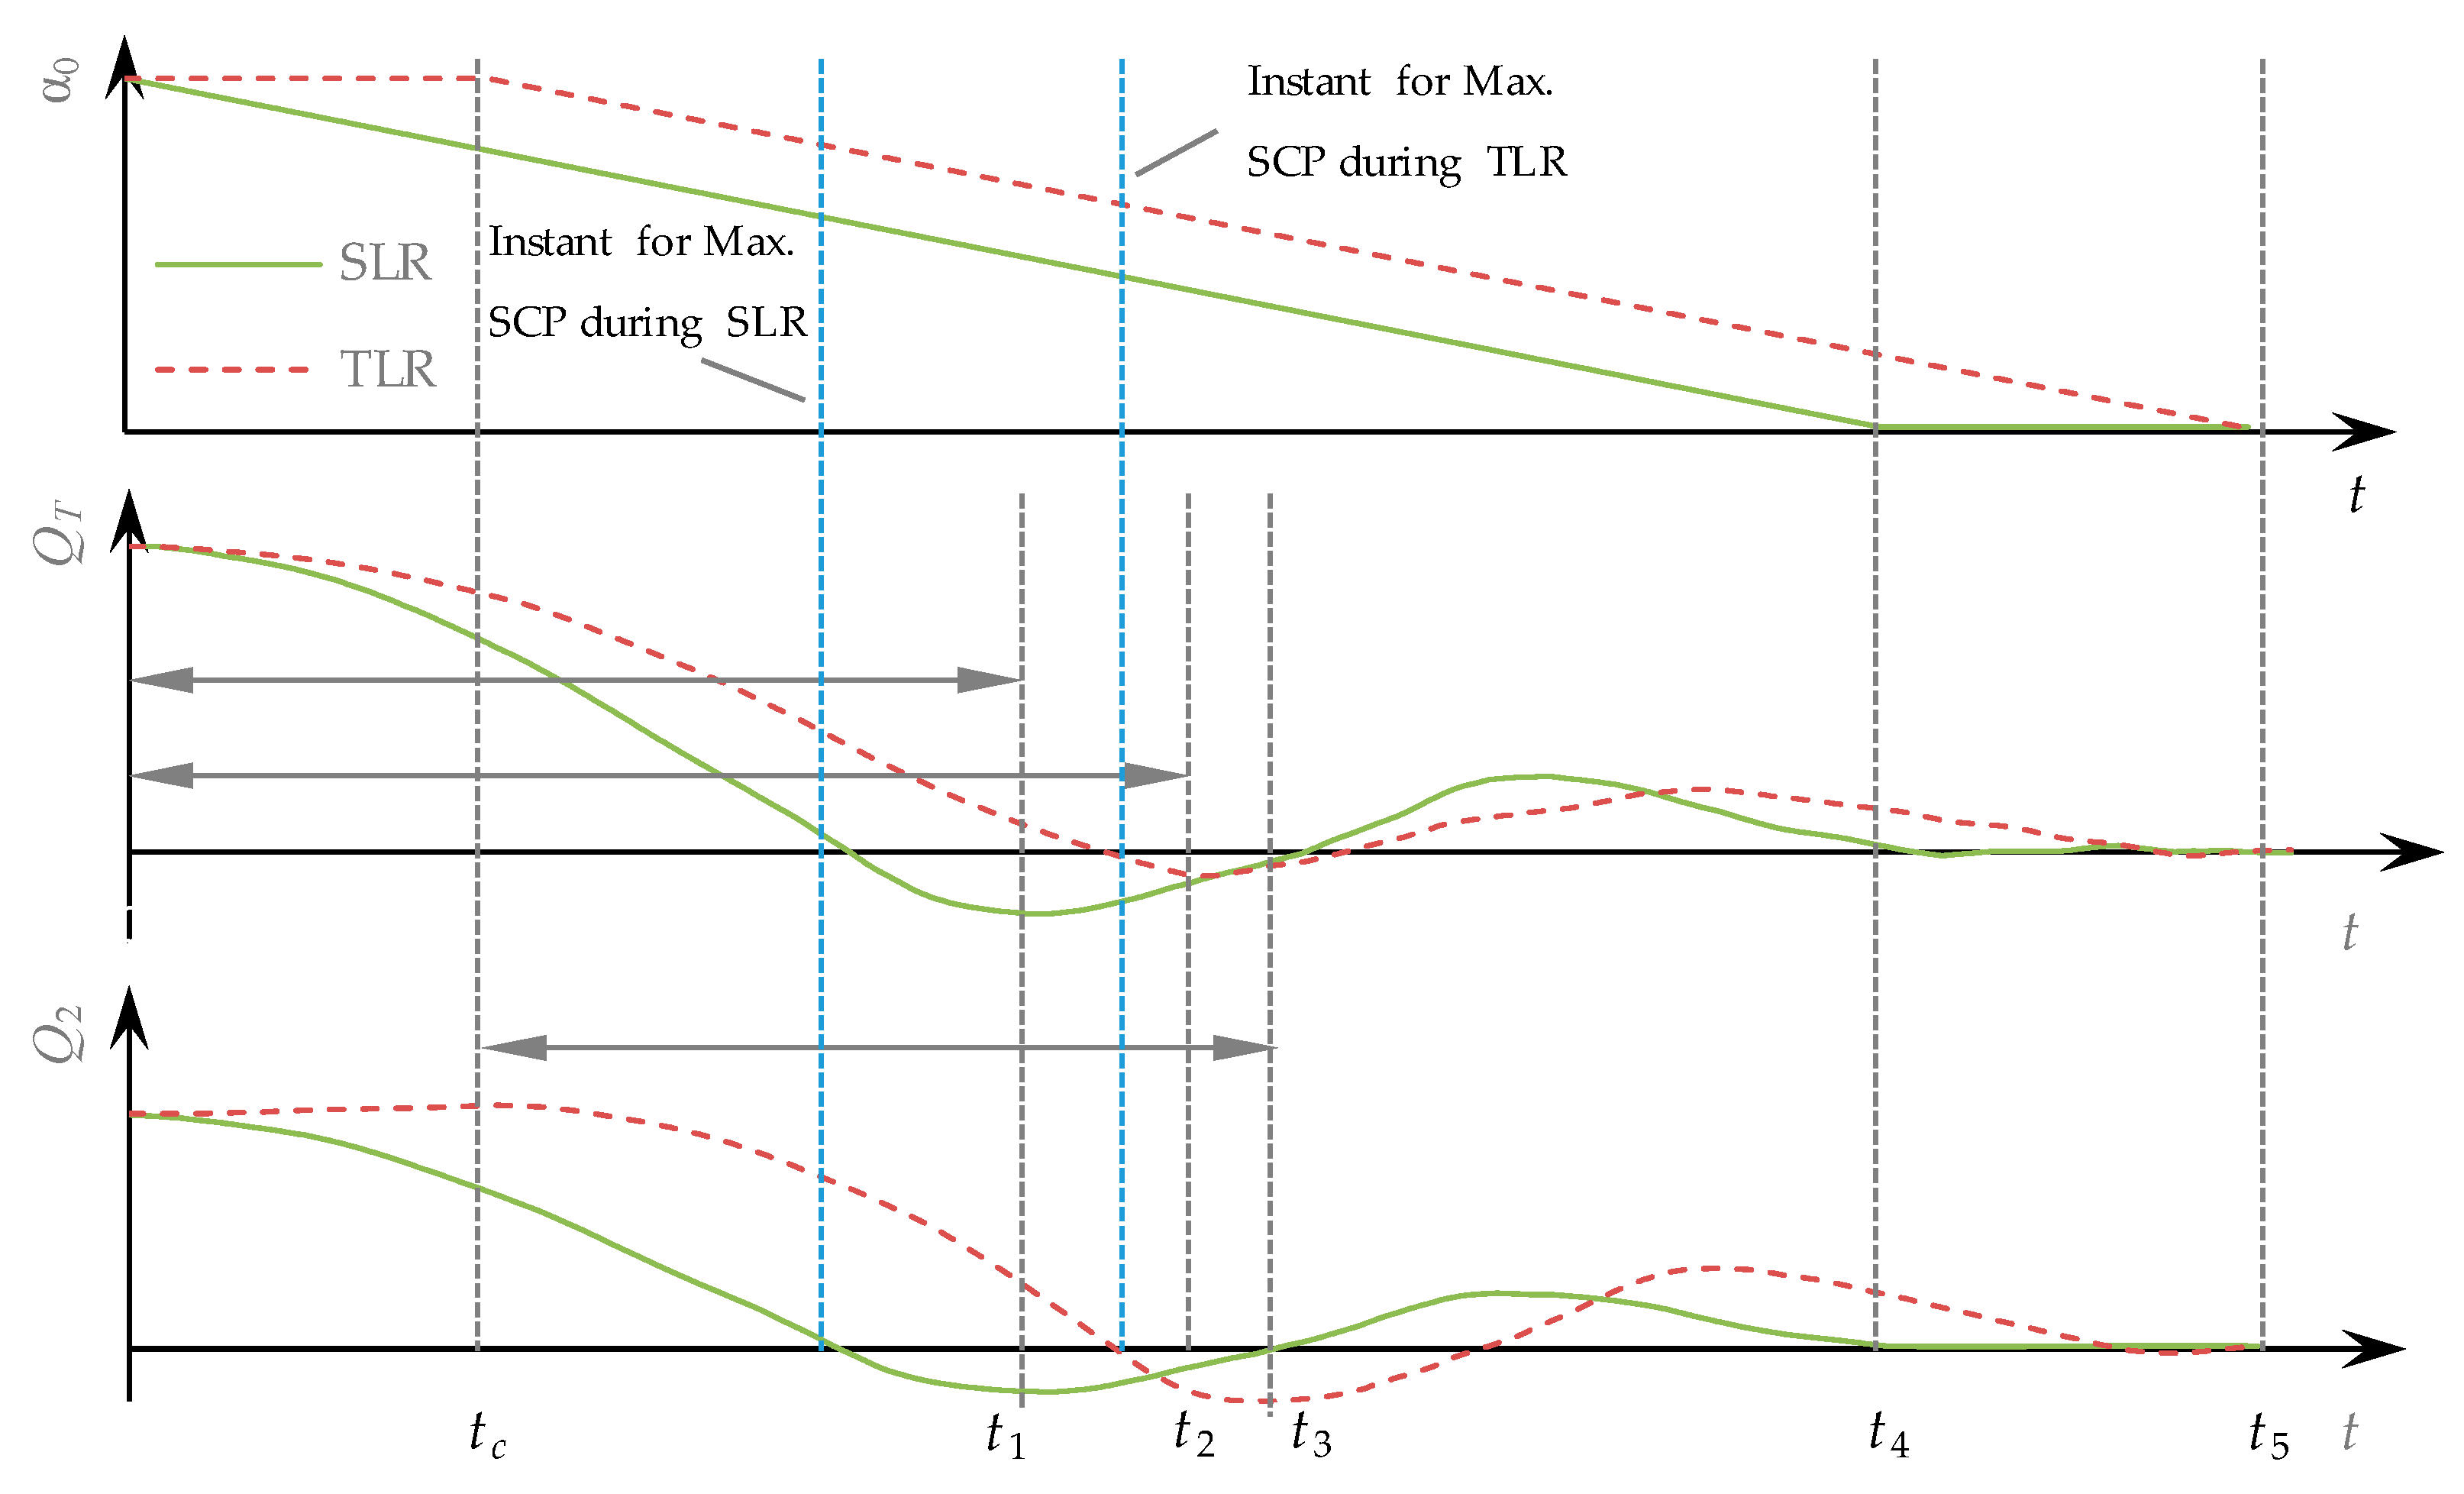
| SCP | Spiral case pressure |
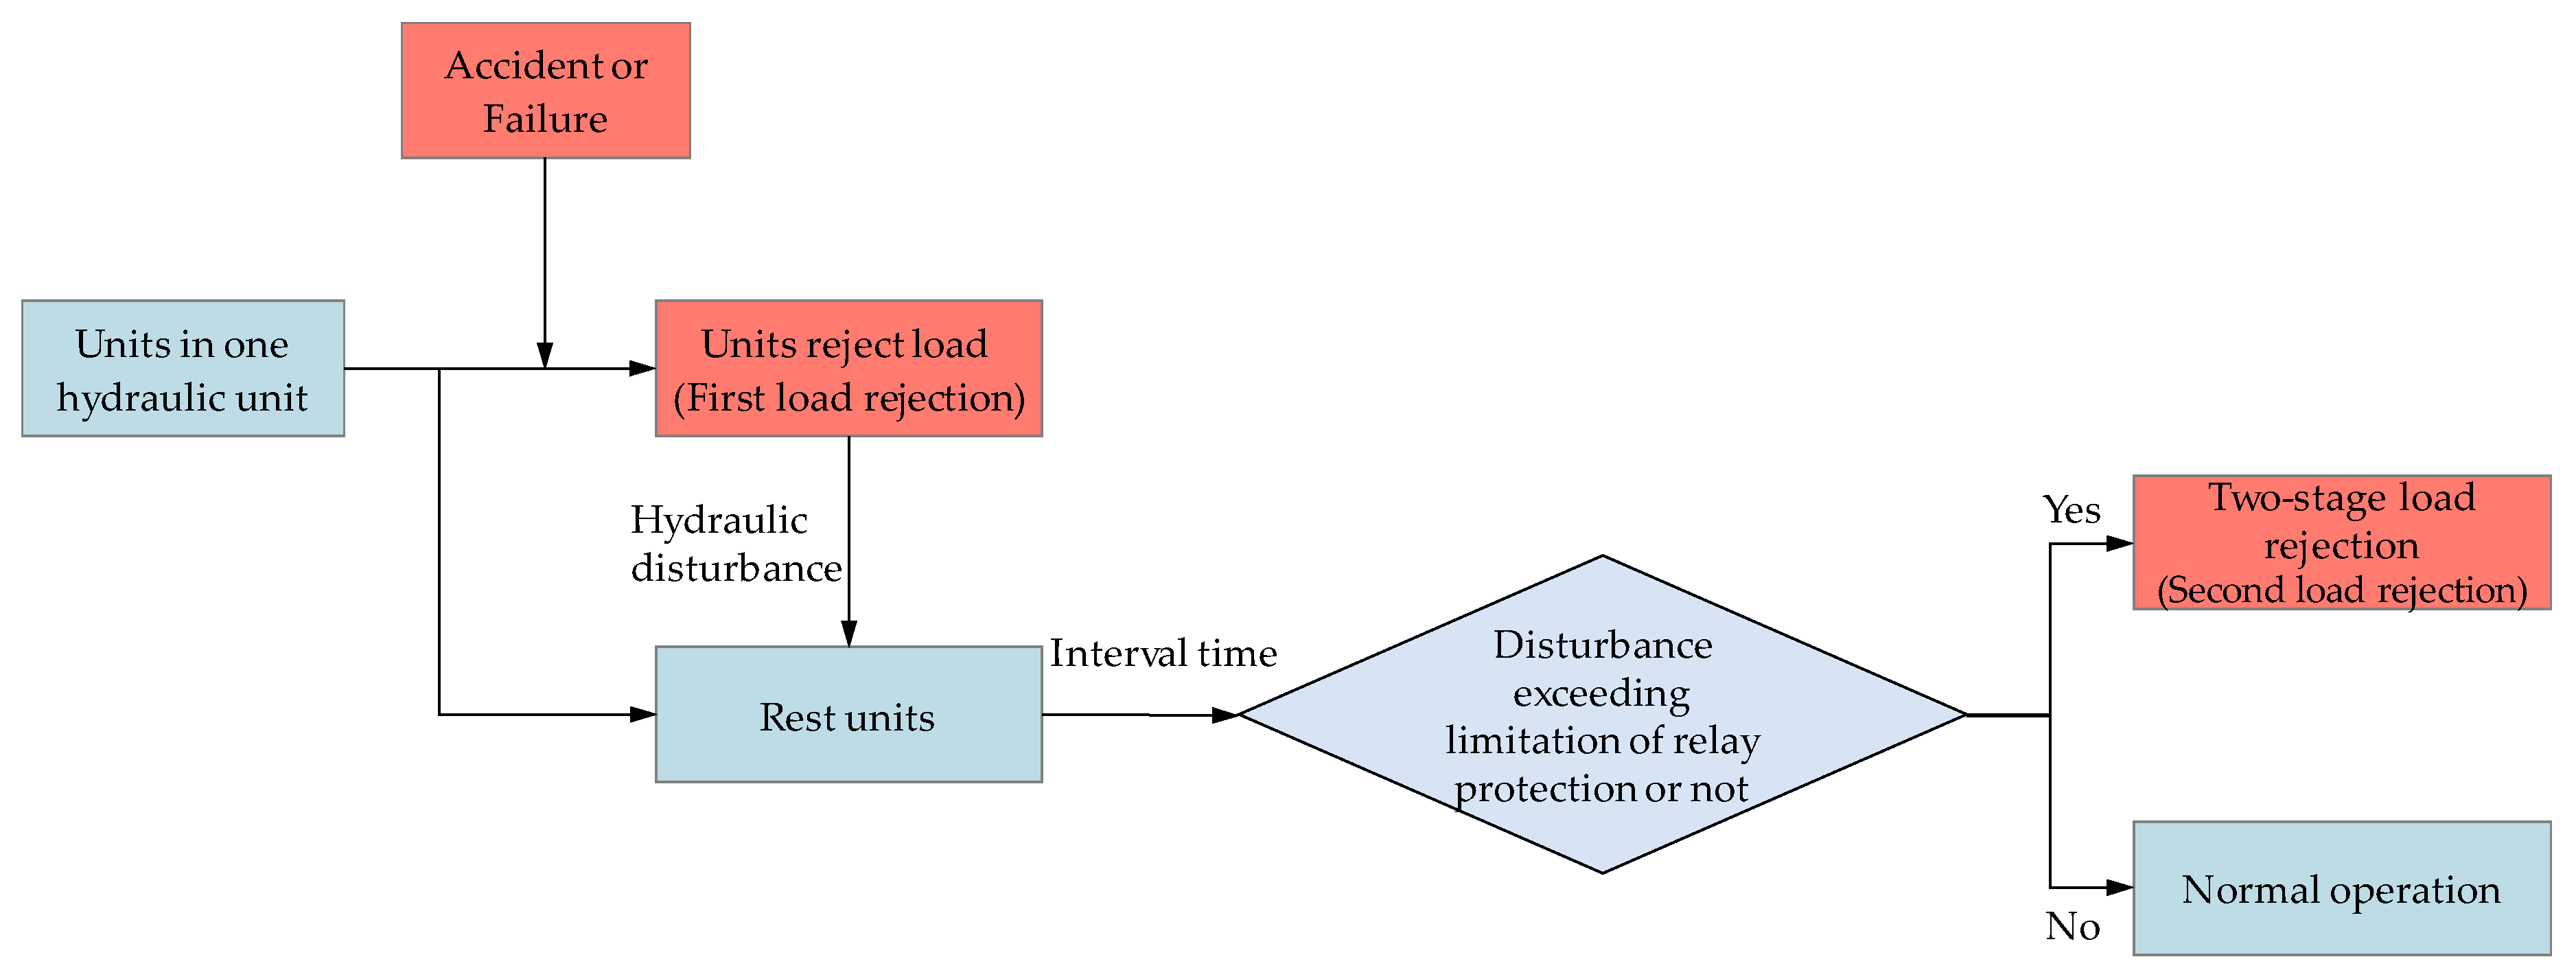
| SLR | Simultaneous load rejection |
| TLR | Two-stage load rejection |
References
- Dai, H.C.; Xie, X.X.; Xie, Y.; Liu, J.; Masui, T. Green growth: The economic impacts of large-scale renewable energy development in China. Appl. Energy 2016, 162, 435–449. [Google Scholar] [CrossRef]
- Ellabban, O.; Abu-Rub, H.; Blaabjerg, F. Renewable energy resources: Current status, future prospects and their enabling technology. Renew. Sustain. Energy Rev. 2014, 39, 748–764. [Google Scholar] [CrossRef]
- Bhattacharya, M.; Paramati, S.R.; Ozturk, I.; Bhattacharya, S. The effect of renewable energy consumption on economic growth: Evidence from top 38 countries. Appl. Energy 2016, 162, 733–741. [Google Scholar] [CrossRef]
- Rehman, S.; Al-Hadhrami, L.M.; Alam, M.M. Pumped hydro energy storage system: A technological review. Renew. Sustain. Energy Rev. 2015, 44, 586–598. [Google Scholar] [CrossRef]
- Zeng, W.; Yang, J.D.; Yang, W.J. Instability analysis of pumped-storage stations under no-load conditions using a parameter-varying model. Renew. Energy 2016, 90, 420–429. [Google Scholar] [CrossRef]
- Chaudhary, P.; Rizwan, M. Energy management supporting high penetration of solar photovoltaic generation for smart grid using solar forecasts and pumped hydro storage system. Renew. Energy 2018, 118, 928–946. [Google Scholar] [CrossRef]
- Ghasemi, A.; Enayatzare, M. Optimal energy management of a renewable-based isolated microgrid with pumped-storage unit and demand response. Renew. Energy 2018, 123, 460–474. [Google Scholar] [CrossRef]
- Zeng, M.; Feng, J.J.; Xue, S.; Wang, Z.J.; Zhu, X.L.; Wang, Y.J. Development of China’s pumped storage plant and related policy analysis. Energy Policy 2013, 61, 104–113. [Google Scholar] [CrossRef]
- Hino, T.; Lejeune, A. Pumped storage hydropower developments. Compre. Renew. Energy 2012, 6, 405–434. [Google Scholar] [CrossRef]
- Allievi, L. Teoria del Colpo D’ariete; Stabilimenti grafici Stucchi: Milan, Italy, 1913. [Google Scholar]
- Wood, F.M. The Application of heaviside’s Operational Calculus to the Solution of Problems in Waterhammer. Trans. ASME 1937, 59, 707–713. [Google Scholar]
- Rich, G. Waterhammer Analysis by the Laplace-Mellin Transformations. Trans. ASME 1945, 59, 361–376. [Google Scholar]
- Parmakian, J. Water-Hammer Analysis; Prentice-Hall, Inc.: Englewood Cliffs, NJ, USA, 1955. [Google Scholar]
- Streeter, V.L.; Lai, C. Waterhammer Analysis Including Fluid Friction. Trans. Am. Soc. Civ. Eng. 1963, 128, 1491–1524. [Google Scholar] [CrossRef]
- Streeter, V.L.; Wylie, E.B. Hydraulic Transients; McGraw-Hill: New York, NY, USA, 1967. [Google Scholar]
- Chaudhry, M.H. Applied Hydraulic Transients; Van Nostrand Reinhold: New York, NY, USA, 1987. [Google Scholar]
- Wylie, E.B.; Streeter, V.L.; Suo, L.S. Fluid Transients in Systems; Prentice-Hall, Inc.: Englewood Cliffs, NJ, USA, 1993. [Google Scholar]
- Wood, D.J.; Dorsch, R.G.; Lightnor, C. Wave-Plan Analysis of Unsteady Flow in Closed Conduits. J. Hydraul. Div. 1966, 92, 83–110. [Google Scholar]
- Guinot, V. Riemann Solvers for Water Hammer Simulations by Godunov Method. Int. J. Numer. Methods Eng. 2002, 49, 851–870. [Google Scholar] [CrossRef]
- Izquierdo, J.; Iglesias, P.L. Mathematical modelling of hydraulic transients in simple systems. Math. Comput. Model. 2002, 35, 801–812. [Google Scholar] [CrossRef]
- Yang, W.J.; Yang, J.D.; Guo, W.C.; Zeng, W.; Wang, C.; Saarinen, L.; Norrlund, P. A Mathematical Model and Its Application for Hydro Power Units under Different Operating Conditions. Energies 2015, 8, 10260–10275. [Google Scholar] [CrossRef]
- Rezghi, A.; Riasi, A. Sensitivity analysis of transient flow of two parallel pump-turbines operating at runaway. Renew. Energy 2016, 86, 611–622. [Google Scholar] [CrossRef]
- Rezghi, A.; Riasi, A. The interaction effect of hydraulic transient conditions of two parallel pump-turbine units in a pumped-storage power plant with considering “S-shaped” instability region: Numerical simulation. Renew. Energy 2018, 118, 896–908. [Google Scholar] [CrossRef]
- Hu, J.H.; Yang, J.D.; Zeng, W.; Yang, J.B. Transient Pressure Analysis of a Prototype Pump Turbine: Field Tests and Simulation. J. Fluids Eng. 2018, 140, 071102. [Google Scholar] [CrossRef]
- Zhou, D.Q.; Chen, H.X.; Zhang, L.G. Investigation of Pumped Storage Hydropower Power-Off Transient Process Using 3D Numerical Simulation Based on SP-VOF Hybrid Model. Energies 2018, 11, 1020. [Google Scholar] [CrossRef]
- Fu, X.; Li, D.; Wang, H.; Zhang, G.; Li, Z.; Wei, X. Analysis of transient flow in a pump-turbine during the load rejection process. J. Mech. Sci. Technol. 2018, 32, 2069–2078. [Google Scholar] [CrossRef]
- Fu, X.; Li, D.; Wang, H.; Zhang, G.; Li, Z.; Wei, X.; Qin, D. Energy analysis in a pump-turbine during the load rejection process. J. Fluids Eng. 2018, 140, 101107. [Google Scholar] [CrossRef]
- Kuwabara, T.; Katayama, K.; Nakagawa, H.; Hagiwara, H. Improvements of transient performance of pump turbine upon load rejection. In Proceedings of the IEEE Power Engineering Society Summer Meeting, Seattle, WA, USA, 16–20 July 2000; pp. 1783–1788. [Google Scholar] [CrossRef]
- Yu, X.; Zhang, J.; Miao, D. Innovative closure law for pump-turbines and field test verification. J. Hydraul. Eng. 2015, 141, 05014010. [Google Scholar] [CrossRef]
- Li, X.Q.; Tang, X.L.; Shi, X.Y.; Chen, H.H.; Li, C.S. Load rejection transient with joint closing law of ball-valve and guide vane for two units in pumped storage power station. J. Hydroinform. 2018, 20, 301–315. [Google Scholar] [CrossRef]
- Zhang, J.; Wang, D.L.; Hu, J.Y.; Zhou, J.; Fang, J. Study on Field Test and Simulating Calculation Following Load Rejections of Tongbai Pumped Storage Power Station. In Proceedings of the 2009 ASME Fluids Engineering Division Summer Conference, Jacksonville, FL, USA, 10–14 August 2008. [Google Scholar]
- Chen, S.; Zhang, J.; Li, G.H.; Yu, X.D. Load rejection test and numerical prediction of critical load case scenarios for pumped storage plant. In Proceedings of the ASME 2017 Fluids Engineering Division Summer Meeting, FEDSM 2017, Waikoloa, HI, USA, 30 July–3 August 2017. [Google Scholar]
- Yin, J.L.; Wang, D.Z.; Wei, X.Z.; Wang, L.Q. Hydraulic Improvement to Eliminate S-Shaped Curve in Pump Turbine. ASME. J. Fluids Eng. 2013, 135, 071105. [Google Scholar] [CrossRef]
- Yokoyama, T.; Shimmei, K. Dynamic Characteristics of Reversible Pump Turbines in Pumped Storage Plants. In Proceedings of the USDE and EPRI Symposium, Boston, MA, USA, 24–26 August 1984. [Google Scholar]
- Chen, S.; Zhang, J.; Wang, X.C. Characterization of surge superposition following 2-stage load rejection in hydroelectric power plant. Can. J. Civil Eng. 2016, 43, 844–850. [Google Scholar] [CrossRef]
- Zhang, J.; Suo, L.S. Study on tailrace surge chamber installation and hydraulic transients at pumped-storage plant. Water Res. Power 2008, 26, 83–87. [Google Scholar]
- Zhang, J.; Lu, W.H.; Hu, J.Y.; Fan, B.Q. Study on the hydraulic transients of pumped-turbines load successive rejection in pumped storage plant. In Proceedings of the 5th Joint ASME/JSME Fluids Engineering Summer Conference, FEDSM 2007, San Diego, CA, USA, 30 July–2 August 2007; pp. 57–61. [Google Scholar] [CrossRef]
- Zhang, J.; Lu, W.H.; Fan, B.Q.; Hu, J.Y. The influence of layout of water conveyance system on the hydraulic transients of pump-turbines load successive rejection in pumped storage station. J. Hydroelectric Eng. 2008, 27, 158–162. [Google Scholar]
- Zeng, W.; Yang, J.D. Effects of pipe diameters on the pressures during delayed load rejection in high-head pumped storage power stations. In Proceedings of the 27th IAHR Symposium on Hydraulic Machinery and System, Montreal, QC, Canada, 22–26 September 2014. [Google Scholar]
- Zeng, W.; Yang, J.D.; Hu, J.H.; Yang, J.B. Guide-vane closing schemes for pump-turbines based on transient characteristics in S-shaped region. ASME. J. Fluids Eng. 2016, 138, 051302. [Google Scholar] [CrossRef]
- Zeng, W.; Yang, J.D.; Tang, R.B.; Yang, W.J. Extreme water-hammer pressure during one-after-another load shedding in high-head pumped-storage stations. Renew. Energy 2016, 99, 35–44. [Google Scholar] [CrossRef]
- Fang, Y.J.; Koutnik, J. The numerical simulation of the delayed load rejection of a pump-turbine power plant. In Proceedings of the 26th IAHR Symposium on Hydraulic Machinery and System, Beijing, China, 19–23 August 2012. [Google Scholar]
- Chen, S. Investigation on 2-Stage Load Rejection and Water Hammer Protection in Hydroelectric Power Plants. Ph.D. Thesis, Hohai University, Nanjing, China, 12 September 2014. [Google Scholar]
- Ghidaoui, M.S.; Zhao, M.; McInnis, D.A.; Axworthy, D.H. A Review of Water Hammer Theory and Practice. Appl. Mech. Rev. 2005, 58, 49–76. [Google Scholar] [CrossRef]
- Yang, K.L. Hydraulic Transient and Regulation in Hydropower Station and Pump Station, 1st ed.; China Water & Power Press: Beijing, China, 1999. [Google Scholar]


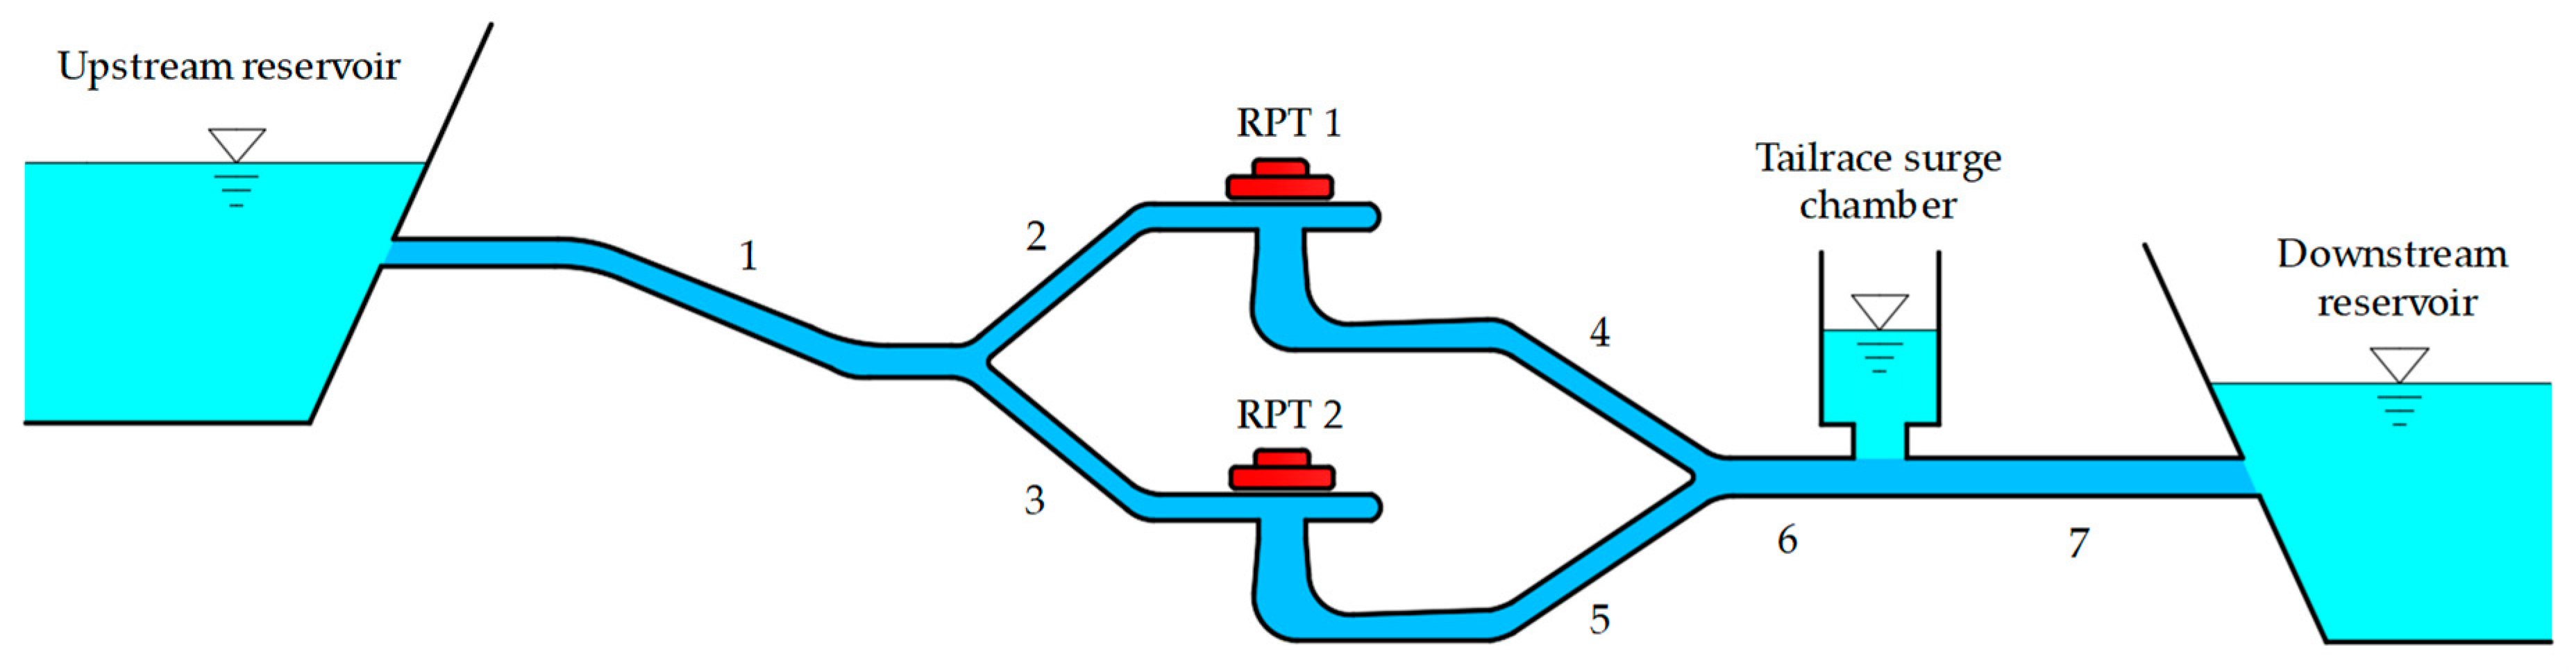
| Number of Reaches | Length L (m) | Diameter D (m) | Head Loss Coefficient α (×10−6) (/) | Initial Demand Discharge (m3/s) |
|---|---|---|---|---|
| 1 | 1200 | 6.8 | 123.24 | 162.42 |
| 2 | 120 | 2.8 | 781.80 | 81.21 |
| 3 | 120 | 2.8 | 781.80 | 81.21 |
| 4 | 200 | 5.0 | 109.32 | 81.21 |
| 5 | 200 | 5.0 | 109.32 | 81.21 |
| 6 | 50 | 7.0 | 10.02 | 162.42 |
| 7 | 1300 | 7.0 | 104.37 | 162.42 |
| Main Pipe | L1 (m) | 934.26 | 997.58 | 1096.45 | 1200.00 | 1271.63 |
| D1 (m) | 6.8 | |||||
| f1 (m2) | 36.32 | |||||
| Twm,u (s) | 0.57 | 0.61 | 0.67 | 0.73 | 0.77 | |
| Branch Pipe | L3 (m) | 385.74 | 322.42 | 223.55 | 120.00 | 48.37 |
| D3 (m) | 2.8 | |||||
| f3 (m2) | 6.16 | |||||
| Twb,u (s) | 1.38 | 1.16 | 0.80 | 0.43 | 0.17 | |
| Tw,u(s) η1 | 1.95 | 1.77 | 1.47 | 1.16 | 0.94 | |
| 0.71 | 0.66 | 0.55 | 0.37 | 0.18 | ||
| Max. SCP during SLR (m) | 651.17 | 645.25 | 637.63 | 628.02 | 622.28 | |
| Max. SCP during TLR (m) | 673.10 | 666.61 | 652.35 | 634.03 | 622.28 | |
| Worst Interval Time (s) | 4.8 | 4.8 | 4.8 | 1.8 | 0 1 | |
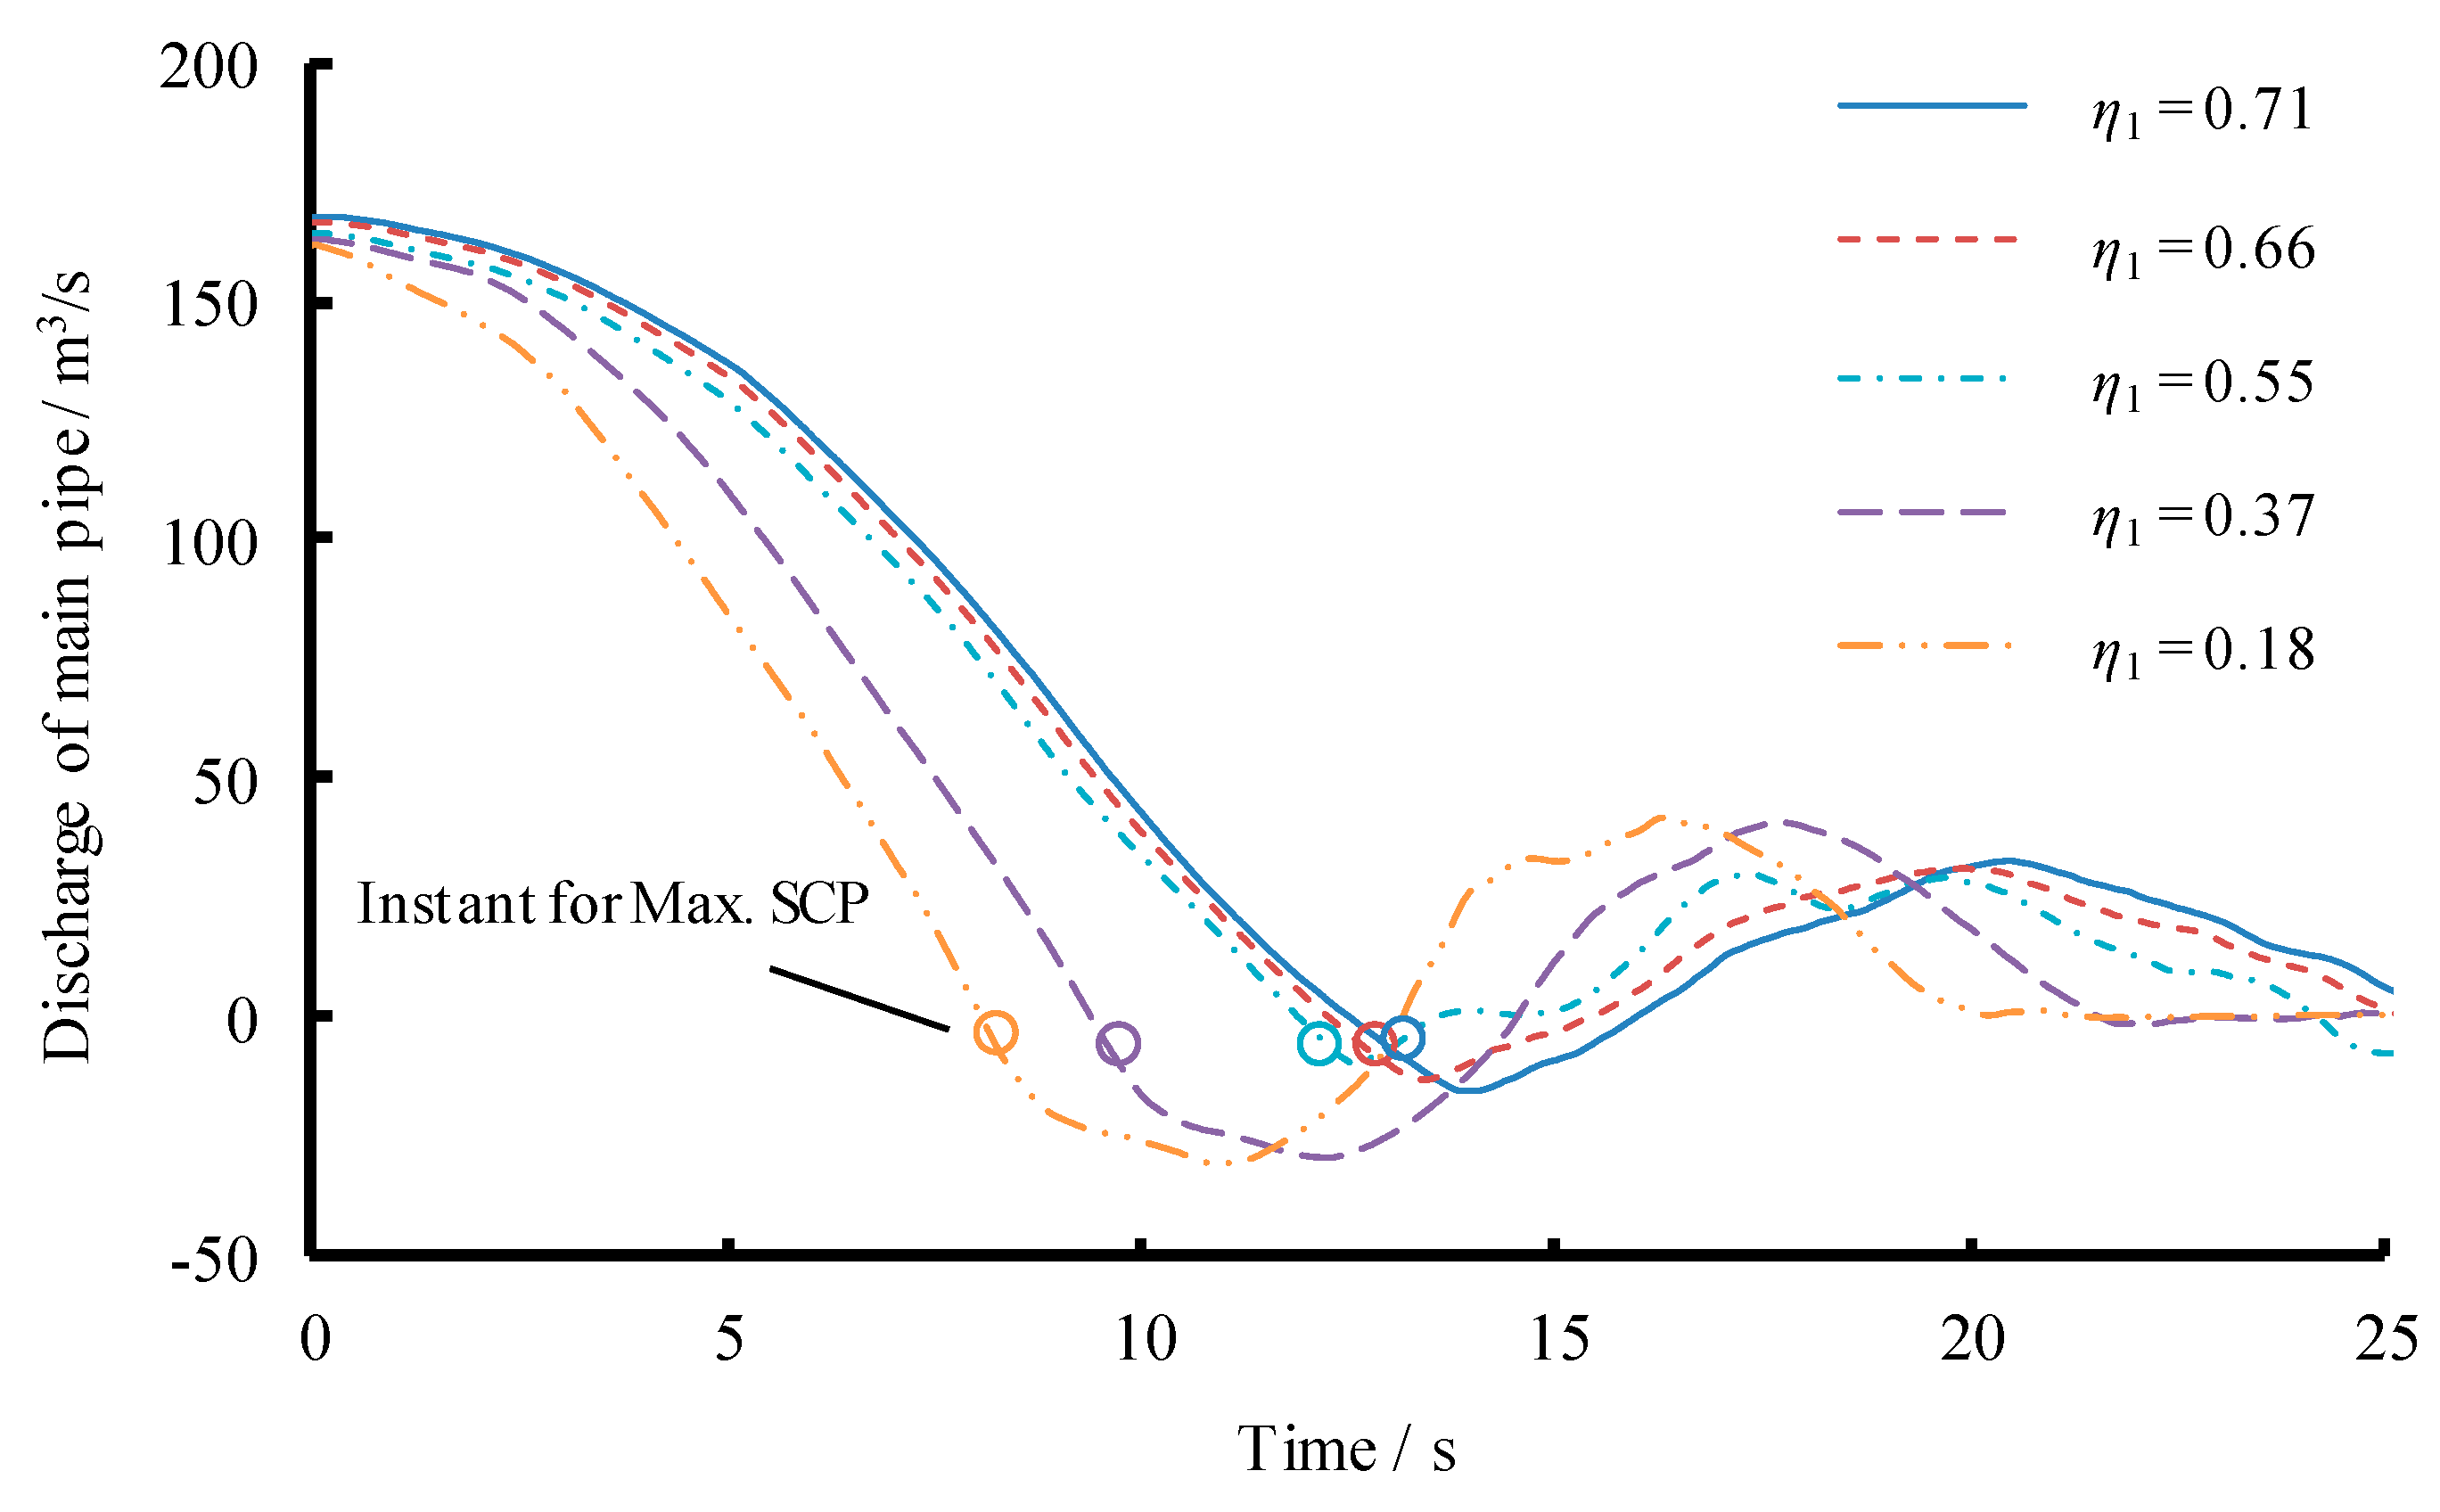
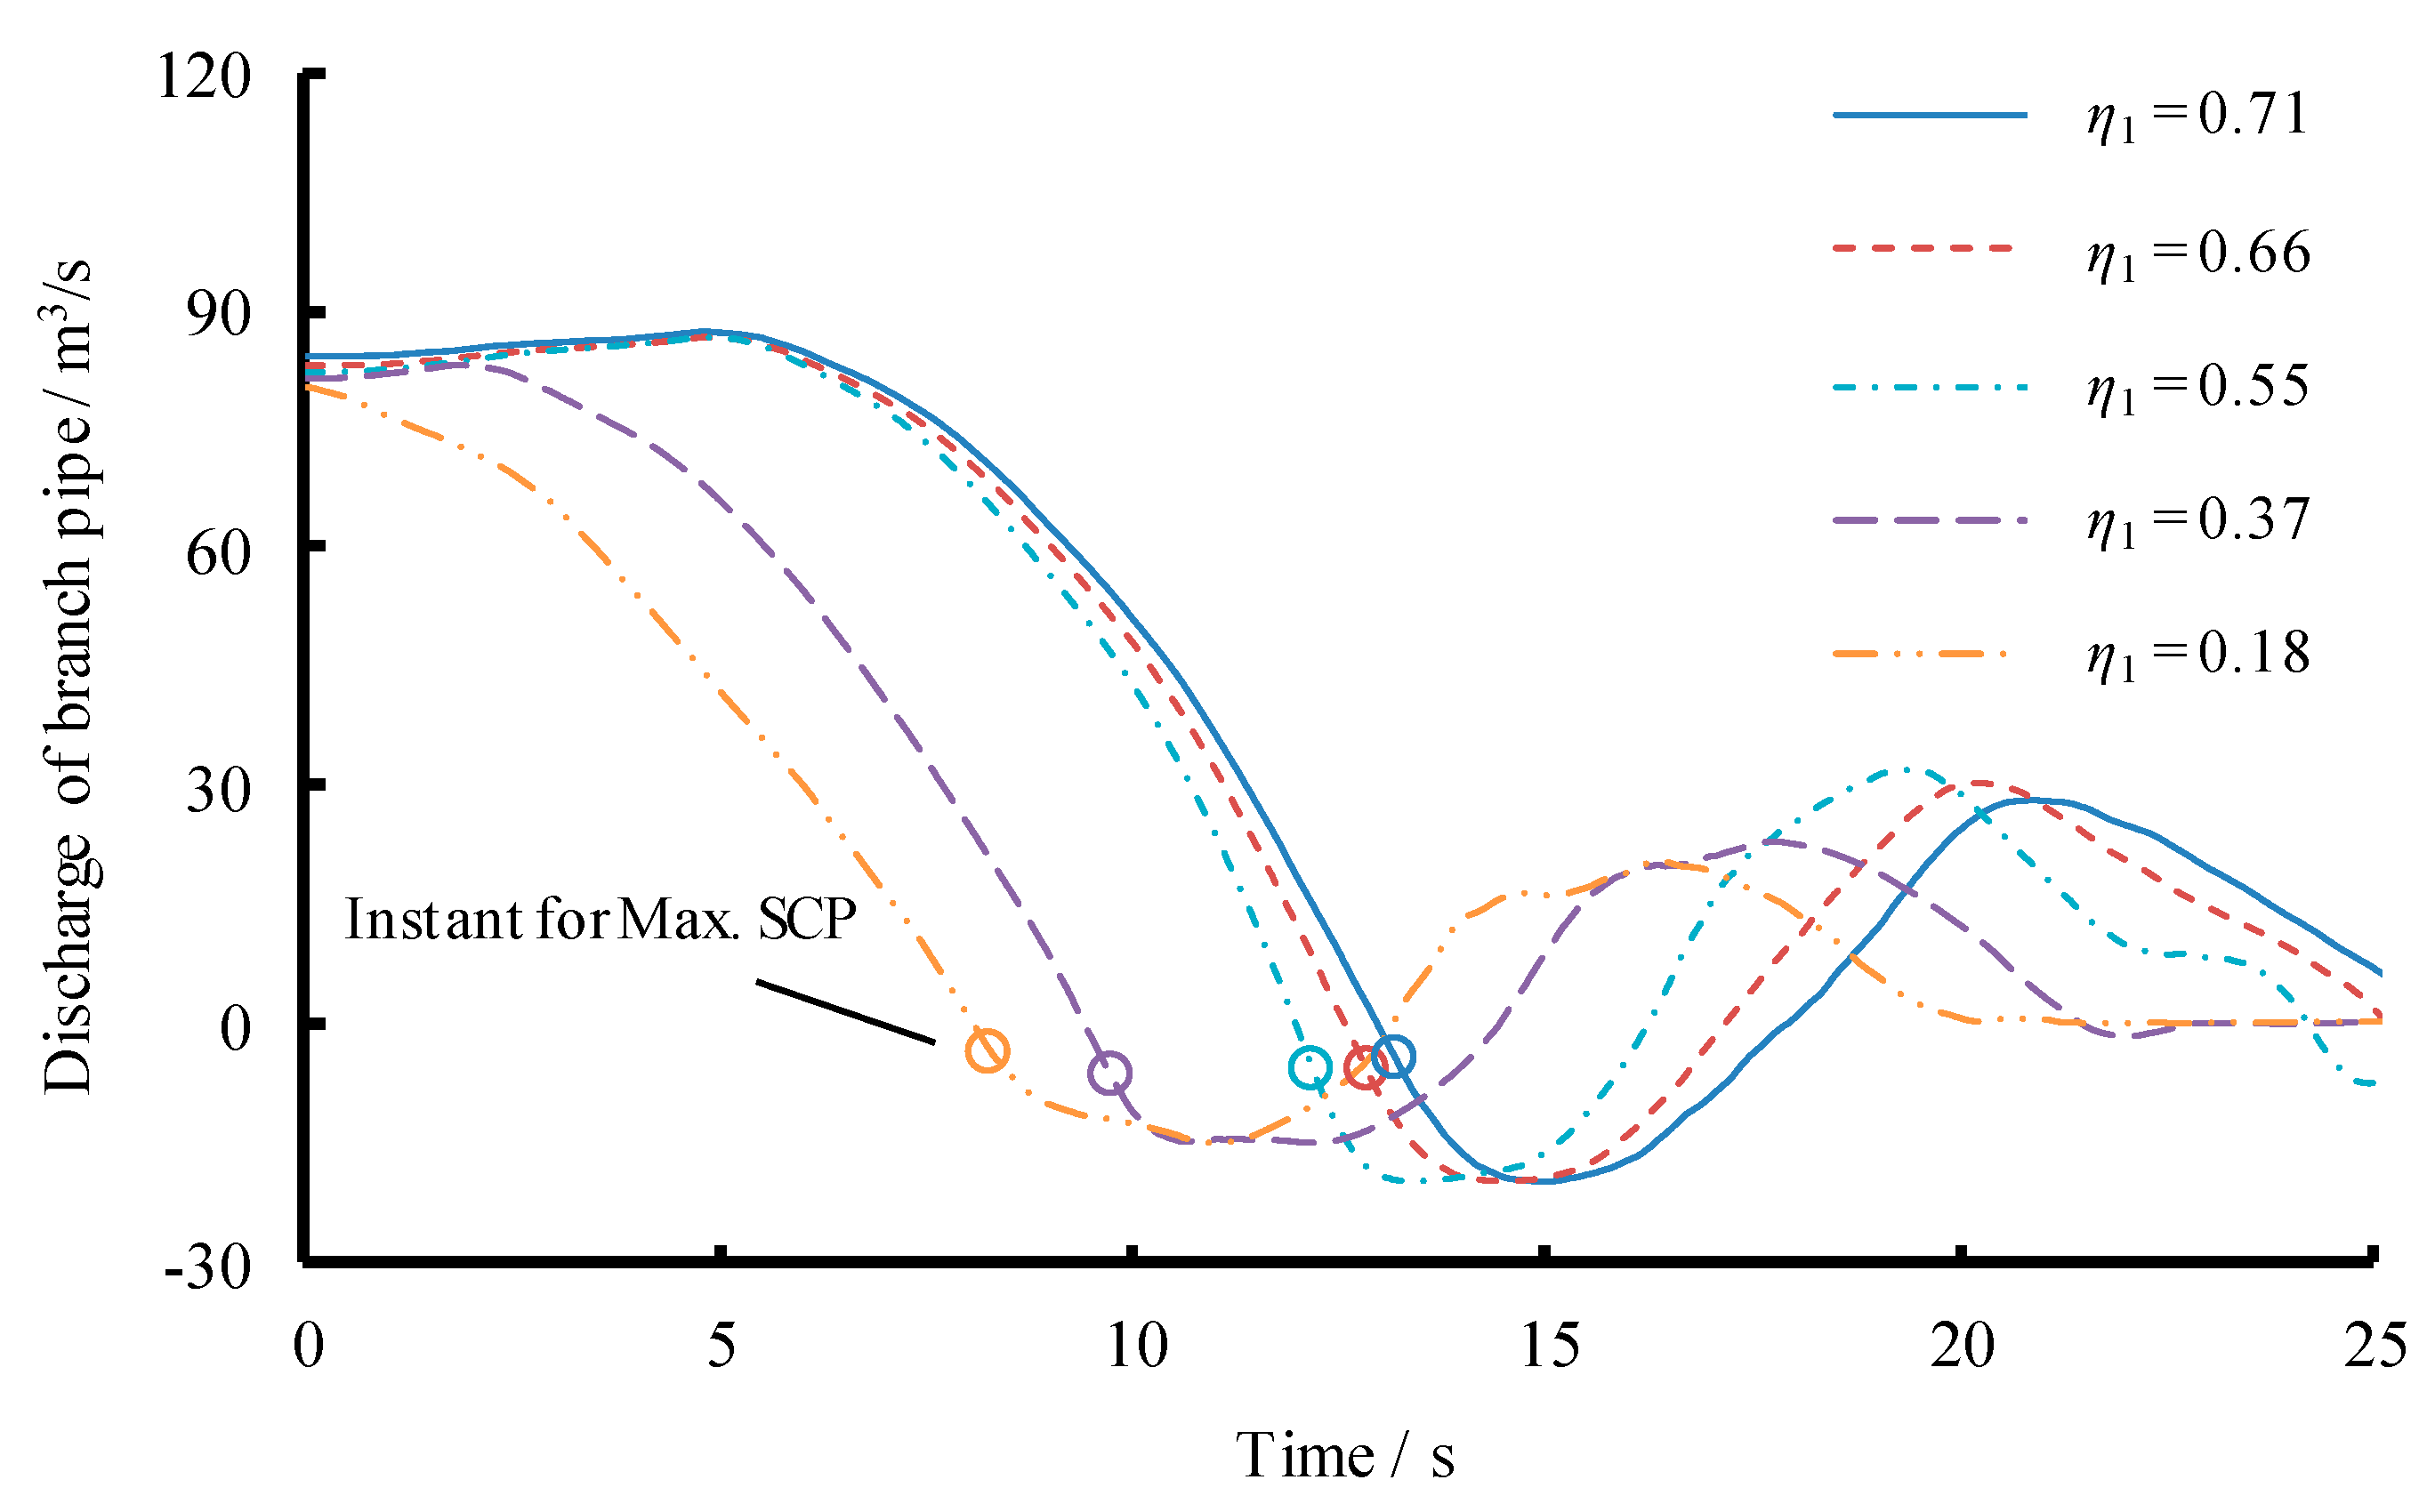
| η1 | Load Cases | Instant for Maximum SCP (s) | dQT/dt (m3/s2) | dQ2/dt (m3/s2) | Critical Load Case | |
|---|---|---|---|---|---|---|
| 0.71 | SLR | 9.3 | −27.75 | −13.66 | >0 | TLR |
| TLR | 13.2 | −16.16 | −20.08 | |||
| 0.18 | SLR | 8.3 | −32.27 | −20.71 | <0 | SLR |
| TLR | 10.9 | −22.4 | −45.69 |
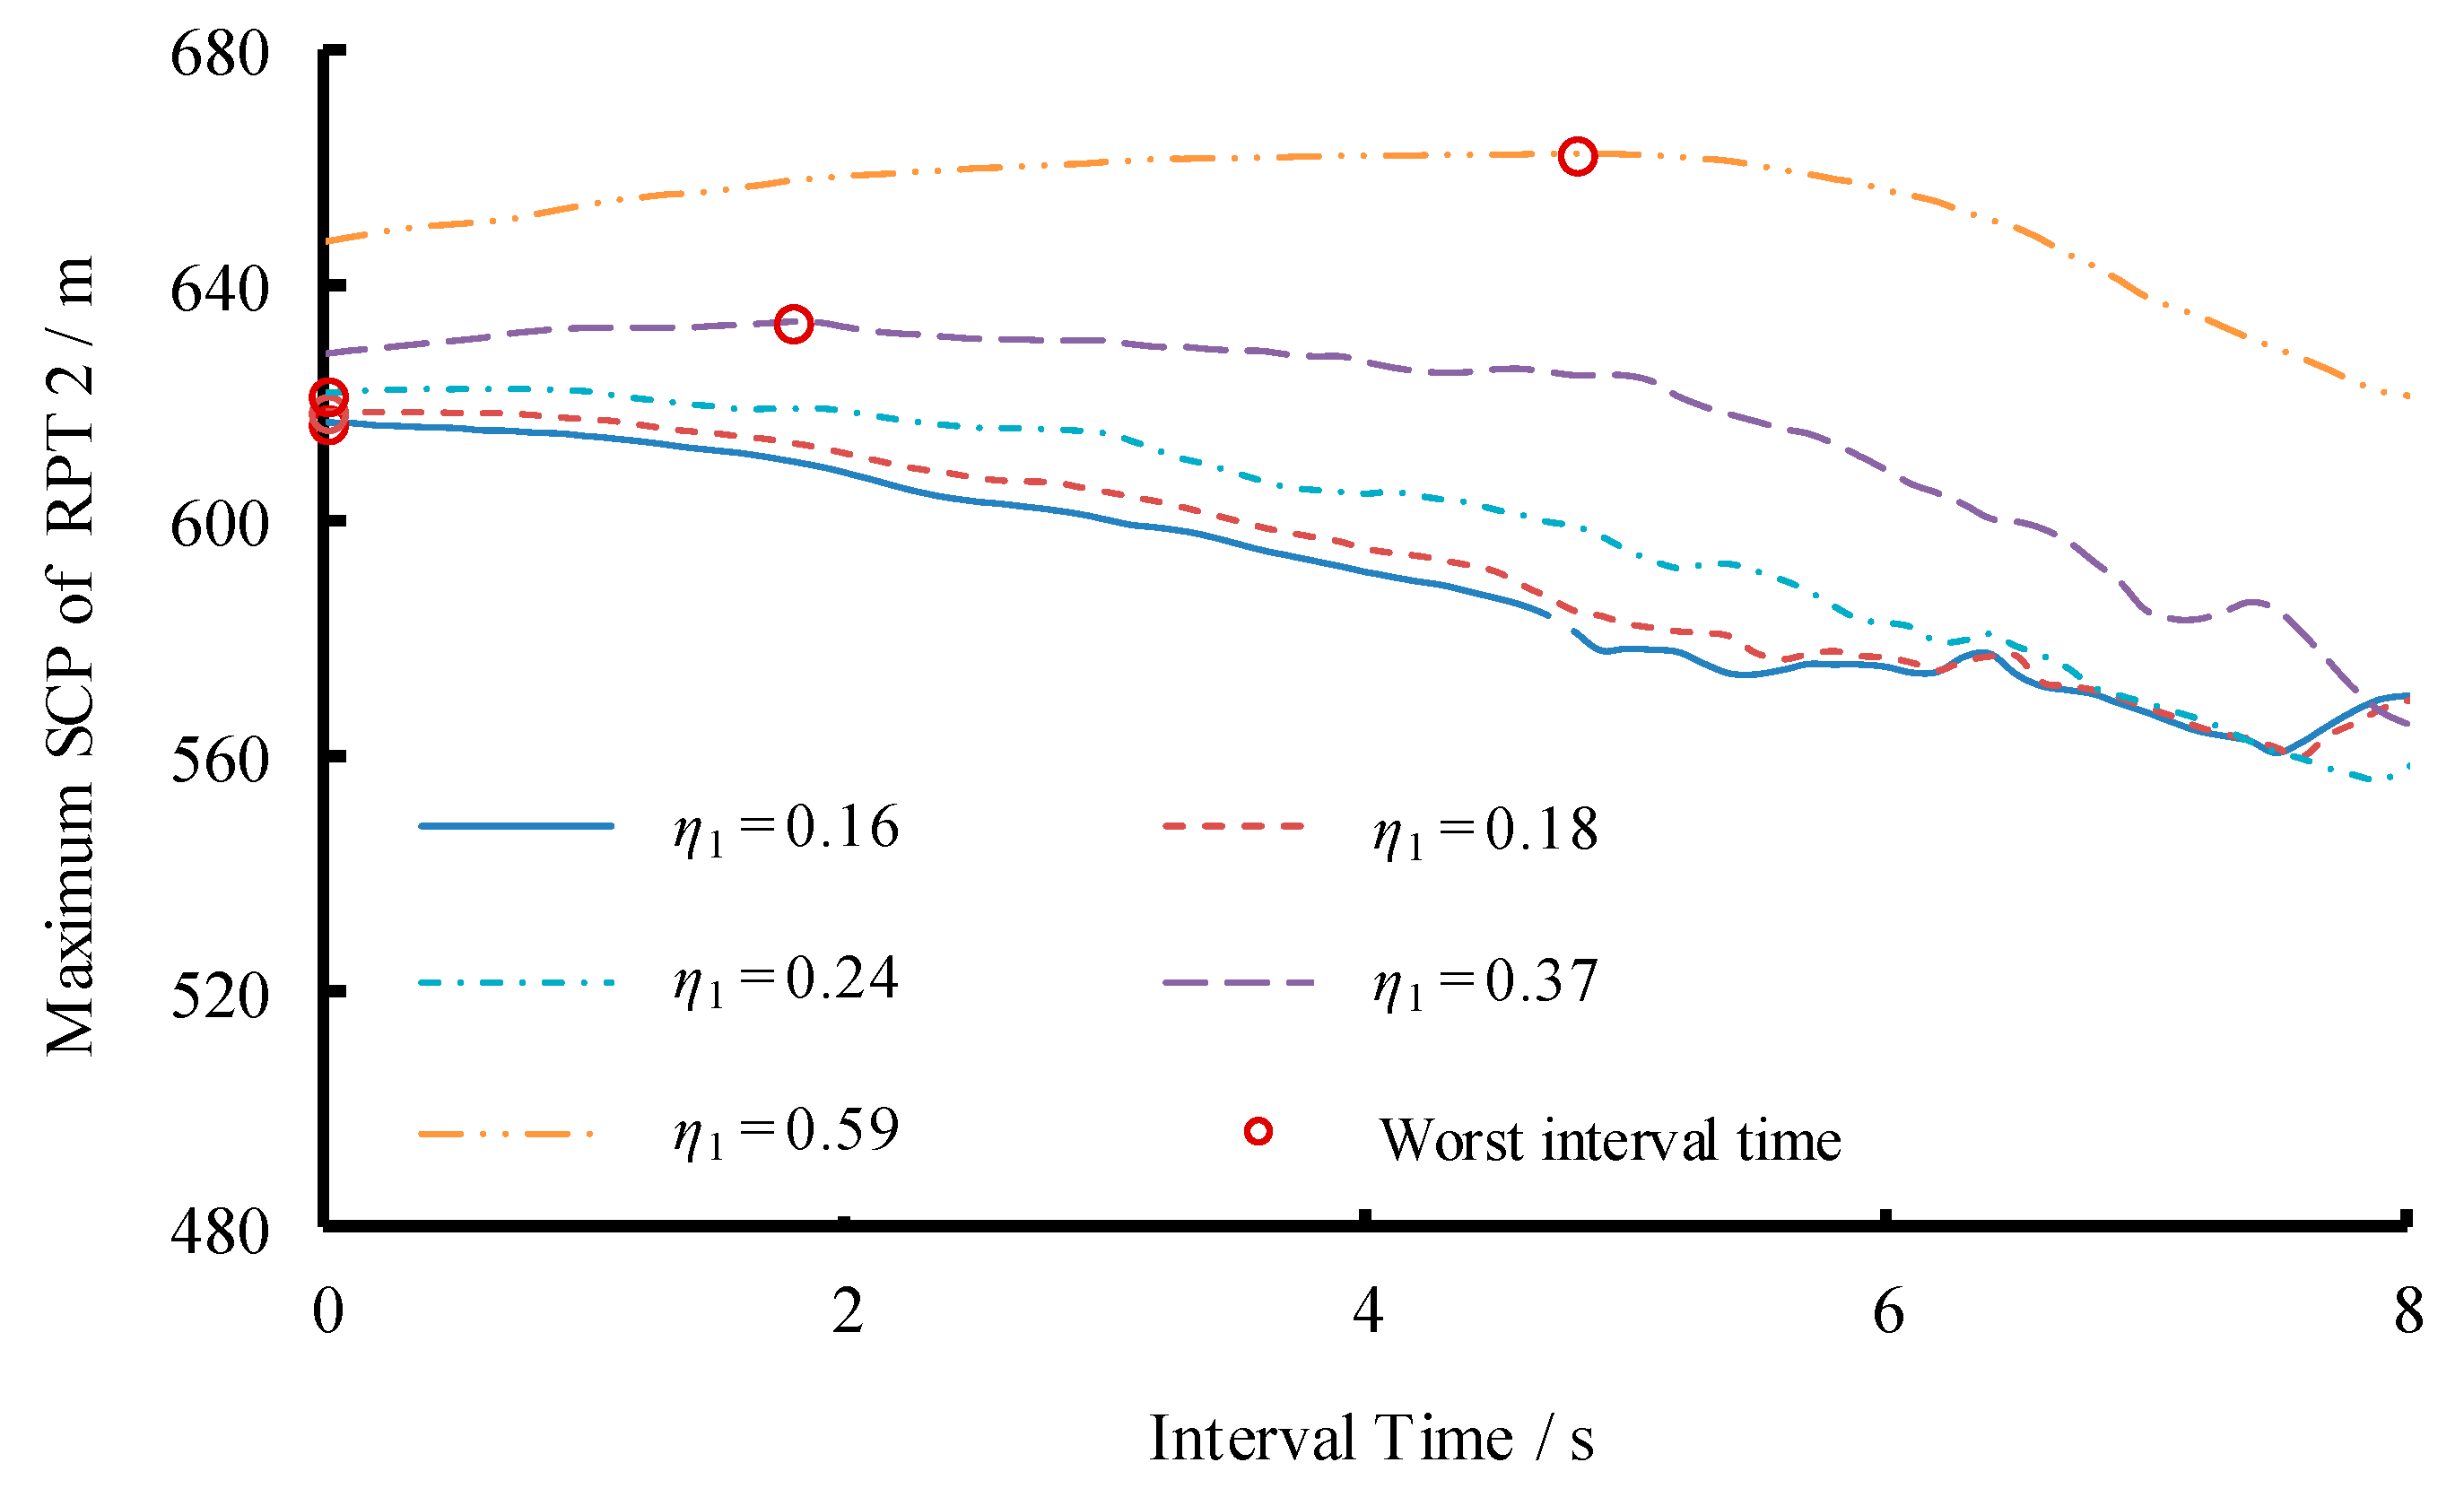
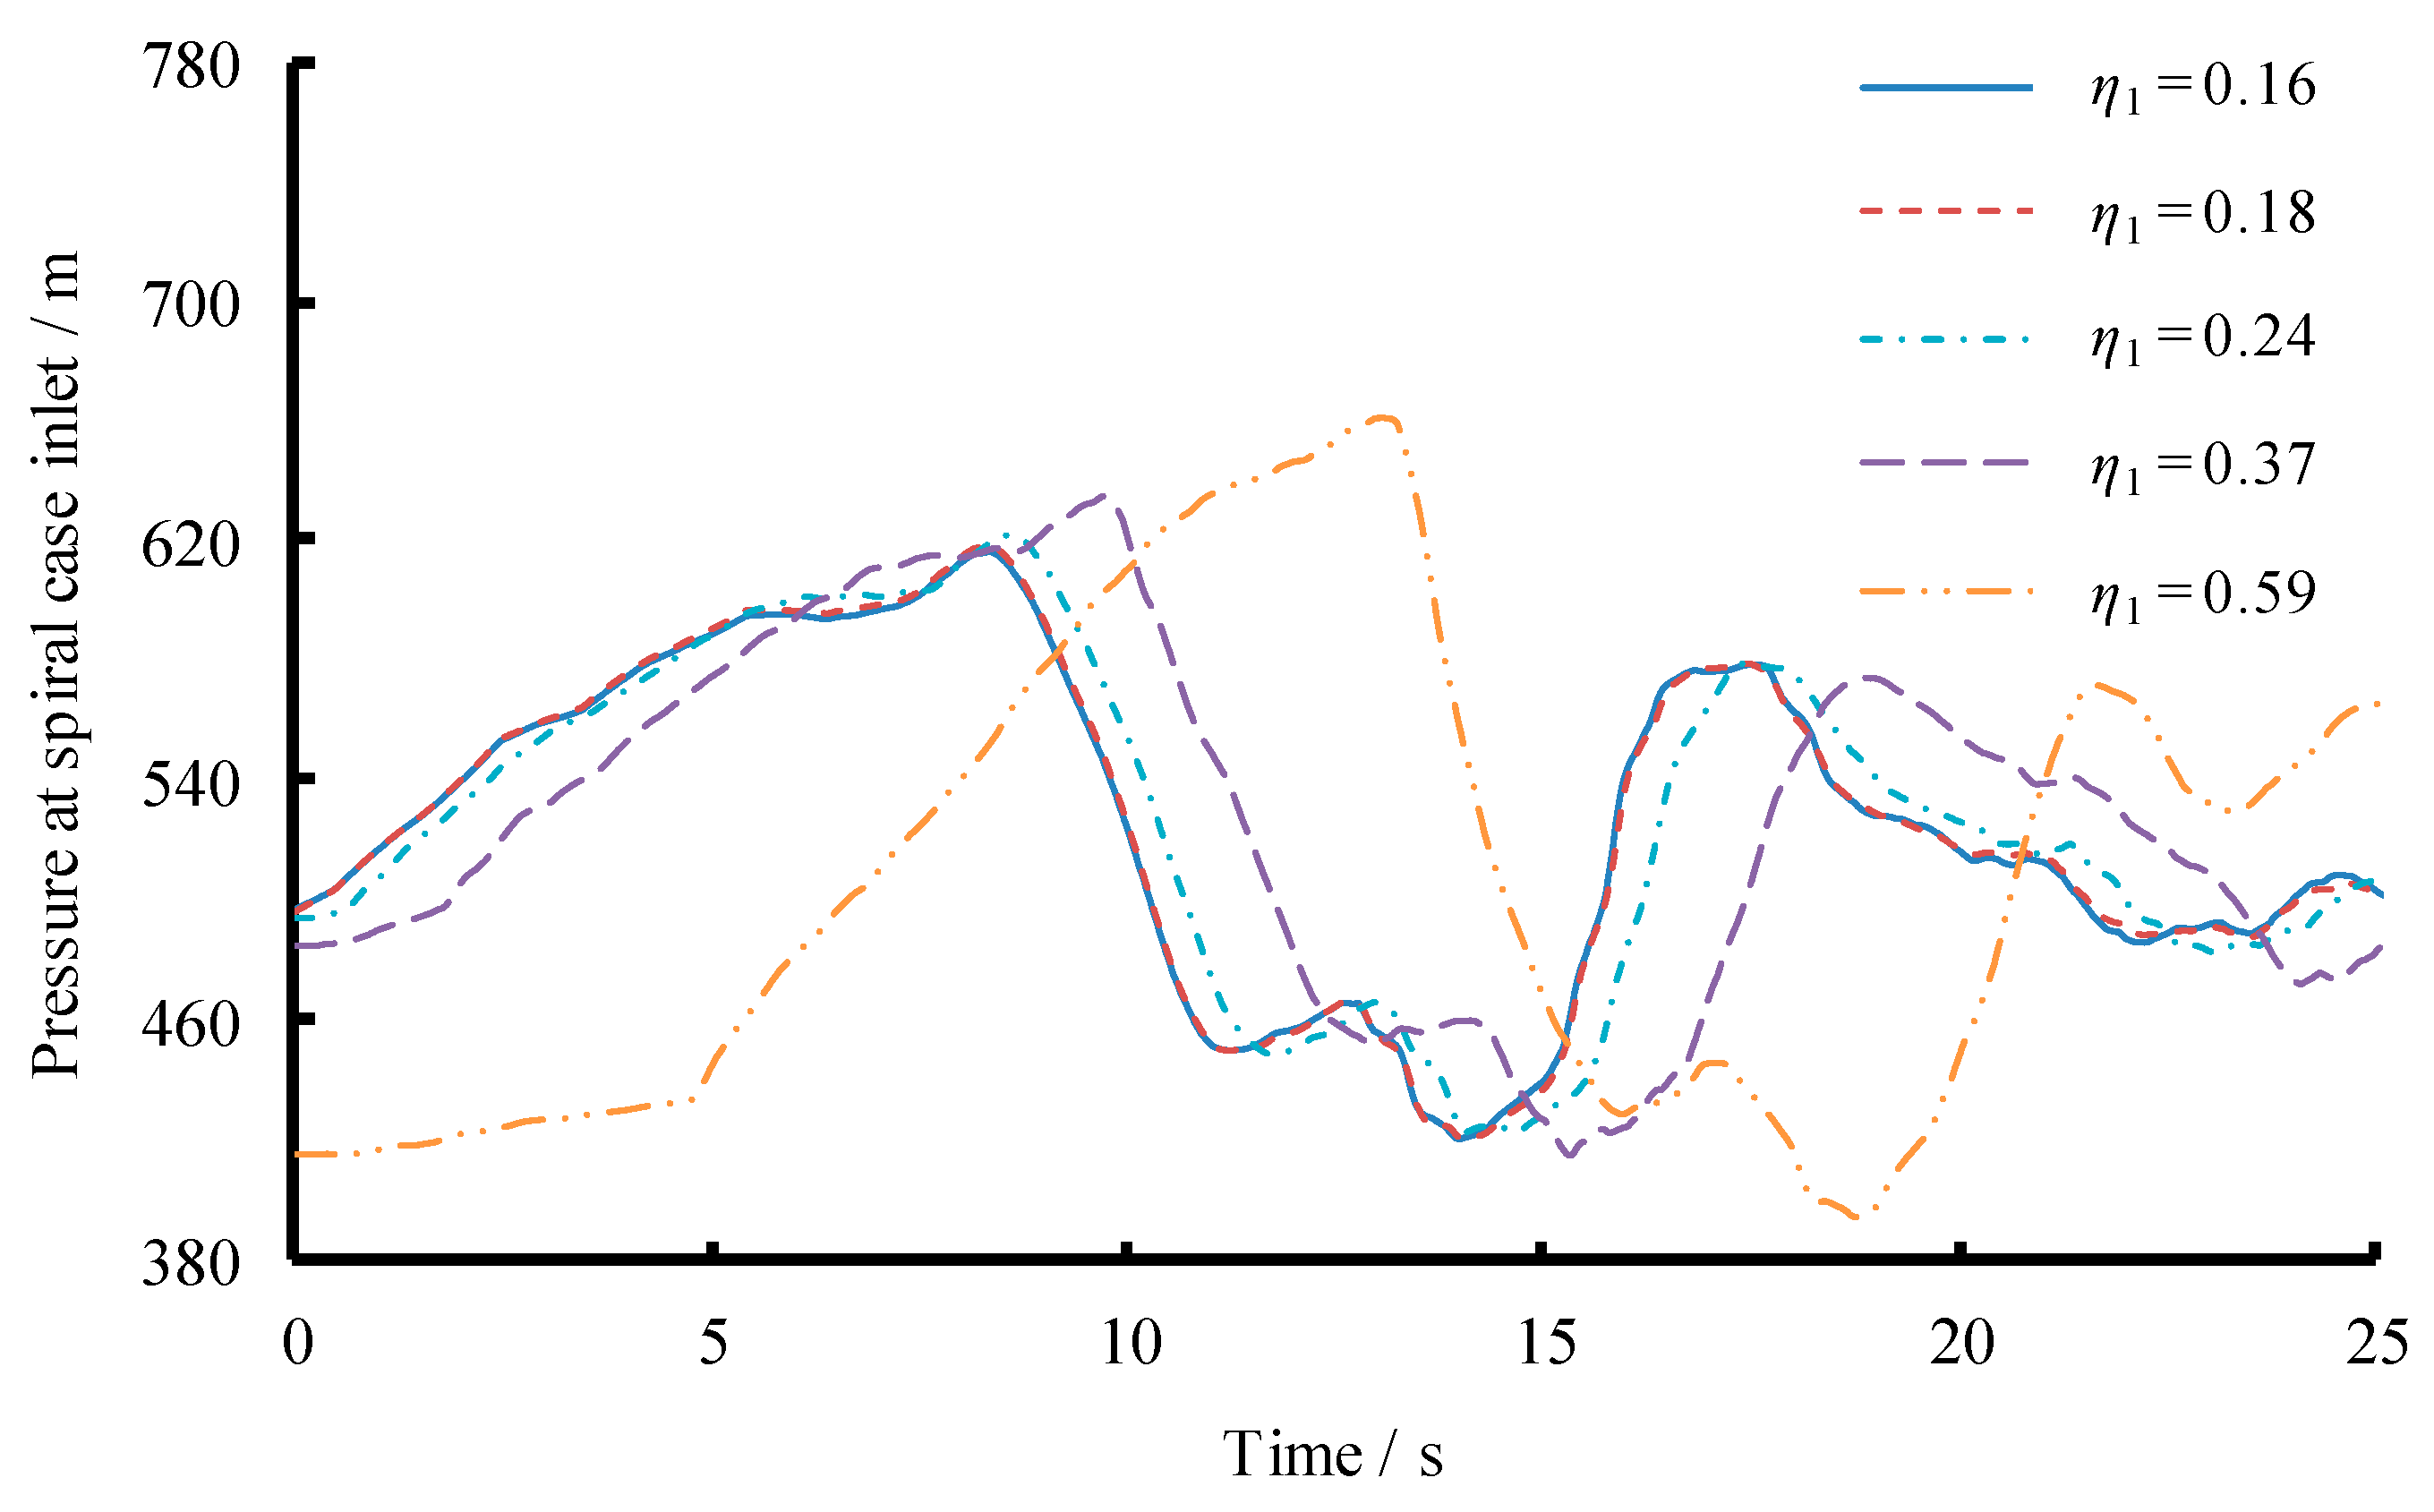
| Main Pipe | L1 (m) | 1200 | ||||
| D1 (m) | 6.8 | |||||
| f1 (m2) | 36.32 | |||||
| Twm,u (s) | 0.73 | |||||
| Branch Pipe | L3 (m) | 120.00 | ||||
| D3 (m) | 5.02 | 4.59 | 3.82 | 2.8 | 1.78 | |
| f3 (m2) | 19.79 | 16.54 | 11.47 | 6.16 | 2.48 | |
| Twb,u (s) | 0.13 | 0.16 | 0.23 | 0.43 | 1.07 | |
| Tw,u(s) η1 | 0.86 | 0.89 | 0.96 | 1.16 | 1.80 | |
| 0.16 | 0.18 | 0.24 | 0.37 | 0.59 | ||
| Max. SCP during SLR (m) | 616.88 | 618.02 | 621.17 | 628.02 | 646.92 | |
| Max. SCP during TLR (m) | 616.88 | 618.02 | 621.83 | 634.03 | 661.66 | |
| Worst Interval Time (s) | 0 | 0 | 0.6 | 1.8 | 4.8 | |
| Main Pipe. | L1 (m) | 934.26 | 997.58 | 1096.45 | 1200.00 | 1271.63 |
| D1 (m) | 6.0 | 6.2 | 6.5 | 6.8 | 7.0 | |
| f1 (m2) | 28.27 | 30.19 | 33.18 | 36.32 | 38.48 | |
| Twm,u (s) | 0.73 | |||||
| Branch Pipe | L3 (m) | 385.74 | 322.42 | 223.55 | 120.00 | 48.37 |
| D3 (m) | 5.02 | 4.59 | 3.82 | 2.8 | 1.78 | |
| f3 (m2) | 19.79 | 16.54 | 11.47 | 6.16 | 2.48 | |
| Twb,u (s) | 0.43 | |||||
| Tw,u(s) η1 | 1.16 | |||||
| 0.37 | ||||||
| Max. SCP during SLR (m) | 627.46 | 627.51 | 627.65 | 628.02 | 628.04 | |
| Max. SCP during TLR (m) | 633.55 | 633.76 | 634.10 | 634.03 | 633.94 | |
| Worst Interval Time (s) | 1.9 | 1.9 | 1.9 | 1.8 | 1.9 | |
© 2019 by the authors. Licensee MDPI, Basel, Switzerland. This article is an open access article distributed under the terms and conditions of the Creative Commons Attribution (CC BY) license (http://creativecommons.org/licenses/by/4.0/).
Share and Cite
Chen, S.; Zhang, J.; Li, G.; Yu, X. Influence Mechanism of Geometric Characteristics of Water Conveyance System on Extreme Water Hammer during Load Rejection in Pumped Storage Plants. Energies 2019, 12, 2854. https://doi.org/10.3390/en12152854
Chen S, Zhang J, Li G, Yu X. Influence Mechanism of Geometric Characteristics of Water Conveyance System on Extreme Water Hammer during Load Rejection in Pumped Storage Plants. Energies. 2019; 12(15):2854. https://doi.org/10.3390/en12152854
Chicago/Turabian StyleChen, Sheng, Jian Zhang, Gaohui Li, and Xiaodong Yu. 2019. "Influence Mechanism of Geometric Characteristics of Water Conveyance System on Extreme Water Hammer during Load Rejection in Pumped Storage Plants" Energies 12, no. 15: 2854. https://doi.org/10.3390/en12152854
APA StyleChen, S., Zhang, J., Li, G., & Yu, X. (2019). Influence Mechanism of Geometric Characteristics of Water Conveyance System on Extreme Water Hammer during Load Rejection in Pumped Storage Plants. Energies, 12(15), 2854. https://doi.org/10.3390/en12152854