
Body Composition Interactions with Physical Fitness: A Cross-Sectional Study in Youth Soccer Players

 ,
,  ,
,  ,
,  ,
, 
 ,
,  and
and 
Abstract
1. Introduction
2. Materials and Methods
2.1. Anthropometry
2.2. Vertical Jumps
2.3. Horizontal Jumps
2.4. Yo-Yo Intermittent Recovery Level 2 (YYIR2)
2.5. Statistical Procedures
3. Results
4. Discussion
5. Conclusions
Author Contributions
Funding
Institutional Review Board Statement
Informed Consent Statement
Conflicts of Interest
References
- Morris, T. Psychological characteristics and talent identification in soccer. J. Sports Sci. 2000, 18, 715–726. [Google Scholar] [CrossRef]
- Reilly, T.; Bangsbo, J.; Franks, A.L. Anthropometric and physiological predispositions for elite soccer. J. Sports Sci. 2000, 18, 669–683. [Google Scholar] [CrossRef]
- Williams, A.M.; Reilly, T. Talent identification and development in soccer. J. Sports Sci. 2000, 18, 657–667. [Google Scholar] [CrossRef]
- Gil, S.; Ruiz, F.; Irazusta, A.; Gil, J.; Irazusta, J. Selection of young soccer players in terms of anthropometric and physiological factors. J. Sports Med. Phys. Fit. 2007, 47, 25–32. [Google Scholar]
- Malina, R.M.; Reyes, M.E.P.; Eisenmann, J.C.; Horta, L.; Rodrigues, J.; Miller, R. Height, mass and skeletal maturity of elite Portuguese soccer players aged 11–16 years. J. Sports Sci. 2000, 18, 685–693. [Google Scholar] [CrossRef]
- Vaeyens, R.; Malina, R.M.; Janssens, M.; Van Renterghem, B.; Bourgois, J.; Vrijens, J.; Philippaerts, R.M.; Silva, M.J.C. A multidisciplinary selection model for youth soccer: The Ghent Youth Soccer Project. Br. J. Sports Med. 2006, 40, 928–934. [Google Scholar] [CrossRef]
- Waldron, M.; Worsfold, P. Differences in the game specific skills of elite and sub-elite youth football players: Implications for talent identification. Int. J. Perform. 2010, 10, 9–24. [Google Scholar] [CrossRef]
- Reilly, T.; Williams, A.M.; Nevill, A.; Franks, A. A multidisciplinary approach to talent identification in soccer. J. Sports Sci. 2000, 18, 695–702. [Google Scholar] [CrossRef]
- Carling, C.; Le Gall, F.; Malina, R.M. Body size, skeletal maturity, and functional characteristics of elite academy soccer players on entry between 1992 and 2003. J. Sports Sci. 2012, 30, 1683–1693. [Google Scholar] [CrossRef]
- Lloyd, R.S.; Oliver, J.L.; Radnor, J.M.; Rhodes, B.C.; Faigenbaum, A.D.; Myer, G.D. Relationships between functional movement screen scores, maturation and physical performance in young soccer players. J. Sports Sci. 2015, 33, 11–19. [Google Scholar] [CrossRef]
- Hazir, T. Physical characteristics and somatotype of soccer players according to playing level and position. J. Hum. Kinet. 2010, 26, 83–95. [Google Scholar] [CrossRef]
- Bongiovanni, T.; Trecroci, A.; Cavaggioni, L.; Rossi, A.; Perri, E.; Pasta, G.; Iaia, F.M.; Alberti, G. Importance of anthropometric features to predict physical performance in elite youth soccer: A machine learning approach. Res. Sports Med. 2021, 29, 213–224. [Google Scholar] [CrossRef] [PubMed]
- Esco, M.R.; Fedewa, M.V.; Cicone, Z.S.; Sinelnikov, O.A.; Sekulic, D.; Holmes, C.J. Field-based performance tests are related to body fat percentage and fat-free mass, but not body mass index, in youth soccer players. Sports 2018, 6, 105. [Google Scholar] [CrossRef]
- Ateş, B. Enhanced Body Composition and Physical Fitness in Prepubescent Soccer Players. Pedagog. Res. 2018, 3, 1–6. [Google Scholar] [CrossRef][Green Version]
- Rinaldo, N.; Zaccagni, L.; Gualdi-Russo, E. Soccer training programme improved the body composition of pre-adolescent boys and increased their satisfaction with their body image. Acta Paediatr. Int. J. Paediatr. 2016, 105, 492–495. [Google Scholar] [CrossRef]
- Malina, R.M. Growth and maturity status of young soccer players. In Science and Soccer, 2nd ed.; Reilly, T., Williams, A.M., Eds.; Routledge: Oxfordshire, UK, 2003; pp. 295–314. [Google Scholar] [CrossRef]
- Nikolaidis, P.T.; Karydis, N.V. Physique and body composition in soccer players across adolescence. Asian J. Sports Med. 2011, 2, 75–82. [Google Scholar] [CrossRef]
- Gall, F.L.; Beillot, J.; Rochcongar, P. Évolution de la puissance maximale anaérobie au cours de la croissance chez le footballeur. Sci. Sports 2002, 1597, 177–188. [Google Scholar] [CrossRef]
- Manna, I.; Khanna, G.L.; Dhara, P.C. Effect of training on physiological and biochemical variables of soccer players of different age groups. Asian J. Sports Med. 2010, 1, 5. [Google Scholar] [CrossRef]
- Krustrup, P.; Mohr, M.; Steensberg, A.; Bencke, J.; Kjær, M.; Bangsbo, J. Muscle and blood metabolites during a soccer game: Implications for sprint performance. Med. Sci. Sports Exerc. 2006, 38, 1165–1174. [Google Scholar] [CrossRef]
- McInnes, S.E.; Carlson, J.S.; Jones, C.J.; McKenna, M.J. The physiological load imposed on basketball players during competition. J. Sports Sci. 1995, 1, 387–397. [Google Scholar] [CrossRef]
- Mohr, M.; Krustrup, P.; Bangsbo, J. Match performance of high-standard soccer players with special reference to development of fatigue. J. Sports Sci. 2003, 21, 519–528. [Google Scholar] [CrossRef] [PubMed]
- Fiorilli, G.; Mitrotasios, M.; Iuliano, E.; Pistone, E.M.; Aquino, G.; Calcagno, G. Agility and change of direction in soccer: Differences according to the player ages. J. Sports Med. Phys. Fit. 2016, 57, 1597–1604. [Google Scholar] [CrossRef] [PubMed]
- Vänttinen, T.; Blomqvist, M.; Nyman, K.; Häkkinen, K. Changes in body composition, hormonal status, and physical fitness in 11-, 13-, and 15-year-old Finnish regional youth soccer players during a two-year follow-up. J. Strength Cond. Res. 2011, 25, 3342–3351. [Google Scholar] [CrossRef]
- Gravina, L.; Gil, S.M.; Ruiz, F.; Zubero, J.; Gil, J.; Irazusta, J. Anthropometric and physiological differences between first team and reserve soccer players aged 10–14 years at the beginning and end of the season. J. Strength Cond. Res. 2008, 22, 1308–1314. [Google Scholar] [CrossRef] [PubMed]
- Norton, K.I. Standards for anthropometry assessment. In Kinanthropometry and Exercise Physiology, 4th ed.; Norton, K., Eston, R.G., Eds.; Routledge: Oxfordshire, UK, 2019; pp. 68–137. [Google Scholar]
- Slaughter, M.; Lohman, T.; Boileau, R.; Horswill, C.; Stillman, R.; van Loan, M.; Bemben, D. Skinfold Equations for Estimation of Body Fatness in Children. Hum. Biol. 1988, 60, 709–723. [Google Scholar] [PubMed]
- Poortmans, J.R.; Boisseau, N.; Moraine, J.; Moreno-reyes, R.; Goldman, S. Estimation of Total-Body Skeletal Muscle Mass in Children and Adolescents. Med. Sci. Sports Exerc. 2005, 37, 316–322. [Google Scholar] [CrossRef]
- Bangsbo, J.; Iaia, F.M.; Krustrup, P. The Yo-Yo Intermittent Recovery Test. Sports Med. 2008, 38, 37–51. [Google Scholar] [CrossRef]
- Batterham, A.M.; Hopkins, W.G. Making meaningful inferences about magnitudes. Int. J. Perform. 2006, 1, 50–57. [Google Scholar] [CrossRef]
- Lago-Peñas, C.; Rey, E.; Casáis, L.; Gómez-López, M. Relationship between performance characteristics and the selection Process in youth soccer players. J. Hum. Kinet. 2014, 40, 189–199. [Google Scholar] [CrossRef]
- Wittich, A.; Oliveri, M.B.; Rotemberg, E.; Mautalen, C. Body composition of professional football (soccer) players determined by dual X-ray absorptiometry. J. Clin. Densitom. 2001, 4, 51–55. [Google Scholar] [CrossRef]
- Deprez, D.N.; Fransen, J.; Lenoir, M.; Philippaerts, R.M.; Vaeyens, R. A retrospective study on anthropometrical, physical fitness, and motor coordination characteristics that influence dropout, contract status, and first-team playing time in high-level soccer players aged eight to eighteen years. J. Strength Cond. Res. 2015, 29, 1692–1704. [Google Scholar] [CrossRef] [PubMed]
- le Gall, F.; Carling, C.; Williams, M.; Reilly, T. Anthropometric and fitness characteristics of international, professional and amateur male graduate soccer players from an elite youth academy. J. Sci. Med. Sport 2010, 13, 90–95. [Google Scholar] [CrossRef] [PubMed]
- Vanderford, M.L.; Meyers, M.C.; Skelly, W.A.; Stewart, C.C.; Hamilton, K.L. Physiological and sport-specific skill response of Olympic youth soccer athletes. J. Strength Cond. Res. 2004, 18, 334–342. [Google Scholar] [CrossRef]
- Hannon, M.P.; Carney, D.J.; Floyd, S.; Parker, L.J.F.; McKeown, J.; Drust, B.; Unnithan, V.B.; Close, G.L.; Morton, J.P. Cross-sectional comparison of body composition and resting metabolic rate in Premier League academy soccer players: Implications for growth and maturation. J. Sports Sci. 2020, 38, 1326–1334. [Google Scholar] [CrossRef] [PubMed]
- Mendez-Villanueva, A.; Buchheit, M.; Kuitunen, S.; Douglas, A.; Peltola, E.; Bourdon, P.C. Age-related differences in acceleration, maximum running speed, and repeated-sprint performance in young soccer players. J. Sports Sci. 2011, 29, 477–484. [Google Scholar] [CrossRef] [PubMed]
- Di Salvo, V.; Baron, R.; Tschan, H.; Calderon Montero, F.J.; Bachl, N.; Pigozzi, F. Performance characteristics according to playing position in elite soccer. Int. J. Sports Med. 2007, 28, 222–227. [Google Scholar] [CrossRef] [PubMed]
- Leão, C.; Camões, M.; Clemente, F.M.; Nikolaidis, P.T.; Lima, R.; Bezerra, P.; Rosemann, T.; Knechtle, B. Anthropometric profile of soccer players as a determinant of position specificity and methodological issues of body composition estimation. Int. J. Environ. Res. Public Health 2019, 16, 2386. [Google Scholar] [CrossRef]
- Milsom, J.; Naughton, R.; O’Boyle, A.; Iqbal, Z.; Morgans, R.; Drust, B.; Morton, J.P. Body composition assessment of English Premier League soccer players: A comparative DXA analysis of first team, U21 and U18 squads. J. Sports Sci. 2015, 33, 1799–1806. [Google Scholar] [CrossRef]
- Árnason, Á.; Sigurdsson, S.B.; Gudmundsson, A.; Holme, I.; Engebretsen, L.; Bahr, R. Physical fitness, injuries, and team performance in soccer. Med. Sci. Sports Exerc. 2004, 36, 278–285. [Google Scholar] [CrossRef]
- Silvestre, R.; West, C.; Maresh, C.M.; Kraemer, W.J. Body composition and physical performance in men’s soccer: A Study of a National Collegiate Athletic Association Division I team. J. Strength Cond. 2006, 20, 177–183. [Google Scholar] [CrossRef]
- Tahara, Y.; Moji, K.; Tsunawake, N.; Fukuda, R.; Nakayama, M.; Nakagaichi, M.; Komine, T.; Kusano, Y.; Aoyagi, K. Physique, body composition and maximum oxygen consumption of selected soccer players of Kunimi High School, Nagasaki, Japan. J. Physiol. Anthropol. 2006, 25, 291–297. [Google Scholar] [CrossRef] [PubMed][Green Version]
- Gil, S.M.; Gil, J.; Ruiz, F.; Irazusta, A.; Irazusta, J. Physiological and Anthropometric characteristics of young soccer players according to their playing position: Relevance for the selection process. J. Strength Cond. Res. 2007, 21, 438–445. [Google Scholar] [CrossRef] [PubMed]
- Rebelo, A.; Brito, J.; Maia, J.; Coelho-E-Silva, M.J.; Figueiredo, A.J.; Bangsbo, J.; Malina, R.M.; Seabra, A. Anthropometric characteristics, physical fitness and technical performance of under-19 soccer players by competitive level and field position. Int. J. Sports Med. 2013, 34, 312–317. [Google Scholar] [CrossRef]
- Abdullah, M.R.; Musa, R.M.; Maliki, A.B.H.M.; Suppiah, P.K.; Kosni, N.A. Relationship of physical characteristics, mastery and readiness to perform with position of elite soccer players. Int. J. Adv. Eng. Res. Stud. 2016, 1, 8–11. [Google Scholar]
- Sutton, L.; Scott, M.; Wallace, J.; Reilly, T. Body composition of English Premier League soccer players: Influence of playing position, international status, and ethnicity. J. Sports Sci. 2009, 27, 1019–1026. [Google Scholar] [CrossRef] [PubMed]
- Sporis, G.; Jukic, I.; Ostojic, S.M.; Milanovic, D. Fitness profiling in soccer: Physical and physiologic characteristics of elite players. J. Strength Cond. Res. 2009, 23, 1947–1953. [Google Scholar] [CrossRef]
- Carling, C.; Orhant, E. Variation in body composition in professional soccer players: Interseasonal and intraseasonal changes and the effects of exposure time and player position. J. Strength Cond. Res. 2010, 24, 1332–1339. [Google Scholar] [CrossRef]
- Hogstrom, G.; Pietila, T.; Nordstrom, P.; Nordstrom, A. Body composition and performance: Influence of sport and gender among adolescents. J. Strength Cond. Res. 2012, 26, 1799–1804. [Google Scholar] [CrossRef]
- Nikolaidis, P.T.; Ruano, M.G.; De Oliveira, N.C.; Portes, L.A.; Freiwald, J.; Leprêtre, P.M.; Knechtle, B. Who runs the fastest? Anthropometric and physiological correlates of 20 m sprint performance in male soccer players. Res. Sports Med. 2016, 24, 341–351. [Google Scholar] [CrossRef]
- Toselli, S.; Campa, F.; Maietta Latessa, P.; Greco, G.; Loi, A.; Grigoletto, A.; Zaccagni, L. Differences in maturity and anthropometric and morphological characteristics among young male basketball and soccer players and non-players. Int. J. Environ. Res. Public Health 2021, 18, 3902. [Google Scholar] [CrossRef]
- Toselli, S.; Campa, F. Anthropometry and functional movement patterns in elite male volleyball players of different competitive levels. J. Strength Cond. Res. 2018, 32, 2601–2611. [Google Scholar] [CrossRef] [PubMed]
- Radzimiński, Ł.; Szwarc, A.; Padrón-Cabo, A.; Jastrzębski, Z. Correlations between body composition, aerobic capacity, speed and distance covered among professional soccer players during official matches. J. Sports Med. Phys. Fit. 2020, 60, 257–262. [Google Scholar] [CrossRef] [PubMed]
- Copic, N.; Dopsaj, M.; Ivanovic, J.; Nesic, G.; Jaric, S. Body composition and muscle strength predictors of jumping performance: Differences between elite female volleyball competitors and nontrained individuals. J. Strength Cond. Res. 2014, 28, 2709–2716. [Google Scholar] [CrossRef] [PubMed]
- Malina, R.M. Body composition in athletes: Assessment and estimated fatness. Clin. Sports Med. 2007, 26, 37–68. [Google Scholar] [CrossRef]
- Greco, G.; Messina, G.; Angiulli, A.; Patti, A.; Iovane, A.; Fischetti, F. A preliminary comparative study on the effects of pilates training on physical fitness of young female volleyball players. Acta Med. Mediterr. 2019, 35, 783–789. [Google Scholar] [CrossRef]
- Fischetti, F.; Cataldi, S.; Greco, G. Lower-limb plyometric training improves vertical jump and agility abilities in adult female soccer players. J. Phys. Educ. Sport. 2019, 19, 1254–1261. [Google Scholar] [CrossRef]
- Wong, P.L.; Chamari, K.; Dellal, A.; Wisloff, U. Relationship between anthropometric and physiological Characteristics in youth soccer players. J. Strength Cond. Res. 2009, 23, 1204–1210. [Google Scholar] [CrossRef]
- Akdoğan, E.; Olgun, S. Relationship between body composition, Yo-Yo intermittent recovery test and vertical jump test in elite young soccer players. Turk. J. Sports Med. 2021, 56, 186–191. [Google Scholar] [CrossRef]
- Pérez-Contreras, J.; Merino-Muñoz, P.; Aedo-Muñoz, E. Vínculo entre composición corporal, sprint y salto vertical en futbolistas jóvenes de élite de Chile. MHSalud Rev. Cienc. Mov. Hum. Salud 2021, 18, 1–17. [Google Scholar] [CrossRef]
- Gameiro, P.; Familia, C.; Granja, S.; Caetano, C.; Ferreira, D.; Godinho, C. Relationship between body composition, sprint performance and vertical jump tests in young elite soccer players. Ann. Med. 2018, 18, S168–S169. [Google Scholar]
- Atakan, M.M.; Unver, E.; Demirci, N. Effect of body composition on fitness performance in young male football players. Turk. J. Sports Med. 2017, 19, 54–59. [Google Scholar]
- Mathisen, G.; Pettersen, S.A. Anthropometric factors related to sprint and agility performance in young male soccer players. Open Access J. Sports Med. 2015, 6, 337–342. [Google Scholar] [CrossRef] [PubMed]


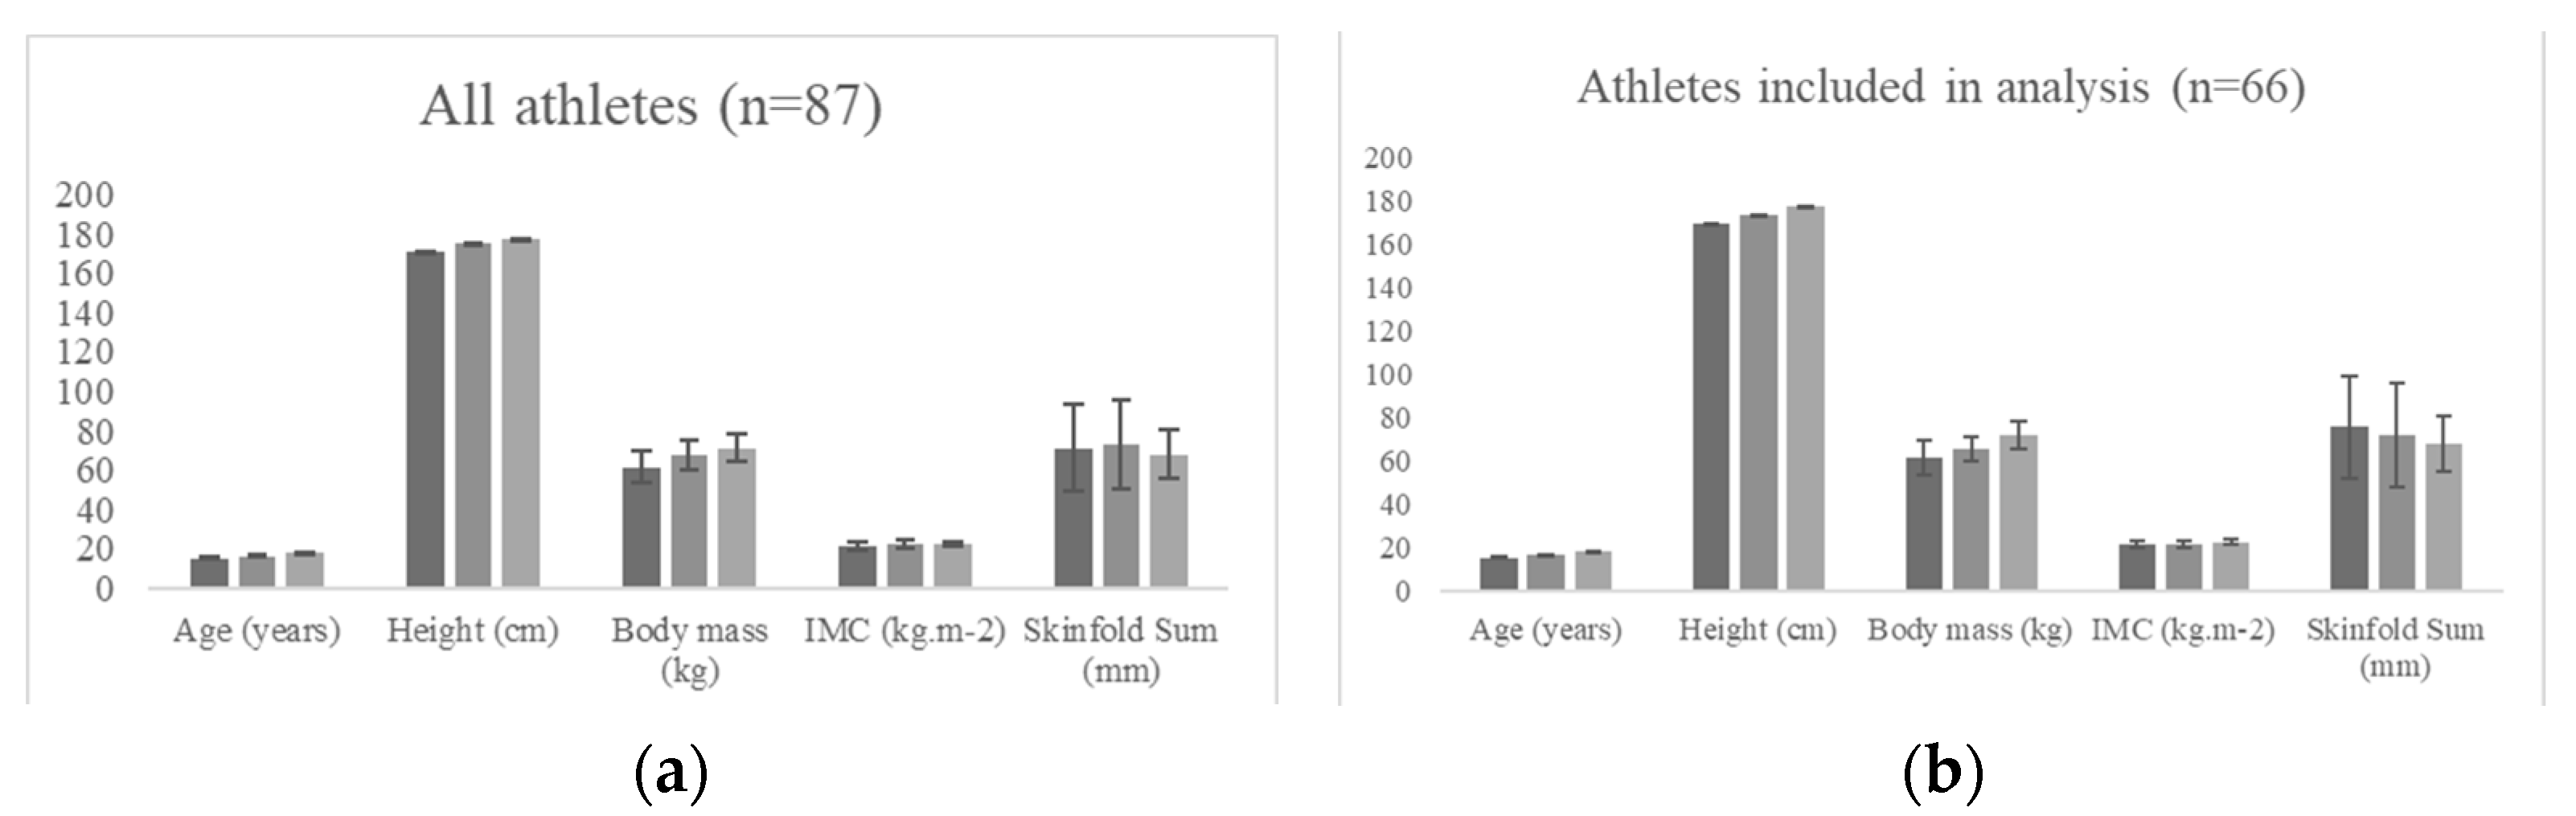
| Under-16 (n = 21) | Under-17 (n = 18) | Under-19 (n = 26) | p | Effect Size | |
|---|---|---|---|---|---|
| Height (cm) | 169.8 ± 6.1 | 174.6 ± 4.6 | 178.5 ± 7.0 | <0.001 ** | 0.271 |
| BM (kg) | 61.6 ± 8.0 | 66.0 ± 5.7 | 71.6 ± 6.3 | <0.001 ** | 0.297 |
| BMI (kg/m2) | 21.3 ± 1.9 | 21.7 ± 1.7 | 22.5 ± 1.4 | 0.044 * | 0.096 |
| Skinfolds (mm) | 75.8 ± 23.8 | 73.4 ± 24.2 | 67.7 ± 13.0 | 0.380 | 0.031 |
| Fat mass (%) | 13.2 ± 3.9 | 12.6 ± 3.2 | 12.0 ± 2.5 | 0.431 | 0.027 |
| Muscle mass (kg) | 24.5 ± 3.4 | 26.4 ± 2.9 | 29.7 ± 2.2 | <0.001 ** | 0.401 |
| CMJ (cm) | 30.8 ± 3.6 | 34.9 ± 3.1 | 40.2 ± 4.9 | <0.001 ** | 0.507 |
| TH bilateral (m) | 6.3 ± 0.5 | 6.9 ± 0.4 | 7.4 ± 0.4 | <0.001 ** | 0.540 |
| TH right leg (m) | 6.0 ± 0.5 | 6.1 ± 0.5 | 6.7 ± 0.4 | <0.001 ** | 0.395 |
| TH left leg (m) | 6.0 ± 0.5 | 6.2 ± 0.4 | 6.7 ± 0.6 | <0.001 ** | 0.272 |
| YYIRT (m) | 266.7 ± 98.3 | 391.1 ± 72.0 | 490.8 ± 158.6 | <0.001 ** | 0.391 |
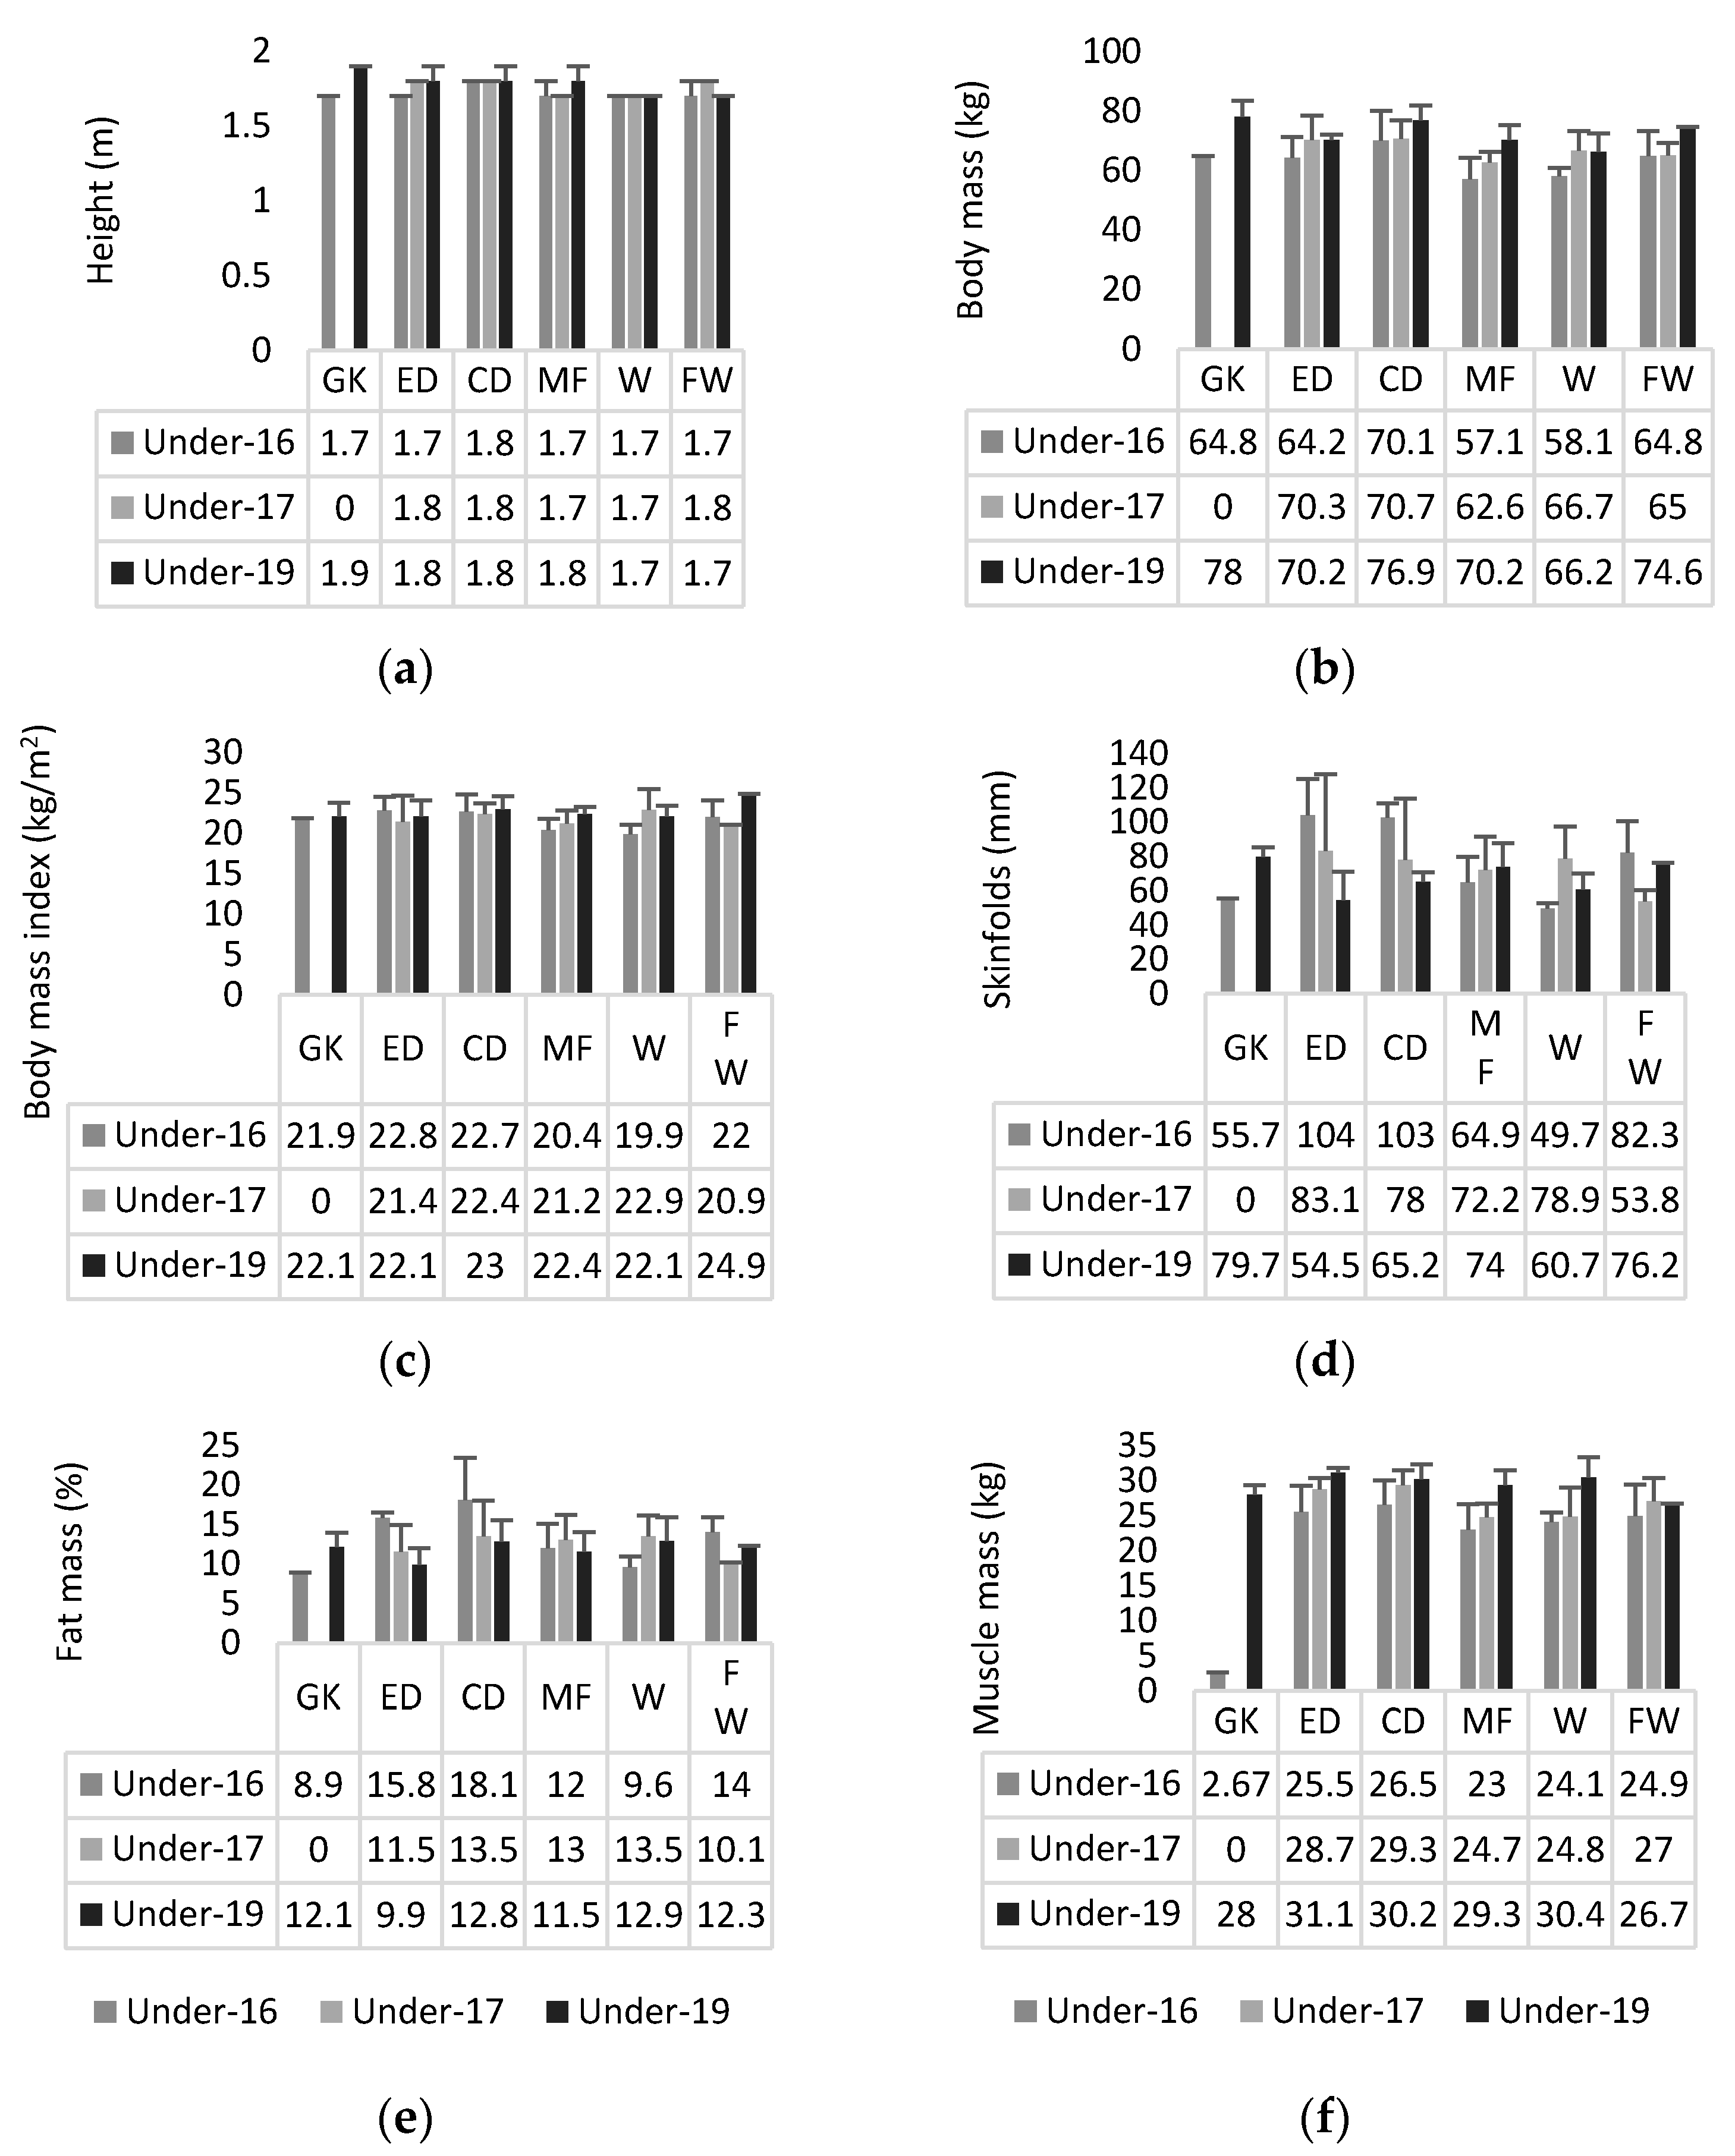
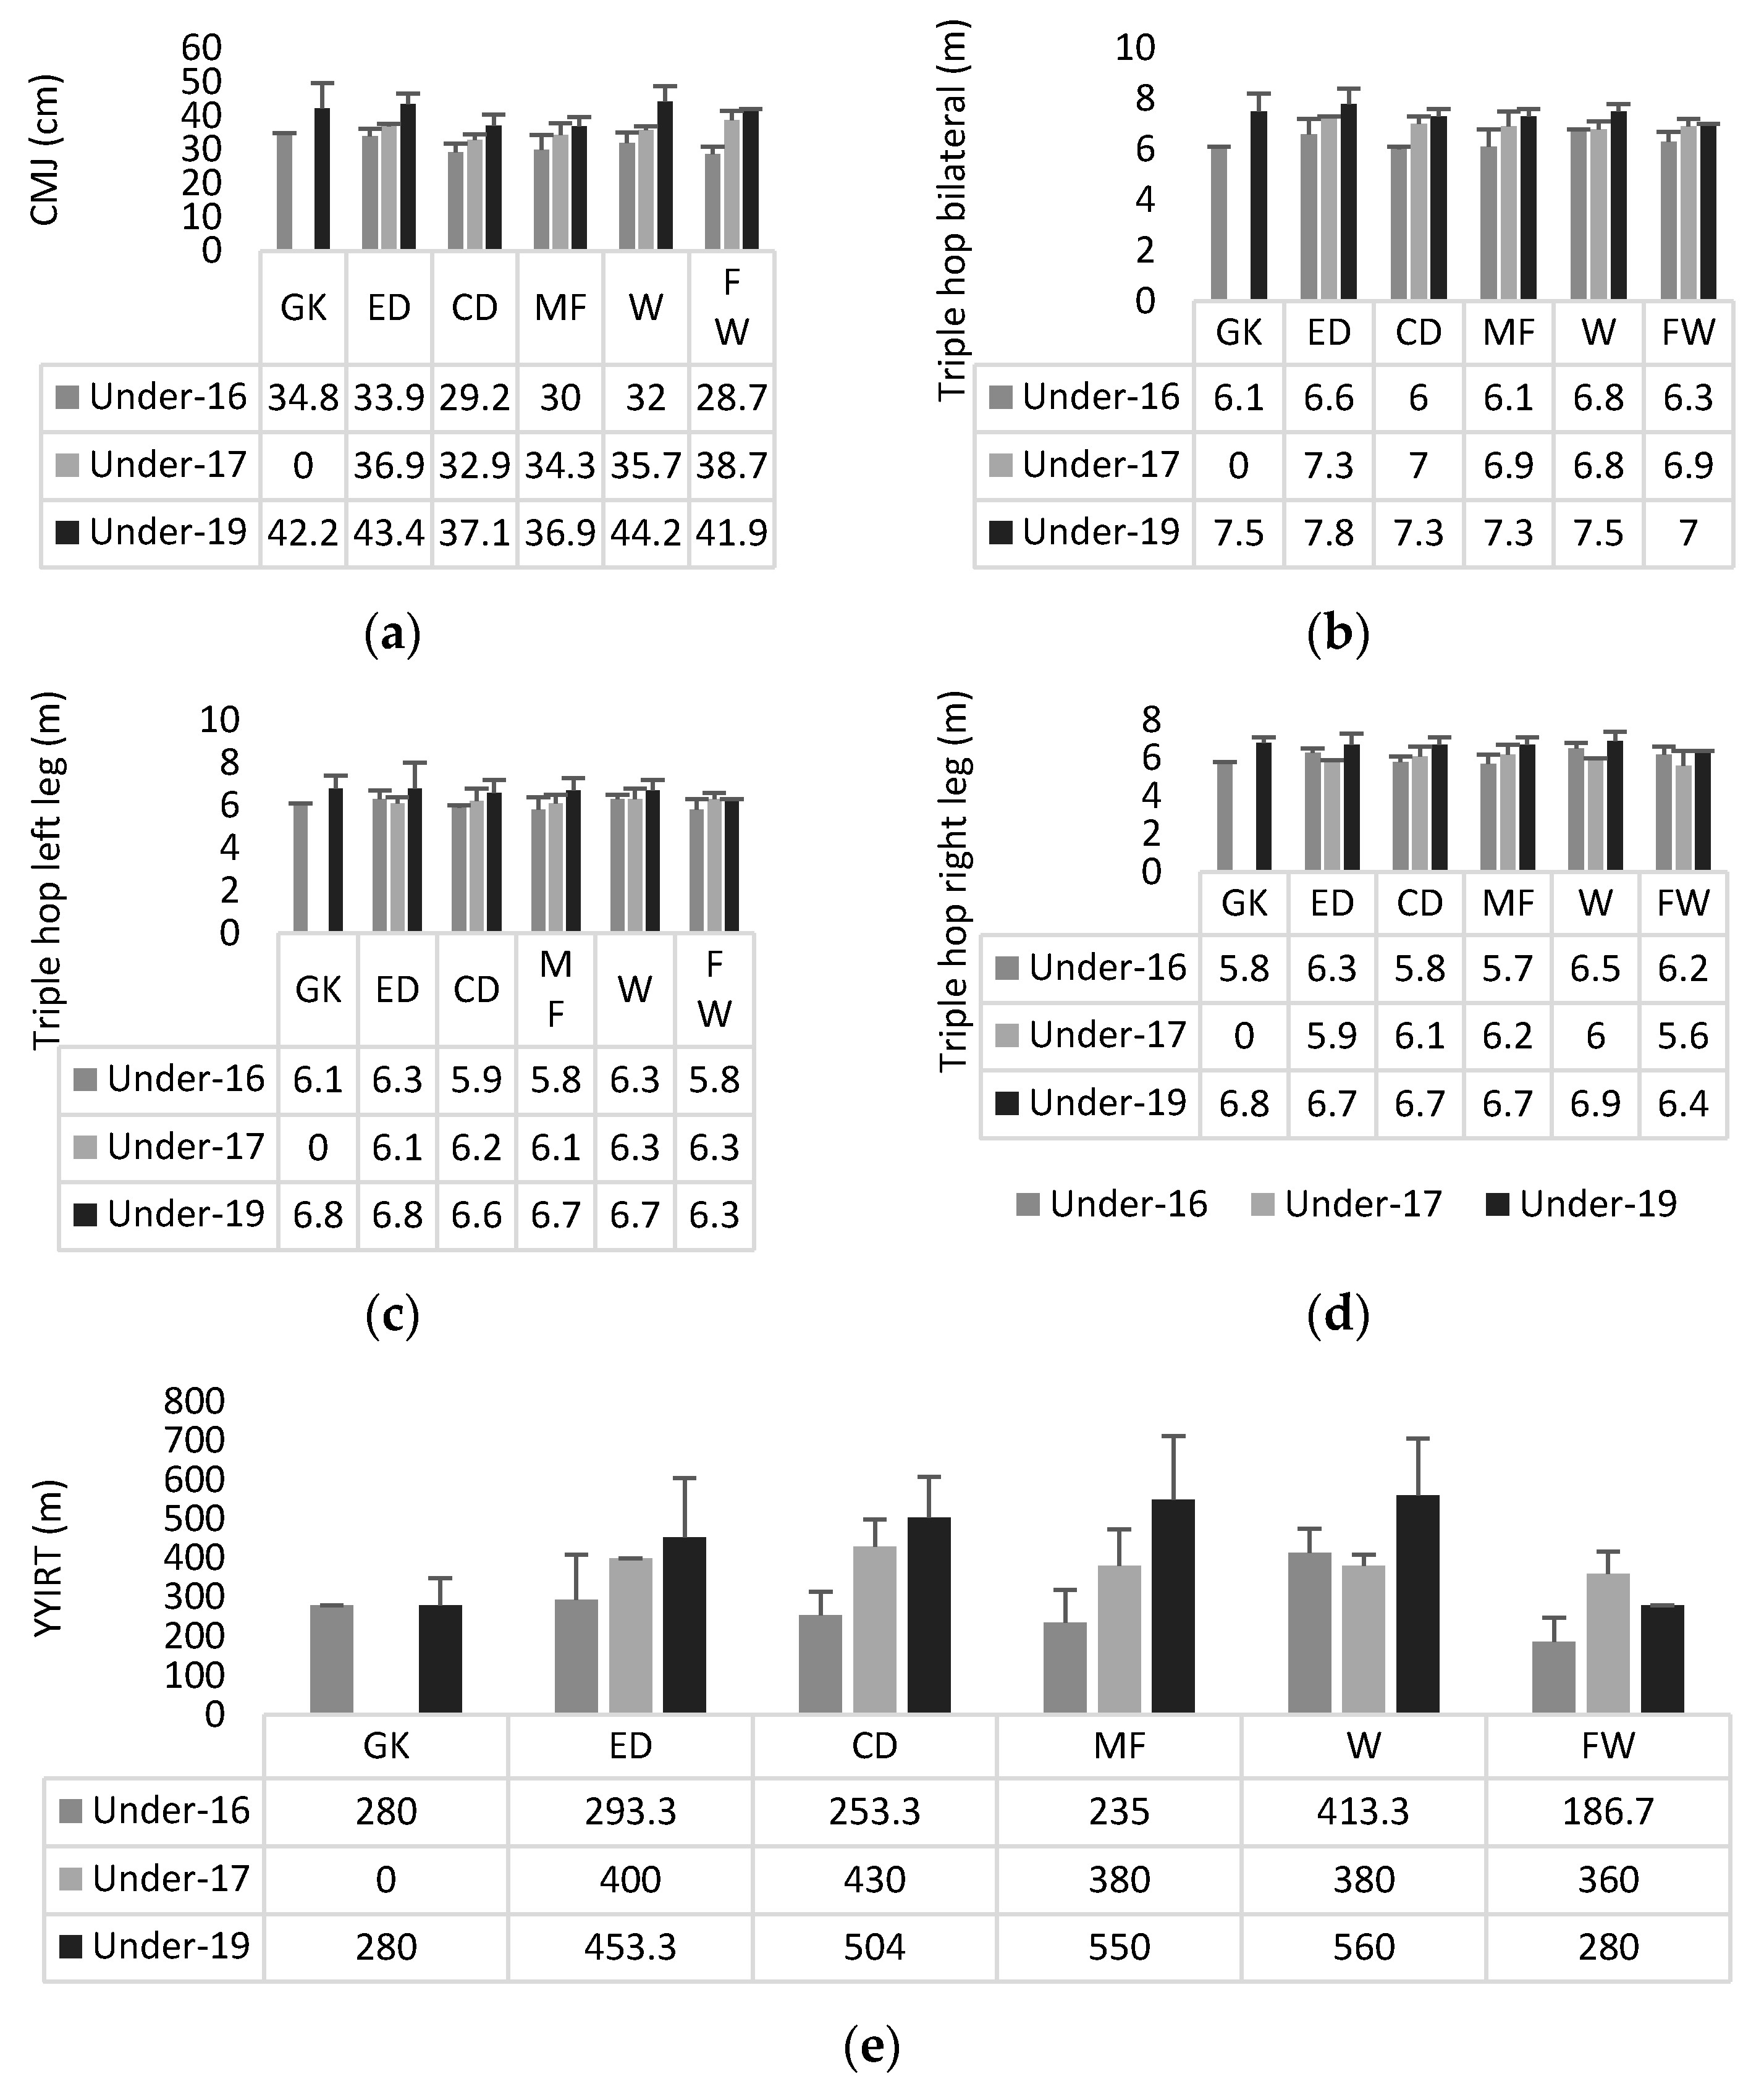
| GK (n = 4) | ED (n = 8) | CD (n = 12) | MF (n = 24) | WG (n = 11) | FW (n = 6) | p | Effect Size | |
|---|---|---|---|---|---|---|---|---|
| Height (cm) | 184.0 ± 8.3 | 175.1 ± 7.3 | 179.3 ± 6.0 | 172.0 ± 6.8 | 172.1 ± 3.9 | 173.3 ± 5.6 | 0.002 ** | 0.266 |
| BM (kg) | 74.7 ± 7.9 | 68.0 ± 5.9 | 73.1 ± 6.9 | 63.3 ± 7.5 | 64.1 ± 6.3 | 66.5 ± 7.0 | 0.001 ** | 0.277 |
| BMI (kg/m2) | 22.0 ± 1.4 | 22.2 ± 2.0 | 22.8 ± 1.5 | 21.3 ± 1.5 | 21.6 ± 1.8 | 22.1 ± 2.0 | 0.277 | 0.099 |
| Skinfolds (mm) | 73.7 ± 12.9 | 80.3 ± 32.0 | 78.8 ± 24.7 | 70.4 ± 16.0 | 61.0 ± 13.5 | 71.8 ± 18.5 | 0.303 | 0.095 |
| Fat mass (%) | 11.3 ± 2.2 | 12.5 ± 3.3 | 14.4 ± 4.3 | 12.2 ± 2.9 | 12.1 ± 2.8 | 12.4 ± 2.3 | 0.413 | 0.080 |
| Muscle mass (kg) | 27.7 ± 1.2 | 28.4 ± 3.3 | 29.0 ± 2.7 | 25.7 ± 3.7 | 27.7 ± 4.0 | 25.9 ± 3.4 | 0.095 | 0.144 |
| CMJ (cm) | 40.4 ± 7.1 | 38.2 ± 4.9 | 33.7 ± 4.1 | 33.7 ± 4.5 | 39.3 ± 6.7 | 34.3 ± 6.4 | 0.014 * | 0.211 |
| TH bilateral (m) | 7.1 ± 0.9 | 7.2 ± 0.7 | 6.9 ± 0.6 | 6.8 ± 0.7 | 7.2 ± 0.4 | 6.6 ± 0.5 | 0.304 | 0.095 |
| TH right leg (m) | 6.6 ± 0.5 | 6.3 ± 0.4 | 6.3 ± 0.5 | 6.2 ± 0.6 | 6.6 ± 0.5 | 6.0 ± 0.5 | 0.250 | 0.104 |
| TH left leg (m) | 6.6 ± 0.6 | 6.4 ± 0.7 | 6.3 ± 0.6 | 6.2 ± 0.6 | 6.5 ± 0.5 | 6.1 ± 0.5 | 0.537 | 0.065 |
| YYIRT (m) | 280.0 ± 56.6 | 380.0 ± 126.5 | 416.7 ± 129.3 | 388.3 ± 173.5 | 487.3 ± 136.0 | 260.0 ± 97.2 | 0.039 * | 0.176 |
| CMJ (cm) | TH Bilateral (m) | TH Right Leg (m) | TH Left Leg (m) | YYIRT (m) | |
|---|---|---|---|---|---|
| BMI (kg/m2) | 0.360 ** (0.128; 0.555) | 0.194 (−0.053; 0.418) | 0.202 (−0.044; 0.425) | 0.190 (−0.056; 0.415) | 0.261 * (0.018; 0.475) |
| Fat mass (%) | −0.315 * (−0.519; −0.077) | –0.323 ** (−0.526; −0.086) | –0.151 (−0.381; 0.096) | −0.260 * (−0.474; −0.018) | −0.240 (−0.457; 0.004) |
| Muscle mass (kg) | 0.573 * (0.382; 0.717) | 0.547 ** (0.350; 0.698) | 0.440 ** (0.220; 0.618) | 0.439 ** (0.219; 0.617) | 0.498 ** (0.289; 0.661) |
Publisher’s Note: MDPI stays neutral with regard to jurisdictional claims in published maps and institutional affiliations. |
© 2022 by the authors. Licensee MDPI, Basel, Switzerland. This article is an open access article distributed under the terms and conditions of the Creative Commons Attribution (CC BY) license (https://creativecommons.org/licenses/by/4.0/).
Share and Cite
Leão, C.; Silva, A.F.; Badicu, G.; Clemente, F.M.; Carvutto, R.; Greco, G.; Cataldi, S.; Fischetti, F. Body Composition Interactions with Physical Fitness: A Cross-Sectional Study in Youth Soccer Players. Int. J. Environ. Res. Public Health 2022, 19, 3598. https://doi.org/10.3390/ijerph19063598
Leão C, Silva AF, Badicu G, Clemente FM, Carvutto R, Greco G, Cataldi S, Fischetti F. Body Composition Interactions with Physical Fitness: A Cross-Sectional Study in Youth Soccer Players. International Journal of Environmental Research and Public Health. 2022; 19(6):3598. https://doi.org/10.3390/ijerph19063598
Chicago/Turabian StyleLeão, César, Ana Filipa Silva, Georgian Badicu, Filipe Manuel Clemente, Roberto Carvutto, Gianpiero Greco, Stefania Cataldi, and Francesco Fischetti. 2022. "Body Composition Interactions with Physical Fitness: A Cross-Sectional Study in Youth Soccer Players" International Journal of Environmental Research and Public Health 19, no. 6: 3598. https://doi.org/10.3390/ijerph19063598
APA StyleLeão, C., Silva, A. F., Badicu, G., Clemente, F. M., Carvutto, R., Greco, G., Cataldi, S., & Fischetti, F. (2022). Body Composition Interactions with Physical Fitness: A Cross-Sectional Study in Youth Soccer Players. International Journal of Environmental Research and Public Health, 19(6), 3598. https://doi.org/10.3390/ijerph19063598